Article

Accounting for Uncertainties of the TRMM Satellite Estimates

by
Amir AghaKouchak
*,
Nasrin Nasrollahi
and
Emad Habib
Department of Civil Engineering, University of Louisiana at Lafayette, PO Box 42291, Lafayette, LA 70504, USA
*
Author to whom correspondence should be addressed.
Remote Sens. 2009, 1(3), 606-619; https://doi.org/10.3390/rs1030606
Submission received: 12 August 2009 / Revised: 8 September 2009 / Accepted: 8 September 2009 / Published: 11 September 2009

Abstract

:
Recent advances in the field of remote sensing have led to an increase in available rainfall data on a regional and global scale. Several NASA sponsored satellite missions provide valuable precipitation data. However, the advantages of the data are limited by complications related to the indirect nature of satellite estimates. This study intends to develop a stochastic model for uncertainty analysis of satellite rainfall fields through simulating error fields and imposing them over satellite estimates. In order to examine reliability and performance of the presented model, ensembles of satellite estimates are simulated for a large area across the North and South Carolina. The generated ensembles are then compared with original satellite estimates with respect to statistical properties and spatial dependencies. The results show that the model can be used to describe the uncertainties associated to TRMM multi-satellite precipitation estimates. The presented model is validated using random sub-samples of the observations based on the bootstrap technique. The results indicate that the model performs reasonably well with different numbers of available rain gauges.

Graphical Abstract

1. Introduction

Recent climate studies have highlighted the importance of water resources engineering and management with respect to future global decision making and risk analysis [1,2,3]. Predicting the available water resources for human consumption, agriculture and industry and quantifying the associated uncertainties are of particular interest. The water content in the atmosphere is in continuous interaction with the land surface through precipitation, evaporation from surface waters and transpiration from plants. Precipitation may also result in surface runoff, infiltration into the subsurface and groundwater recharge. A reasonable estimation of surface runoff is fundamental to water resources planning, development and management. This cannot be achieved without reliable estimates of precipitation which plays a central role in hydrologic processes. Rain gauges are the main source of ground-based precipitation measurements. However, their applicability is limited by their lack of spatial coverage. It is well known that for a variety of hydrologic applications, detailed information on surface precipitation at fine spatial and temporal scales is essential (e.g., land-surface modeling, validation of numerical weather prediction model) [4,5,6,7,8,9,10,11,12].
Recent advances in the field of remote sensing have led to an increase in available rainfall data on a regional scale [13,14,15,16,17,18]. Particularly, NASA sponsored satellite missions such as the Tropical Rainfall Measuring Mission (TRMM) and the Earth Observing System (EOS) Aqua satellite provide the hydrologic community with amplitude of new precipitation data. These data have several advantages over the rain gauge measurements such as regional uninterrupted coverage and higher spatial resolution. However, satellite estimates are subject to significant uncertainties due to the indirect nature of satellite measurements [19,20,21,22,23,24]. The associated uncertainties arise from various factors such as estimation through cloud top reflectance, thermal radiance, retrieval algorithm and infrequent satellite overpasses [25,26,27]. The contribution of each error source in the overall uncertainty depends on the retrieval algorithm and the spatio-temporal scale. For low resolution satellite estimates, for example, infrequent satellite overpasses may dominate the uncertainty. On the other hand, for high resolution estimates the retrieval algorithm may significantly dominate the contributions of satellite error sources [28,29]. Quantification of precipitation estimation error is essential as it propagates in hydrologic processes, resulting in significant error in hydrologic predictions [5,19,30,31,32,33,34]. Due to the potential significance of satellite data in hydrologic applications, efforts are required to assess the uncertainty of these data.
A great deal of effort has been put to evaluate the accuracy of satellite-based rainfall estimates, particularly TRMM products [18,35,36,37]. Stochastic simulation techniques can be used to assess the uncertainty of the satellite precipitation estimates. In an effort to quantify satellite precipitation estimation error, [19] proposed a model in which satellite precipitation error is described as a nonlinear function of rainfall space-time integration scale, rain intensity, and sampling frequency. Using Monte Carlo simulations, they generated an ensemble of rainfall estimates to evaluate the influence of satellite error propagation into hydrological modeling. [36] introduced a probabilistic approach to describe the uncertainty of the passive microwave- and infrared-based satellite rainfall data for hydrologic applications. [22] developed a methodology to represent the uncertainty in satellite rainfall retrievals based on the covariance structure of the rainfall field and the conditional distribution functions of precipitation on pixel scale. In addition to satellite precipitation error, a great deal of effort has been made in describing estimation error of radar rainfall data [38,39,40,41,42,43,44,45,46,47,47].
The Tropical Rainfall Measuring Mission (TRMM) is established to estimate tropical precipitation form space sensors using a suite of rain retrieval algorithms. The observatory system consists of a precipitation radar, a multi-frequency microwave radiometer and a visible infrared radiometer. The multi-frequency microwave radiometer, provides information such as precipitation content, precipitation intensity and areal distribution. This multi-frequency model operates on 5 different frequencies (10.65, 19.35, 22.235, 37.0 and 85.5 GHz) with a horizontal resolution of 5 km (85.5 GHz) to 45 km (10.65 GHz). The Visible Infrared Scanner (VIRS) provides high resolution information on cloud type, coverage and cloud top temperatures using a 5 channel radiometer (0.63, 1.6, 3.75, 10.80, and 12.0 microns). The VIRS estimates rainfall from cloud top temperatures at a horizontal resolution of 2.1 km (nadir).
The TRMM multi-satellite precipitation data [48] are based on an algorithm that merges microwave and infrared satellite observations [13,15,17]. The microwave estimates are more accurate than the infrared estimates. On the other hand, the infrared satellite sampling is more frequent than the microwave sampling. When producing the gridded TRMM data, microwave estimates are given priority due to their accuracy. The gaps of the microwave estimates are then filled with the infrared data [48].
The TRMM multi-satellite precipitation products (version 3B42 used in this study) are available with a spatial resolution of 0.25 × 0.25 and a temporal resolution of 3 hours within 50 north and 50 south global latitude. In this paper an ensemble generator is presented for simulation of the TRMM precipitation error. The simulated satellite error estimates are then imposed over original estimates in order to obtain an ensemble of satellite-based precipitation estimates. An ensemble of precipitation estimates consists of a large number of equally probable realizations, each of which representing a possible rainfall event. In the presented model, the uncertainty is described using two uncertainty parameters. The model parameters are estimated based on observed satellite precipitation error which is defined as the differences between reference surface rainfall data (e.g., gauge and radar measurements) and TRMM estimates. The model can be integrated for localized applications from both spatial and temporal viewpoints. The presented ensemble generator, is rather simple to implement and it can be applied for practical hydrologic-driven applications. It is noted that this model is designed to capture random error sources and not physical biases and vagueness of remotely sensed estimates. The model is implemented for a large area across the North and South Carolina in order to evaluate the model performance and applicability.
This paper is organized into five sections. After a brief introduction, the study area and data resources are discussed. The third section is devoted to model description and parameter estimation. In the fourth section, a case study is performed to demonstrate the model performance from different viewpoints. The last section summarizes the approach and concludes.

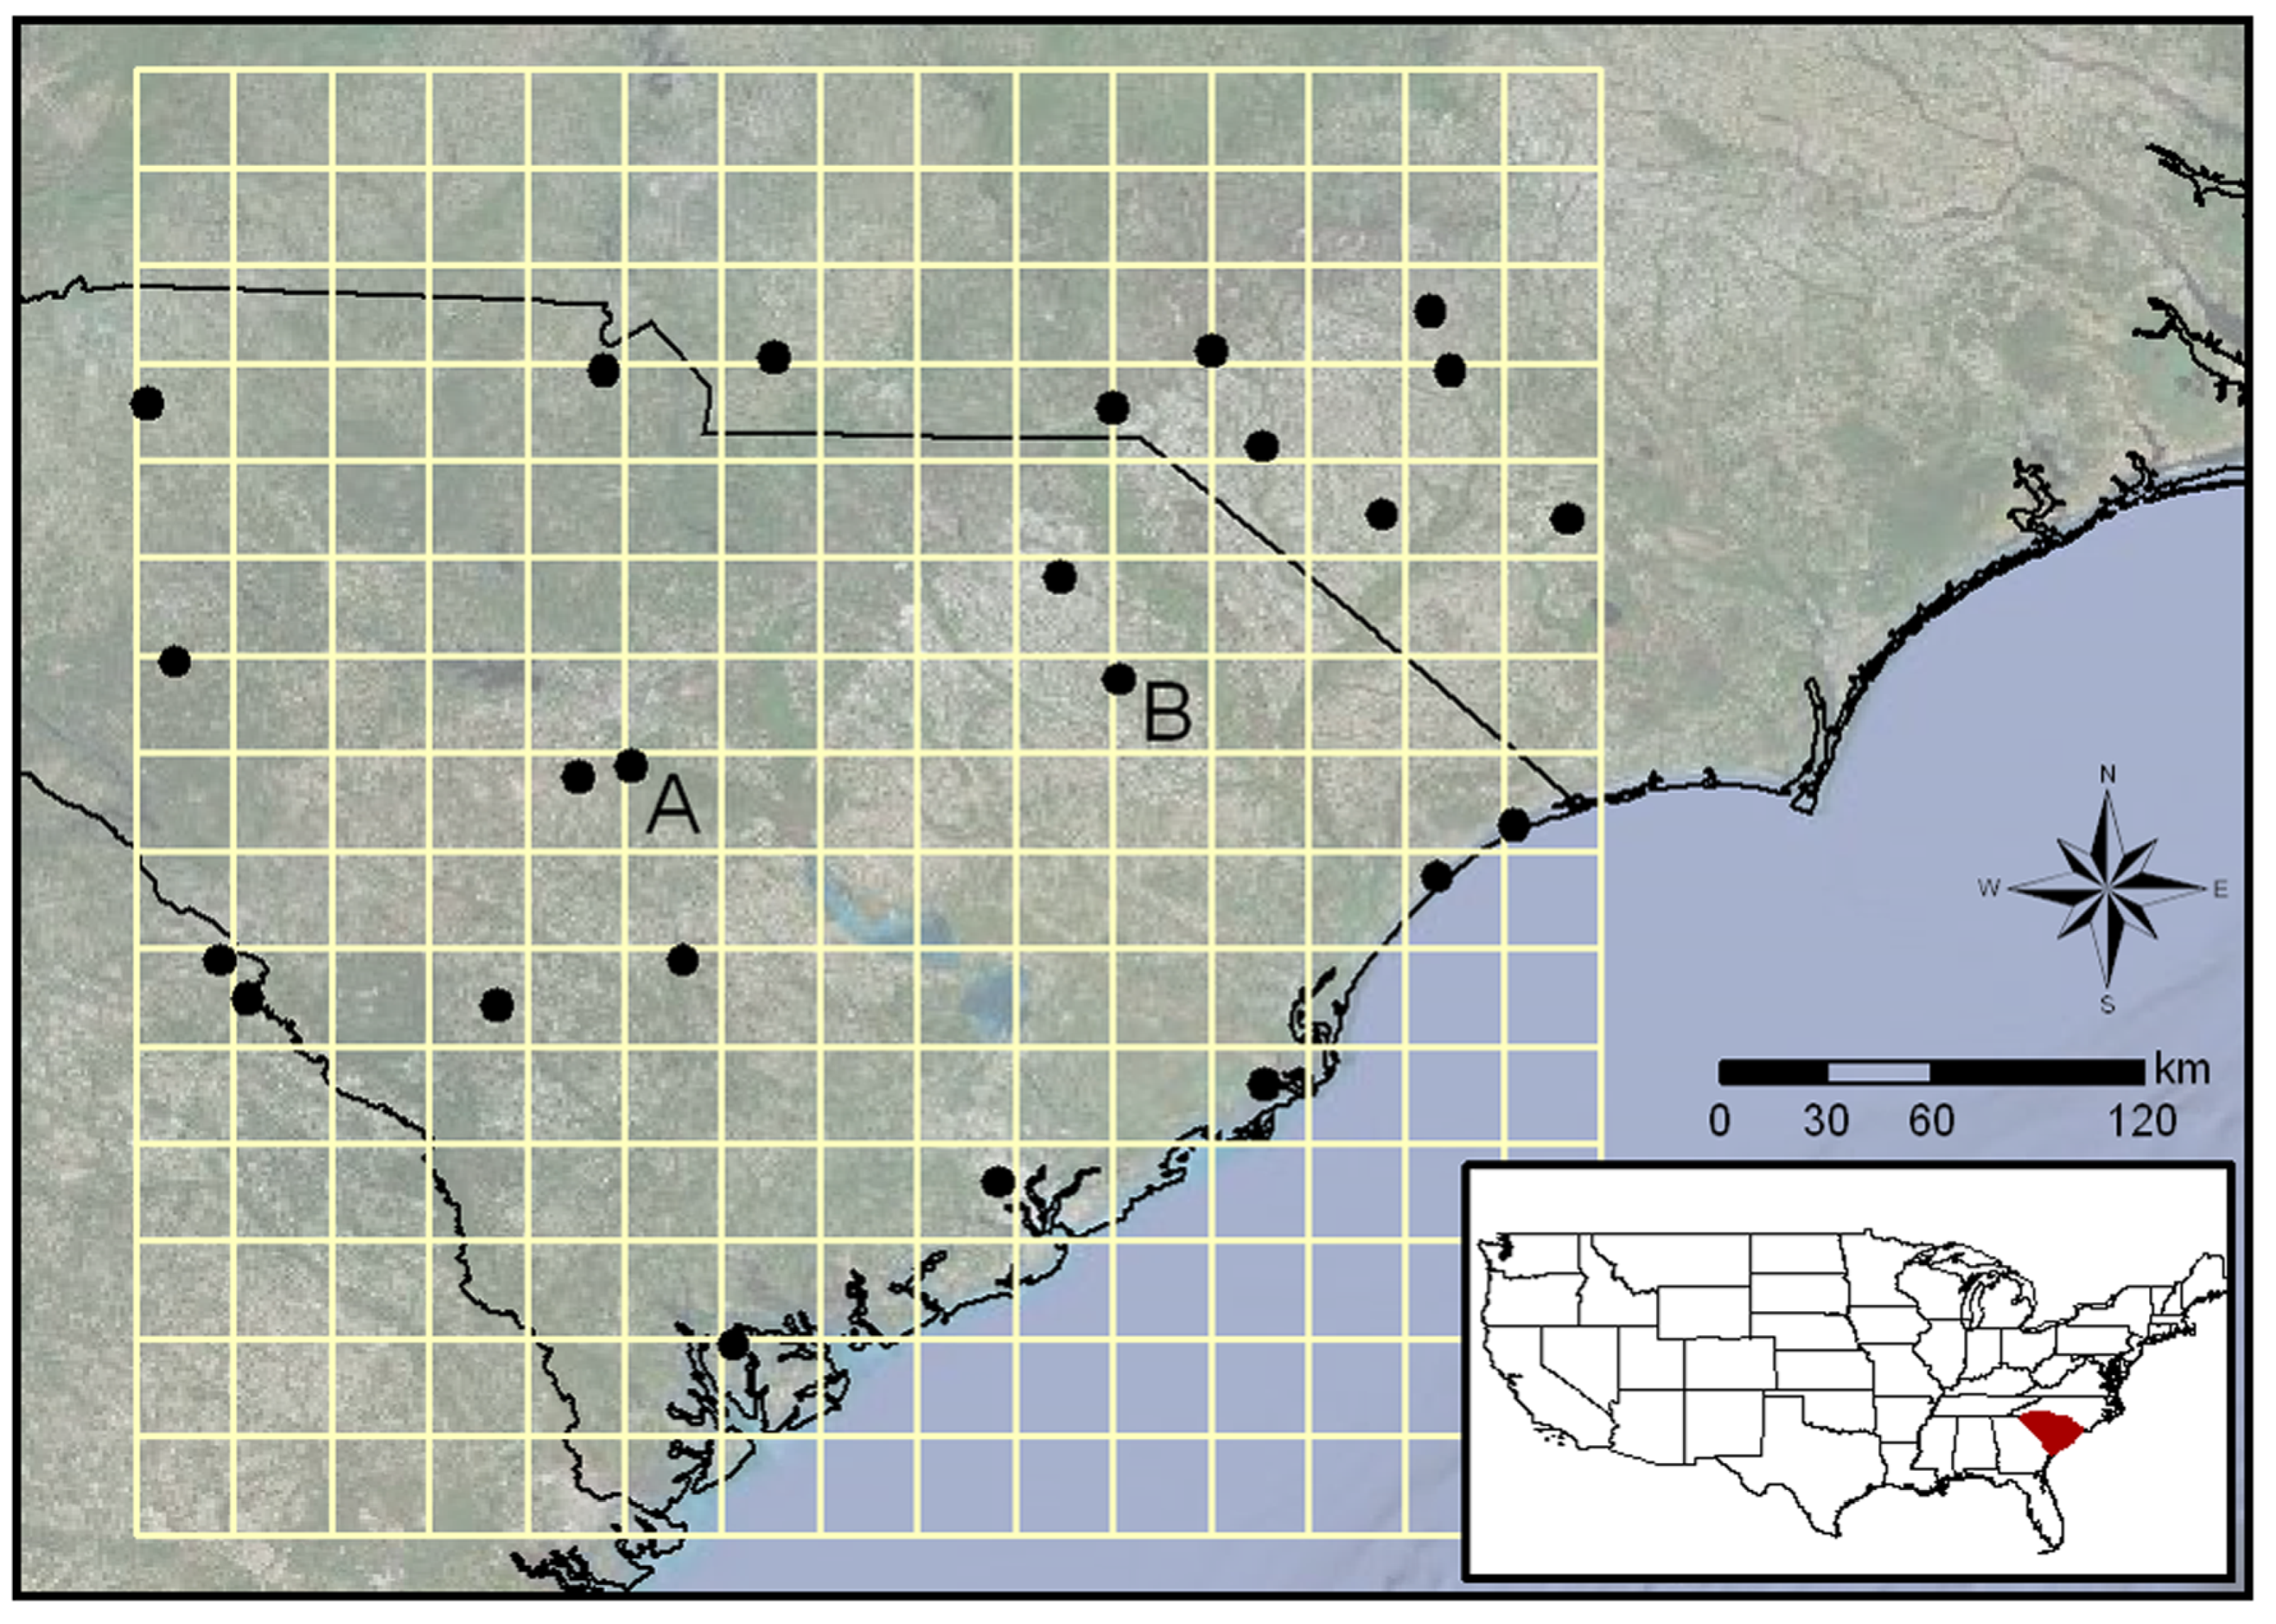
2. Study Area and Data Resources

The study area stretches between latitudes 32.00 N–35.75 N and longitudes 78.50 W–82.25 W, covering an area of approximately 120,000 km 2 . The study area has a humid sub-tropical climate with a mean annual rainfall of approximately 1,500 mm. During the summer and fall months, tropical cyclones contribute to the precipitation, whereas during the winter and spring months, the extra-tropical cyclones are dominant. Snowfall in the area is not extensive, ranging from 25 mm to 50 mm on average annually. The mean annual temperature ranges from 13 C to 21 C across the selected area. The topographic elevation varies from 300 m in the northwest to 0 on the coast.
The TRMM multi-satellite precipitation data (version 3B42) are obtained from the National Aeronautics and Space Administration (NASA) for the period of January 1 to December 31, 2005. In order to estimate the TRMM precipitation error, the hourly and daily rainfall data from 24 National Climatic Data Center (NCDC) rain gauges (listed in Table 1) are collected. The hourly rainfall accumulations are aggregated to 3-hour intervals in order to synchronize the rain gauge measurements with satellite estimates. The reference surface rainfall data are then used to obtain estimates of the TRMM rainfall error across the study area. The differences between the reference surface rainfall data and the radar estimates are considered and termed as observed error. Figure 1 shows the study area and the position of rain gauges (marked with circle symbols) and satellite pixels (0.25 × 0.25 grids). Notice that the analyses are performed on 3-hour and daily temporal scales.
Table 1. Selected rain gauge stations.
Station NameLatitudeLongitudeElevation
Elizabethtown34.6-78.58340
Rockingham Airport34.883-79.75109
Charlestown Muni32.899-80.04114.6
Bush Field33.37-81.96545.1
Daniel Fld33.467-82.033128
Mackall Aaf35.033-79.5115
Fayetteville34.983-78.88358
Columbia Metro33.942-81.11868.6
Columbia Owens33.967-80.98359
Lumberton34.61-79.05938.4
Maxton34.783-79.36767
Orangeburg33.467-80.8560
Darlington34.45-79.88359
York Coun34.983-81.05204
Greenville34.899-82.219296
Greenwood Airport34.233-82.15192
Monroe Airport35.017-80.617207
Simmons35.133-78.93374
Myrtle Beach33.68-78.9187.6
North myrtle beach33.816-78.72110.1
McClellanville33.153-79.3642.7
Blackville33.355-81.32896.6
Beaufort32.483-80.71711.6
Florence34.188-79.73146
Figure 1. Study area, TRMM satellite pixels and the location of rain gauges.
Remotesensing 01 00606 g001

3. Model Description

As mentioned earlier, in this model, two error terms are used to describe the uncertainty associated to the TRMM estimates. Previous studies indicated that the satellite and radar error may be proportional to the magnitude of the rain rate [19,40,49]. This characteristics of satellite error is accounted for using a multiplicative error component ( ϵ 1 in Equation 1). Another error term ( ϵ 2 ) is also introduced to capture purely random uncertainty associated to the TRMM estimates:
P s i m = P s a t + P s a t × ϵ 1 + ϵ 2
skipwhere : P s i m =simulated field (rain rate)
P s a t =satellite estimates
ϵ 1 =multiplicative error term
ϵ 2 =random error term
The term, P s a t × ϵ 1 + ϵ 2 (hereafter referred to as the total error) is the additive error used to perturb radar estimates. In Equation 1, the term P s a t × ϵ 1 , represents the error component that is proportional to the magnitude of satellite rain rate, whereas ϵ 2 accounts for random error sources. Following the findings of [40] and [39], the overall bias in satellite estimates is removed as a preliminary step before parameter estimation:
β 1 = Σ i = 1 n P o b s , i Σ i = 1 n P s a t , i *
where : P o b s =observed rainfall (here, gauge measurements)
P s a t * =satellite estimates before bias removal
n=number of time steps
β 1 =overall bias
The overall bias is then removed as:
P s a t = P s a t * × β 1
(Throughout this paper, the term P s a t denotes satellite estimates after correcting for the overall bias.)
Having removed the overall bias with respect to the observations, the satellite estimates error can be assumed to be random [40]. For the bias-corrected uncertainty, the terms ϵ 1 and ϵ 1 can be described with the standard deviations σ 1 and σ 2 as the measures of the uncertainty. The uncertainty parameters ( σ 1 and σ 2 ) are then to be estimated based on the available observations:
P o b s - P s a t = P s a t × f ( σ 1 ) + f ( σ 2 )
where: P o b s = observed rainfall (here, gauge measurements)
      f = error function
In Equation 4, P o b s represents ground reference precipitation measurements which are typically obtained from rain gauge observations. Notice that in this formulation, the standard deviation of the total error ( σ t ) can be expressed as:
σ t = σ P o b s · σ 1 2 + σ 2 2
where: σ P o b s = standard deviation of the P o b s
In this model, based on the available pairs of satellite estimates and rain gauge measurements, the model parameters ( σ 1 and σ 2 ) are estimated using the maximum likelihood method. The log likelihood function (Equation 6) can be derived by substituting the probability density function of the normal distribution into Equation 1:
L = - n 2 ln σ P o b s 2 × σ 1 2 + σ 2 2 - 1 2 i = 1 n P o b s - P s a t 2 σ P o b s 2 × σ 1 2 + σ 2 2
where : L = log-likelihood function
The parameters σ 1 and σ 2 are to be determined such that the log-likelihood function is maximized and the overall bias is kept within a minimal allowed bias value (e.g., ± 2 % ).

4. Results and Discussion

In the following, an ensemble of TRMM estimates are generated for the period of January 1 to December 31, 2005. In order to simulate the error fields, the model parameters are to be estimated first. Based on the pairs of the rain gauge measurements and satellite estimates, the parameters ( σ 1 and σ 2 ) are estimated for both 3-hour and daily scales as: (3-hr) σ 1 = 0.26 and σ 2 = 1.17; (daily) σ 1 = 0.20 and σ 2 = 0 . 93 . Having estimated the parameters, multiple equiprobable error fields are simulated using the Monte Carlo method. Figure 2(a)–(h) presents examples of observed [Figure 2(a): 3-hour; Figure 2(e): daily] and simulated [Figure 2(b)–(d): 3-hour; Figure 2(f)–(h): daily] TRMM precipitation fields.
Figure 2. Observed [(a): 3-hr; (e): daily] and simulated ((b) to (d): 3-hr; (f) to (h): daily) TRMM precipitation fields (SIM: simulated).
Remotesensing 01 00606 g002
For 3-hour TRMM satellite data, Figure 3(a),(b) plots ensembles (250 realizations) of precipitation estimates over two satellite pixels marked with A and B in Figure 1. Figure 3(c),(d) shows ensembles of daily estimates over the same satellite pixels. The solid lines show bias-free satellite estimates, whereas the gray lines represent the simulated realizations. In the figures, the rain gauge measurements are shown with dashed lines. As shown the estimated uncertainty encompass the rain gauge measurements except at few time steps.
In order to validate the model, multiple rainfall ensembles are generated with different numbers of gauges to investigate if the estimated uncertainty enclose rain gauge measurements when less numbers of gauges are available. A simple bootstrap approach is employed to investigate this issue. First, using the bootstrap technique 100 randomly selected sub-samples of 5, 10, 15, and 20 rain gauges are selected. Based on each random sub-sample, the parameters are estimated and an ensemble of precipitation estimates is simulated. Then, the mean number of time steps ( n o ) where the rain gauge measurements fall outside the simulated ensembles is counted and normalized with respect to the length of the data, in order to evaluate the model performance numerically. Table 2 gives the mean number of time steps ( n o in percentage) that the estimated uncertainty did not enclose the rain gauge measurements. Notice that each value is the mean of 100 randomly selected sub-samples from the original dataset. As shown, by reducing the number of rain gauges, the n o values increase for both 3-hour and daily estimates. The table indicates that the n o values for daily estimates are less than 3-hour data. This may be due to a better agreement between daily satellite estimates and daily gauge measurements.
Figure 3. Ensembles of simulated satellite precipitation data over the A-marked [(a) and (c)] and B-marked [(b) and (d)] pixels.
Remotesensing 01 00606 g003
Table 2. The number of time steps, n o (%), that the estimated uncertainty did not enclose the rain gauge measurements.
20 Gauges 15 Gauges 10 Gauges 5 Gauges
Data3-hrdaily 3-hrdaily 3-hrdaily 3-hrdaily
TRMM (1/1/05-12/31/05)2.72.5 2.92.8 4.23.1 6.45.2
Due to the unavailability of true representation of satellite estimates error in space and time, no predefined spatial dependence structure is assumed for the error terms. The simulated fields, however, will be spatially dependent due to dominance of the underlying spatial dependence structure of satellite estimates. It is worth remembering that in this model, the satellite estimates are perturbed with error fields and thus the dependence structure of satellite estimates will be carried forward to the simulated fields. To illustrate this issue, the Spearman rank correlation matrix is employed to assess the dependence structure of the simulated precipitation fields. Unlike the Pearson correlation, the Spearman rank correlation describes the dependencies in terms of ranks and independent of the marginals [50,51]. Figure 4(a)–(d) displays the Spearman correlation matrices of observed (Figure 4(a): 3-hour; Figure 4(c): daily) and simulated (Figure 4(b): 3-hour; Figure 4(d): daily) TRMM precipitation fields (15 pixels are shown for better visualization). The figures show 15 × 15 matrices that describe the rank correlation between pairs of TRMM precipitation pixels. One can see that the rank correlation matrices of the simulated fields are not considerably different than those of the original satellite estimates. That is, by perturbing satellite estimates with random error fields the underlying dependencies will not be destroyed.
Figure 4. Spearman correlation matrices of observed ((a): 3-hr; (c): daily) and simulated ((b): 3-hr; (d): daily) TRMM precipitation fields.
Remotesensing 01 00606 g004
Figure 5. Empirical cumulative distribution functions for (a): 3-hour satellite estimates over the A-marked pixel; (b): 3-hour satellite estimates over the B-marked pixel; (c): daily satellite estimates over the A-marked pixel; (b) daily satellite estimates over the B-marked pixel.
Remotesensing 01 00606 g005
The presented model is also evaluated with respect to the distribution function of the observed and simulated TRMM estimates. Figure 5(a),(b) shows the empirical cumulative distribution functions (CDF) of the gauge measurements, observed 3-hour TRMM estimates (solid black lines) and simulated 3-hour TRMM realizations ((a): A-marked pixel; (b): B-marked pixel). The dashed lines represent the CDF of the gauge measurements, whereas the black and gray lines are CDFs of the observed and simulated TRMM precipitation data. Figure 5(c),(d) presents the CDFs of the daily gauge measurements and observed and simulated daily TRMM data ((c): A-marked pixel; (d): B-marked pixel). As shown, the CDFs of ground reference measurements (dashed lines) are within the CDFs of the simulated realizations (gray lines).

5. Summary and Conclusions

Remotely sensed precipitation estimates, particularly satellite data provide high resolution information that have the potential to improve hydrologic predictions and global climate studies. However, satellite estimates are subject to significant uncertainties from various sources. The uncertainties remain even after calibration of satellite estimates with ground references measurements. These uncertainties are to be quantified and characterized before using satellite estimates in hydrologic applications.
This study presents an uncertainty model for the NASA TRMM multi-satellite precipitation data (version 3B42). The model generates an ensemble of satellite precipitation fields through perturbing observed satellite estimates with simulated random error fields. The simulated ensembles of precipitation fields can be used for assessing the impact of satellite estimates uncertainties in hydrologic predictions (e.g., rainfall-runoff modeling). In the introduced model, the satellite uncertainties are described using two error terms. The first term is a multiplicative component that accounts for the proportionality of the satellite estimates error to the magnitude of rain rate, while the second term describes purely random uncertainties. It is noted that excluding the first error term ( ϵ 1 ) may result in large error values for insignificant rain rates (randomly large or small rain rate regardless of the magnitude of the rain rate).
To demonstrate the model performance, TRMM precipitation estimates (version 3B42) with two temporal resolutions (3-hour and daily) are used as the input of the model to simulate ensembles of precipitation estimates. The model parameters are estimated using the maximum likelihood technique based on a network of rain gauge measurements. It is worth remarking that an individual gauge in a satellite pixel is used to determine the satellite estimates error over a pixel size, which may not be accurate. Rain gauges (ground reference measurements) are also subject to uncertainties particularly due to lack of aerial representation. In fact a large number of rain gauges are required to obtain measurements with aerial representativeness. However, based on the available gauges and the resolution of TRMM data, this is the best possible approximation of the precipitation error. Having estimated the model parameters, multiple equiprobable error fields were simulated and imposed over satellite estimates to obtain ensembles of precipitation fields. The results indicated that the simulated precipitation realizations were similar to those of TRMM estimates in terms of statistical properties, dependence structure and probability distribution function.
The model is validated using a bootstrap scheme to sample the observations (100 randomly selected sub-samples of 5, 10, 15, and 20 rain gauges). For each random sub-sample, the parameters are estimated and an ensemble of precipitation estimates is simulated. The results revealed that even with few rain gauges, the estimated uncertainty, obtained from the presented model, encompass approximately 92% of the ground reference measurements (see Table 2). Furthermore, the results showed that even after imposing error fields over satellite estimates, the underlying spatial dependence structure remained dominant. That is, the simulated rainfall fields will be correlated similar to the observed precipitation estimates. The model was also tested by plotting the empirical cumulative distribution functions of the gauge measurements, satellite estimates and simulated realizations. The results showed that the CDFs of the simulated realizations enclose the CDFs of the ground reference measurements in both 3-hour and daily temporal scales. However, this may not be generalized as significant deviation of satellite estimates from ground reference measurements may exist.
Stochastically simulated rainfall ensembles have various applications in hydrological and meteorological applications. For example, using ensemble analysis one can evaluate flood prediction uncertainty and its associated risks for a given precipitation using an ensemble of precipitation estimates, instead of a single realization. Furthermore, climate change studies may also require simulated precipitation fields as possible future precipitation estimates in order to investigate long term changes in the hydrologic cycle of a specific region. The aim of this study was to present a simple, yet practical model that can be applied with minimum computational costs, considering the fact that the assumptions behind the model may result in imperfect ensembles in some cases. There are a number of issues regarding the characteristics of satellite error that are not fully understood and require further investigations (e.g., spatial and temporal dependencies of satellite error estimates in different temporal and spatial scales). A better understanding of the satellite error characteristics may lead to further improvements in the presented model. It is expected that the developed model and the results of this research can be used to assess the uncertainties associated with satellite precipitation estimates, as it is believed that with accurate information about surface rainfall and its associated uncertainties, hydrologists and meteorologists have the potential to improve hydrologic predictions and global climate studies.

Acknowledgements

Appreciation is expressed to the Associate Editor and anonymous reviewers for their thoughtful and constructive comments. The authors would like to acknowledge the following sources of support: the Louisiana Board of Regents Support Fund under contract number NASA/LEQSF (2005-2010)-LaSPACE and NASA grant number NNG05GH22H and the Research Competitiveness Subprogram of the Louisiana Board of Regents Support Fund. The authors are also grateful to William Roth and Jeff Tuhtan for their editorial efforts on an early draft of this paper.

References

  1. IPCC. Climate Change 2007: Impacts, Adaptation, and Vulnerability; Exit EPA Disclaimer Contribution of Working Group II to the Third Assessment Report of the Intergovernmental Panel on Climate Change; Parry, M.L., Canziani, O.F., Palutikof, J.P., van der Linden, J., Hanson, C.E., Eds.; Cambridge University Press: Cambridge, UK, 2007. [Google Scholar]
  2. Ruddiman, W. Plows, Plagues and Petroleum: How Humans Took Control of Climate; Princeton University Press: Princeton, NJ, USA, 2005. [Google Scholar]
  3. Miller, C.; Edwards, P. Changing the Atmosphere: Expert Knowledge and Environmental Governance; MIT Press: Cambridge, MA, USA, 2001. [Google Scholar]
  4. Shah, S.; O’Connell, P.; Hosking, J. Modeling the effects of spatial variability in rainfall on catchment response. 2. Experiments with distributed and lumped models. J. Hydrol. 1996, 175, 89–111. [Google Scholar] [CrossRef]
  5. Goodrich, D.; Faures, J.; Woolhiser, D.; Lane, L.; Sorooshian, S. Measurement and analysis of small-scale convective storm rainfall variability. J. Hydrol. 1995, 173, 283–308. [Google Scholar] [CrossRef]
  6. Faures, J.M.; Goodrich, D.; Woolhiser, D.; Sorooshian, S. Impact of small-scale spatial rainfall variability on runoff modeling. J. Hydrol. 1995, 173, 309–326. [Google Scholar] [CrossRef]
  7. Obled, C.; Wendling, J.; Beven, K. The sensitivity of hydrological models to spatial rainfall patterns: an evaluation using observed data. J. Hydrol. 1994, 159, 305–333. [Google Scholar] [CrossRef]
  8. Seliga, T.; Aron, G.; Aydin, K.; White, E. Simulation using radar rainfall rates and a unit hydrograph model (SYN-HYD) applied to GREVE watershed. In Am. Meteor. Soc., 25th Int. Conf. on Radar Hydrology, Paris, France, 1992; pp. 587–590.
  9. Corradini, C.; Singh, V. Effect of spatial variability of effective rainfall on direct runoff by geomorphoIogic approach. J. Hydrol. 1985, 81, 27–43. [Google Scholar] [CrossRef]
  10. Hamlin, M. The significance of rainfall in the study of hydrological processes at basin scale. J. Hydrol. 1983, 65, 73–94. [Google Scholar] [CrossRef]
  11. Troutman, B.M. Runoff prediction errors and bias in parameter estimation induced by spatial variability of precipitation. Water Resour. Res. 1983, 19, 791–810. [Google Scholar] [CrossRef]
  12. Dawdy, D.; Bergman, J. Effect of rainfall variability on strearnflow simulation. Water Resour. Res. 1969, 5, 958–966. [Google Scholar] [CrossRef]
  13. Sorooshian, S.; Hsu, K.; Gao, X.; Gupta, H.; Imam, B.; Braithwaite, D. Evolution of the PERSIANN system satellite-based estimates of tropical rainfall. Bull. Am. Meteorol. Soc. 2000, 81, 2035–2046. [Google Scholar] [CrossRef]
  14. Ba, M.; Gruber, A. GOES multispectral rainfall algorithm (GMSRA). J. Appl. Meteorol. 2001, 29, 1120–1135. [Google Scholar] [CrossRef]
  15. Huffman, G.; Adler, R.; Morrissey, M.; Bolvin, D.; Curtis, S.; R. Joyce, B.M.; Susskind, J. Global precipitation at one-degree daily resolution from multisatellite observations. J. Hydrometeorol. 2001, 2, 36–50. [Google Scholar] [CrossRef]
  16. Adler, B.; Huffman, G.; Chang, A.; Ferraro, R.; Xie, P.; Janowiak, J.; Rudolf, B.; Schneider, U.; Curtis, S.; Bolvin, D.; Gruber, A.; Susskind, J.; Arkin, P. The version-2 Global Precipitation Climatology Project (GPCP) monthly precipitation analysis (1979–present). J. Hydrometeorol. 2003, 4, 1147–11167. [Google Scholar] [CrossRef]
  17. Joyce, R.; Janowiak, J.; Arkin, P.; Xie, P. CMORPH: A method that produces global precipitation estimates from passive microwave and infrared data at high spatial and temporal resolution. J. Hydrometeorol. 2004, 5, 487–503. [Google Scholar] [CrossRef]
  18. Hong, Y.; Hsu, K.; Gao, X.; Sorooshian, S. Precipitation estimation from remotely sensed imagery using Artificial Neural Network-Cloud Classification System. J. Appl. Meteorol. 2004, 43, 1834–1853. [Google Scholar] [CrossRef]
  19. Hong, Y.; Hsu, K.; Moradkhani, H.; Sorooshian, S. Uncertainty quantification of satellite precipitation estimation and Monte Carlo assessment of the error propagation into hydrologic response. Water Resour. Res. 2006, 42, W08421. [Google Scholar] [CrossRef]
  20. Bellerby, T. Satellite rainfall uncertainty estimation using an artificial neural network. J. Hydrometeorol. 2007, 8, 1397–1412. [Google Scholar] [CrossRef]
  21. Hossain, F.; Anagnostou, E. Using a multi-dimensional satellite rainfall error model to characterize uncertainty in soil moisture fields simulated by an offline land surface model. Geophys. Res. Lett. 2005, 32, 776–792. [Google Scholar] [CrossRef]
  22. Bellerby, T.; Sun, J. Probabilistic and ensemble representations of the uncertainty in an IR/microwave satellite precipitation product. J. Hydrometeorol. 2005, 6, 1032–1044. [Google Scholar] [CrossRef]
  23. Steiner, M.; Bell, T.; Zhang, Y.; Wood, E. Comparison of two methods for estimating the sampling-related uncertainty of satellite rainfall averages based on a large radar dataset. J. Climate 2003, 16, 3759–3778. [Google Scholar] [CrossRef]
  24. Greene, J.; Morrissey, M. Validation and uncertainty analysis of satellite rainfall algorithms. Prof. Geogr. 2000, 52, 247–258. [Google Scholar] [CrossRef]
  25. Hossain, F.; Anagnostou, E.; Bagtzoglou, A. On Latin Hypercube sampling for efficient uncertainty estimation of satellite rainfall observations in flood prediction. Comput. Geosci. 2006, 32, 776–792. [Google Scholar] [CrossRef]
  26. Morrissey, M.; Greene, J. Uncertainty analysis of satellite rainfall algorithms over the tropical Pacific. J. Geophys. Res.-Atmosph. 1998, 103, 19569–19576. [Google Scholar] [CrossRef]
  27. Chang, A.; Chiu, L. Uncertainty in satellite rainfall estimates: Time series comparison. Adv. Space Res. 1997, 19, 469–472. [Google Scholar] [CrossRef]
  28. Yan, J.; Gebremichael, M. Estimating actual rainfall from satellite rainfall products. Atmosph. Res. 2009, 92, 481–488. [Google Scholar] [CrossRef]
  29. Bell, T.; Abdullah, A.; Martin, R.; North, G. Sampling errors for satellite-derived tropical rainfallMonte Carlo study using a spacetime stochastic model. J. Geophys. Res. 1990, 95, 2195–2205. [Google Scholar] [CrossRef]
  30. Schuurmans, J.; Bierkens, M. Effect of spatial distribution of daily rainfall on interior catchment response of a distributed hydrological model. Hydrol. Earth Syst. Sci. 2007, 11, 677–693. [Google Scholar] [CrossRef]
  31. Tetzlaff, D.; Uhlenbrook, S. Significance of spatial variability in precipitation for process-oriented modelling: results from two nested catchments using radar and ground station data. Hydrolo. Earth Syst. Sci. 2005, 9, 29–41. [Google Scholar] [CrossRef]
  32. Syed, K.; Goodrich, D.; Myers, D.; Sorooshian, S. Spatial characteristics of thunderstorm rainfall fields and their relation to runoff. J. Hydrol. 2003, 271, 1–21. [Google Scholar] [CrossRef]
  33. Arnaud, P.; Bouvier, C.; Cisner, L.; Dominguez, R. Influence of rainfall spatial variability on flood prediction. J. Hydrol. 2002, 260, 216–230. [Google Scholar] [CrossRef]
  34. Bell, V.; Moore, R. The sensitivity of catchment runoff models to rainfall data at different spatial scales. Hydrol. Earth Syst. Sci. 2000, 4, 653–667. [Google Scholar] [CrossRef]
  35. Tian, Y.; Peters-Lidard, C.D.; Choudhury, B.J.; Garcia, M. Multitemporal analysis of TRMM-based satellite precipitation products for land data assimilation applications. J. Hydrometeorol. 2007, 8, 1165–1183. [Google Scholar] [CrossRef]
  36. Hossain, F.; Anagnostou, E. Assessment of current passive-microwave- and infrared-based satellite rainfall remote sensing for flood prediction. J. Geophys. Res. 2004, 5, 487–503. [Google Scholar] [CrossRef]
  37. Villarini, G.; Krahewsj, W.F. Evaluation of the research-version TMPA threehourly 0.25°0.25° rainfall estimates over Oklahoma. Geophys. Res. Lett. 2007, 34, L05402. [Google Scholar] [CrossRef]
  38. AghaKouchak, A.; Habib, E.; Bárdossy, A. A. Modeling radar rainfall estimation uncertainties: A random error model. J. Hydrol. Eng. 2009, in press. [Google Scholar]
  39. Villarini, G.; Krajewski, W.; Ciach, G.; Zimmerman, D. Product-Error-Driven generator of probable rainfall conditioned on WSR-88D precipitation estimates. Water Resour. Res. 2009, 45. [Google Scholar] [CrossRef]
  40. Ciach, G.; Krajewski, W.; Villarini, G. Product-error-driven uncertainty model for probabilistic quantitative precipitation estimation with NEXRAD data. J. Hydrometeorol. 2007, 8, 1325–1347. [Google Scholar] [CrossRef]
  41. Germann, U.; Berenguer, M.; Sempere-Torres, D.; Salvade, G. Ensemble radar precipitation estimation - a new topic on the radar horizon. In Proc. 4th European Conference on Radar in Meteorology and Hydrology ERAD 2006, Barcelon, Spain, September 18–22, 2006.
  42. Clark, M.; Gangopadhyay, S.; Brandon, D.; Werner, K.; Hay, L.; Rajagopalan, B.; Yates, D. A resampling procedure for generating conditioned daily weather sequences. Water Resour. Res. 2004, 40. [Google Scholar] [CrossRef]
  43. Clark, M.; Gangopadhyay, S.; Hay, L.; Rajagopalan, B.; Wilby, R. Schaake shuffle: A method for econstructing space-time variability in forecasted precipitation and temperature fields. J. Hydrometeorol. 2004, 5, 243–262. [Google Scholar] [CrossRef]
  44. Pegram, G.; Clothier, A. Downscaling rainfields in space and time using the String of Beads model in time series mode. Hydrol. Earth Syst. Sci. 2001, 5, 175–186. [Google Scholar] [CrossRef]
  45. Seed, A.; Srikanthan, R. A space and time model for design storm rainfall. J. Geophys. Res. 2001, 104, 31623–31630. [Google Scholar] [CrossRef]
  46. Huffman, G. Estimates of root-mean-square random error for finite samples of estimated precipitation. J. Hydrometeorol. 1997, 36, 1191–2101. [Google Scholar] [CrossRef]
  47. Krajewski, W.; Georgakakos, K. Synthesis of radar rainfall data. Water Resour. Res. 1985, 21, 764–768. [Google Scholar] [CrossRef]
  48. Huffman, G.; Adler, R.; Bolvin, D.; Gu, G.; Nelkin, E.; Bowman, K.; Stocker, E.; Wolff, D. The TRMM Multi-satellite Precipitation Analysis: Quasi-global, multiyear, combined-sensor precipitation estimates at fine scale. J. Hydrometeorol. 2007, 8, 38–55. [Google Scholar] [CrossRef]
  49. Habib, E.; Henschke, A.; Adler, R. Evaluation of TMPA satellite-based research and real-time rainfall estimates during six tropical-related heavy rainfall events over Louisiana, USA. Atmosph. Res. 2009. [Google Scholar] [CrossRef]
  50. Spearman, C.E. The Proof and Measurement of Association between Two Things. 1904. Available on line at: http://www.archive.org/stream/proofmeasurement00speauoft#page/n33/mode/2up (accessed September 9, 2009).
  51. Hollander, M.; Wolfe, D. Nonparametric Statistical Methods; Wiley: New York, NY, USA, 1973. [Google Scholar]

