1. Introduction
An extended hydrologic drought in the Colorado River basin has forced many communities in this region to seek additional water resources at greater distances. In the case of Southern Nevada, water rights applications have been filed for ground water in basins located in East-central Nevada; as such, more accurate water balances at the basin level are needed to make wise management decisions. In 2005 a long term study was initiated in the Great Basin of East-central Nevada (Spring Valley, White River Valley, and Snake Valley) to estimate basin-wide evapotranspiration (ET). Total ET during the growing season (May to September) was measured using Eddy covariance method and correlated with remotely sensed Landsat-5 Thematic Mapper data. A number of locations on the valley floors (within basins) were selected as experimental sites based on gradients in plant composition, percent cover, soil type and ground water depth. Highly significant linear relationships were found between the Normalized difference vegetation index (NDVI) and ET when data were combined across years (2005–2007) and across valleys [
1].
Current information shows that satellite-based remote sensing data has provided the ability to estimate and study ecosystem processes and surface energy fluxes such as ET over regional and global scales [
2,
3,
4]. However, the limited temporal resolution of most satellite-based remote sensing platforms (data are acquired at a single point in time) and the relative coarse spatial resolution pose a potential problem in the reliability of such systems to provide continuous and accurate estimation of spatially distributed surface fluxes, especially in semi-arid regions characterized by land surface heterogeneity and incomplete vegetation cover. As part of our interest in interpreting the biophysical processes driving the spatial variation in ET-NDVI relationships, a field-based approach that allows for repeatable and continuous NDVI measurements at a much finer spatial and temporal scale than Landsat is needed.
In a semi-arid environment, although vegetation plays a critical role in the energy exchange between the land surface and the atmosphere via the transpiration process, it is accompanied by a significant amount of water loss via soil evaporation. In these regions, growing conditions can vary significantly based on the spatial variation in climate, water availability, vegetation composition and soil type. Plants are also highly responsive to short term and long term environmental factors and perturbations leading to temporal fluctuations in vegetation cover and density. Consequently, these inherent changes in vegetation characteristics affect the overall water balance and the spatial variation in ET-NDVI relationships.
Based on traditional remote sensing routines, visible and near-infrared (NIR) based vegetation indices (VIs) have been widely and successfully used in various ET estimation models [
5,
6,
7,
8]. The basis of using VIs to estimate a wide range of ecosystem processes is the underlying assumption shared by most of the remote sensing community, that the optical properties of terrestrial vegetation in the visible and NIR regions of the electromagnetic spectrum are key indicators of many physiological and biophysical processes. For instance, NDVI which is the normalized ratio of red and NIR spectral reflectance (NDVI = (NIR − RED)/(NIR + RED)), is one of the most widely and frequently used VIs in remote sensing research. As such, the existing global NDVI data derived from the NOAA’s Advanced Very High Resolution Radiometer (AVHRR) and the Moderate Resolution Imaging Spectroradiometer (MODIS) satellite systems provide routine monitoring of terrestrial ecosystems and vegetation changes [
9,
10]. NDVI has also been shown to be related to a number of plant physiological and biophysical parameters such as leaf area index (LAI), green vegetation density, biomass, chlorophyll content and photosynthetic activity as well as water content and overall vegetation health [
11,
12,
13].
On the other hand, it is well known that NDVI has limitations when used to estimate canopy structural variations and architecture because it is potentially affected by soil background and it saturates at high biomass [
14,
15] and at intermediate leaf area index values [
16]. Thus, the association of NDVI to greenness and chlorophyll content of the canopy, rather than to simple variations in LAI or percent canopy cover, has been well documented [
17,
18]. Uncertainties in interpreting NDVI data also occur in sparsely vegetated areas like semi-arid environments. These areas are characterized by open canopies with significant canopy background (leaf litter, dead branches, shadows and soil), making it difficult to isolate the green vegetation reflectance signal from the canopy background signal. Under such conditions, it becomes even more problematic when trying to interpret spatial and temporal differences over a diverse range of vegetation [
14]. However, satellite NDVI was found to be reliable in monitoring and detecting seasonal variations in land cover [
19,
20]. Additionally, many authors demonstrated the usefulness of NDVI time series to extract and track seasonal and inter-annual phenological behavior and changes of semi-arid vegetation [
21,
22].
The difficulties encountered in using large and infrequent synoptic remote sensing coverage to estimate and scale surface water and energy fluxes has led to the emerging realization in the last few years for the need of more reliable ground truthing techniques to provide a validation for satellite based data [
23,
24]. An improved knowledge of the factors controlling the spatial and temporal changes in plant and soil reflectance properties often requires intensive and continuous field measurements at the canopy scale, which involves using high spectral resolution sensors. Typically, the use of conventional ground-based sensors such as portable spectroradiometers is often considered impractical for field studies associated with long-term flux measurements, mainly because they cannot continuously be applied at the same time across large spatial scales relevant to the corresponding satellite pixel or to the flux tower footprint without being engineered to operate automatically under various climatic and sky conditions.
The possibility of validating satellite data and linking them to flux tower point measurements was explored [
25], leading to the creation of the SpecNet (Spectral Network) initiative, an international network of automated optical field sampling systems aimed to link gas fluxes and other key ecosystem processes to optical remote sensing at a comparable scale at which eddy flux towers operate. As part of the SpecNet group, a fully automated tower-based spectral data collection system designed to measure year round spectral canopy reflectance at a high temporal frequency in a near 360° observation area around an eddy flux tower was developed [
26]. This system was established 10 m above a forest canopy to provide a real time estimation of changes in plant pigment concentration. An innovative approach was also developed using an automated mobile field tram system to provide transect sampling for whole canopies and stands at a spatial and temporal scale comparable to the flux tower footprint [
27].
In this study, continuous and repeatable ground-based measurements of soil and vegetation NDVI were taken across two contrasting sites in the Great Basin characterized by having a dense and a sparse vegetation cover. This setting provided us the ability to continuously monitor and compare NDVI changes between two sites where vegetation growth characteristics were highly affected by soil conditions (soil texture and moisture) and fluctuations in meteorological parameters and species composition. The approach engaged herein focuses on understanding the biophysical and spectral properties of the main constituents of each site (bare soil and vegetation). The main objectives were to address a number of questions such as: how do continuous and repeatable NDVI measurements of bare soil and key plant species, obtained at a much finer spatial and temporal scale than Landsat, vary between the two sites? What are the possible factors associated with the dynamics of plant growth stages that may influence the spatial variation in NDVI during the growing season between the two sites? To what extent does ground-based NDVI capture subtle key features and transitions in plant and soil physical properties during the growing season not captured by the coarse spatial resolution of Landsat data or information that is lost in the gap between satellite overpasses or not fully evaluated because of cloud cover?
2. Materials and Methods
2.1. Description of Study Sites
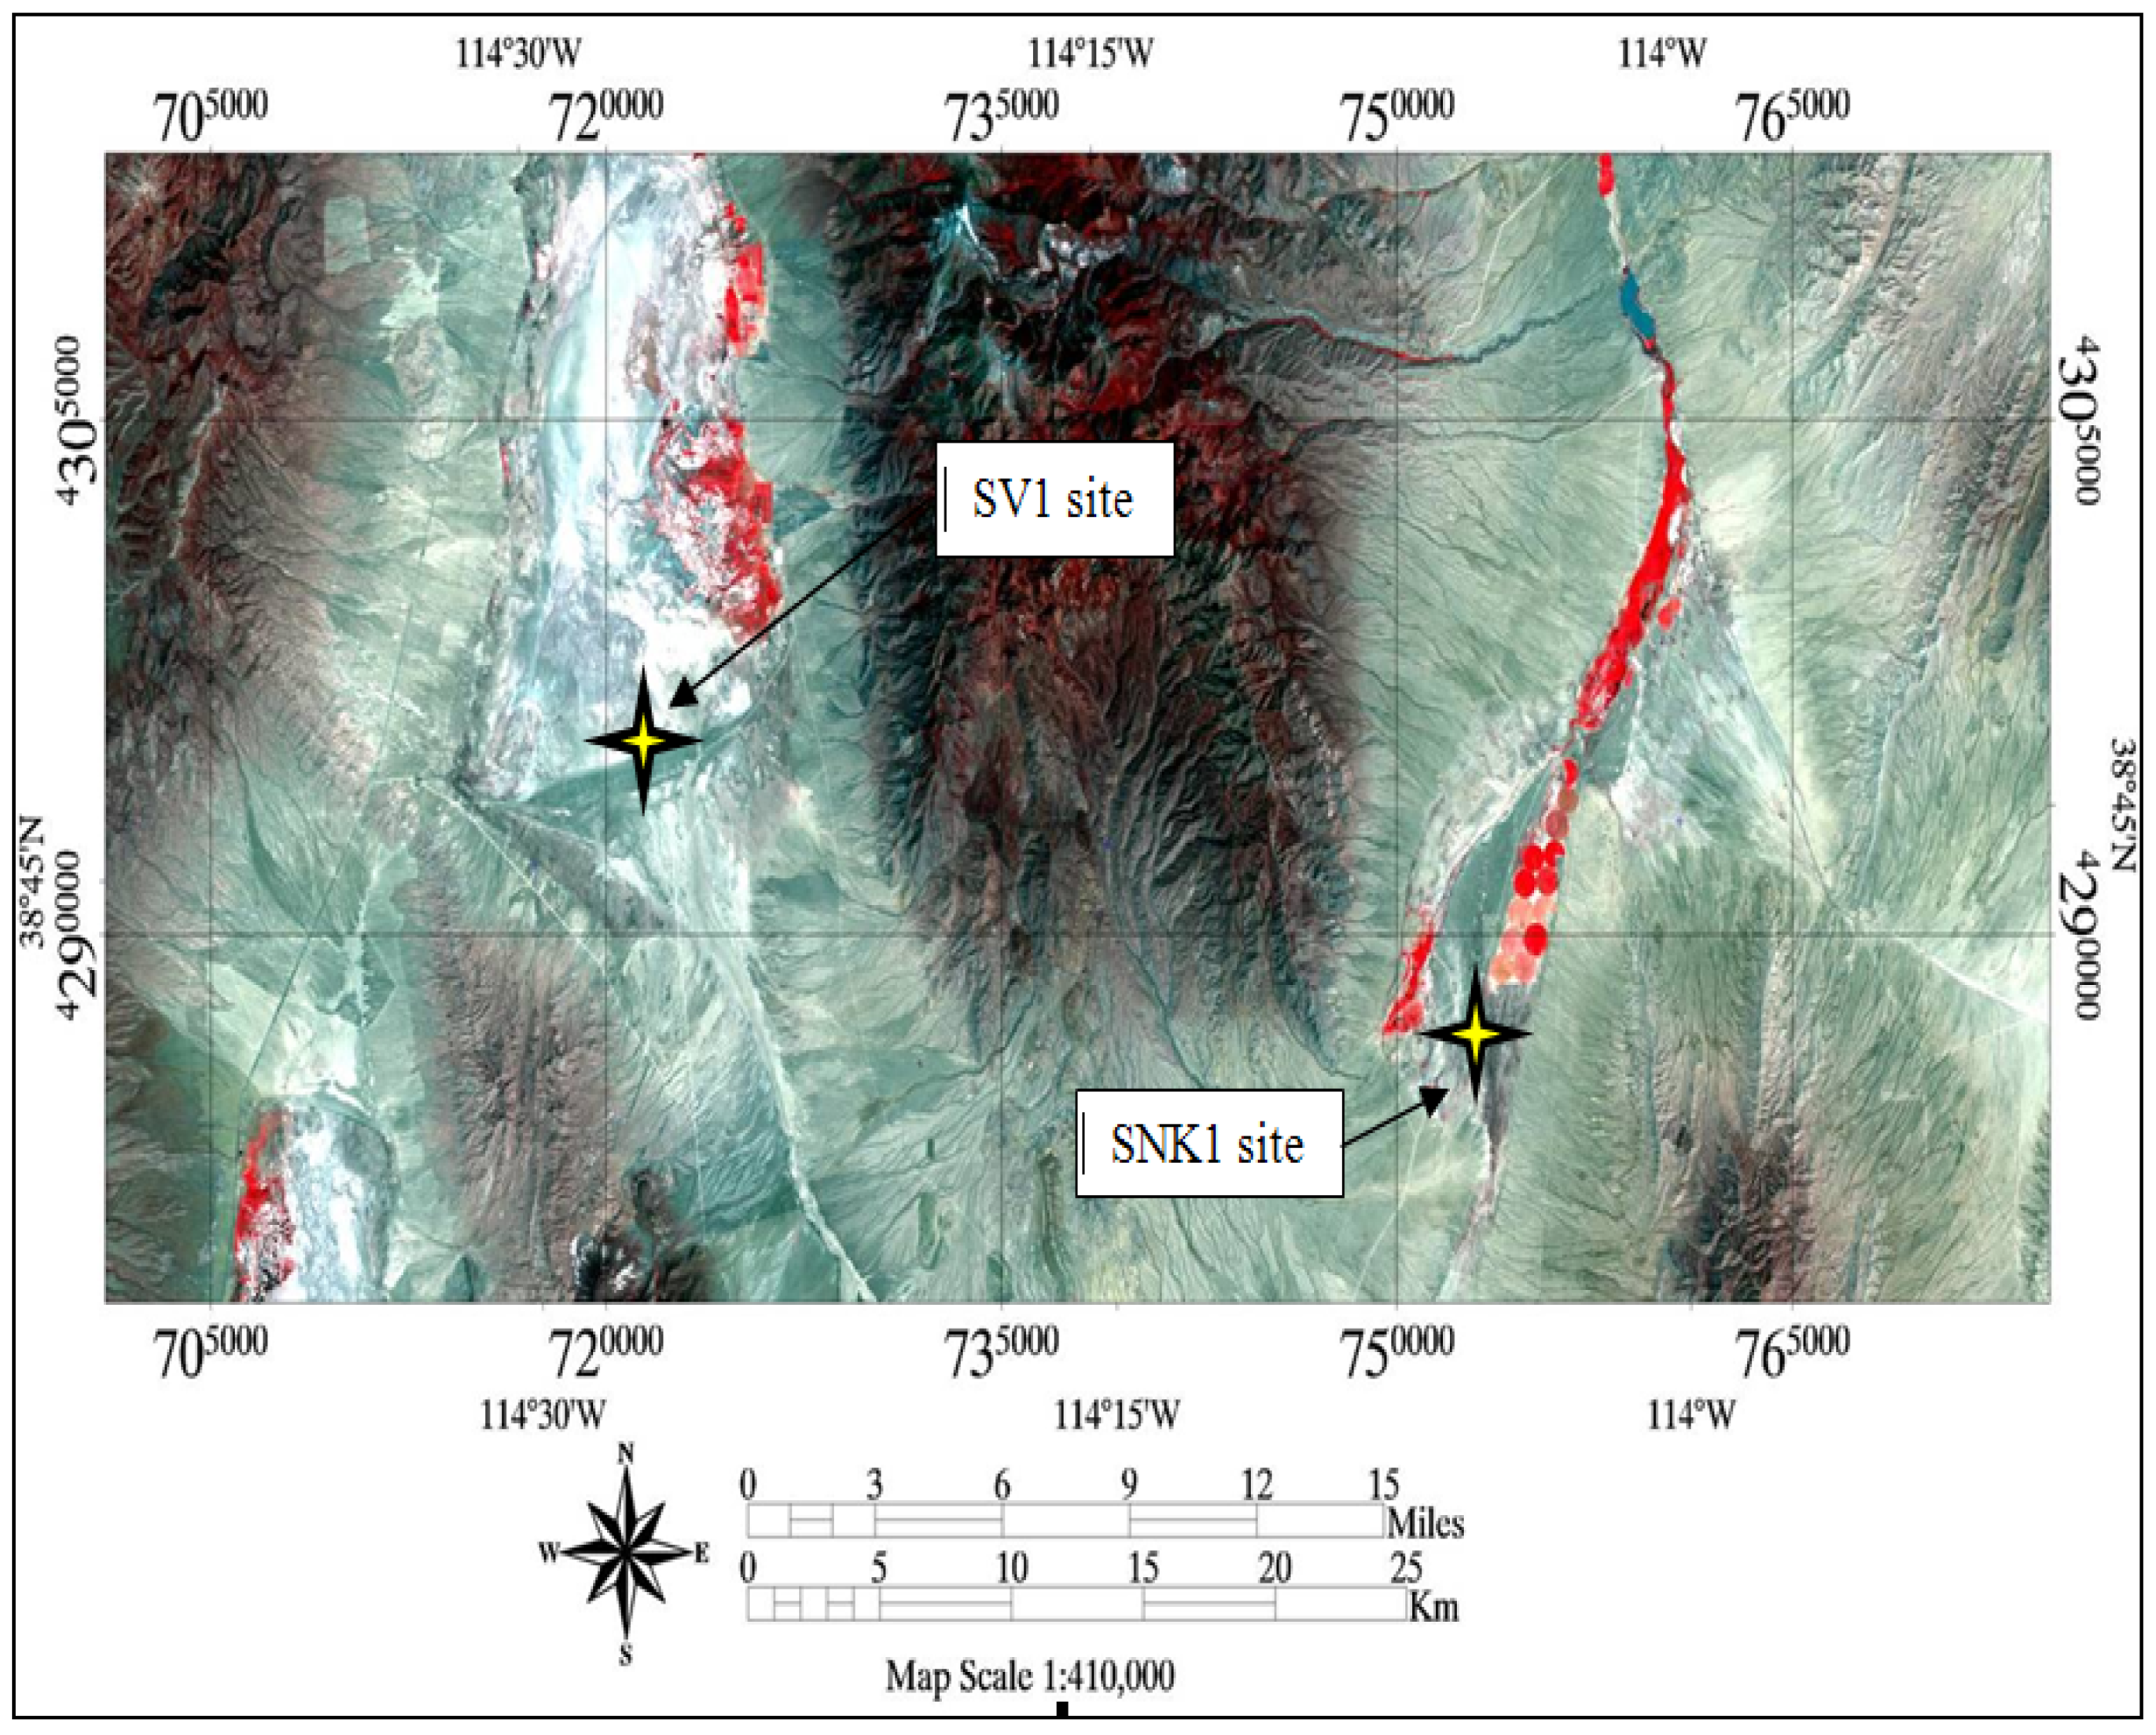
The study was conducted at two sites located in two different Great Basin valleys (East central Nevada) situated 34 km apart and identified as Spring Valley 1 site (SV1) characterized by having a sparse vegetation cover (38°46'32.79"N, 114°28'7.65"W, elevation: 1,761.6 m) and Snake Valley 1 site (SNK1) characterized by having a dense vegetation cover (38°41'51.98"N, 114°5'19.32"W, elevation: 1,684.9 m), (
Figure 1). The climate is typically semi-arid with cold winters and hot summers. The region receives the majority of its precipitation during winter months but also receives summer rainfall (between July and September) associated with the Southwest US monsoon season. Selection of the two study sites was based on providing a contrast in species composition, percent canopy cover and density of greasewood (
Sarcobatus vermiculatus) as well as differences in soil textural properties.
Detailed species composition identification and percent cover data were acquired at each site during the 2007 active growing season by manually identifying plant species and calculating the surface area of every individual plant within 25 m × 25 m plots corresponding to the Landsat-5 TM pixel size.
Figure 1.
False color Landsat 5 TM image (2007) showing the location of the two study sites (Spring Valley 1 site and Snake Valley 1 site) in the Great Basin.
Figure 1.
False color Landsat 5 TM image (2007) showing the location of the two study sites (Spring Valley 1 site and Snake Valley 1 site) in the Great Basin.
At the SV1 site, the sparse vegetation cover consisted of a combination of greasewood (Sarcobatus vermiculatus), rabbitbrush (Chrysothamnus viscidiflorus), sagebrush (Artemisia tridentata) and shadscale (Atriplex confertifolia), with sagebrush representing the dominant species. At the SNK1 site, with the exception of a few shrubs of shadscale, greasewood represented the dominant species.
2.2. Micrometeorological Measurements
Fully equipped Eddy covariance micrometeorological towers (Campbell Scientific, Logan, UT, USA) were installed within the 25 m by 25 m center plot at each site. Water fluxes were measured using a 3D sonic anemometer (CSAT3, Campbell Scientific, Logan, UT, USA) along with an open path infrared gas analyzer (IRGA- Licor Biosciences, Lincoln, NE, USA ) allowing for a surface energy balance approach to be used:
where,
Rn,
G,
H and
LE are the flux densities of net radiation (REBS net radiometer), soil heat storage (Hukseflux soil heat-flux plates), sensible heat (CSAT3, 3-D sonic anemometer) and latent heat, respectively (W m
−2). Post data processing of the 10 Hz data was accomplished using EdiRe [
28]. Standard corrections were made following the protocol outlined by AmeriFlux [
29]. Hourly and daily averaged air temperature, wind speed, relative humidity, solar radiation and precipitation data were acquired from automated weather stations at both monitoring sites. Potential evapotranspiration (ET
o) was calculated using the Penman-Monteith equation [
30] to assess environmental evaporative demand.
2.3. Satellite Data
Terrain corrected and georectified Landsat-5 TM images were purchased from the US Geological Survey- Earth Resources Observation and Science (USGS-EROS) Data Center. Acquisition dates for the 2007 growing season were: April 13, April 29, May 15, May 31, June 16, July 2, July 18, August 3, August 19, September 4 and September 20. The image processing software: Environment for Visualizing Images (ENVI), (Research Systems, Inc., Boulder, CO, USA) was used for image processing including calibration and atmospheric correction. The selected atmospheric correction method was based on the empirical line method (ELM) where field spectra (light, dark and medium targets) acquired on a single date (June 20, 2007) were resampled and used to atmospherically correct and normalize Landsat band 3 and band 4 for all dates. The resulting reflectance data were then used to calculate NDVI. At each site and for every acquisition date, NDVI values were extracted from the pixel representing the plot where the ground-based NDVI sensors were located.
2.4. Ground-based NDVI System
Ground-based NDVI measurements were carried out using a dual channel SKR-1800 radiometer (Skye instruments LTD, Powys, UK) that simultaneously measures incident solar radiation (sensor 1) and upward reflectance (sensor 2), thus correcting for solar variations. The two sensors were fitted with a removable cosine-corrected diffuser which serves the purpose of measuring downwelling light in accordance with Lambert’s cosine law. Thus, when taking incident light measurements, the diffuser head is left in place. However, for the measurements of reflected light energy, the cosine diffuser head can be removed or kept in place depending on the size of the area to be viewed. For instance, when the diffuser cap is removed, the light acceptance of the sensor becomes narrow angle cone shaped with a defined 25° field of view (FOV) which is suitable for measuring reflectance properties of soil and vegetation surfaces. In both cases, the measured reflectance area can also be defined by adjusting sensor height above the viewed ground surface.
The SKR-1800 radiometer used in this study was customized by the manufacturer upon our request to acquire data in two broadband channels: channel 1(red): 630–690 nm and channel 2 (NIR): 760–900 nm, both comparable to Landsat-5 TM band 3 (red) and band 4 (NIR) bandwidth, respectively. Sensor calibration was done by the National Physical Laboratory, UK in 2007 prior to use. All SKR-1800 sensors were installed within a 25 m by 25 m plot adjacent to the center plot within the footprint of the Eddy flux towers.
At the SV1 site, sensors (upwelling and downwelling) were mounted above the canopy of an individual greasewood plant with data collection beginning in January of 2007 prior to the start of field data collection in May, whereas, at the SNK1 site sensors were installed in the beginning of May. In all cases, sensors were mounted on horizontal beams attached to vertical stainless steel poles, with the downward looking sensor positioned above single greasewood, rabbitbrush, sagebrush canopies and a bare soil surface at the SV1 site and above a greasewood canopy and a bare soil surface at the SNK1 site, all representing satellite image pixel components at the larger scale. In this study, all cosine-corrected diffuser caps were removed from the sensors measuring reflected radiance. Consequently, for each plant canopy, the height of the downward looking sensor was adjusted based on the size of the monitored plant (
Table 1). All horizontal beams with sensors were slightly oriented to the southwest to avoid shadow effects. Although the sensors were automated and required minimal attendance, periodic leveling checks, sensors adjustments and cleaning were made.
Table 1.
NDVI sensor height and measured surface area of each ground surface.
Table 1.
NDVI sensor height and measured surface area of each ground surface.
| Ground surface | Sensor height (m) | Ground resolution (m2) |
|---|
| Greasewood (Sarcobatus vermiculatus), (SV1) | 1.71 | 0.43 |
| Rabbit Brush (Chrysothamnus viscidiflorus), (SV1) | 1.37 | 0.28 |
| Sagebrush (Artemisia tridentata), (SV1) | 0.98 | 0.14 |
| Bare soil (SV1) | 1.77 | 0.47 |
| Greasewood (Sarcobatus vermiculatus), (SNK1) | 1.48 | 0.33 |
| Bare soil (SNK1) | 0.75 | 0.09 |
All sensor serial cables were connected to a CR10X datalogger (Campbell Scientific, Logan, UT, USA) mounted on the weather station at each site. The datalogger stored the data on a removable SM4M storage module, allowing for quick and convenient retrieval of the data during routine field visits. For the purpose of data acquisition, we prepared a custom software program to automatically allow for real-time and continuous (24 h/day) collection of incident and reflected radiance at 1 min intervals. The output from each channel was in the form of current, proportional to the light falling on the sensor in µmol s
−1m
−2 (Skye instruments LTD, 2007). In order to make both channels equally sensitive for ratio measurements (Skye instruments LTD, 2007), the output from each channel and each individual sensor (with the diffuser head removed) was multiplied by a relative sensitivity factor (Z) provided in the manufacturer’s calibration certificate. In a final step, all the downloaded data was processed in the lab and NDVI was calculated as follows:
where
X: NIRI incident reading (µmol s−1m−2)
Y: RedI incident reading (µmol s−1m−2)
Z: Ratio sensitivity of reflected NIR: Red
NIRR(nA): Reflected reading in nanoamps
RedR(nA): Reflected reading in nanoamps
2.5. Soil and Plant Measurements
Plant biophysical and soil physical properties were acquired at both sites during midday hours every two weeks to coincide with Landsat overpasses. All measurements were taken within the 625 m
2 plot where the NDVI sensors were installed. For all plant measurements, three plants per species were monitored at each site. Plant canopy temperature (T
c) was measured using a hand-held 39800 infrared thermometer (Cole Parmer Instrument Company, Vernon Hills, IL, USA). Air temperature was measured at a 1m height near each monitored shrub and within canopy interspaces with an infrared thermometer (Cole Palmer Model 39800). Canopy-air temperature differentials (T
c − T
a) were then calculated to normalize the data against ambient conditions and assess plant water status. Canopy chlorophyll content was assessed using a portable CM 1000 chlorophyll index meter (Spectrum Technologies, Plainfield, IL, USA). Leaf xylem water potential (Ψ
ω) was measured with a 760 Model Pressure chamber (PMS instrument company, Albany, OR, USA). Leaf tissue samples were harvested from all species within the monitored plots and placed into pre-labeled and insulated plastic cups, sealed and transported to the lab where they were immediately weighed. Samples were then oven dried at 70 °C for 48 h to provide dry weight for tissue moisture estimation. Oven dried tissue samples were analyzed for total nitrogen concentration using the Total Kjeldahl Nitrogen (TKN) procedure outlined by [
31]. Leaf area index (LAI), an important biophysical variable of plant canopies is defined as the total one-sided area of leaf tissue per unit ground surface area [
32]. LAI was estimated using a Decagon AccuPAR-LP80 meter (Decagon Devices, Inc., Pullman, WA, USA). LAI values were generated by combining sensor measurements taken above and below the canopies. LAI in this study was monitored to assess the variations in canopy cover of each species at various phenological stages during the growing season to determine how these variations might influence NDVI measurements based on the intercepted light energy associated with leaf area. Surface soil water content was estimated using an SM200 soil moisture sensor (Delta T-Devices, Cambridge, UK). Time domain reflectometry (TDR) probes (6050X1, Soil moisture equipment CORP., Goleta, CA, USA) were used to assess soil water content at depths of 15 cm, 45 cm, 75 cm and 105 cm (SV1 only).
All statistical analyses were based on descriptive statistics and on simple linear and multiple linear regression techniques using SigmaStat Version 3.1 (SPSS Inc, Chicago, IL, USA). In this paper, all correlations were tested for significance at P-values ≤ 0.05. Backward stepwise regression analysis was also performed to determine which plant and/or soil parameters could account for the greatest amount of variation in measured NDVI values. Results of each analysis were used to further check for autocorrelation and multicollinearity problems. In all cases, prediction equations were accepted only if the variance inflation factor (VIF) of individual predictors was <2 and the ∑VIFs for all predictors was <10. Coefficients of determination (r2) were used to explain the variability in a given parameter for all predictive regression equations. While correlation coefficients (r) were used to report the degree of correlation between two variables. The observed differences in ground-based NDVI time series between monitored plant species and soil surfaces across the two sites were investigated using the t-test to determine whether the calculated means were statistically different.
3. Results
3.1. Comparing Vegetation NDVI Trends between the Two Sites
To better understand the spatial and temporal patterns of phenological stages, average midday ground-based NDVI values (11:30 to 13:30 h) were calculated from daily data collected at two experimental sites during various monitoring periods in 2007 (
Figure 2,
Figure 3 and
Figure 4). The temporal average midday pattern of NDVI for a single greasewood plant at the SV1 site was monitored for a 316 day period from January 19 to November 30, 2007 (
Figure 2).
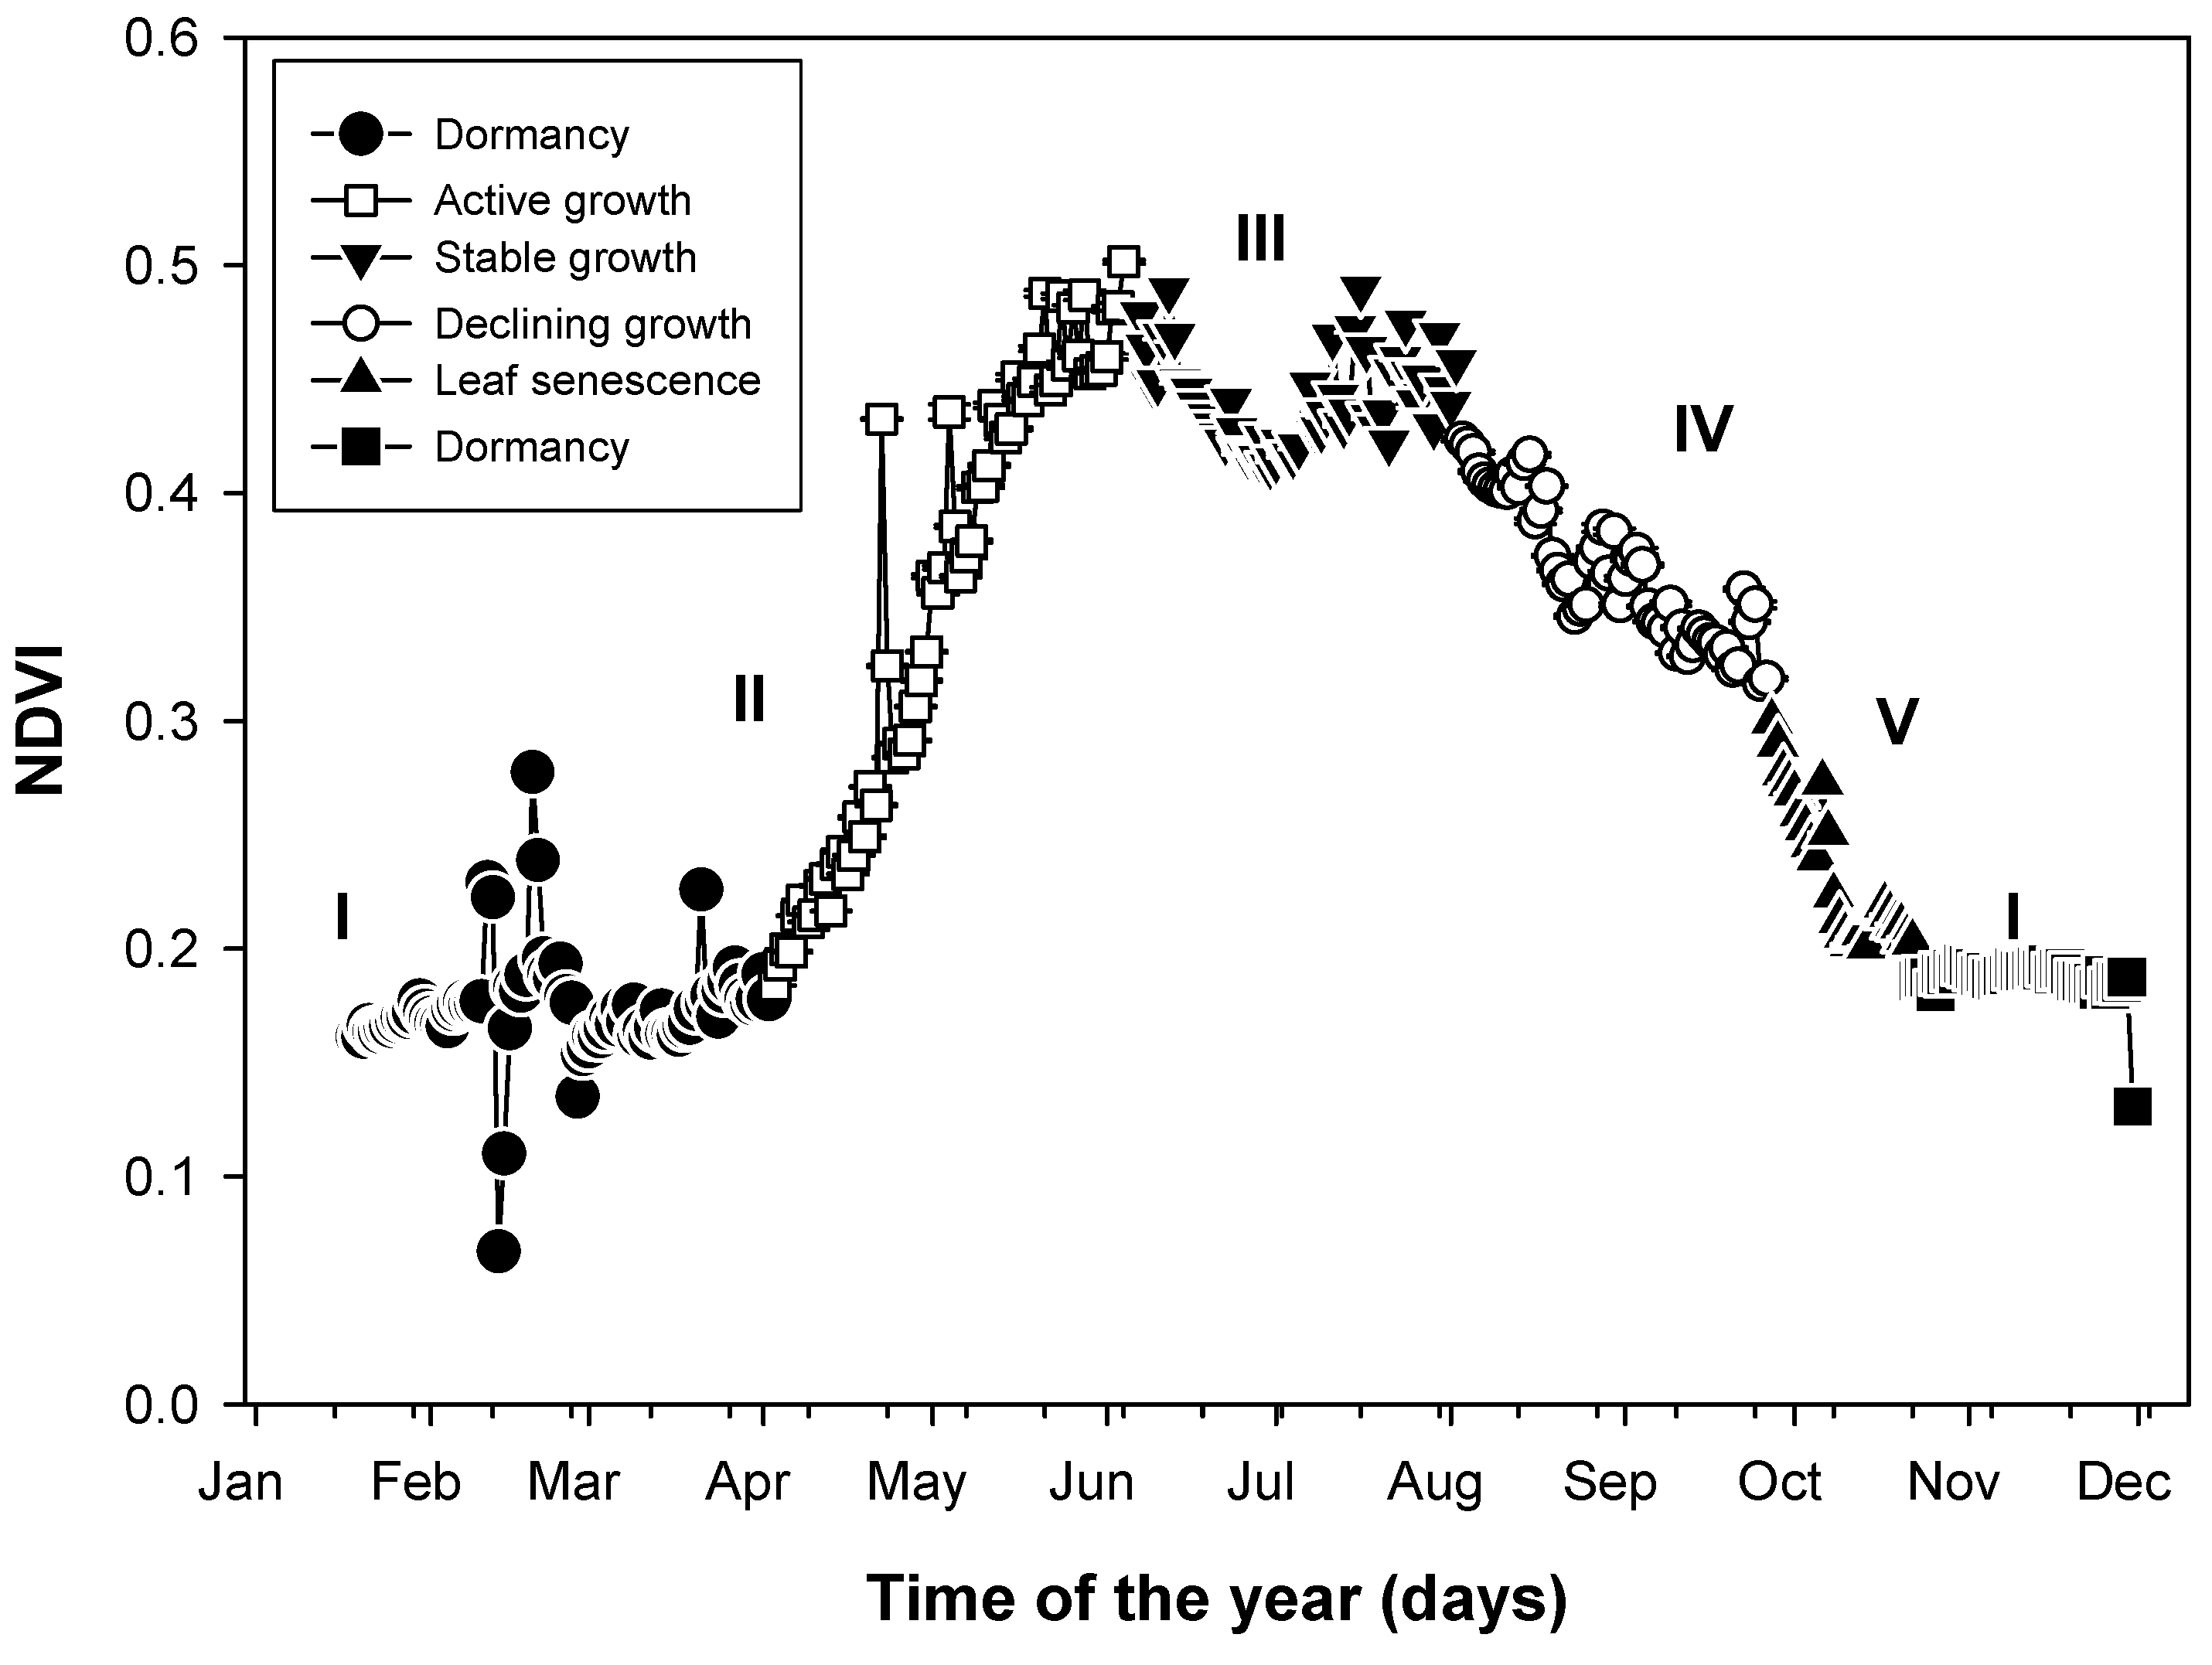
Figure 2.
Time series of average midday (11:30–13:30 h) NDVI values of a single greasewood plant at the Spring Valley 1 site. Data were acquired for the period from January 19 to November 30, 2007. I: dormancy phase (January 19–April 2); II: active growth and canopy development phase (April 3–June 6); III: full canopy development and stable physiological status phase (June 7–August 2); IV: water limitation and stress response phase (August 3–September 26); V: leaf senescence phase (September 27–October 22); I: dormancy phase (October 23–November 30).
This pattern reflected ongoing physiological and physical canopy changes, leading to five clear phases of growth. Phase (I) depicted a dormancy period prior to and after the active growth period associated with complete defoliation during the winter months. Phase (II) was associated with a rapid increase in NDVI values from 0.18 to 0.49 during the period from April 3 to June 6, indicating an active growth period facilitated by favorable growing conditions causing NDVI to reach peak values (0.48 to 0.50) towards the end of this phase. During phase (III), NDVI values remained quite stable, although they showed a slight decline towards the end of June and beginning of July depicting the first signs of the plant response to the summer dry period. However, a sharp increase in NDVI values occurred shortly thereafter, leading to a second prominent peak. This response occurred immediately after the first significant summer rainfall pulse on July 11 and continued throughout subsequent rain pulses on July 16, July 23, August 1 and August 2. In the remaining phases (IV and V), NDVI showed a gradual decline from 0.42 to 0.20. The trend in Phase (IV) was attributed to water stress response during the dry summer period associated with depletion of surface soil water and loss of canopy cover. Finally, phase (V) signified the end of the growing season associated with minimal physiological activity and leaf senescence with the exposure of the background soil surface. The occasional “bumps” in NDVI values during these two final phases were associated with summer rainfall between August and September (
Figure 2).
A full NDVI time series response for the greasewood plant at the SNK1 site was not acquired, due to a delay in the sensor installation occurring in May 2007 and because of field problems encountered later in the season (October) associated with damage to serial cables by rabbits/rodents. Comparison of greasewood NDVI values at the SV1 site and the SNK1 site are shown in
Figure 3 for the experimental period from May to September.
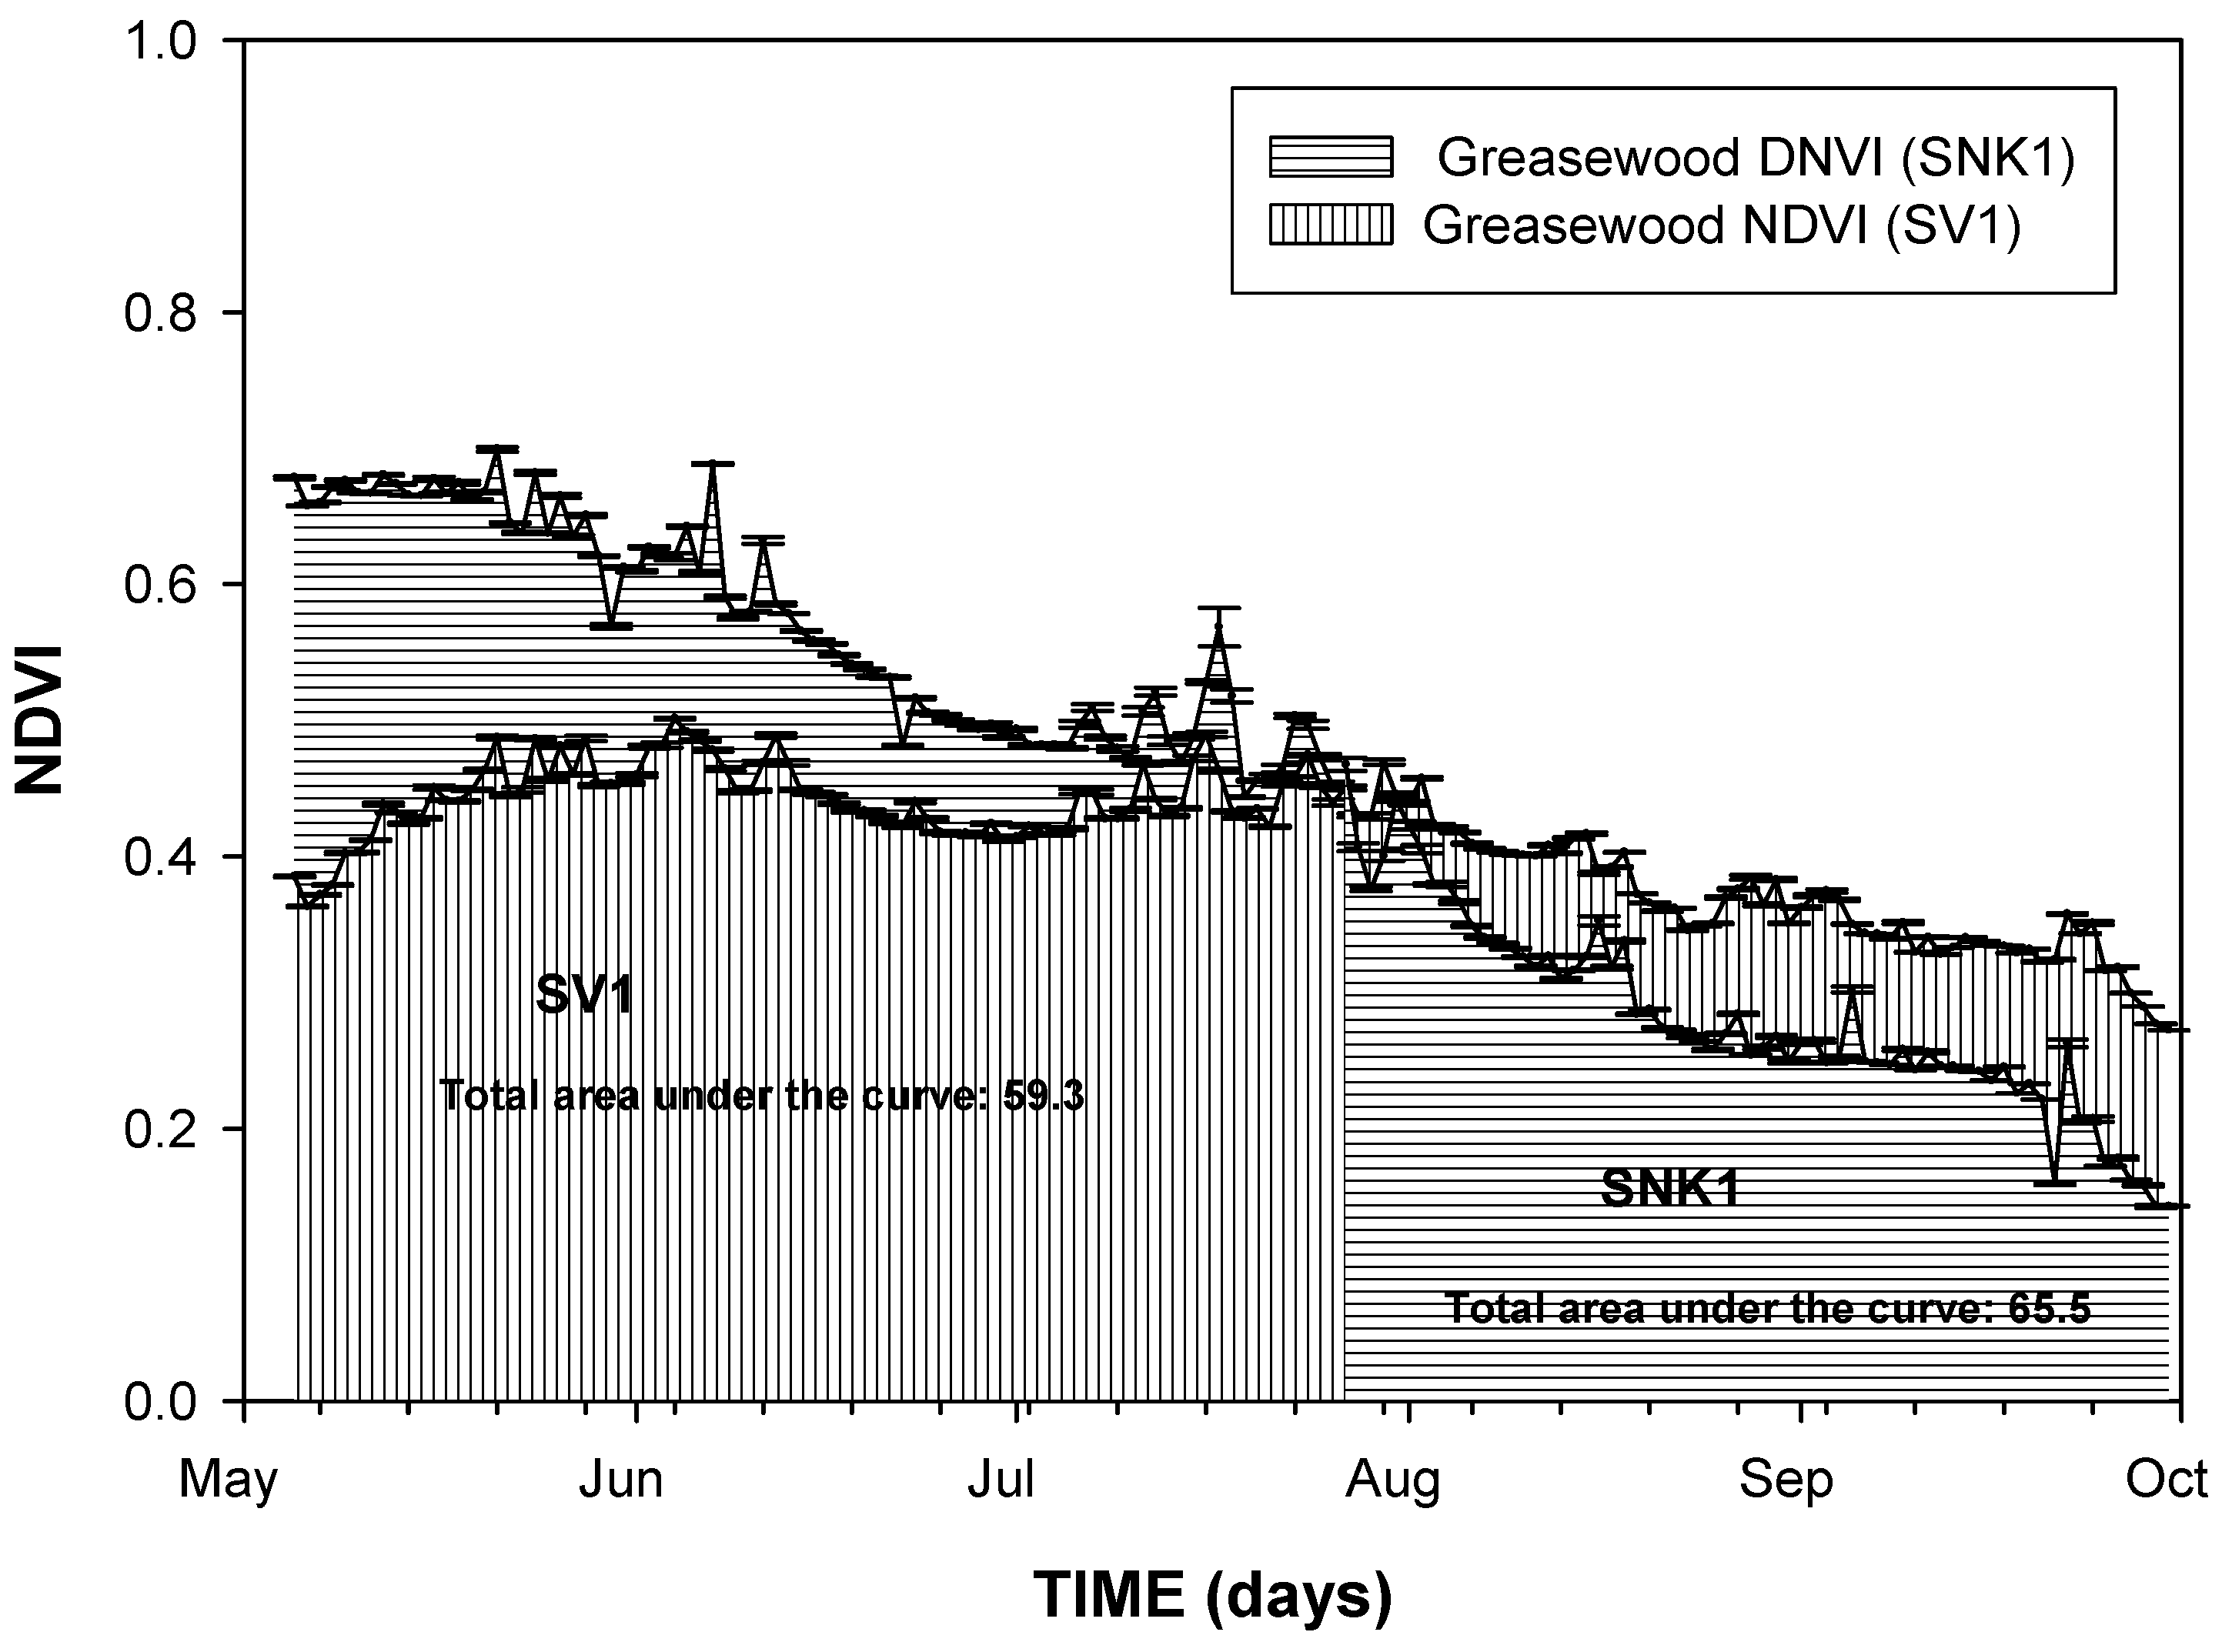
Figure 3.
Time series of average midday (11:30–13:30h) NDVI values of a single greasewood plant at Spring Valley 1 site and at Snake Valley 1 site. Data were acquired during the experimental period from May 5 to September 30, 2007. The area under the curve represents an integrated greasewood growth total of 59.31 for the Spring Valley 1 site and 65.47 for the Snake Valley 1 site.
In both cases, NDVI exhibited higher values during late spring and early summer (May to July) and lower values in mid-summer which continued to the end of September. The greasewood NDVI values from the SNK1 site were 1.3 to 1.8 fold higher than the greasewood NDVI values from the SV1 site during the period from May 5 to June 11. However, NDVI values were significantly higher (between 1.1 and 1.4 fold) at the SV1 site compared to the SNK1 site during the summer dry period between early August and late September. At the SNK1 site, NDVI values showed a very pronounced decline from maximum values of 0.60 and 0.68 during the month of May to 0.38 at the beginning of August to 0.14 by the end of September. During the exact same period, NDVI values measured at the SV1 site, showed little to no apparent decline from maximum values of 0.40 and 0.48 during the month of May to 0.42 at the beginning of August followed by a gradual decline reaching a minimum value of 0.27 by the end of September.
Based on field observations, the differences in NDVI values for the same species from the two different sites can be attributed in part to an early green up (phase II) of greasewood plants at the SNK1 site, followed by an earlier entry into the final stages of senescence. In general, the two NDVI curves (
Figure 3) display similar shapes during the experimental period (May-September) with different daily NDVI values, reflecting site specific forces (soil moisture, nutrient availability, rainfall and environmental demand) controlling growth. However, calculating the area under the curve as an indication of an integrated total revealed that despite the decline in greasewood NDVI at SNK1 to lower values over the last two months of August and September, the earlier phase led to higher integrated totals (65.5 for SNK1
vs. 59.3 for SV1).
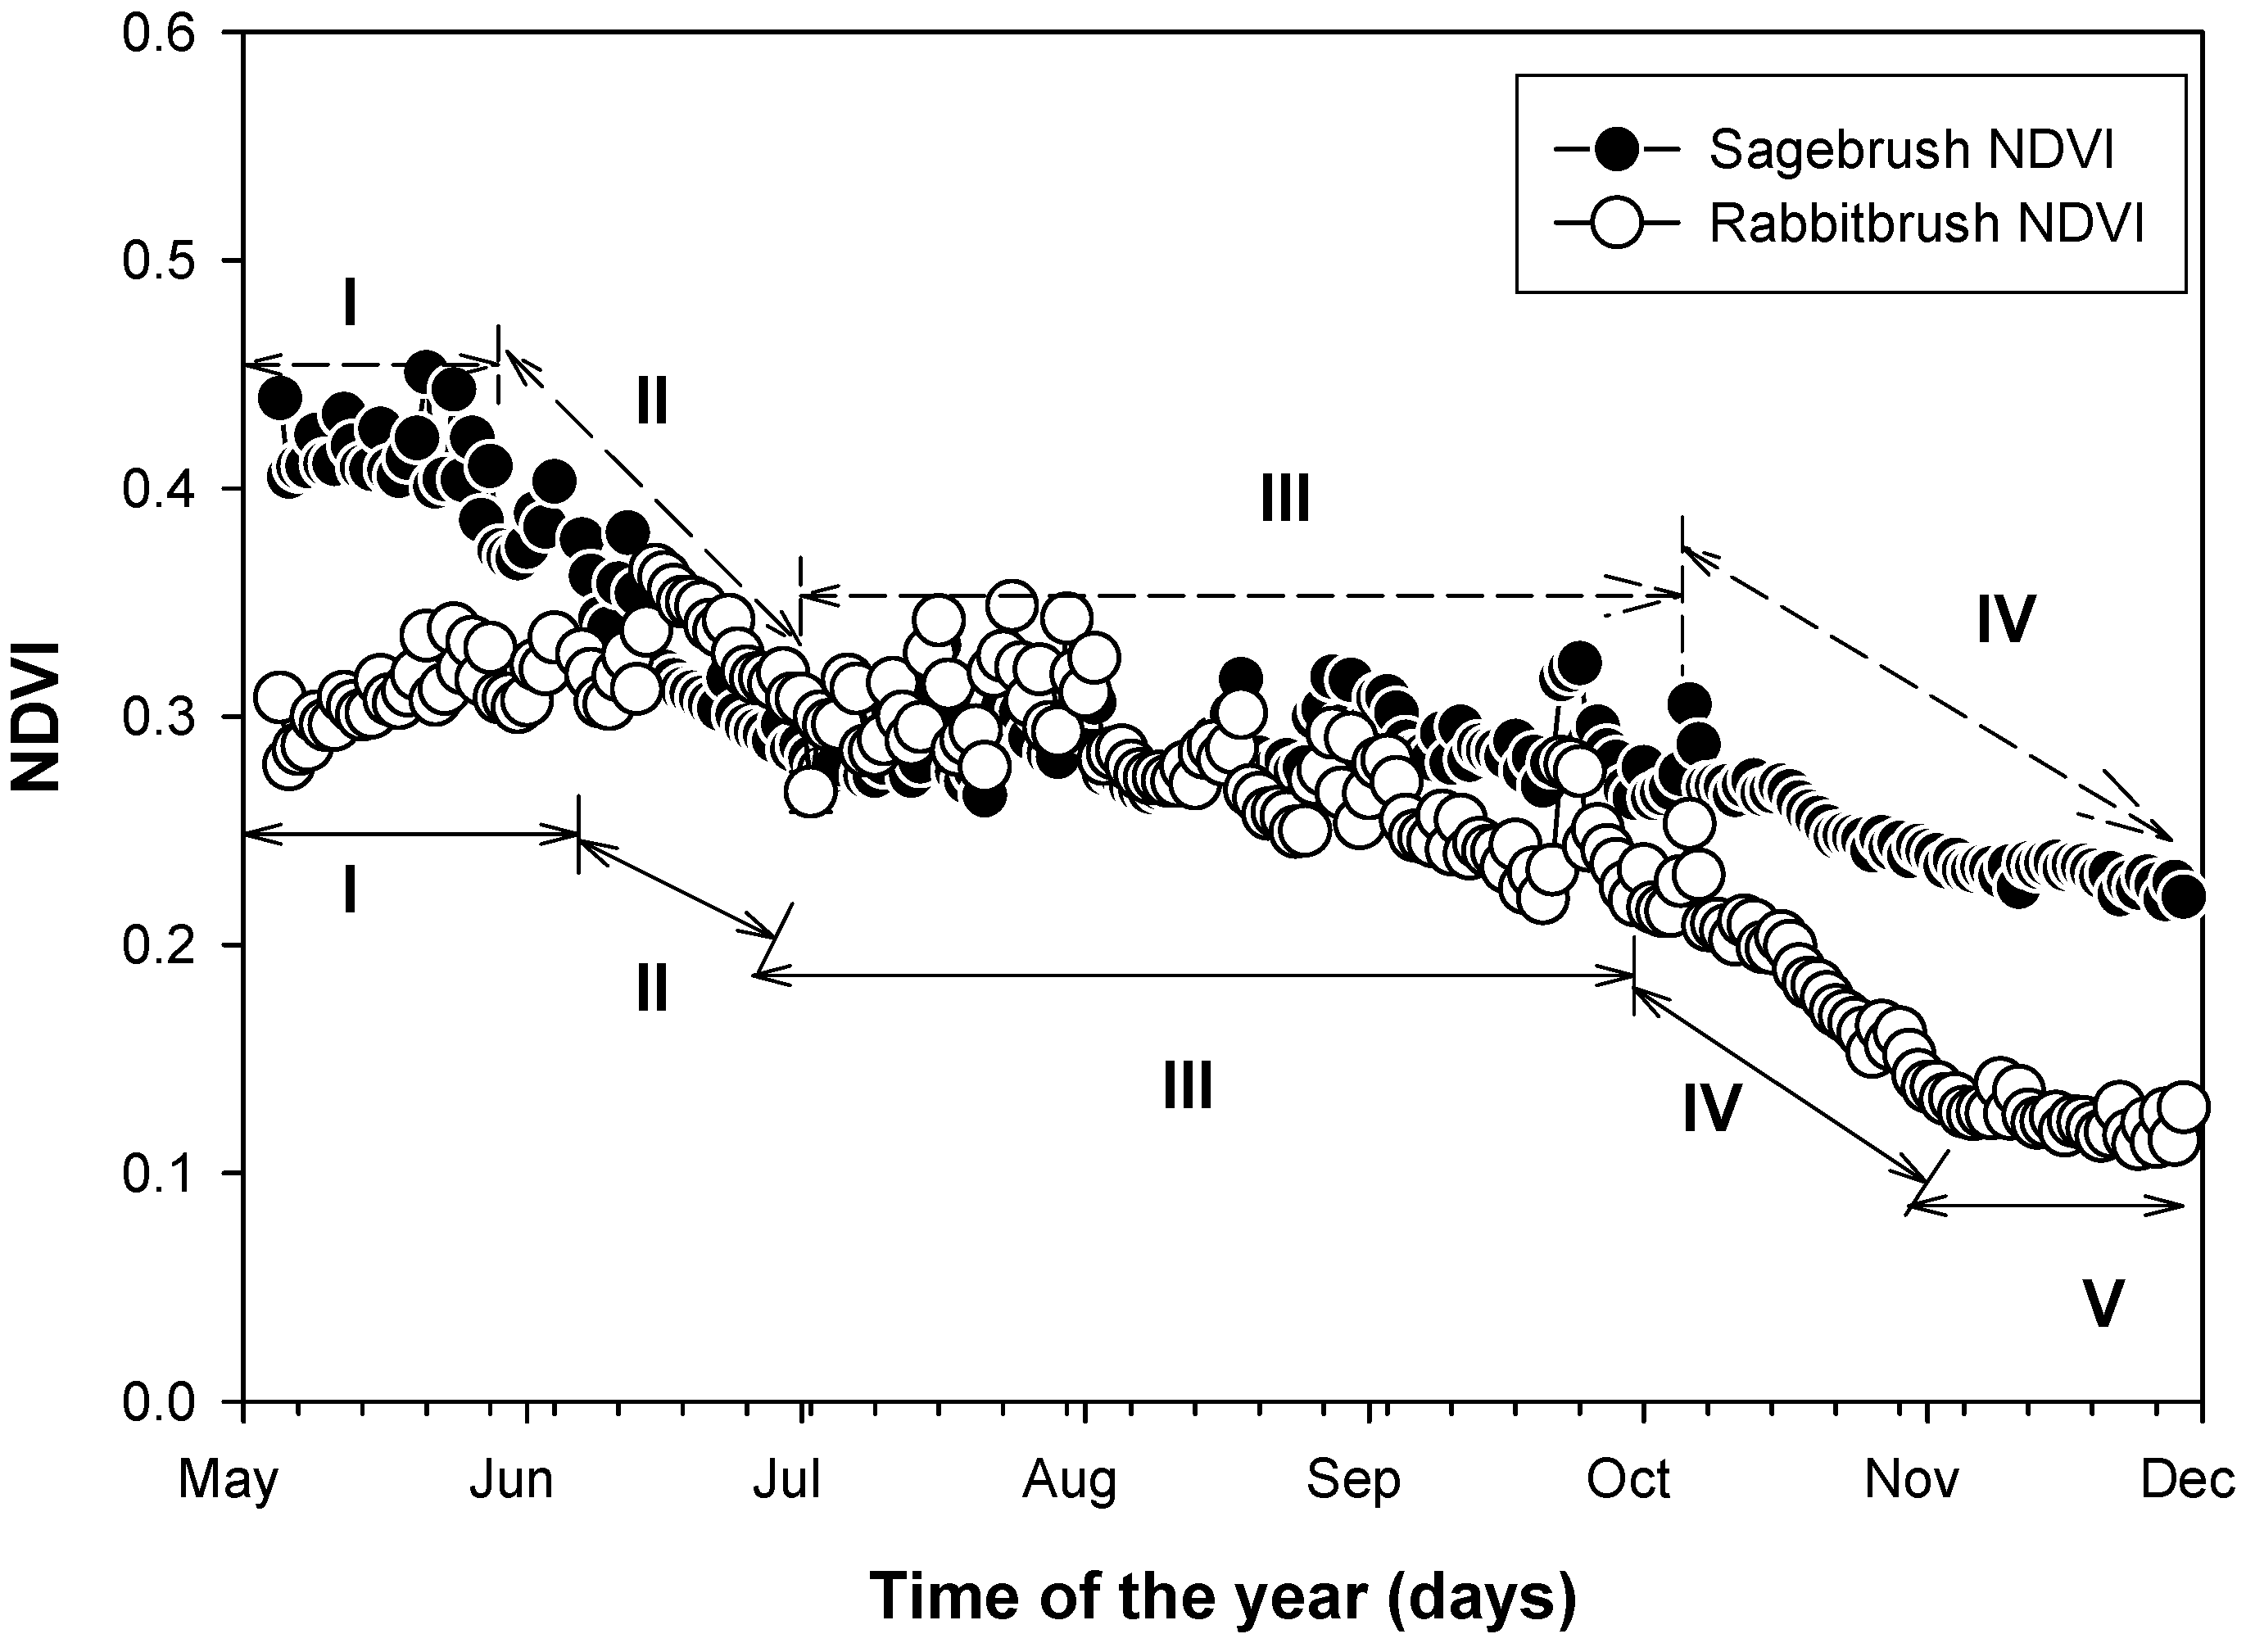
A comparison of NDVI between sagebrush and rabbitbrush for the period from May to November revealed four distinct phenological phases for sagebrush and five distinct phases for rabbitbrush (
Figure 4). Sagebrush NDVI values were between 1.2 and 1.4 fold higher than rabbitbrush during the spring period (May to early-June) represented here as phase (I). During phase (II) sagebrush NDVI showed a gradual decline from 0.39 to 0.28 from June 5 to July 10 indicating a downward adjustment entering the summer period. In the case of rabbitbrush, phase (II) was relatively shorter than sagebrush (June 15 to July 2) but indicated the same type of downward adjustment prior to the peak summer period. During this shorter time period, rabbitbrush NDVI values declined from 0.36 to 0.27. Phase (III) was a period associated with relatively unchanging NDVI values for both sagebrush and rabbitbrush, ranging between 0.27 and 0.29 (July 3/11–October 10) except for the few peaks which occurred mainly in July following rainfall events.
Figure 4.
Time series of average midday (11:30-13:30h) NDVI values of a single sagebrush plant and a single rabbitbrush plant at Spring Valley 1 site. Data were acquired from May 5 to November 30, 2007. I: active growth and canopy development (May 5–June 4 for sagebrush) and (May 5–June 14 for rabbitbrush); II: downward adjustment entering summer period (June 5–July 10 for sagebrush) and (June 15–July 2 for rabbitbrush); III: stable physiological status during summer period (July 11–October 7 for sagebrush) and (July 3–October 7 for rabbitbrush); IV: downward adjustment entering winter period (October 8–November 30 for sagebrush) and (October 8-November 4 for rabbitbrush); V: leaf senescence phase (November 5–November 30 for rabbitbrush).
It is worth noting that rabbitbrush produced bright yellow flowers (from August through October) causing reflectance in the red regions of the electromagnetic spectrum to increase leading to lower NDVI values. However, in the remaining period (early-October and late-November) depicted as phase (IV), sagebrush which is an evergreen plant, revealed a very slow decline in NDVI values, maintaining significantly higher values (~0.24) during this early winter period. Whereas, in phase (IV), rabbitbrush NDVI continued to show a steady and clear decline to reach a value of 0.13 by mid November indicating a further downward adjustment as the plants entered early winter. Contrary to sagebrush, the NDVI time-series for rabbitbrush revealed one additional phenological stage (V) starting around mid-November. This stage had low and relatively unchanging NDVI values (~0.12) associated with the plants entering a period of full senescence (
Figure 4).
The calculated area under the curve for sagebrush and rabbitbrush for the experimental period between May and September (same time period reported for greasewood) produced cumulative NDVI values of 44.8 and 41.0, respectively (data not shown) which were significantly lower than that reported for greasewood.
3.2. Comparing Soil NDVI Trends between the Two Sites
Bare soil produced very low NDVI values ranging from less than 0.01 to 0.12 (
Figure 5). There was a small but significant difference in NDVI values between the two undisturbed soil surfaces observed for the entire experimental period. The NDVI soil values were significantly lower than those observed with the different plant species as previously described (
Figure 2,
Figure 3 and
Figure 4).
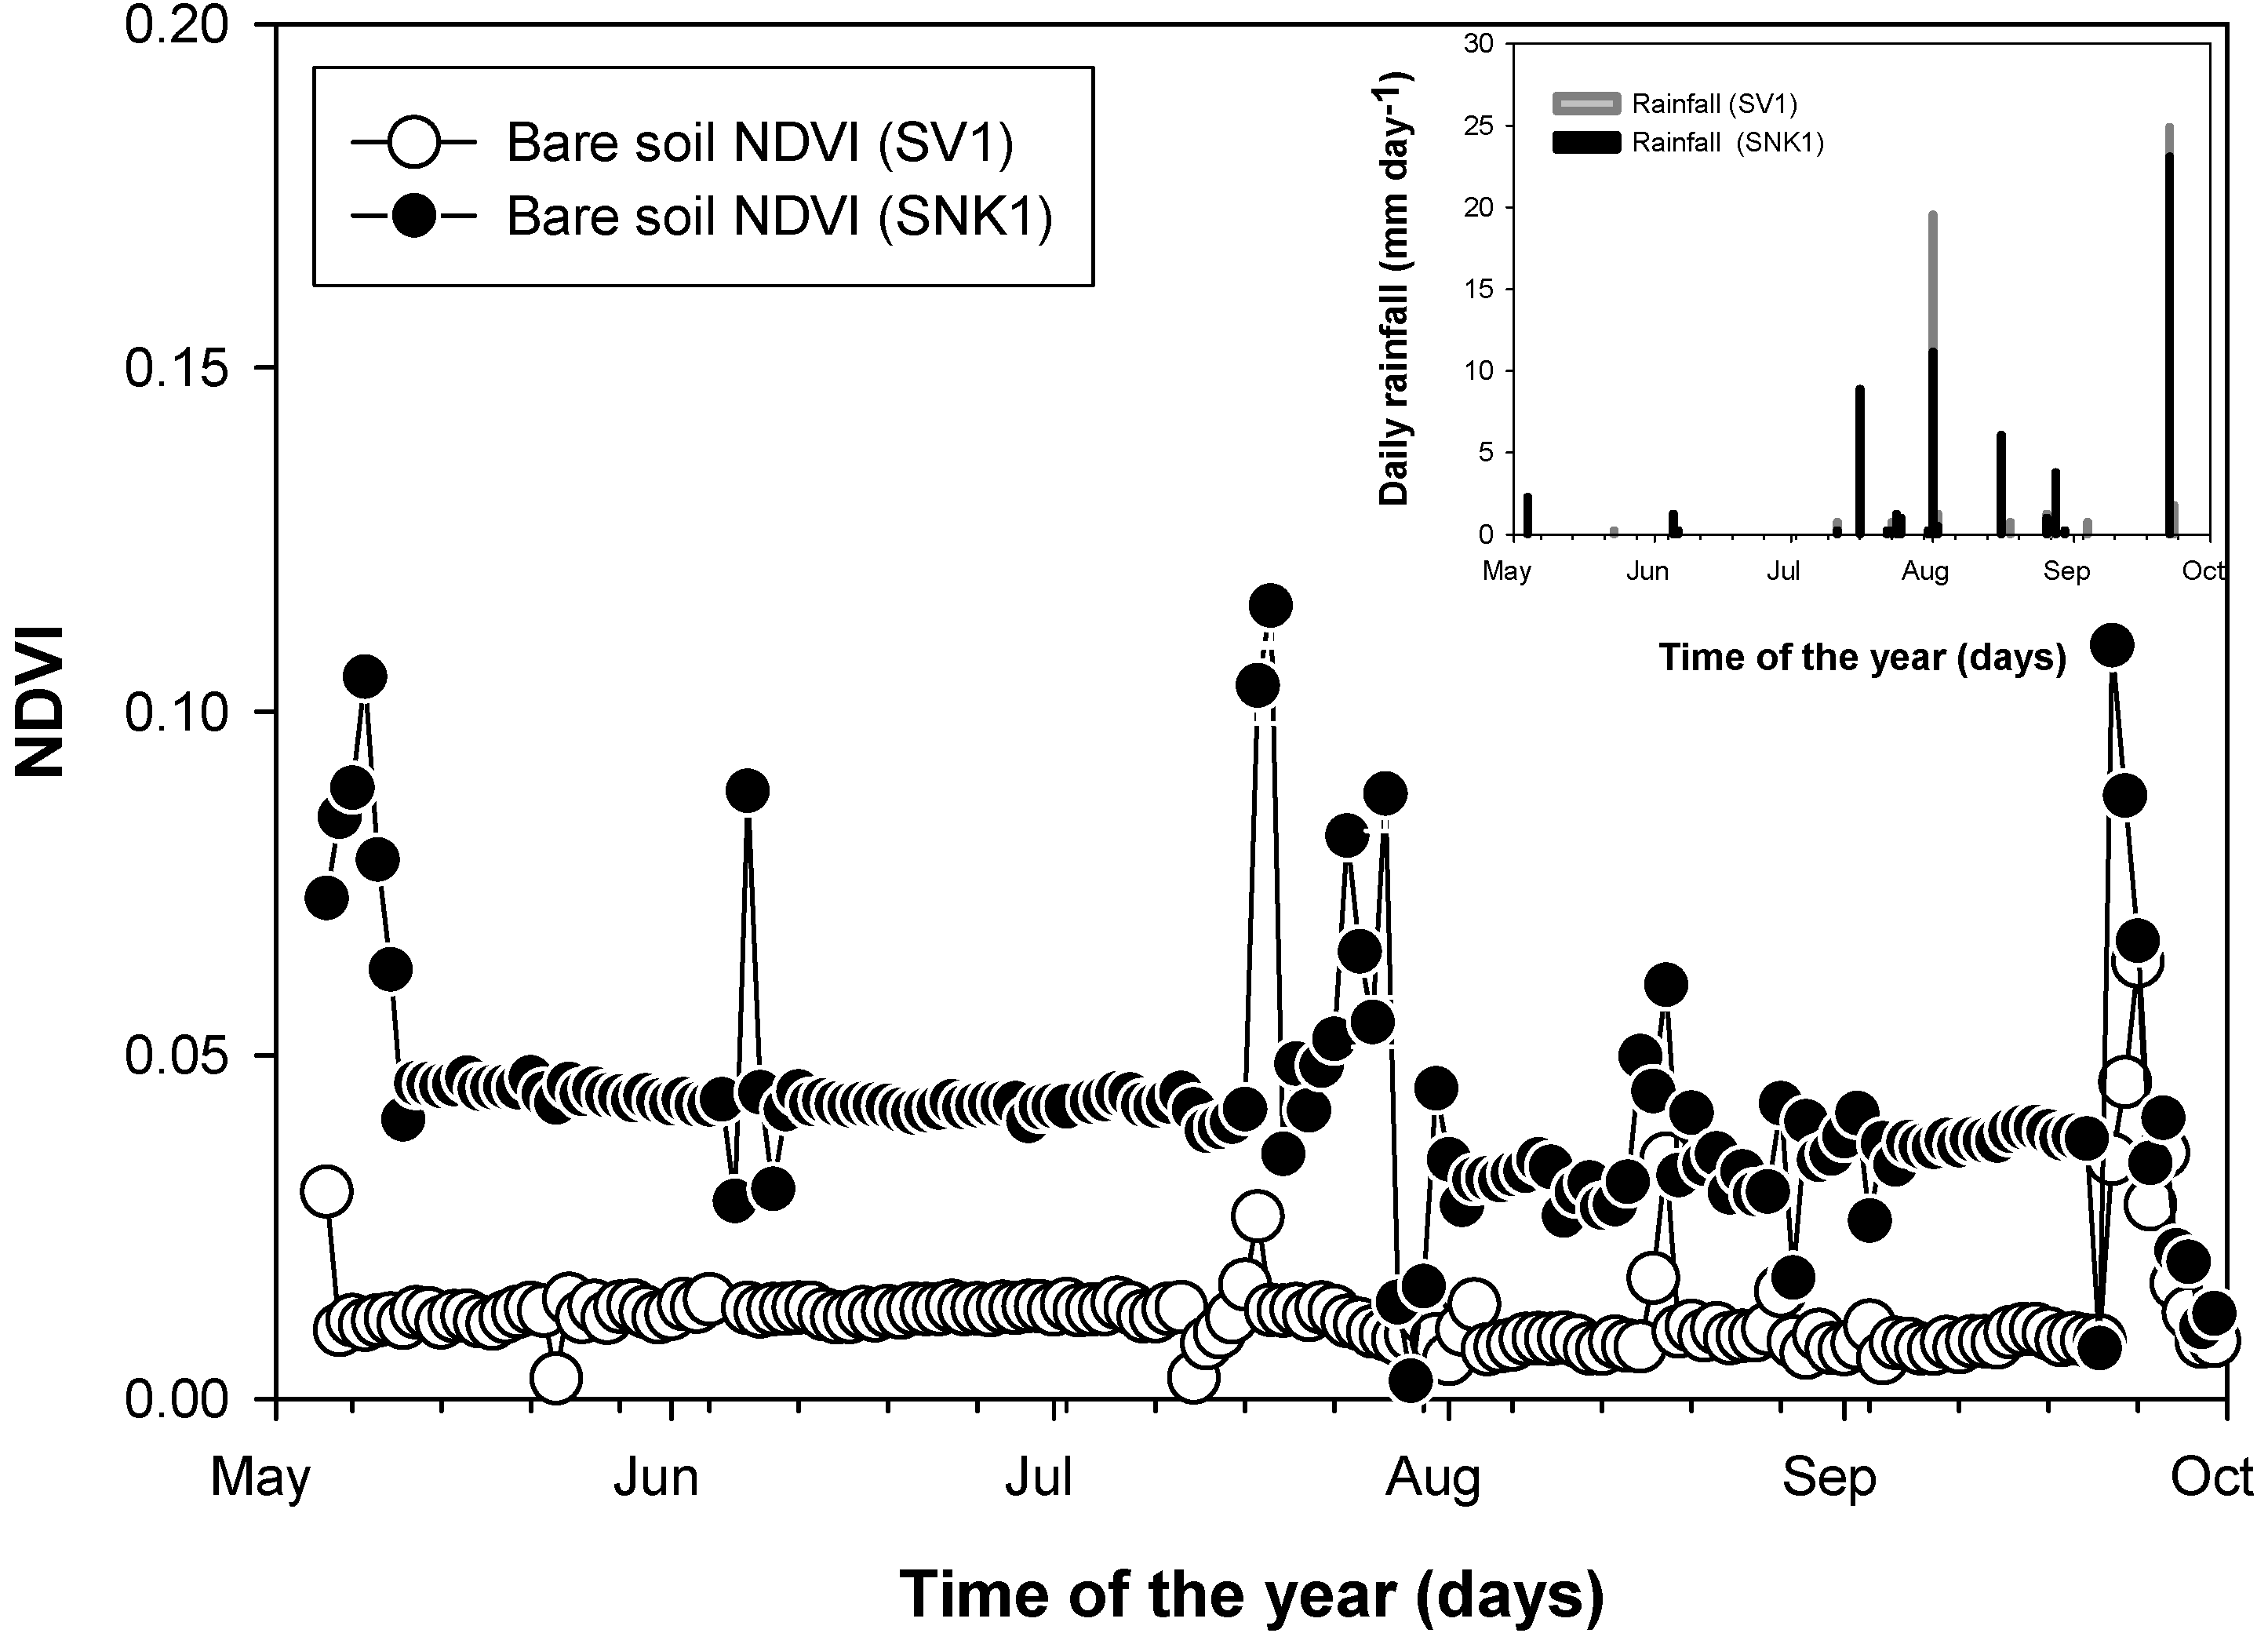
Figure 5.
Time series of average midday (11:30-13:30h) NDVI values of a bare soil surface at Spring Valley 1 site and at Snake Valley 1 site. Data were acquired during the experimental period from May 5 to September 30, 2007. Average daily rainfall data acquired from a weather station at the two sites are illustrated for the same experimental period.
NDVI values were lower for the loamy sand soil (SV1 site) than for the loamy soil (SNK1 site) indicating that spectral reflectance properties of soils vary based on their surface characteristics such as texture (85.2% sand at SV1
vs. 42.6% sand at SNK1 (influence on moisture holding capacity)) and color (SV1 10YR 7/2 Light Grey, SNK1 10YR 6/3 Pale Brown). NDVI values showed some very pronounced peaks with different magnitudes throughout the experimental period associated with rainfall events, especially those that occurred on the same date at the two sites: June 5, July 11, 16 and 23; August 1, 2, 16, and 26 and on September 22 (
Figure 5).
Most of the NDVI peaks at the SV1 site were either smaller or less pronounced than those observed at the SNK1 site, except during the period of September 22, when higher rainfall amounts (24.89 mm day−1) were recorded at the SV1 site. The soil NDVI peaks from the SNK1 site, usually lasted for a longer period of time following a rainfall event, while the NDVI peaks at the SV1 site typically disappeared after only a day or two. These differences in NDVI values were due to the differences in spectral reflectance properties between dry and wet soils, with wet soils having lower visible and NIR reflectance than dry soils.
3.3. Correlations between Ground-based NDVI and Soil-Plant Measurements
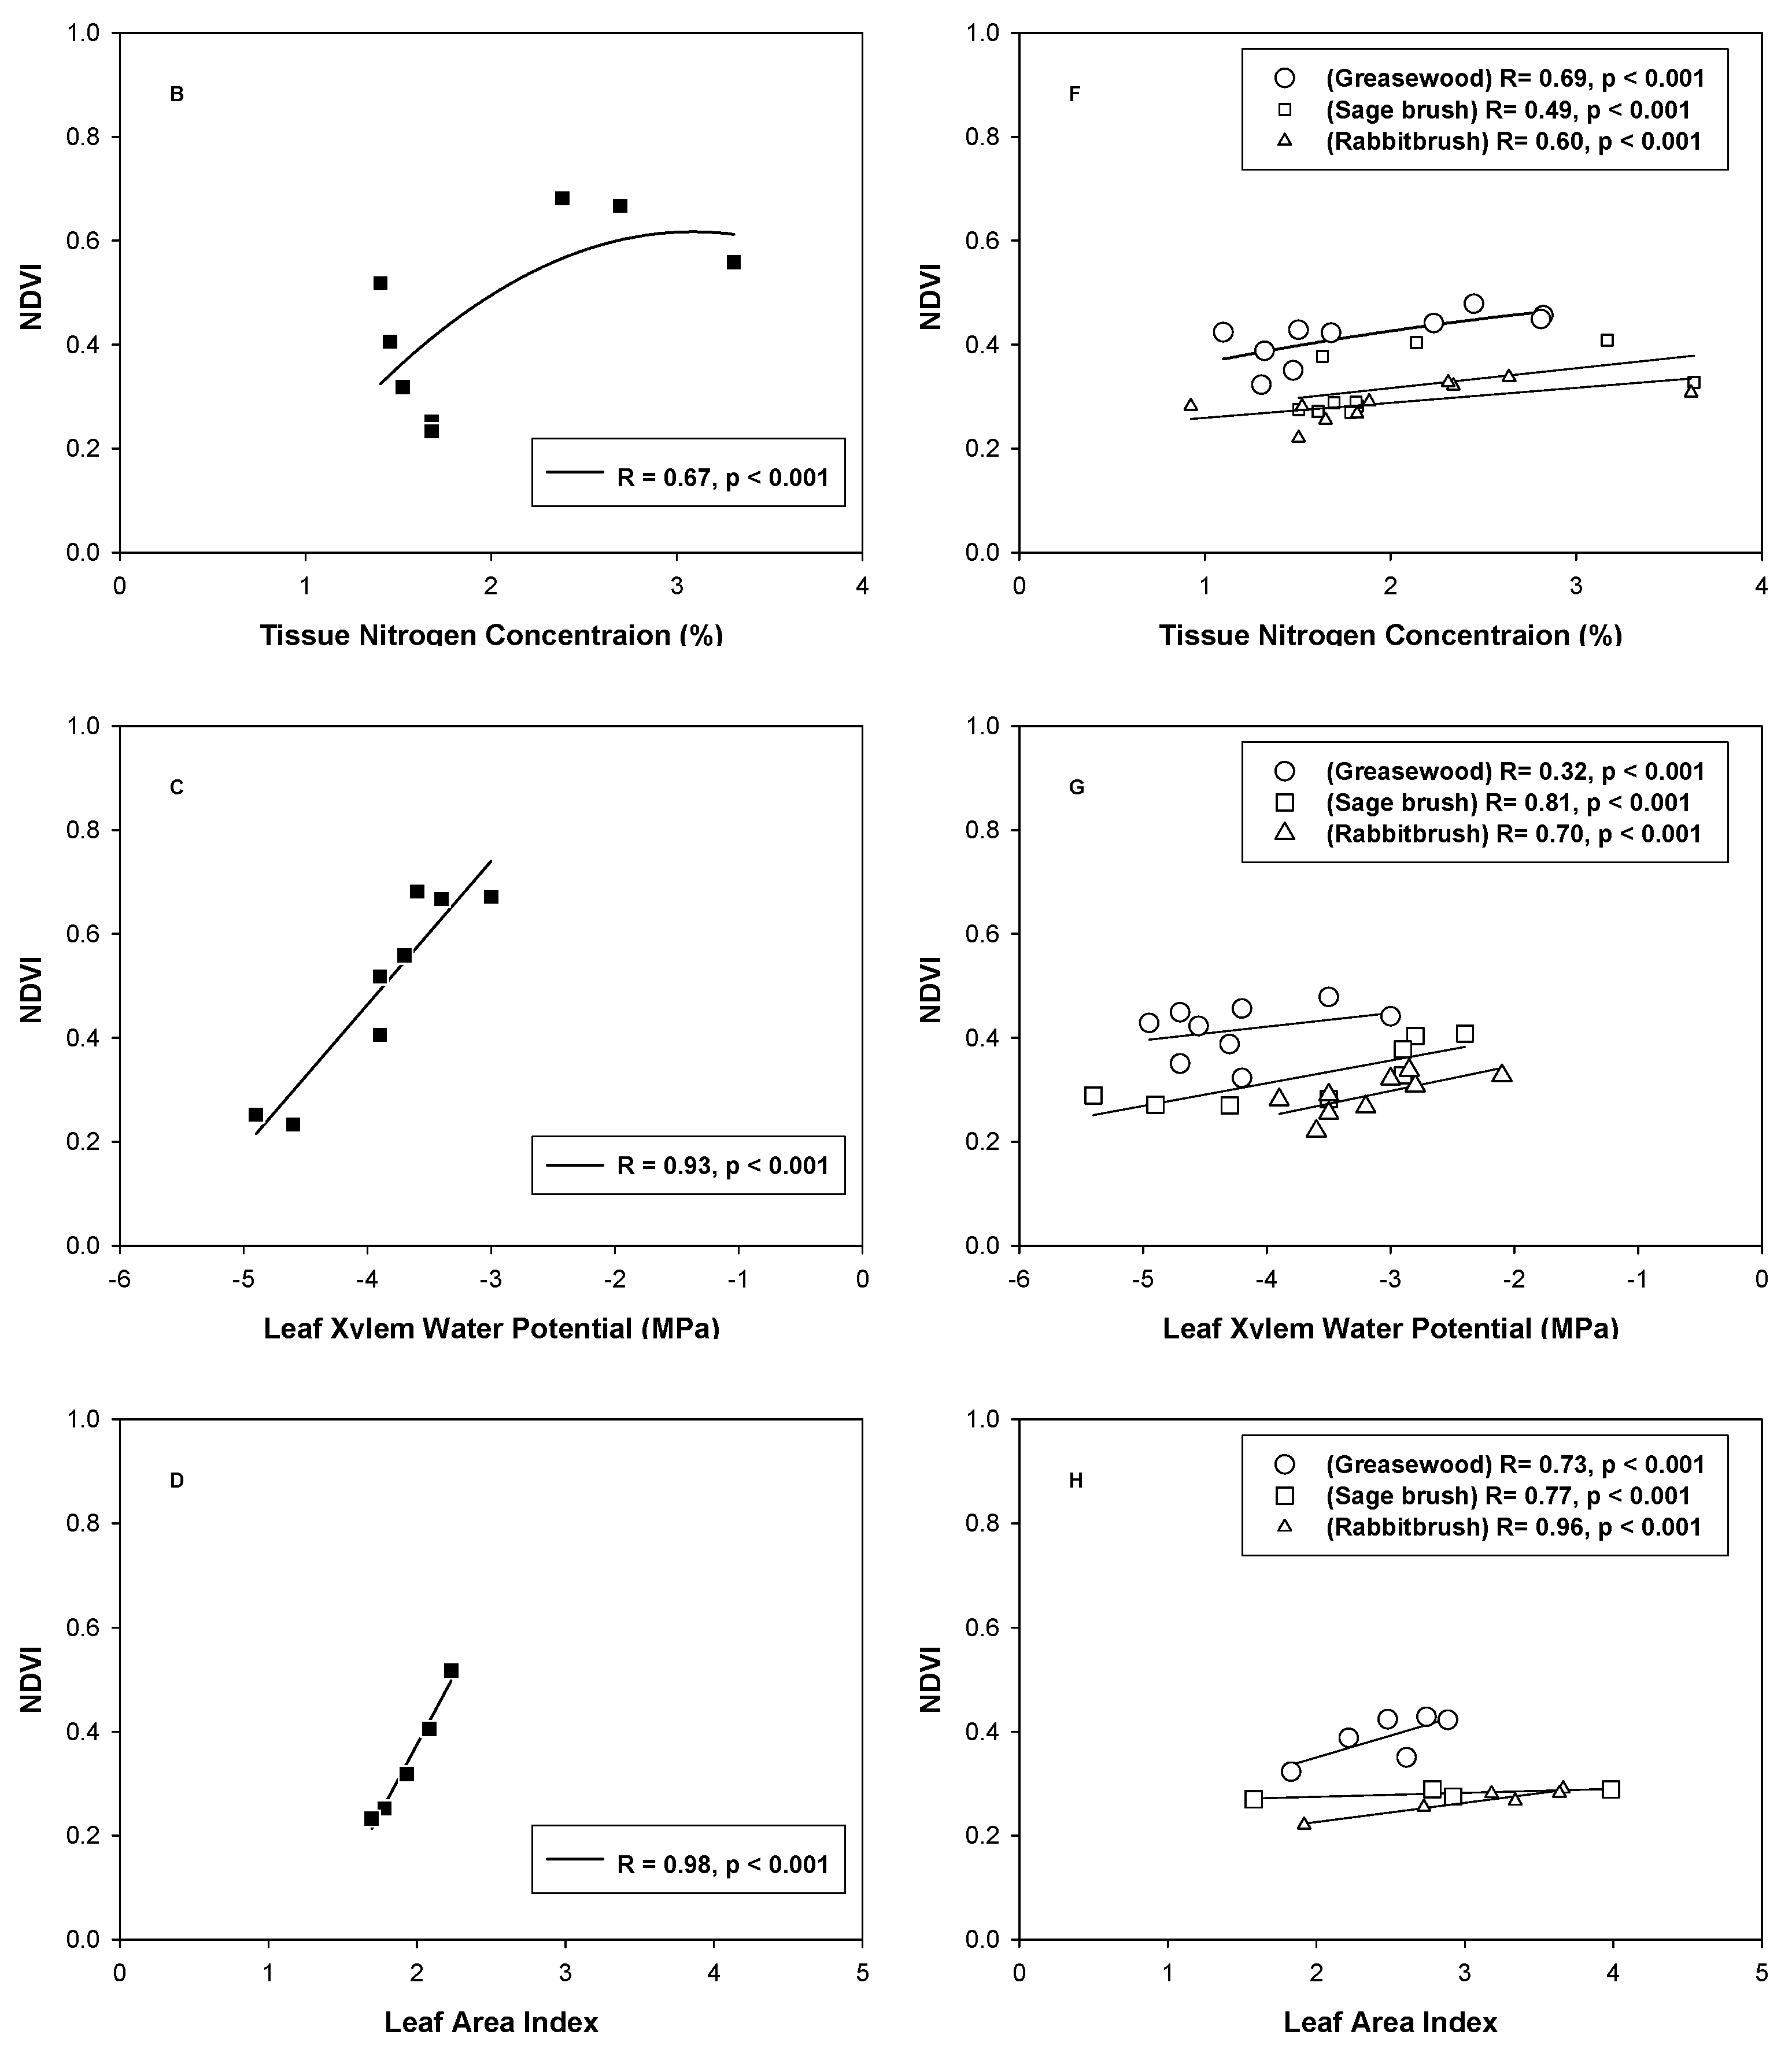
Linear and curvilinear relationships found between the ground-based calculated NDVI and the plant physiological and biophysical parameters measured during this study are illustrated in
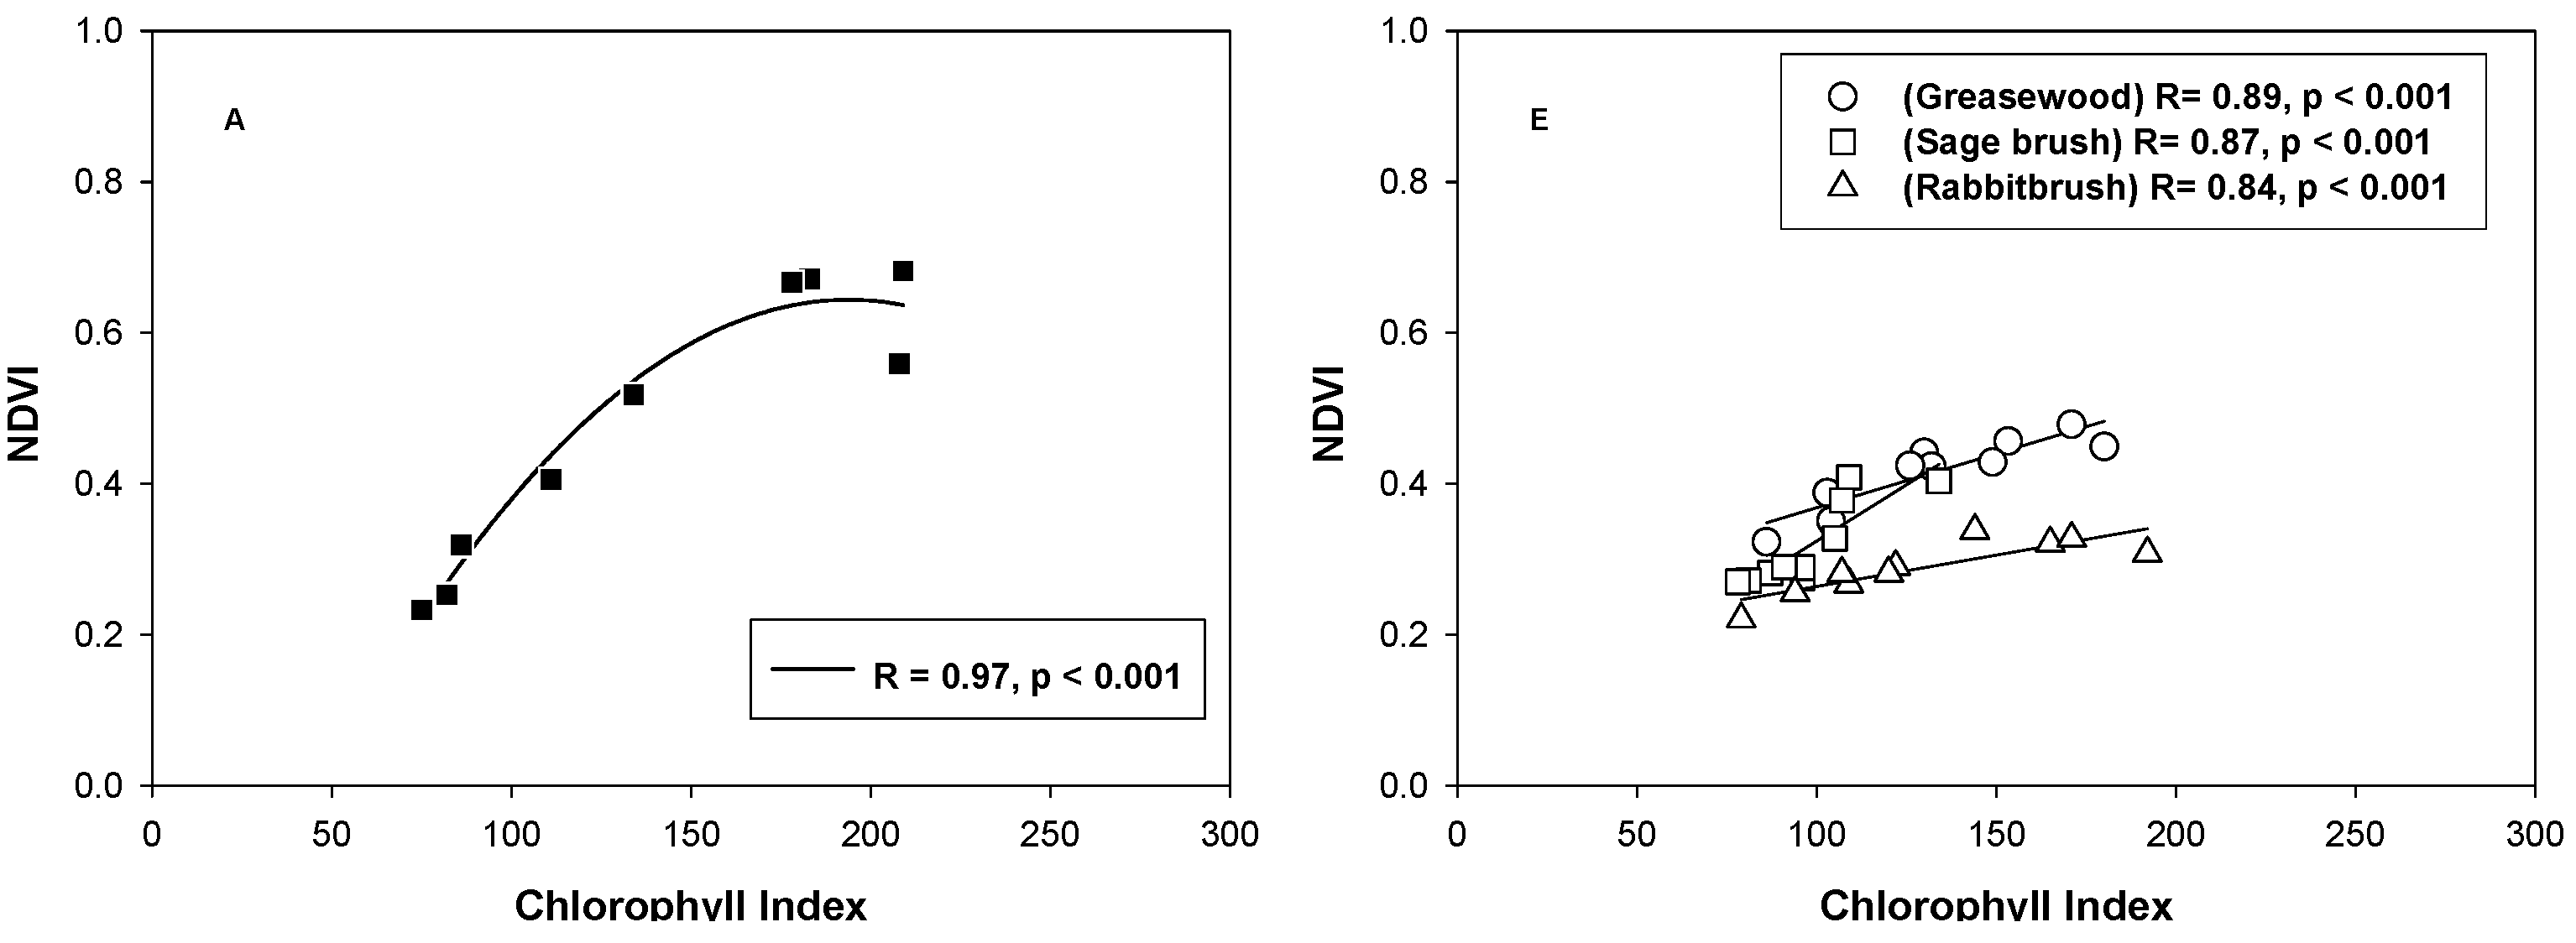
Figure 6. The correlations between greasewood NDVI at the SNK1 site with plant parameters were higher than those demonstrated for the SV1 site, except for tissue nitrogen concentration (TN). At the SNK1 site, greasewood NDVI showed a very strong correlation with the chlorophyll index (
r = 0.97,
P < 0.001), (
Figure 6A) and a significant relationship with TN (
r = 0.67,
P < 0.001), (
Figure 6B). In both cases, the relationship was curvilinear suggesting that NDVI saturated (~0.67) at canopy chlorophyll index values higher than 178 and TN higher than 3 % (NDVI ~0.56). Greasewood NDVI from the SV1 site did not show the same saturation effect or the same curvilinear relationships, as greasewood canopies were not as green (field observations) at the SV1 site compared to the SNK1 site. Chlorophyll index highly correlated with NDVI (
r: 0.89,
P < 0.001) (
Figure 6E) while TN showed a moderate correlation with the same variable (
r: 0.69,
P < 0.001), (
Figure 6F) at the SV1 site.
Figure 6.
Comparison of plant measurements relationships with SKR-1800 NDVI values between the Snake Valley 1 site (left panel: A, B, C and D) and the Spring Valley 1 site (right panel: E, F, G and H).
Figure 6.
Comparison of plant measurements relationships with SKR-1800 NDVI values between the Snake Valley 1 site (left panel: A, B, C and D) and the Spring Valley 1 site (right panel: E, F, G and H).
A strong correlation existed between NDVI and leaf xylem water potential (Ψ
ω) at the SNK1 site (
r = 0.93,
P < 0.001) with NDVI values declining from 0.67 to 0.25 as Ψ
ω declined from −3 MPa to −4.9 MPa (
Figure 6C). However, at the SV1 site, a very poor correlation was found between NDVI and Ψ
ω (
r = 0.32) for greasewood (
Figure 6G). When greasewood LAI was correlated with NDVI, the linear regression yielded an excellent correlation at the SNK1 site (
r = 0.98,
P < 0.001), (
Figure 6D) but only a moderate correlation at the SV1 site (
r = 0.73,
P < 0.001), (
Figure 6H). However, it should be noted that the LAI data set was small, representing only the later phases of growth (July–September).
When the relationships between plant parameters and NDVI were investigated for sagebrush and rabbitbrush at the SV1 site, sagebrush NDVI correlations were always higher than rabbitbrush (
Figure 6) except for LAI (
r of 0.96 for rabbitbrush and
r: 0.77 for sagebrush;
Figure 6). However, estimating LAI was problematic in the case of rabbitbrush due to its canopy architecture characterized by erect, dense branching that made it difficult to obtain accurate leaf area index estimations.
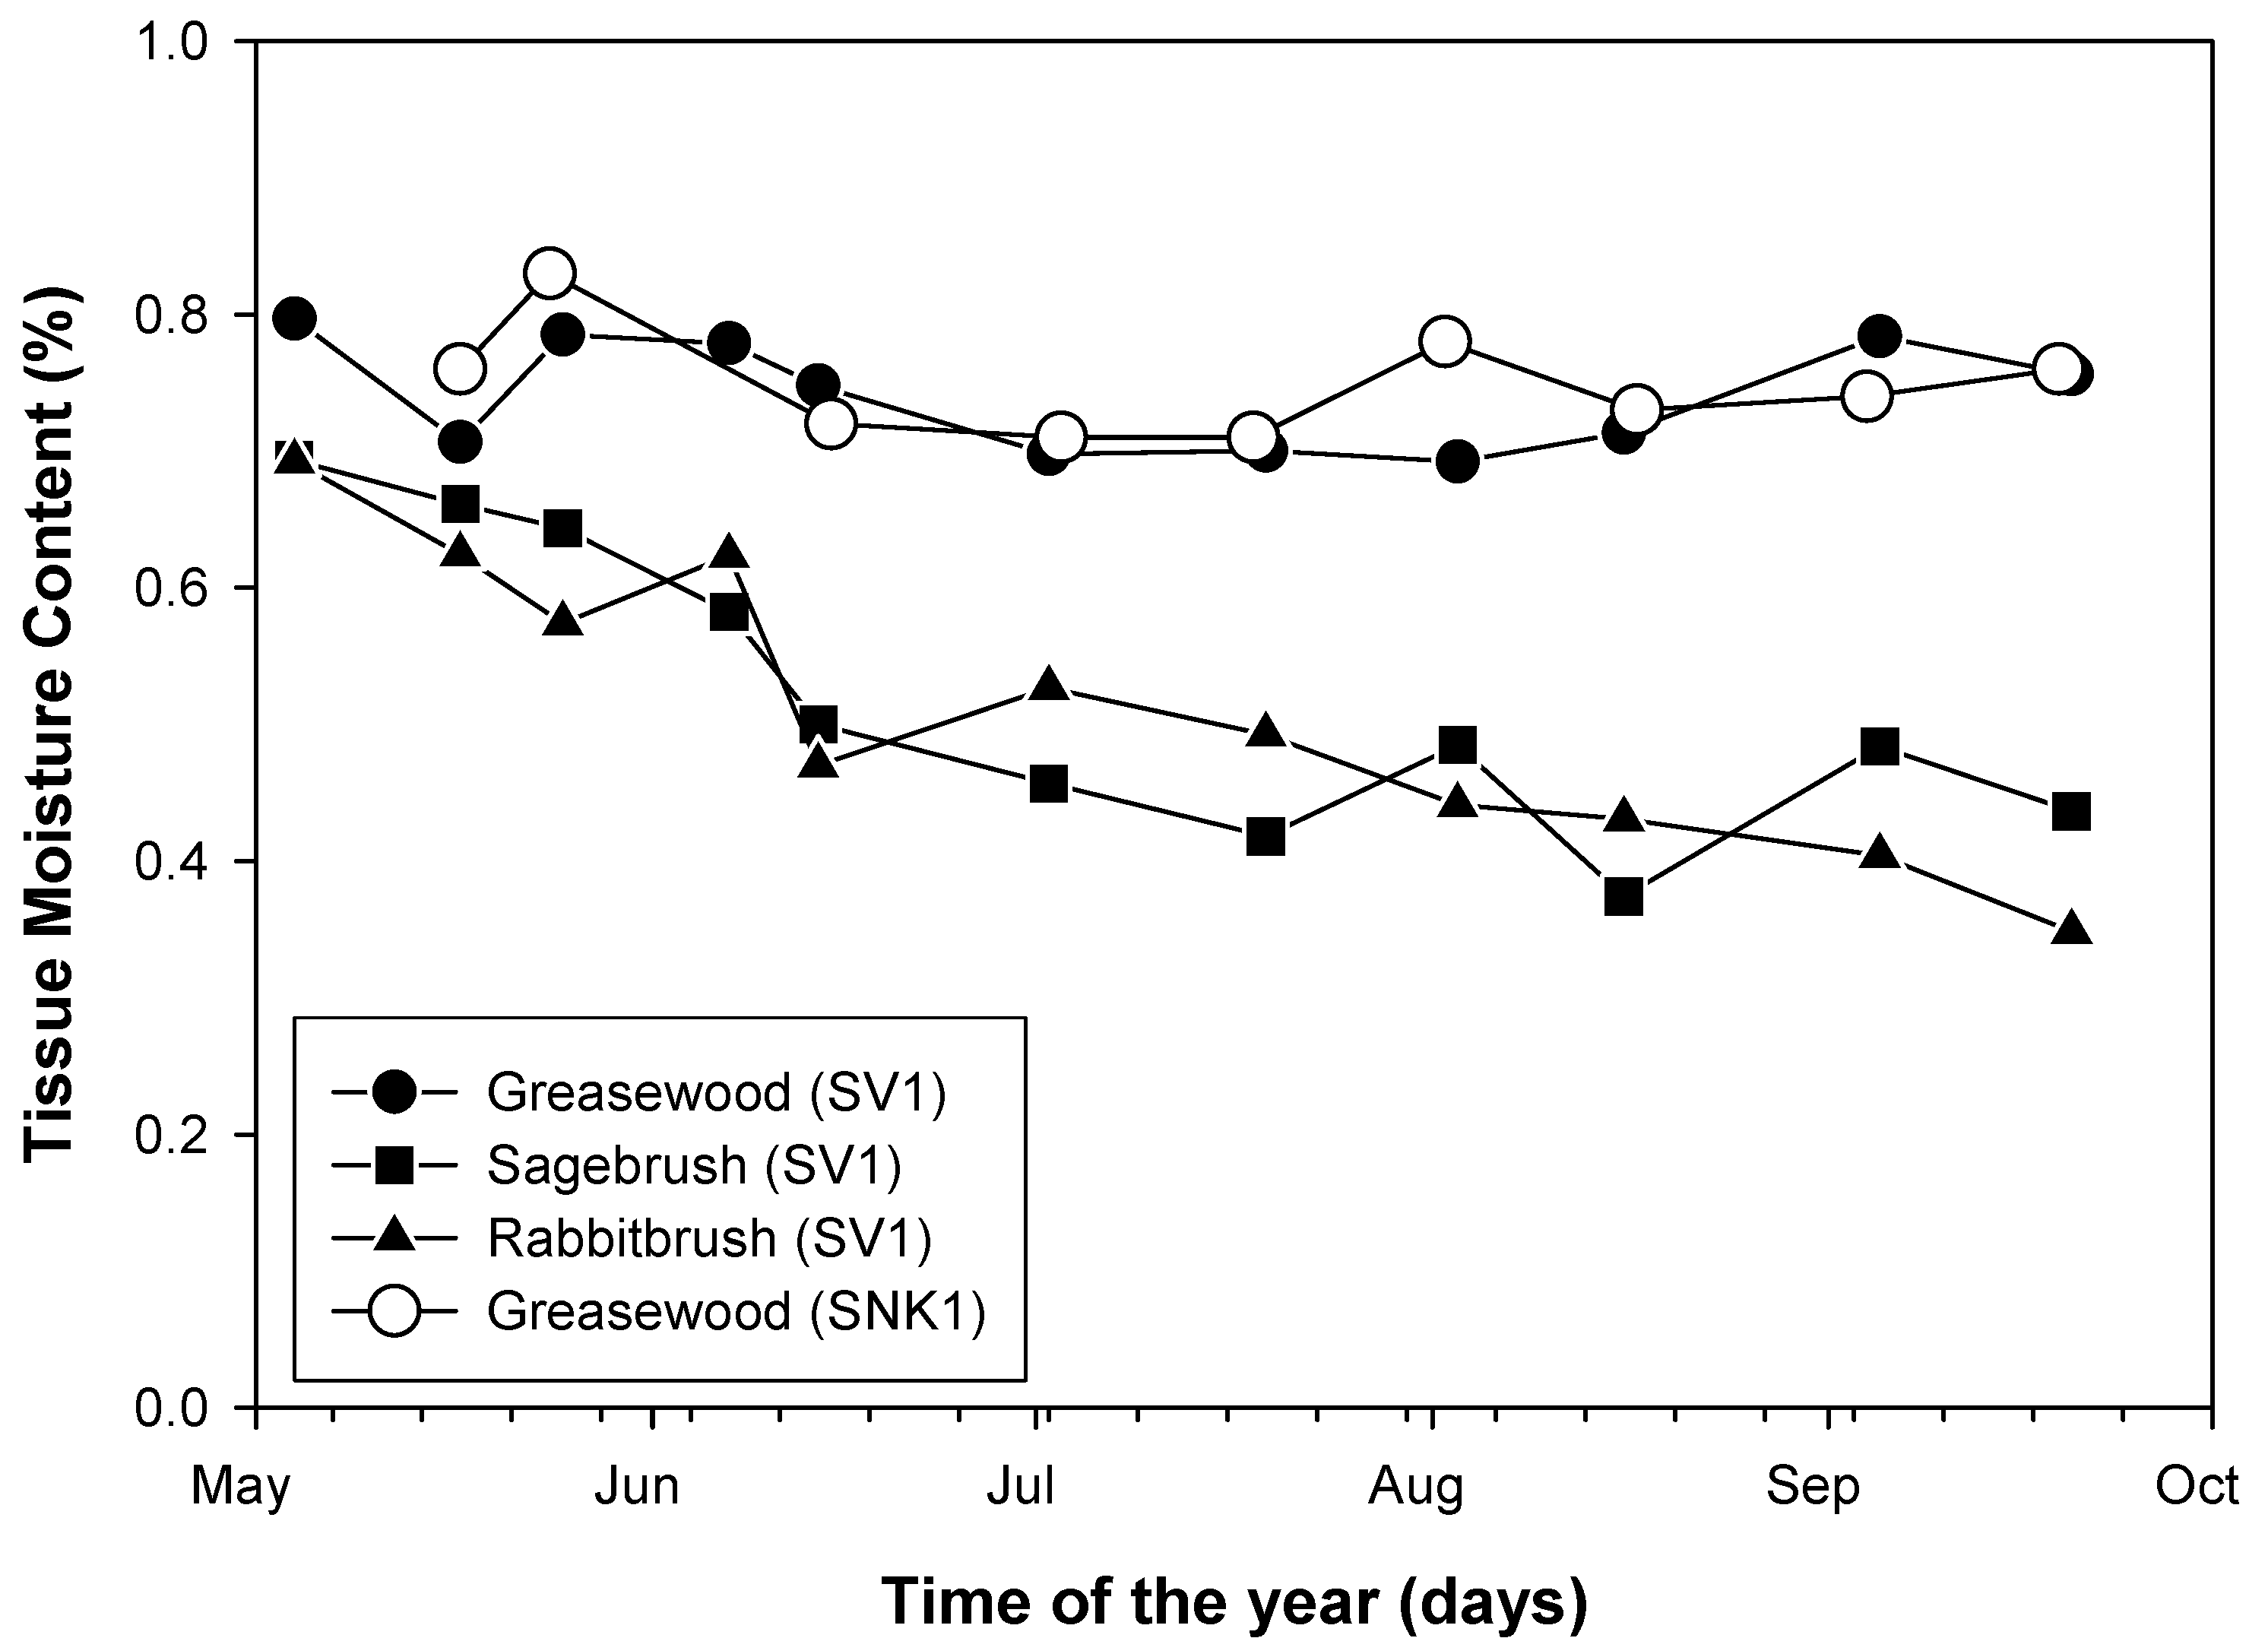
NDVI and tissue moisture content were significantly correlated for sagebrush (
r = 0.93,
P < 0.001) and rabbitbrush (
r = 0.73,
P < 0.001). Whereas, a non significant correlation was observed between TM and greasewood NDVI (
r < 0.35) at both sites (data not shown). At the SV1 site and the SNK1 site, greasewood TM values remained quite stable for the entire experimental period (May-September), (
Figure 7). However, sagebrush and rabbitbrush TM values showed a consistent decline over time from values as high as 0.69 at the beginning of May to values as low as 0.45 and 0.35, respectively by late September. Greasewood, a halophyte has succulent leaves, whereas the two other species are glycophytes with non-succulent leaves. Hence, greasewood TM values remained high and changed little over time (~0.75%). During the same period, greasewood NDVI values showed a steady decline between May and September (
Figure 2 and
Figure 3). Whereas, for sagebrush and rabbitbrush, TM and NDVI values followed the same temporal trend (
Figure 4) resulting in significant correlations.
Figure 7.
Leaf moisture content for greasewood, sagebrush and rabbitbrush.
Figure 7.
Leaf moisture content for greasewood, sagebrush and rabbitbrush.
In all cases, no significant correlations were found between NDVI and Canopy-air temperature differentials Tc − Ta as well as between NDVI and surface soil water content. TDR measurements did not show any clear or significant change in soil moisture content at various depths over time (data not shown). However, at the shallow surface (5 cm), soil moisture content responded at both sites to rainfall events.
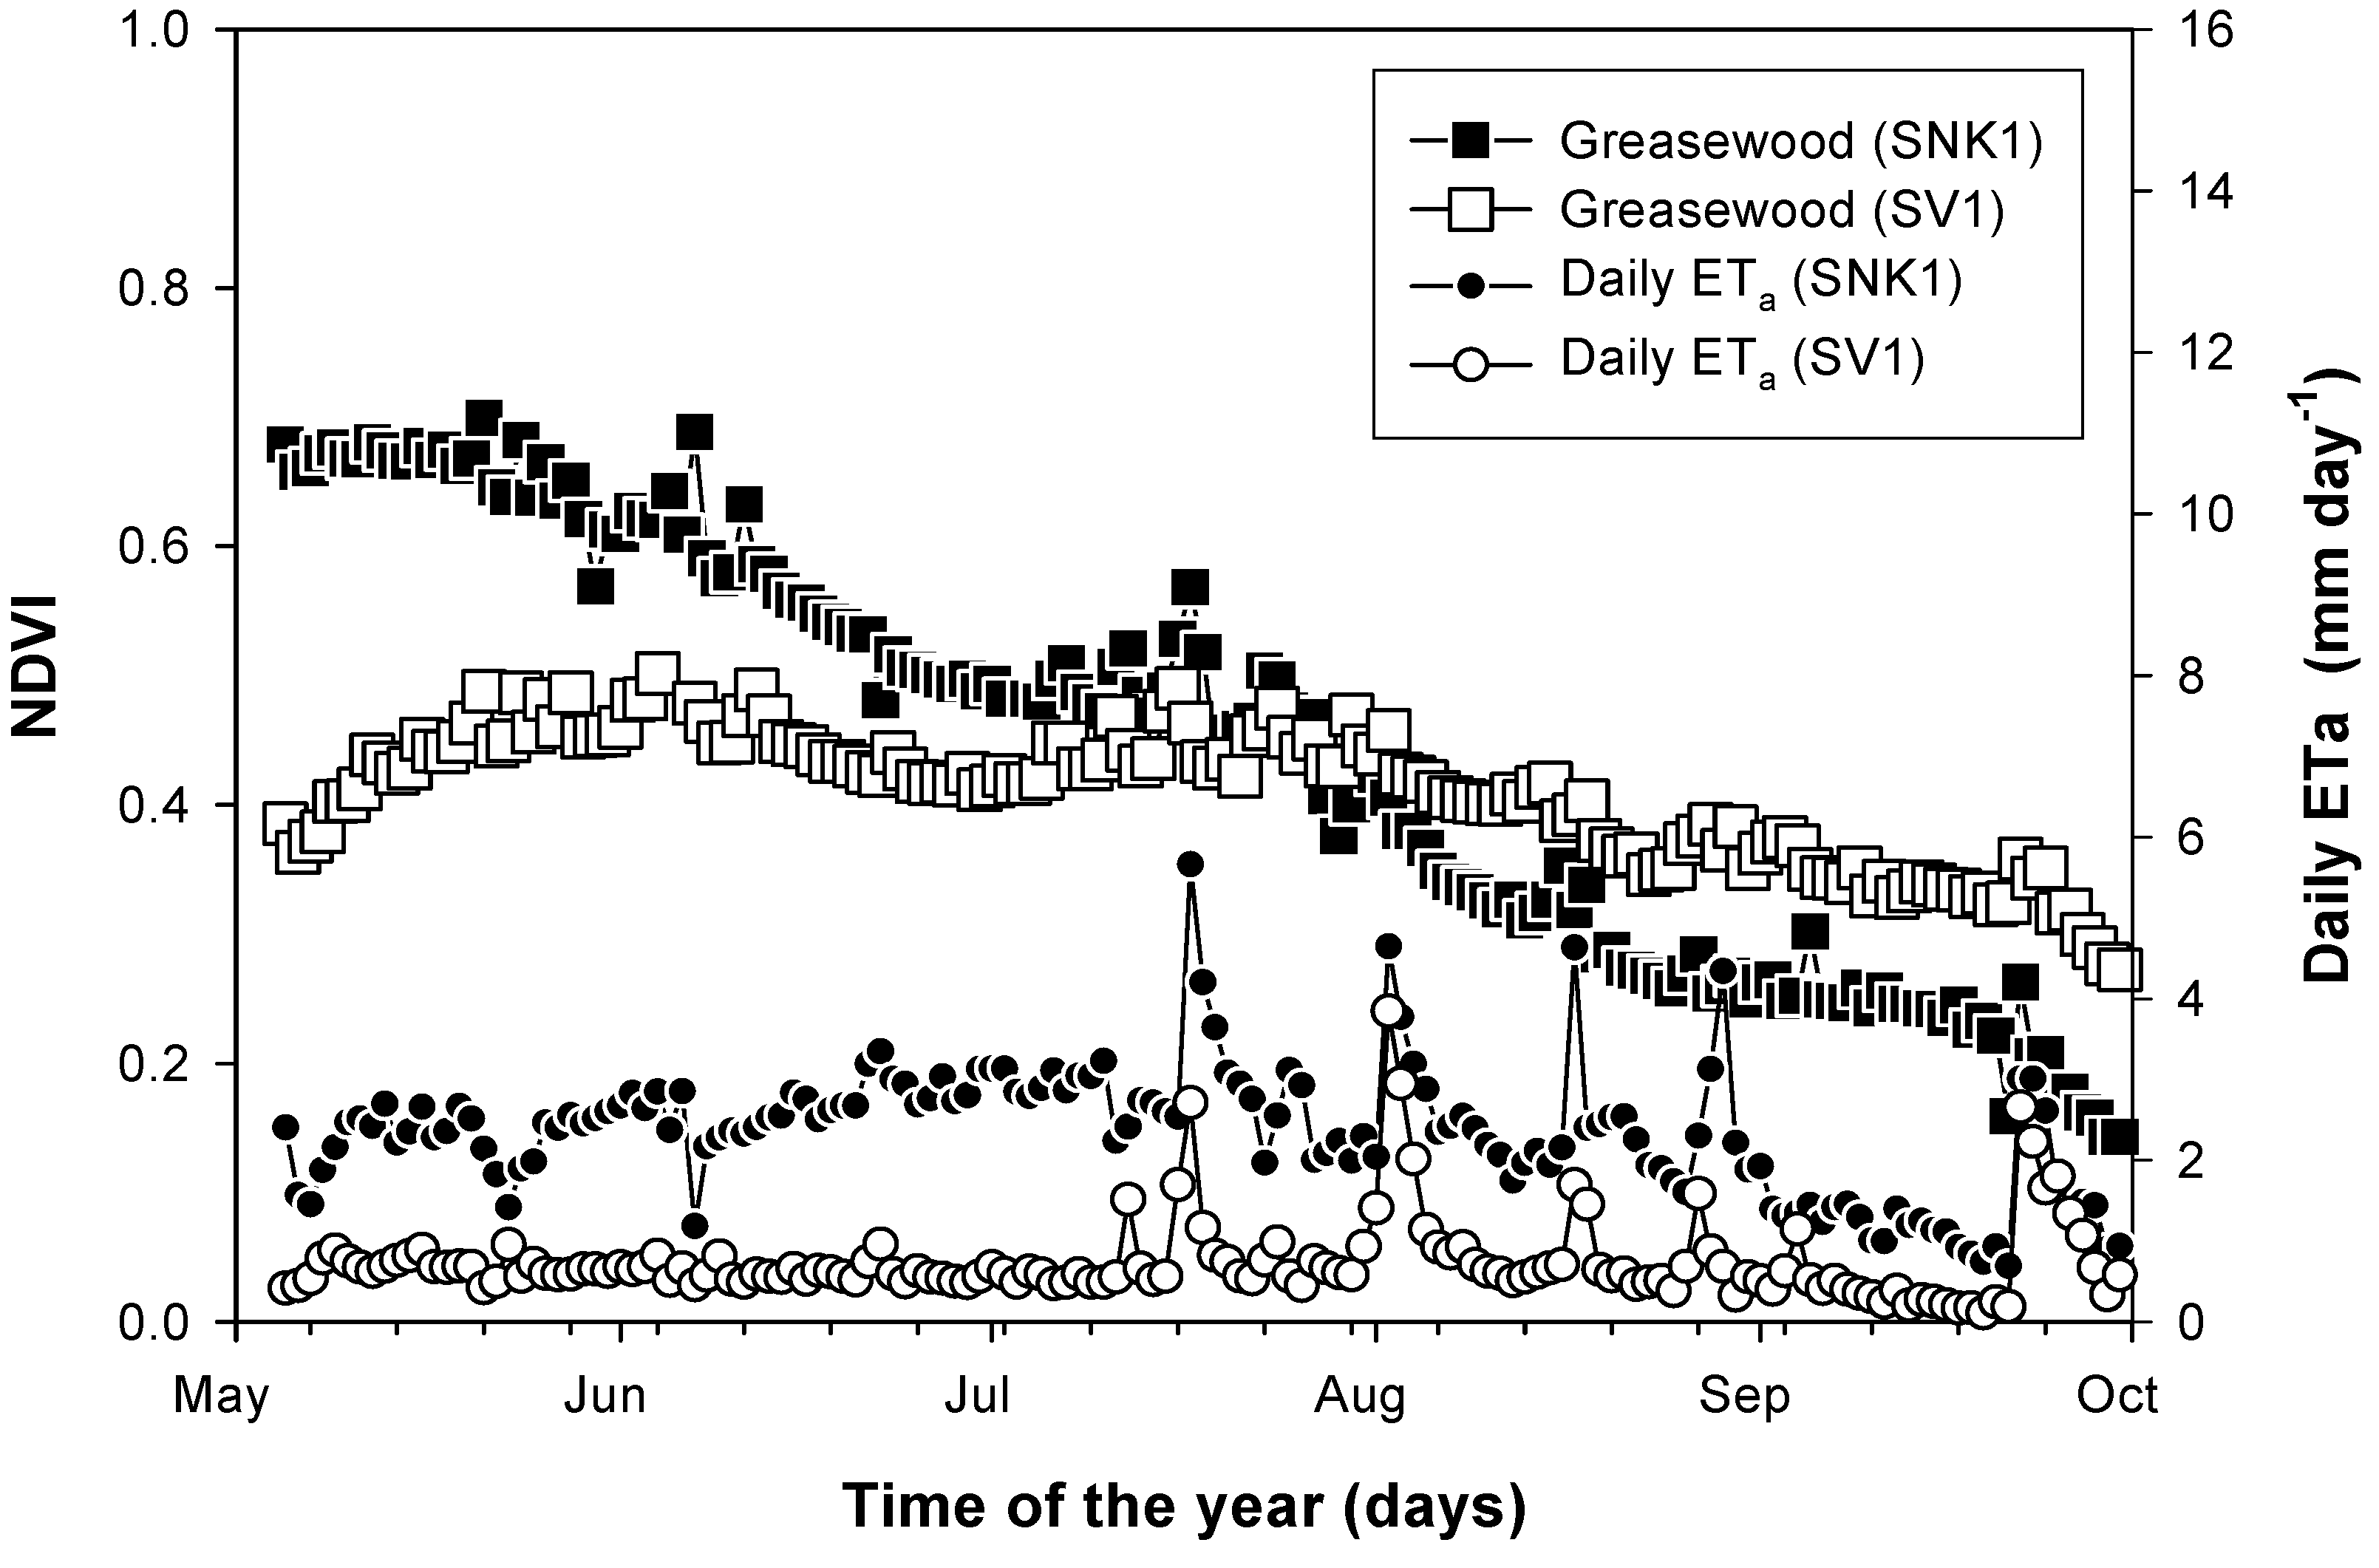
3.4. Relationship between ETa and Ground-based NDVI
Total cumulative ET
a during the experimental period (May 5 to September 30) was 34.9 cm for the SNK1 site and 11.0 cm for the SV1 site (
Table 2). This significant difference in ET was associated with significant differences in percent vegetation cover.
Table 2.
Major soil-plant and atmospheric characteristics of Spring Valley 1 site (SV1) and Snake Valley 1 site (SNK1).
Table 2.
Major soil-plant and atmospheric characteristics of Spring Valley 1 site (SV1) and Snake Valley 1 site (SNK1).
| Site* | ETo (cm) | Rainfall (cm) | ETa (cm) | Ground water depth (m) | Surface soil texture
sand/silt/clay (%) | Canopy percent cover (%)¶ |
|---|
| SV1 | 79.5 | 6.0 | 11.0 | 4.7 (SD:4.66 ± 0.05) | 85.2/9/5.7 | 19.7 |
| SNK1 | 84.8 | 6.2 | 34.9 | 5.0 (SD:5.0 ± 0.04) | 42.6/34.9/23.1 | 54.9 |
At both sites, the occasional maximum ET values were associated with rainfall events. As shown in
Figure 8, ET values at the SV1 site remained stable and low, showing only minimal fluctuations over time, inferring limited soil evaporation associated with the high sand content in the profile and low transpiration associated with the sparse vegetation at the site. However, in the case of the SNK1 site, ET values were consistently higher than the SV1 site showing a distinct separation between late-spring and early-summer (higher values) and late-summer (lower values).
Figure 8.
Average midday (11:30–13:30) NDVI values and average daily ETa values between May 5 and September 30, 2007. Average midday NDVI values are both for a single greasewood plant from the Snake Valley 1 site (closed squares) and from the Spring Valley 1 site (open squares). Average daily ETa values are from Snake Valley 1 site (closed circles) and from the Spring Valley 1 site (open circles).
ET showed a distinct decline starting from the beginning of August, corresponding to a similar trend shown by greasewood NDVI values (SNK1: r = 0.57, P < 0.001). Although, it is difficult to compare or link eddy covariance ET flux measurements to a single and localized optical measurement from an individual canopy within the tower footprint, it was possible in this particular case to identify some similarities. The relationship between ET and NDVI at one site and not the other site was associated with differences in the vegetative surfaces, where greasewood represented the majority of the canopy cover at SNK1 but only 3% of the canopy cover at SV1.
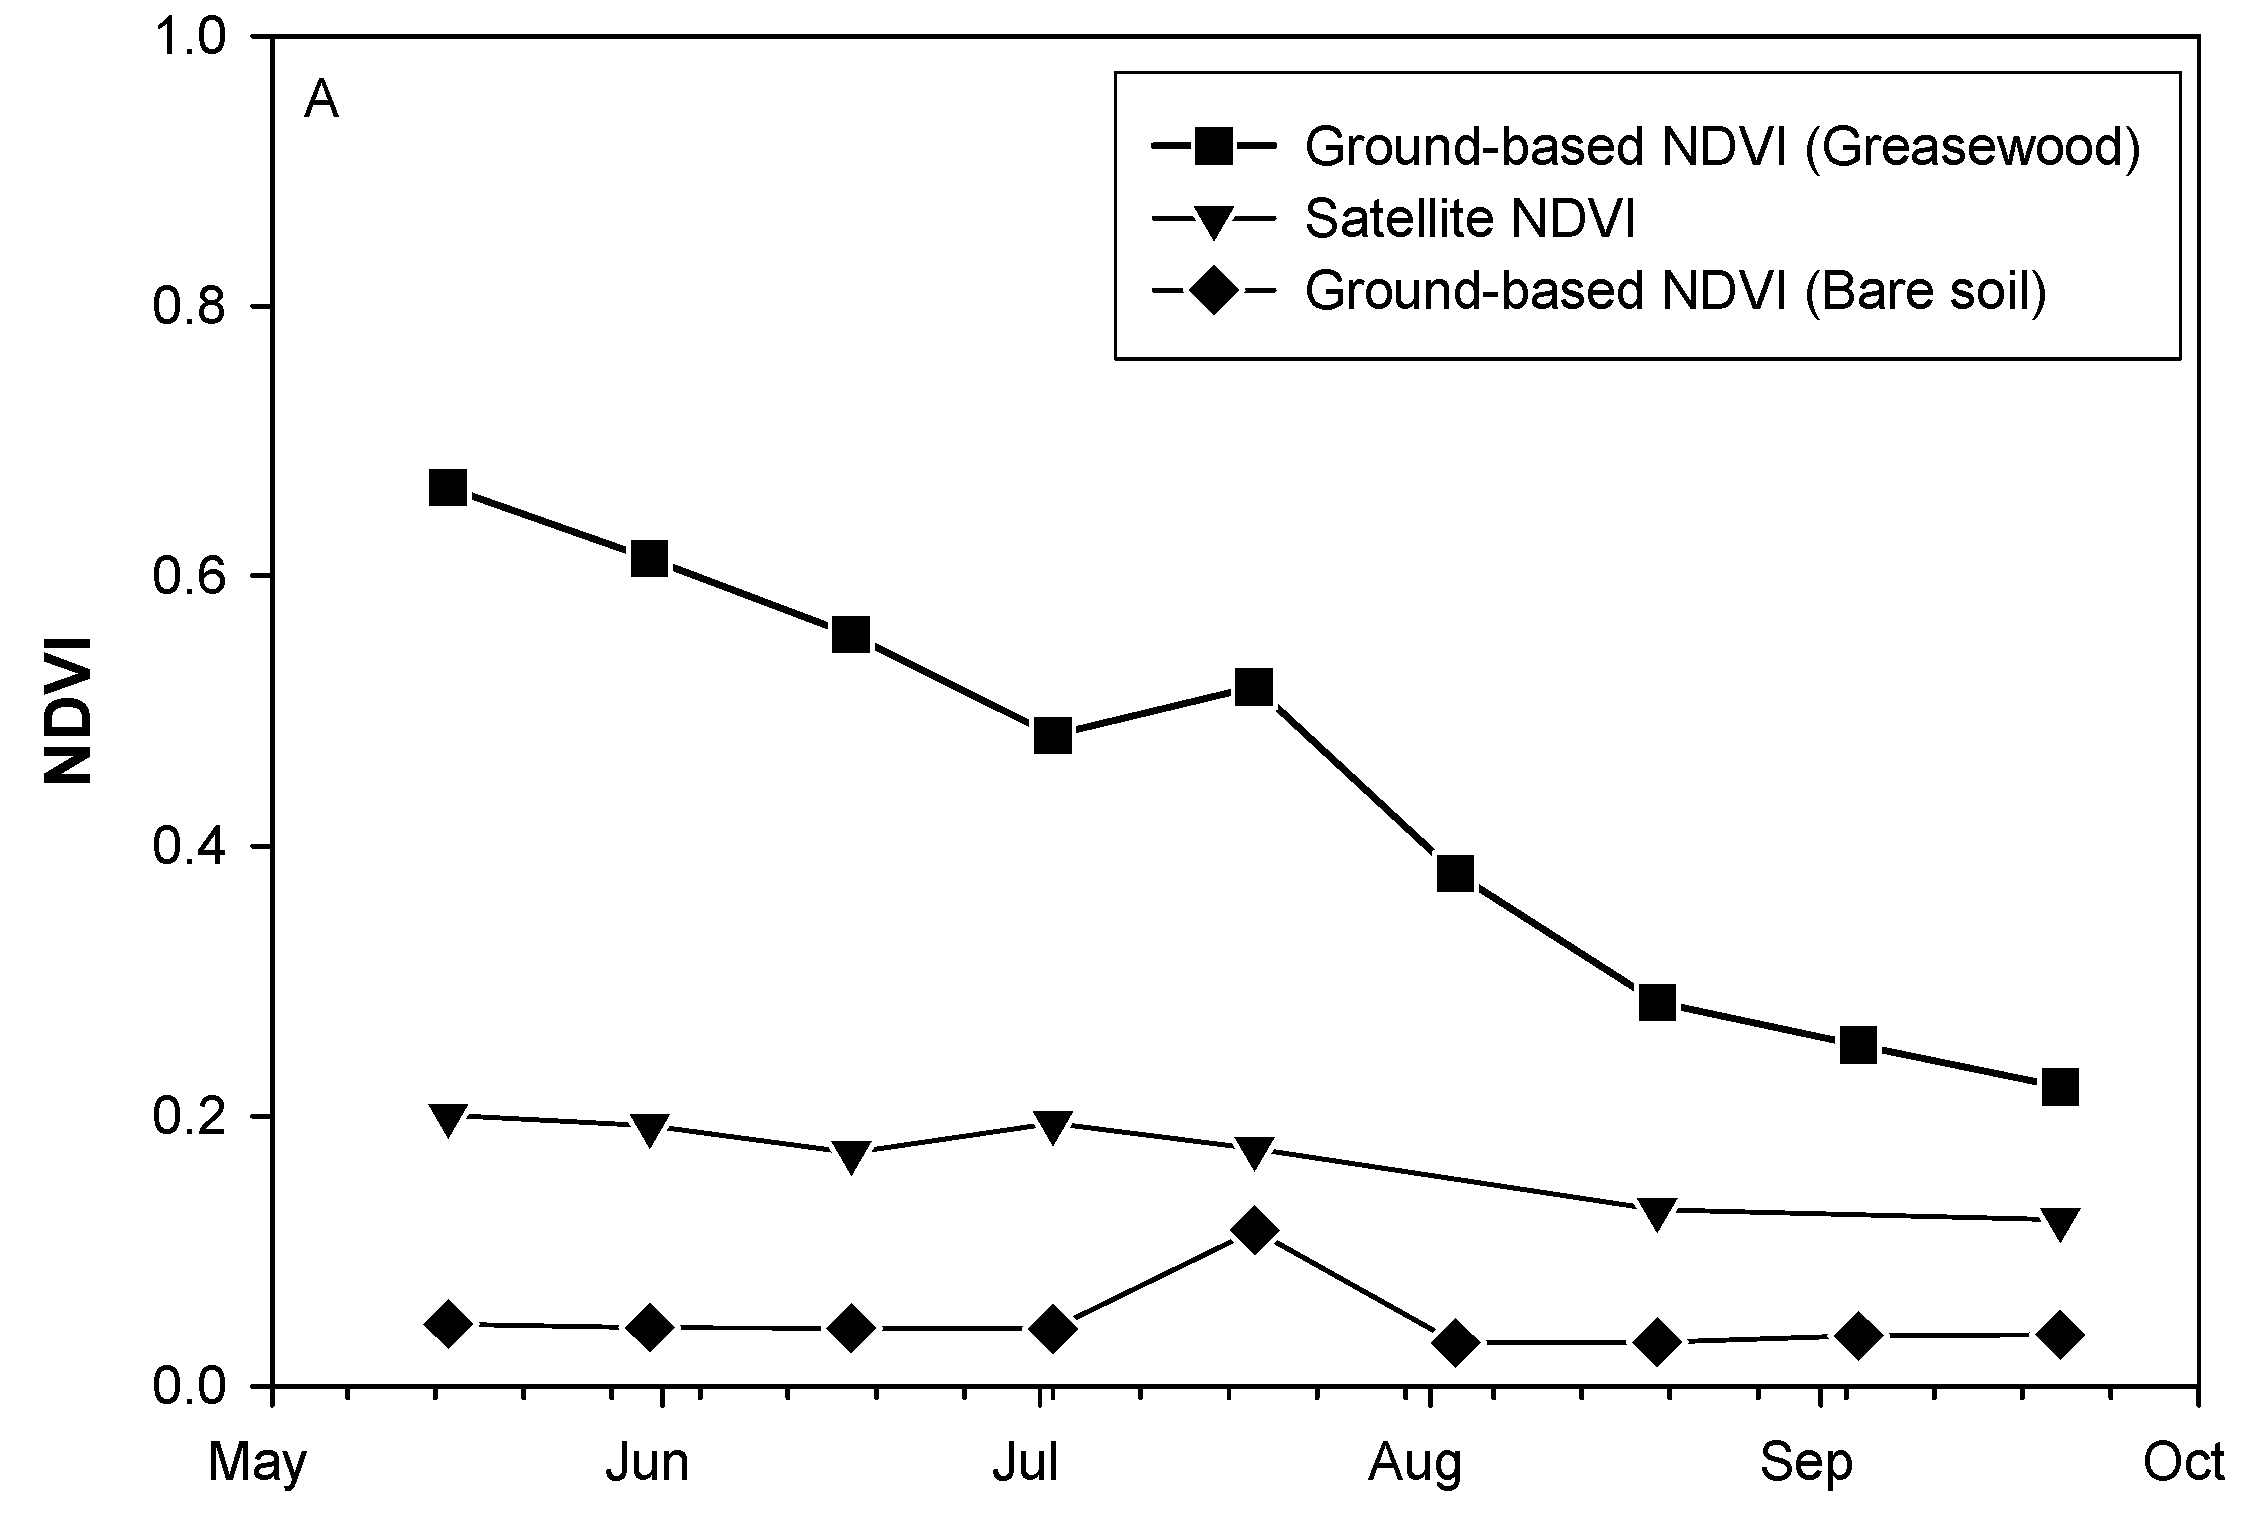
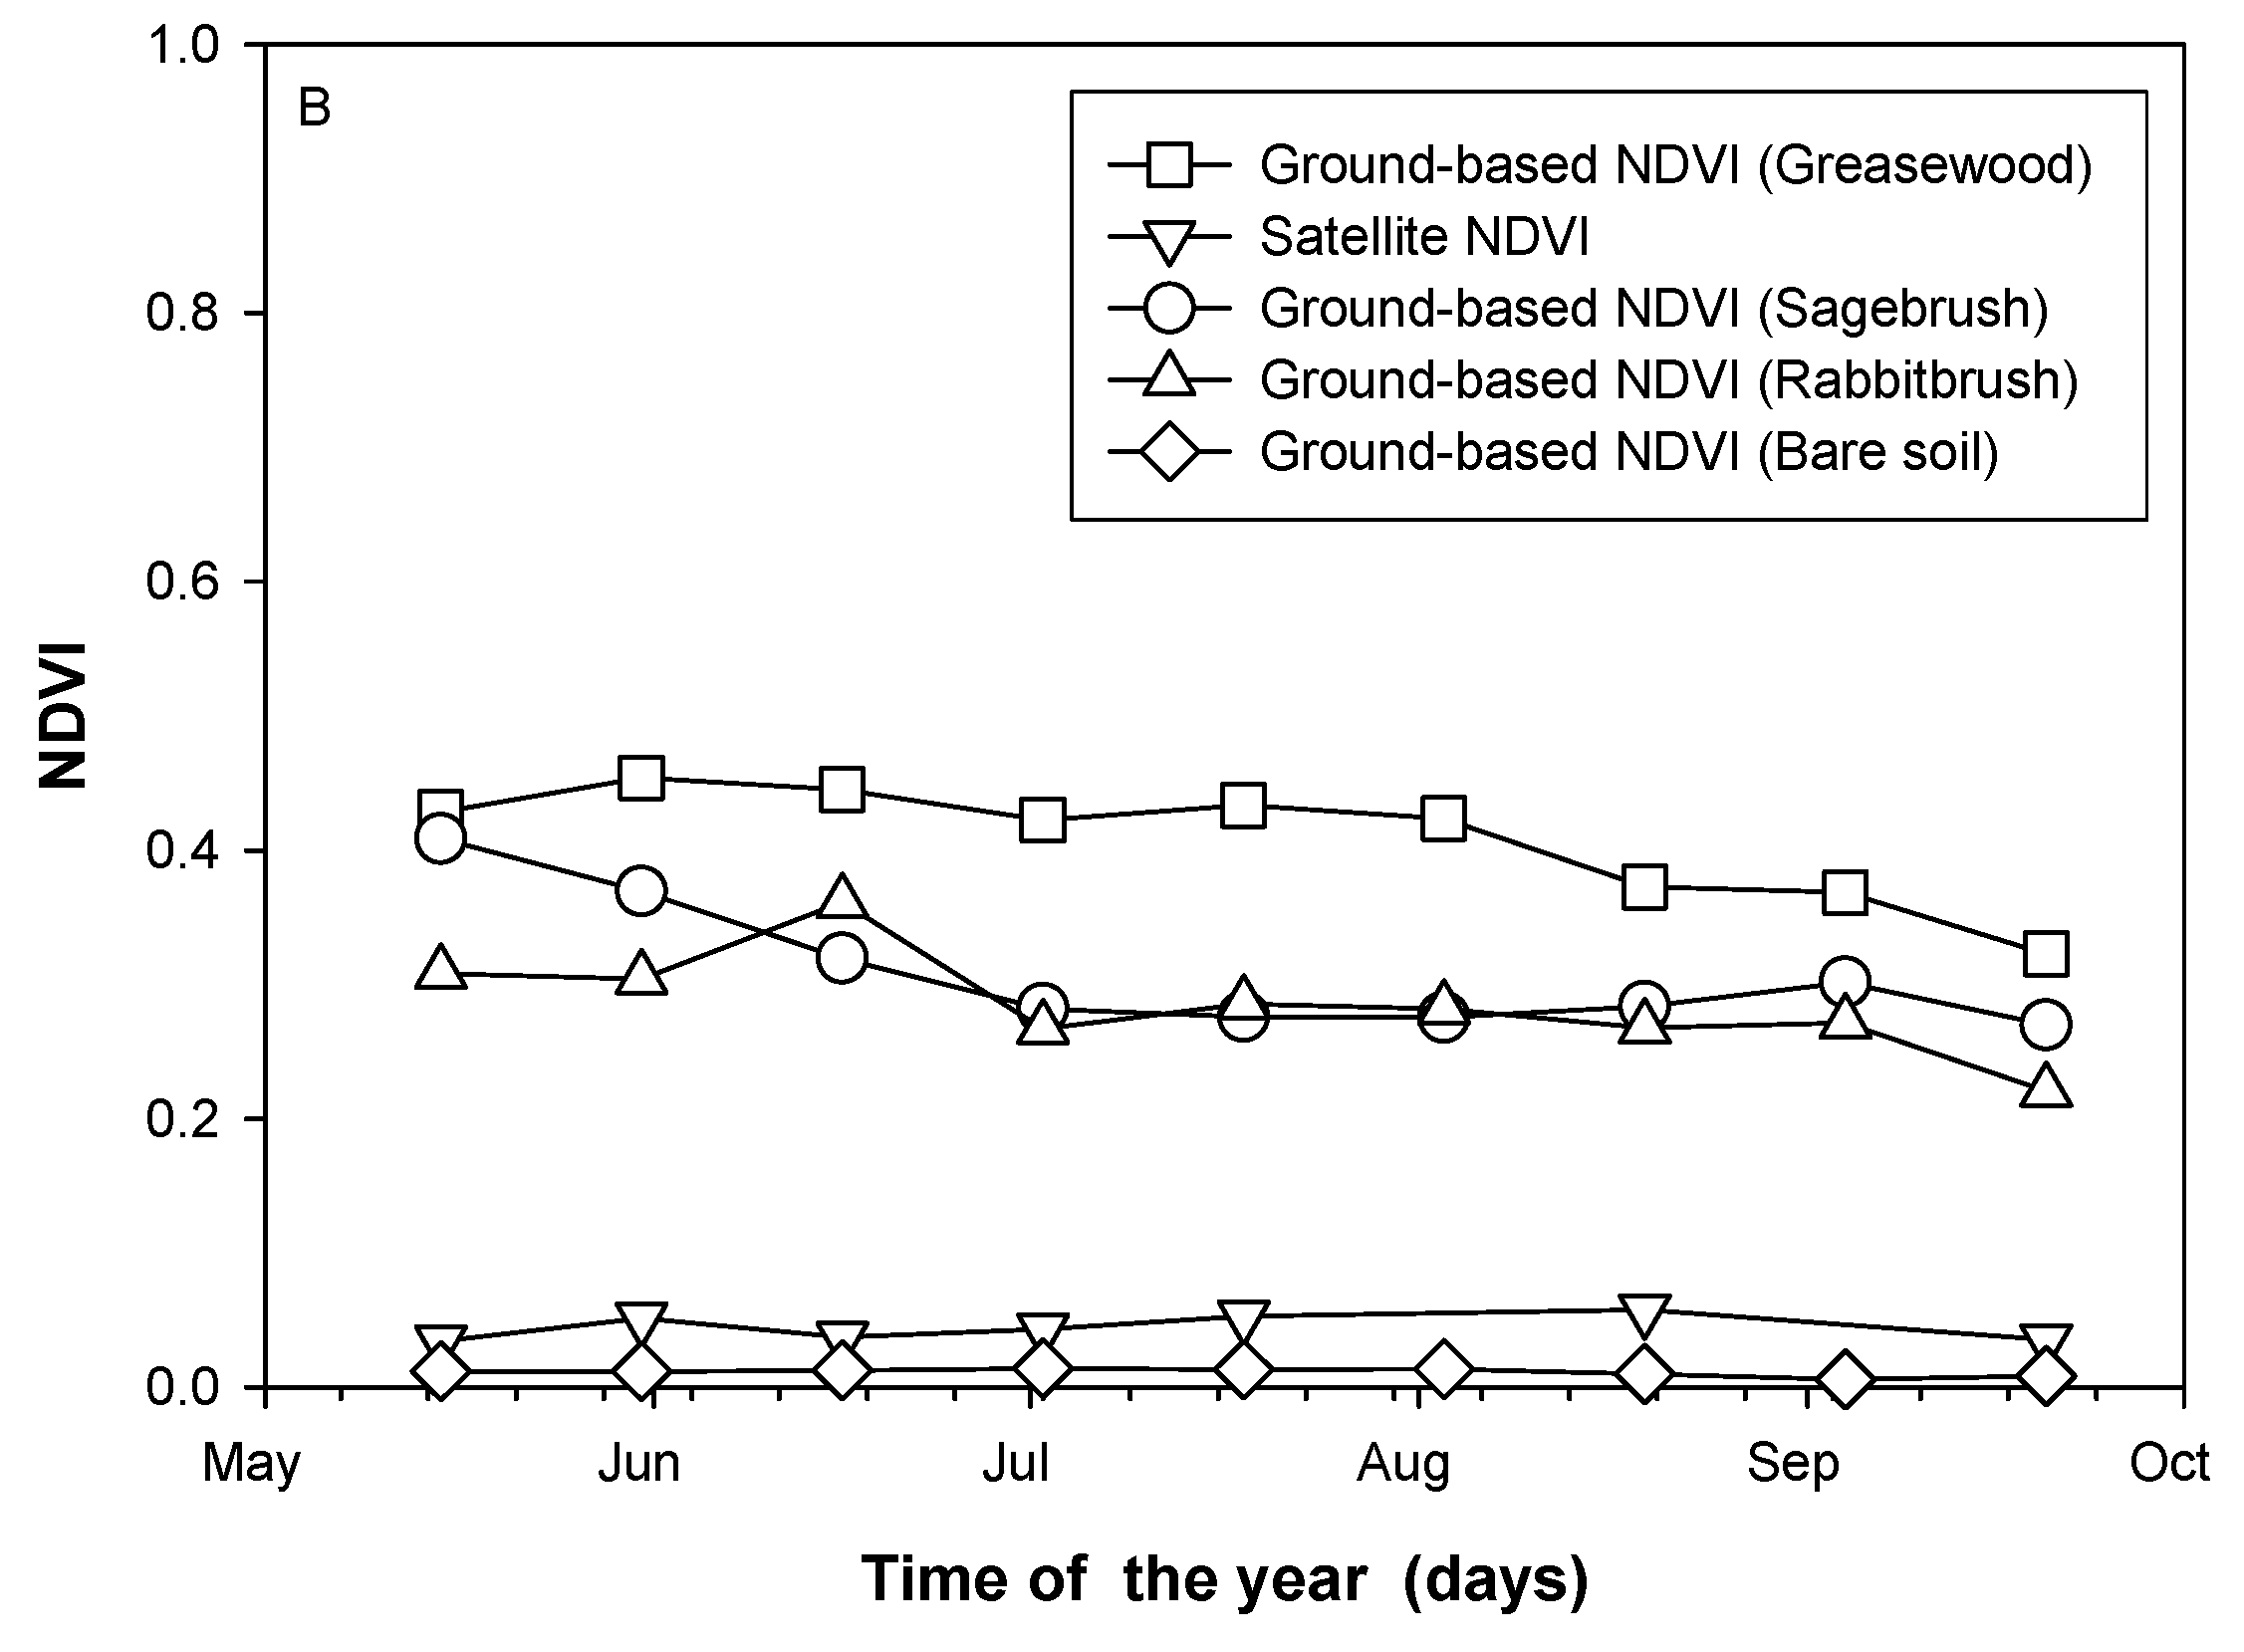
3.5. Comparing Ground-Based NDVI and Satellite-NDVI
For both sites, satellite NDVI values were lower than the ground-based NDVI values because the satellite synoptic view covered a surface area of 625 m
2 which represented the integrated optical properties of all surface components. Whereas, the ground-based NDVI values represented a single point measurement within an individual canopy or a bare soil surface. Satellite NDVI values were higher at the SNK1 site compared to the SV1 site (
Figure 9A). At the SV1 site, Landsat-NDVI values more closely approximated the ground-based NDVI values for bare soil indicating that the percentage of exposed soil surfaces at this site ( >80%) was the main driving force behind the low NDVI values (
Figure 9B). However, at the SNK1 site Landsat-NDVI values revealed a subtle decline over time associated with a steep decline in greasewood NDVI values, indicating a more significant contribution from the high percentage of plant canopies at this site (54.9% cover) compared to the SV1 site (19.7% cover).
Figure 9.
Comparison of ground-based NDVI values and Landsat-NDVI acquired during satellite overpasses. Average midday ground-based NDVI values are for (A): greasewood and bare soil (closed symbols) from the Snake Valley 1 site and for (B): greasewood, sagebrush, rabbitbrush and bare soil (open symbols) from the Spring Valley 1 site. Landsat-NDVI values (closed inverted triangle) are from (A): Snake Valley 1 site and (open inverted triangle) (B): Spring Valley 1 site.
4. Discussion and Conclusions
In this study a ground-based NDVI system was used to provide long term monitoring of phenological development and soil surface characteristics on a daily timescale at two different semi-arid environment settings, mainly characterized by having a dense
versus sparse vegetation cover. NDVI data retrieved at the sparse vegetation site (SV1 site) during the period from January to November, 2007 provided detailed temporal information on the entire phenological cycle of greasewood allowing for clear distinction between different phenological stages and for clear identification of the length and the pattern of the active growing season (early April to late September). The seasonal pattern of NDVI phenology is somewhat similar to the one observed by [
33] using radiation sensors mounted on flux towers to measure daily NDVI above the canopies of a boreal forest.
The temporal differences in greasewood NDVI values between the SV1 and the SNK1 sites during the experimental period (May-September) indicated the ability of NDVI to distinguish between the response of the same species across space and over time based on the difference in the existing growing conditions at each site. The comparison of the NDVI time series indicated that SNK1 greasewood NDVI values were significantly higher than SV1 greasewood NDVI values in the spring and early summer period during the active growth and canopy development phase and significantly lower during the summer dry period associated with water limitations, indicating the impact of water availability on the growth and development of the same species. In this context, the discrepancy in the timing of greasewood spring green-up (two weeks delay at SV1) and early summer NDVI peak values between the two sites may be attributed to a favorable response of greasewood plants at the SNK1 site to greater soil moisture from storage after winter rainfall. Availability of this soil moisture early in the growing period associated with lower atmospheric demand would be expected to support faster and greater growth.
The edaphic data gathered during this study (
Table 2) indicated the possible impact of soil texture variation on the growth characteristics of greasewood between the two sites. The high percentage of sand (>85%) in the soil profile at SV1 would lead to higher infiltration rates and to lower moisture holding capacity compared to the loamy soil at the SNK1 site. However, surface soil moisture measurements and tissue moisture content did not provide any clear indication of water stress during the summer dry down period as indicated by the steep decline in NDVI values, especially for the greasewood plant from the SNK1 site, which may partly be explained by the succulent morphology of greasewood leaves associated with its halophytic nature. On the other hand, even though greasewood is a phreatophyte and is capable of accessing ground water, the fact that leaf xylem water potentials declined below −5.0 MPa would suggest that ground water extraction was not great enough to offset summer stress. The results would suggest that greasewood at both sites relied more on the availability of surface soil moisture from winter rain and the occasional summer rainfall pulses (facultative phreatophyte). The depth of the water table at both sites was similar and changed little over the growing season.
NDVI time series of sagebrush and rabbitbrush from the SV1 site allowed for a clear distinction between the two species based on the difference in the peak and magnitude of the spring early-summer green-up phase (May- early June) and the rate and slope of the downward early winter adjustment phase (October-November). Such a distinction is not possible with satellite data or even with full range hyperspectral measurements (visible to NIR) especially when taken at one time or at different time intervals that do not coincide with key phenological changes during the growing season. The ability of NDVI to distinguish between different species is in accordance with the finding of [
24] for point measurements taken at a single time within the same area. Comparison of NDVI time series between greasewood, sagebrush and rabbitbrush from the same site (SV1) also allowed for retrieval of key time periods during the growing season when the NDVI time series exhibited very distinct patterns for each vegetation type. These key time periods were represented by the early green up period (May–June) with greasewood having higher NDVI values (
Figure 2) followed by a green up period for sagebrush and then rabbitbrush (
Figure 4).
NDVI time series analysis captured consistent phenological patterns for the different vegetation types, characterized by peak NDVI values during spring and the early summer period. This observation is in agreement with satellite observed NDVI peaks reported by [
21] for different semi-arid vegetation communities in New Mexico. The pronounced decline in NDVI values observed for all species during the late summer period associated with high temperatures and high atmospheric demand as well as depleted surface soil water indicated a response to water stress and drought conditions. Although NDVI is primarily an indicator of health and greenness and is more affected by loss of chlorophyll pigment and canopy color changes of drying plants, this does not exclude its relationship with plant water status, which has been reported in previous remote sensing studies [
24,
34]. During the summer period, all vegetation at both sites showed a dynamic response to rainfall pulses translated into increasing NDVI values following these rainfall events. Based on past studies, the apparent response to summer precipitation is a common feature for vegetation in arid and semi-arid environments [
21] indicating that this type of vegetation is highly sensitive to the temporal fluctuations in climatic conditions during its growing season. Additionally, not only did the time series of NDVI track the response to rainfall events during the summer period, but also showed a time lag in the responsiveness of each species, which is in agreement with previous work done by [
35] to assess the seasonal variability of semi-arid vegetation using AVHRR-NDVI.
Soil NDVI time series produced a clear distinction between the loamy soil (SNK1 site) and the loamy sand soil (SV1 site), indicating the ability of NDVI to distinguish between various desert soils based on color and wetness (
Figure 5). NDVI captured the difference in surface moisture properties between the two soil types throughout the growing season and how they responded to summer rainfall pulses. The consistent lower NDVI values for the loamy sand soil especially indicated that soil moisture was virtually absent at the surface layers because it quickly infiltrated to deeper horizons following rainfall, causing the soil to dry out more rapidly through the process of redistribution and evaporation. Conversely, the loamy soil at the SNK1 site held moisture at the surface, maintaining higher moisture contents in the top layers for a longer period following precipitation, as reflected in the soil NDVI values (
Figure 5). The ability of NDVI to distinguish between different vegetation and soil types provides a solid rationale for using this vegetative index to help partition semi-arid landscapes into vegetation and bare soil to monitor such parameters as growth, stress and surface energy fluxes.
The shape and the magnitude of the seasonal NDVI curve can be used to identify the type of vegetation cover [
36]. However, this can be problematic in semi-arid regions characterized by a high degree of surface heterogeneity. Thus, further validation steps in the form of long term monitoring studies are needed to establish an acceptable degree of consistency with regard to the temporal pattern of NDVI time series for each species. In this context, the value of having the integral of the NDVI time series curve can only be appreciated by developing long term monitoring studies and retaining such information over time for each species.
Most NDVI time series studies reported in the literature have been mainly based on monitoring the seasonal and inter-annual patterns of land cover type using an AVHRR sensor to track changes in phenology [
21,
22]. The ground-based NDVI sensor we used in this study overcomes most of the problems associated with the coarse temporal and spatial resolution of satellite systems allowing for daily monitoring of vegetation and soil characteristics at high resolution. In our case, Landsat data did not provide any potential discrimination between soil and vegetation types or characteristics that differentiate the two sites. Furthermore, the subtle changes in the optical properties of surface soil and vegetation (as they responded to rainfall events) observed with the ground-based NDVI system throughout the growing season were not apparent in the coarse spatial and temporal resolution of the satellite data. This was especially true for the different phases of vegetative growth observed between the two sites and within the SV1 site. Ground-based NDVI systems are a more robust tool that can be used to monitor and track the spatial and temporal variability of species composition, phenology and growing characteristics with greater detail, not possible with satellite-based NDVI systems. However, challenges do exist with scaling such data.
The significant correlations between NDVI and plant parameters measured in this study indicate the utility of VIs to predict and relate to many physiological processes over time (
Figure 6) especially to chlorophyll index indicating the tight relationship between NDVI and chlorophyll content as reported by [
37]. The difference in the correlation of greasewood NDVI and plant parameters between the SV1 site and the SNK1 site shows that these types of relationship can be site specific and may be good indicators of the existing growing conditions that differentiate sites on a spatial scale.
At the SNK1 site, the difference between the green-up and the dry down period of greasewood as demonstrated with NDVI, was shown to be somewhat sensitive to changes in evapotranspiration on a daily basis (
Figure 8) despite the difference in scale between the two measurements (single canopy
vs. flux tower footprint). This finding can be explained in part by the uniformity of the SNK1 site in terms of species composition (one single dominant species) and the high percentage of vegetation cover (>54%). However, at the SV1 site such a trend did not exist, suggesting that in areas with sparse vegetation and multiple species, changes in daily NDVI of one species will not adequately reflect ET on a mixed stand level basis.
The difference in growth characteristics of the same species between sites and between different species within the same site may explain some of the spatial distribution of surface fluxes associated with semi-arid environments. The magnitude of green-up and duration of active growth and senescence phases for the different species can be different from one year to another based on variations in prevailing weather and resultant soil moisture availability. Thus, further monitoring and long term inter-annual observations are needed for other sites in the Great Basin that have different soil and /or vegetation types. As more ground-based NDVI data becomes available, it can be used to provide a more meaningful linkage between surface energy fluxes and remotely sensed observations at multiple scales, especially when data are combined across different sites and across multiple years. Such an approach based on long term monitoring could prove to be extremely valuable in predicting possible impacts of changing climatic conditions and ground water fluctuations on the dynamics of vegetation growth in this region.
In summary, based on the performance of the NDVI sensors in this study, this instrument was shown to be a powerful tool in providing unattended daily monitoring of soil and vegetation optical properties in two different semi-arid environmental settings. Results showed distinct spatial and temporal patterns in NDVI values of the monitored species that cannot be detected by standard satellite measurements. However, based on the preliminary results of this exploratory study, we believe that further improvement of the experimental setting that allow for more replications over extended areas and extended time periods is needed. Ground validation studies of this type combined with satellite data should be pursued and improved in order to develop a robust approach to scale ET and plant biophysical properties using remote sensing data. Based on the findings of this study, an approach to estimate ET using NDVI data and to scale NDVI from single canopies and bare soil surfaces to an integrated satellite pixel NDVI basis within the footprint of the eddy flux towers is being undertaken employing the percent cover data for each species as a weighting factor.


