Article

Oil Detection in a Coastal Marsh with Polarimetric Synthetic Aperture Radar (SAR)

by
Elijah Ramsey III
1,*,
Amina Rangoonwala
2,†,
Yukihiro Suzuoki
3 and
Cathleen E. Jones
4
1
National Wetlands Research Center, US Geological Survey, 700 Cajundome Blvd., Lafayette, LA 70506, USA
2
IAP World Services, Inc., Cape Canaveral, FL 32920, USA
3
ASci Corp., Inc., McLean, VA 22101, USA
4
Jet Propulsion Laboratory, California Institute of Technology, 4800 Oak Grove Dr., Pasadena, CA 91109, USA
*
Author to whom correspondence should be addressed.
Current Affiliation: Five Rivers Services, LLC, Colorado Springs, CO 80918, USA
Remote Sens. 2011, 3(12), 2630-2662; https://doi.org/10.3390/rs3122630
Submission received: 19 October 2011 / Revised: 30 November 2011 / Accepted: 5 December 2011 / Published: 7 December 2011
(This article belongs to the Special Issue Remote Sensing in Coastal Ecosystem)

Abstract

:
The National Aeronautics and Space Administration’s airborne Uninhabited Aerial Vehicle Synthetic Aperture Radar (UAVSAR) was deployed in June 2010 in response to the Deepwater Horizon oil spill in the Gulf of Mexico. UAVSAR is a fully polarimetric L-band Synthetic Aperture Radar (SAR) sensor for obtaining data at high spatial resolutions. Starting a month prior to the UAVSAR collections, visual observations confirmed oil impacts along shorelines within northeastern Barataria Bay waters in eastern coastal Louisiana. UAVSAR data along several flight lines over Barataria Bay were collected on 23 June 2010, including the repeat flight line for which data were collected in June 2009. Our analysis of calibrated single-look complex data for these flight lines shows that structural damage of shoreline marsh accompanied by oil occurrence manifested as anomalous features not evident in pre-spill data. Freeman-Durden (FD) and Cloude-Pottier (CP) decompositions of the polarimetric data and Wishart classifications seeded with the FD and CP classes also highlighted these nearshore features as a change in dominant scattering mechanism. All decompositions and classifications also identify a class of interior marshes that reproduce the spatially extensive changes in backscatter indicated by the pre- and post-spill comparison of multi-polarization radar backscatter data. FD and CP decompositions reveal that those changes indicate a transform of dominant scatter from primarily surface or volumetric to double or even bounce. Given supportive evidence that oil-polluted waters penetrated into the interior marshes, it is reasonable that these backscatter changes correspond with oil exposure; however, multiple factors prevent unambiguous determination of whether UAVSAR detected oil in interior marshes.

1. Introduction

During the Deepwater Horizon (DWH) oil spill, which occurred between 20 April and 15 July 2010, 4.4 × 10⁶ ± 20% barrels of crude oil entered the Gulf of Mexico (GOM) waters [1]. At the time of spill disaster, there was a prudent expectation that oil on the water surface and entrained near the surface could be carried by daily tides and possible storm surges well into the expansive saline-to-freshwater wetlands of the GOM. Most of this oil never reached the coast; however, many marsh wetlands along the central-northern GOM coast were impacted to some extent by oil from the spill. In fact, within weeks of the loss of the oil platform oil contamination was observed in the near-coast marshes surrounding the Mississippi River Delta (MRD) and oil slicks were observed entering Barataria Bay immediately to the west of the delta. Because the effects of oil impact on coastal wetlands vary with marsh-species composition, seasonal timing, and distribution and extent of oil on the plants and in the sediment, along with other physical factors, such as retention, flushing frequency, and exposure [2,3,4], the short- and long-term consequences of the DWH oil spill are in effect largely unknown. Although specific details of the wetland response cannot be predetermined, oil contamination is often detrimental to marsh health [2,3,4]. Along the central GOM coast, which is already beset with ongoing wetland losses, the addition of oil to the cumulative stresses could aggravate these losses. Although detecting changes brought about by oil injection into the ecosystem is critical, in a dynamic coastal wetland it is often difficult to clearly identify the root cause of change.
Flushing and salinity regimes, drought, fire, invasive species, human development, and toxic spills all contribute to the spatial complexity and dynamism of wetland ecosystems [5]. In order to determine that wetland change is caused by a toxic spill, subtle changes in the wetland condition must be detectable above the high level of temporal and spatial variability that occur naturally and be differentiated from changes brought about by other factors. The most immediate and direct connection between the oil spill and degradation of coastal wetlands is the known spatial occurrence and duration of oil exposure. Field surveys, which are expensive and time consuming, and hydraulic models, which have limited spatial and temporal resolution, usually provide little detailed information on spatial extent and duration of marsh exposure, which is essential for remediation and restoration success. A spatially detailed and repeatable mapping technology is needed that can consistently detect changes in wetland plants and sediment caused by the presence of oil. Remote sensing offers the single best source of timely status and trend information at a variety of spatial and temporal scales [6].
Outside of weather constraints primarily affecting optical collections, mapping oil on the open water is accomplished with either optical or radar imaging. However, in vegetation canopies these remote sensing technologies have not been effectively demonstrated. First, dense wetland-canopy structures can limit the use of optical-wavelength sensors and short-wavelength radars for determining the occurrence of oil on the plants and ground at the subcanopy level [5,7]. Second, the presence of oil on the soil or vegetation could dramatically change the radar backscatter from the marsh through changes to geometrical structure and dielectric properties of the surface [8,9]. The ubiquitous and repetitive presence of water and the necessary transport of oil on water into the wetland assure the co-occurrence of moist soils and oil.
In the dynamic coastal environment of the GOM, marshes exhibiting spatial and temporal variations are distributed targets for radar backscatter, and the level of same-polarization or co-polarized (nonrandom) backscatter is partly dependent on the orientation and density or structure of the marsh canopy. Marsh canopy structure combines with the biophysical properties of the plants and underlying sediment, leaf litter, or water to largely determine the polarimetric backscatter signature. As shown in the mapping of inundation in these marshes, L-band out performs C-band synthetic aperture radar (SAR) sensors in providing consistent subcanopy information [5]. Also, high variability in canopy structure, even within the same marsh composition, suggests that a multi-polarization or polarimetric SAR (PolSAR) sensor may be better suited than one with single polarization because the additional information can be used to better differentiate changes in backscatter that are caused by changes in marsh structure [7] from those caused by the presence of oil. The advantage of L-band radar is it ensures that the polarimetric backscatter information reflects the entire marsh canopy structure and underlying background, as well as surface properties. With this enhanced information, alteration of bulk-canopy dielectric characteristics caused by the presence of oil coating the plant stems and leaves and sediment could be differentiated from changes in canopy structure.
The Uninhabited Aerial Vehicle SAR (UAVSAR) Gulf Oil Spill campaign, which imaged the GOM coast on 22–23 June 2010, was undertaken to perform oil detection and oil impact and ecosystem recovery mapping [10]. Although detection of oil on sediment or vegetation using radar backscatter has not been previously demonstrated, the Deepwater Horizon oil spill led to conditions under which we could obtain relevant data to test subcanopy detection of oil in a coastal wetland. Direct detection of oil on soil or vegetation would provide heretofore unavailable information and compelling evidence for relating oil exposure to a subsequent decline in vegetation condition. In addition, the polarimetric signature could provide information related to the percent of oil coverage, thickness, and persistence, which are necessary variables for interpreting the short- and long-term ecological impacts to coastal wetlands [2,3,4].
The objective of the study reported here is to determine the effectiveness of high spatial-resolution and fully polarimetric airborne L-band SAR for mapping the occurrence of oil in coastal wetlands. We used the measured multi-polarization backscatter intensity from pre-spill and post-spill UAVSAR collections over Barataria Bay, Louisiana, to determine whether changes in the polarimetric signature are related to the presence of oil. As part of this overall objective, we studied the capabilities of remote sensing technology to detect when oil occurred in the subcanopy as a coating on some portion of the plants or soil surface that was not evident at the canopy surface. If demonstrated, this capability would extend oil-detection capacity beyond the illumination, atmospheric-collection, and canopy-penetration constraints of optical sensors and even beyond other SAR sensor systems with restricted polarimetric capabilities and shorter wavelength radiation. Although focused on the DWH oil spill, this evaluation is of relevance to detection and monitoring capabilities worldwide where oil production and refineries are concentrated in sensitive coastal wetland environments.
Because decomposition of fully polarimetric SAR data can produce maps with intrinsic physical implications without requiring a priori knowledge of the target [11,12,13], we have considered this method for rapid production of targeted oil-impact maps during emergency response. Because this is a new research undertaking, we employed the two most widely used polarimetric decomposition methods, Cloude-Pottier and Freeman-Durden, and the Wishart unsupervised classification method seeded with input from the two decomposition methods to more thoroughly evaluate the relative merits of the different techniques in producing oil extent maps for oil spill monitoring in coastal wetlands. This procedure allowed us to determine the dominant scattering mechanism within the marshlands and to evaluate the post-oil impact change.
There were five primary components to our study to determine whether PolSAR can be used to map the occurrence of oil in the coastal marsh: (1) Processing and analysis of UAVSAR PolSAR data collected prior to and during the spill; (2) comparison between pre- and post-spill UAVSAR PolSAR data collected over the same coastal area at the same look direction and incidence angles; (3) comparison of post-spill UAVSAR PolSAR data collected of the same coastal area but at different look directions and incidence angles; (4) comparison of derived pre- and post-spill polarimetric signatures of Barataria Bay waters; and (5) comparison with ancillary data on oil extent in the study area. After presenting the data and methods used (Section 2) and the analysis results (Section 3), we discuss the utility of PolSAR for detecting oil within coastal marshes and waterways (Section 4) based upon our evaluation of the consistency within and between the different methods studied.

2. Data and Methods

In this section we present information about the SAR data used in this study; ancillary data sets providing information about oil intrusion into Barataria both during and after the SAR data collections, including satellite SAR and ground-based acquisitions; meteorology data on weather conditions in the area; and descriptions of the SAR data processing methods employed.

2.1. UAVSAR Data

The Uninhabited Aerial Vehicle SAR (UAVSAR) is an airborne, fully polarimetric, side-looking, L-band SAR system that provides for the complete characterization of the scattering field in the recorded intensities and phases of the HH (horizontal send and receive), VV (vertical send and receive), and cross (HV and VH) polarimetric radar returns and that can fly repeat tracks to 5 m position accuracy [10]. The sensor has single-look resolution of 1.7 m in the slant-range direction and 1.0 m in the along-track direction, providing the high spatial resolution necessary for imaging highly heterogeneous and spatially complex wetlands. The precision repeat-track capability provides the same look angle variation in across-track incidences on repeated tracks, enabling direct comparison between revisit data collections. In addition, the UAVSAR has higher transmitted power than satellite radars, resulting in a higher signal-to-noise ratio with the former compared to the latter. The noise floor of the UAVSAR instrument has been shown to be sufficiently low to enable identification of oil on the relatively calm Barataria Bay waters [10].
Our study area (Figure 1) is located in northeastern Barataria Bay, where significant amounts of oil had already spread prior to the UAVSAR flight and where on-site observations showed that oil was still present in the bay at the time of the UAVSAR flight. For our analysis, we used three flight lines from the June 2010 UAVSAR campaign and one flight line from the June 2009 UAVSAR collection over southern Louisiana (Table 1). Data for the three post-spill flight lines were collected within ~1 hour of each other on 23 June 2010, and the pre-spill 2009 flight line was acquired on 17 June 2009. All data collections in 2010 were timed to occur near low tide.
Figure 1. Uninhabited Aerial Vehicle Synthetic Aperture Radar (UAVSAR) flight lines used in this study of the Deepwater Horizon oil spill. The black box in the overlap region is our study area.
Remotesensing 03 02630 g001
The post-spill dataset consisted of two northeast-to-southwest oriented UAVSAR flight lines (Barataria Bay and Grand Isle) covering the study area at opposite radar look directions (Figure 1, Table 1) and one southeast-to-northwest oriented flight line (MRD 2010) covering the same general area with some overlap. For the pre-spill dataset, we used the 2009 MRD flight line, which was a replica of the 2010 MRD flight line in both flight track and radar operation. Data from the two MRD flight lines provide the basis for our pre- and post-spill comparison and detection of abnormal backscatter change unrelated to marsh growth stage and related to oil from the Deepwater Horizon spill. The Barataria Bay and Grand Isle flight lines covering the study region were collected post-spill only and are used to fully cover the study area and to evaluate consistencies and changes in decompositions and classifications at different look directions and look angles.
Table 1. Reference data for UAVSAR collections of Barataria Bay, Louisiana (Figure 1).
LabelUAVSAR Flight Line IDTime of CollectionAircraft Heading
Mississippi River Delta (MRD) 2009gulfco_32017_09045_001_09061717 June 2009 16:08 UTC320°
Mississippi River Delta (MRD) 2010gulfco_32017_10054_001_10062323 June 2010 22:03 UTC320°
Barataria BayLAmrsh_22202_10054_002_10062323 June 2010 22:37 UTC222°
Grand IsleLAmrsh_04201_10054_003_10062323 June 2010 23:05 UTC42°
Figure 2. A Landsat Thematic Mapper image of study area depicting locations and dates of ground observations of oil contamination from the Deepwater Horizon spill; flight lines of the helicopter surveys; shoreline oil-spill categories from Shoreline Cleanup Assessment Techniques (SCAT) [14]; and Coastwide Reference Monitoring System (CRMS) water level station [15] and NOAA metrological station [16] locations. White lines highlight the earliest SCAT-documented shoreline oil impacts on 11 June 2010.
Remotesensing 03 02630 g002

2.2. Ground-Based Field Reconnaissance

Ground-based field observations were obtained to calibrate the detection capabilities of SAR and to validate the mapping results. On 23 June 2010, a field support crew documented oil occurrences along the immediate shoreline at seven sites within the study area in the eastern Barataria Bay (Figure 2, Table 2). In addition to these shoreline observations, we used maps produced from Shoreline Cleanup Assessment Techniques (SCAT) documenting levels and locations of shoreline oil impacts [14]. SCAT-produced maps document oil occurrences on the barrier islands (e.g., Grand Isle) at the Barataria Bay entrance on 19 May 2010 and extensive shoreline oil-impacts within Barataria Bay, particularly in the northeast on 11 June 2010 (Figure 2). SCAT coverage of the entire study region was complete in the days following 11 June 2010.
Table 2. Locations of ground-based observations of oil impacts from the Deepwater Horizon spill, along with shoreline-impact descriptions. Site locations are shown in Figure 2.
SiteDateLatitudeLongitudeSCAT Category until 25 June 2010
B123 June 201029.42249−89.84064Moderate
B223 June 201029.42260−89.84166Moderate
JV123 June 201029.44801−89.92168Heavy
JV223 June 201029.44340−89.93150Heavy
JV323 June 201029.45877−89.91203Heavy
W123 June 201029.47936−89.91103Moderate
W223 June 201029.49137−89.92855Light
G129 July 201029.47585−89.85187Heavy
H257 October 201029.45433−89.89181Heavy
H267 October 201029.45690−89.89145Oil on lower canopy. No SCAT obs.
H277 October 201029.45933−89.89206No SCAT obs.
SCAT-based reconnaissance prior to the UAVSAR flight collections provides a history of changing shoreline oil occurrences. In order to summarize the history of these occurrences as documented on SCAT-produced maps, all SCAT information up to the 2010 UAVSAR collections was aggregated spatially, and the maximum impact level was retained. This aggregation and redefinition of “high” and “moderate” impact classes as “high” impact, “light” and “very light” impact classes as “light” impact, and “none” encapsulates SCAT-derived information pertinent to the UAVSAR analysis and mapping. Both data from the UAVSAR field support crew and the SCAT-produced maps were used to categorize oil occurrence and impact to the shorelines up to and including the day of the UAVSAR overflights. Although the occurrence-impact evaluations and maps are not comprehensive or quantitatively detailed, these surveys provided direct observational confirmation of the presence or absence of oil on the shorelines and, in some cases, a relative measure of the oil amount and its impact to vegetation along the shoreline. Because shoreline oiling was visually distinctive (see Figure 3) and oil reaching the interior marshes would have had to move past the shoreline, the lack of visible evidence of oil occurrence on the shoreline is taken as reasonable evidence that oil did not enter the adjacent interior marsh. Conversely, the observed presence of oil on a shoreline indicates a higher likelihood of oil having impacted the more interior marshes inland of the impacted shoreline.
Delayed observations of oil impact well after initial observations of oil in Barataria Bay consisted of ground-based and helicopter surveys. One ground survey within the study area was conducted on 7 October 2010 (Figure 2, Table 2). This survey added observations of oil occurring within the small tidal inlets that were previously not inspected by SCAT teams. These observations were important because oil on the marsh plants without apparent changes in the canopy structure were more likely to occur within the marsh interior. The helicopter-based survey that covered large portions of the study area was carried out between 31 August and 2 September 2010 (Figure 2). This survey used three video cameras attached separately at the front, to the left, and to the right of a helicopter flying about 5 m above the marsh surface. The purpose of the helicopter survey was to locate bird nests in the marsh; however, the video coverage provided a nearly spatially continuous record of shoreline oil impact, although the video data cannot be used to identify oil on the plant stalks or on the sediment. As in the field observations collected during the day of the 2010 UAVSAR overflights, oil impact visible on the shoreline (Figure 3) combined with the presence of booms washed up on the marsh provide evidence that oil had previously washed past the shoreline into the adjacent marsh.
Figure 3. Observations of shoreline impact taken during ground-based and helicopter-based field reconnaissance. (a) Video frame showing light oil impact along the shoreline and an oil-protection boom washed well up onto the marsh. (b) Photograph and (c) video frame of heavily damaged and oiled shorelines. (d) and (e) Photographs showing Rouseau cane (Phragmites australis) and cordgrass (Spartina alterniflora) marshes containing oiling on the lower portion of the plants without canopy structural damage.
Remotesensing 03 02630 g003

2.3. Satellite SAR Oil Intrusion Maps

Oil-slick maps from the National Oceanic and Atmospheric Association (NOAA), which were based on satellite reconnaissance [17], were used to document observations of oil-laden waters within Barataria Bay made ahead of the UAVSAR overflights. Oil-laden waters impacting the barrier islands of the outer bay in early to the middle of May 2010 were documented in the NOAA maps. The first observation of a spatially extensive oil slick reaching the landward interior of the bay was recorded on 23 May 2010, followed by another observation of an extensive oil slick on 4 June 2010 (Figure 4(a,b)). A field crew working within the study area at the northeast extent of Barataria Bay observed extensive occurrences of oil on the surface waters on 23 June 2010 [18]. Although no observations are available for the interim periods, it is likely that oil-laden waters persisted inside Barataria Bay and were moved about by prevalent winds and tides from 23 May 2010 onward.
Figure 4. Outlined areas showing extensive oil slicks in Barataria Bay, Louisiana, derived from satellite observations on (a) 23 May 2010 and (b) 4 June 2010 [17].
Remotesensing 03 02630 g004

2.4. Barataria Bay Meteorological Data

Water-level data were obtained from the Strategic Online Natural Resources Information System (SONRIS) of the Louisiana Department of Natural Resources [15]. Hourly water-level recordings coincident with the UAVSAR collections of the MRD in 2009 and 2010 were available from site CRMS4529 of the Coastwide Reference Monitoring System (CRMS) and, for the 2010 collection, CRMS0226 (locations shown in Figure 2) [15]. Water level data were recorded at CRMS0224 and CRMS0237 at the time of the 2009 and 2010 UAVSAR collections of the MRD, but these locations were not covered by the UAVSAR flight line of the MRD. All water levels used in the inundation validation were recorded in inland tidal channels draining into Barataria Bay, not within the marsh platform. Marsh water levels recorded in the study region at the times of the 2009 and 2010 UAVSAR overflights showed the water level to have been 7–9 cm higher in 2009.
Water-levels recorded at CRMS4529 between 20 April and 24 June 2010 (Figure 5) reveal not only that a spring tidal cycle followed the first satellite observation of surface-water oil in the bay (on 23 May 2010) but also that high water levels were sustained throughout the period of normally low tides within the 28 day tidal cycle (neap tides) encompassing the second observation of extensive surface-water oil in the bay (on 4 June 2010) (Figure 4(b) and Figure 5(b)). Water levels measured at CRMS0226 also document this sustained water buildup during the neap cycle. Recorded wind velocities at the NOAA station on Grand Isle (located on Figure 2) [16] show that northerly winds persisted during the neap tidal cycle (Figure 5(a)). The wind rose diagram inserted between the water level and wind speed plots highlights the dominance of winds to the north-northeast or directly into the study area from 31 May to 7 June 2010. These sustained northerly winds likely caused the prolonged marsh flooding and northward expansion of oil ladened waters into the study region. Extensive shoreline impacts within the study area were first documented on 11 June 2010 just after this period of persistent northerly winds and elevated water levels.
Figure 5. (a) Wind vectors recorded at the entrance of Barataria Bay. (b) CRMS4529 hydrograph begins at the 20 April 2010 Deepwater Horizon explosion and ends after the 23 June 2010 UAVSAR overflights. A wind rose plot is inserted between (a) and (b) showing the dominance of winds towards the north-northeast during the sustained high water event.
Remotesensing 03 02630 g005

2.5. Single-Look Complex Post-Collection Processing

For our study we used single-look complex (SLC) calibrated radar cross sections from UAVSAR, which are posted at a spacing of 0.6 m (azimuth) and 1.6 m (slant range), with a processing resolution of 1.0 m is azimuth and 1.6 m in slant range. Each pixel in the SLC data file contains the amplitude and phase of the electromagnetic wave measured by the four channels of the PolSAR sensor, representing the four complex elements of the scattering matrix [10], which relates the incident (transmit) to the scattered (receive) electric field. In order to apply polarimetric decomposition to determine the scattering mechanism, the scattering matrix elements were transformed into multivariate distributions represented by the coherency or covariance matrix [8,19]. Before determining the scattering mechanism of the distributed target, we filtered the polarimetric covariance or coherency matrix to reduce the speckle noise [8,19]. The choice of filter dimensions can affect the determination of scattering mechanisms [8]; however, that association was not evaluated in this study.
We applied a boxcar filter of 7 × 3 pixels to the SLC data for HH, HV, VH, and VV polarizations [20] to produce multilooked complex data with output pixels of size 4.2 m × 4.8 m in the azimuth and range, respectively, and an effective number of looks of twelve. The output from the non-overlapping filter window for all 16 upper elements of the covariance matrix was used. This decimation reduced the SLC data volume by a factor of 21, although spatial continuity of the SLC data was reduced as well. That reduction increased the blocky appearance of the data at magnified resolutions, but the decimation did not visibly reduce the performance or change the overall results portrayed in the subsequent decompositions and classifications. Color renditions of the boxcar filter output were constructed by inputting the HH, HV, and VV polarizations into the red, green, and blue video channels, and this is referred to as the multilooked (MLC) backscatter intensity data in the following description of the results.
From the extracted MLC data, graphic profiles were prepared of co-polarized SAR responses [12,21,22] of the water surface. Polarization-response plots were constructed with a SAR Polarimetric Workstation software module imbedded within the PCI image processing software toolkit [20]. In this representation, the vertical and horizontal states of the backscattered electric fields and their polarization amplitudes extracted from each targeted location were plotted graphically (polarimetric orientation and ellipticity).

2.6. PolSAR Decomposition and Classification

We extracted information about the marsh physical properties from the four complex polarimetric backscatter components of the MLC data (e.g., [8,21,23]) by using the standard Freeeman-Durden (FD) and the Cloude-Pottier (CP) decomposition and unsupervised classification methods [24,25]. These decompositions provided quantifiable methods for determining change that should relate directly to changes in the marsh structure and properties. Even though improvements and some drawbacks have been noted in the application of these polarimetric decomposition methods as applied to natural target scattering (e.g., [8,12,21,23]), these methods are widely used, operationally available, and proven useful (e.g., [8,12,21,23,26,27]).
The FD decomposition method applies a physical model based on randomly oriented, thin cylindrical dipoles, first-order Bragg surface scatter, and a double-bounce scattering from a dihedral corner reflector to determine the fractions of volumetric (random), surface, and double-bounce scattering exhibited in each target [8,12,21,24]. In solving for the backscatter mechanism fractions, volumetric scatter is related directly to HV backscatter [24]. FD continuous classification methods produce three output channels that separately represent the contribution of volumetric scattering, surface scattering, and double-bounce scattering at the pixel level.
The CP decomposition method applies eigenvector analysis to describe the average or dominant scattering mechanisms of each target [8,19,25]. Four secondary products are used to describe the target scattering characteristics based on the eigenvectors and eigenvalues obtained from the coherency matrix—the alpha parameter (α), beta angle (b), entropy (H), and anisotropy (A). The entropy relates to the randomness of the scattering process; H = 0 indicates a single scattering mechanism, with H > 0 increasingly indicating multiple scattering mechanisms, and H = 1 indicating a mixture of scattering mechanisms with equal probabilities [21,25,27]. The alpha parameter represents the continuum of average scattering mechanisms, ranging from surface scattering (α = 0°) to dipole (or single) scattering by a cloud of anisotropic particles (volumetric scattering, α = 45°) to double-bounce and, ultimately, to dihedral scattering (α = 90°) [8]. The beta angle is related to the orientation of scatter about the line of sight from the antenna to the target [11]. Anisotropy describes the relative importance of the second and third eigenvalues of the eigenvector decomposition [11]. When H > 0.7, anisotropy can be used as an additional source of information to enhance discrimination of the targets through the secondary scattering mechanisms [8,21].
Interpretation of the CP eigenvector analysis was facilitated by plotting entropy and alpha values on an H-α plane containing zones representing defined scattering mechanisms [25]. The CP classification method outputs a single value for each pixel that represents one of the 16 classes defined by the entropy-alpha-anisotropy partitions of all possible defined scattering mechanisms.
Final classification of the MLC data was performed with a Wishart unsupervised classification. The use of a maximum likelihood approach based on the complex Wishart distribution has increased the interpretability of the landcover classifications when seeded with prior unsupervised classifications [8,12,26,27]. Although it is not based on the physics of the scattering mechanism, the Wishart classification utilizes the full range of complex polarimetric information [28]. For our analysis, we applied the Wishart supervised classification method by using class-training information provided by either the FD or CP unsupervised classifications, with iteration until a consistent class membership result was obtained for the entire scene. In the Wishart classification seeded with the FD class, changes were allowed only if the change was within the same dominant scattering mechanism [20].

2.7. Signal-to-Noise Analysis

To ensure correct interpretation of products derived from SLC data analyses, we compared the signal and noise intensities to determine whether the noise was a significant component of the measured signal in the different areas (water, shore vegetation, interior marsh, etc.) of our study region. The UAVSAR L-band radar noise intensity obtained from Jones et al. [10] was compared to HV backscatter intensities of marshes, ponds and tidal creeks, and Barataria Bay waters located in the near- to far-range of the post-spill MRD flight line. The tendency for HV backscatter intensity from oiled water to fall below the noise level at incident angles >50° was noted by Jones et al. [10].
In our data sets, noise remained well below backscatter intensities associated with marshes while noise and backscatter intensities were within 6 dB in inland waters. In Barataria Bay waters suspected to contain surface oil, backscatter could be below the previously published noise intensity. We note that in oiled waters where backscatter intensities were near the noise floor, the scatter mechanisms produced by the polarimetric decompositions were not directly interpretable. In that case, without extended analyses, the interpretation is limited to identification of change. On the other hand, with the possible exception of minor land covers (e.g., mud flats), products output from the polarimetric decompositions associated with marshes are fully interpretable.

3. Results

3.1. Inundation Influences on the 2009 and 2010 SAR Backscatter

The presence or absence of inundation is the highest frequency environmental change in these coastal marshes. In order to determine whether marsh inundation was pervasive and could account for patterns that we attributed to oil occurrence, we used water levels recorded within the study area and the consistently documented decrease of HH- and VV-polarized SAR backscatter associated with marsh inundation in the northern GOM (e.g., [29]). In the current study, change-detection patterns derived from HH-intensity data of the pre- and post-spill MRD flight lines were used to infer the presence or absence of marsh inundation [5].
Figure 6. Difference in horizontal send and receive (HH) backscatter intensity between the 2009 and 2010 UAVSAR data of the Mississippi River Delta (MRD) flight line overlain on a Landsat Thematic Mapper image. The white box contains the study area depicted in Figure 2.
Remotesensing 03 02630 g006
Marsh water levels recorded in the study region at the times of the 2009 and 2010 UAVSAR overflights showed the water level to have been 7–9 cm higher in 2009. To ascertain whether this difference in water level significantly influenced the radar backscatter, a comparison of 2009 and 2010 HH-polarization intensity was made to quantify the change across the entire study region covered in the MRD flight lines. The HH intensity changes (I2009 − I2010) were aggregated into three classes: class 1 ≤ −2 dB, −2 dB < class 2 < 2 dB, and class 3 ≥ 2 dB (Figure 6). Class 2 essentially represented no change between the 2009 and 2010 HH backscatter. Class 3, in which the 2009 backscatter was significantly higher than that in 2010, corresponded with waters in Barataria Bay having a high likelihood of containing surface oil, as well as with both calm and oiled waters in the more inland water bodies or on the leeward side of islands. In order to emphasize the possibility of marsh inundation, mapped water bodies were excluded from the change depiction in Figure 6 removing most Class 3 occurrences except in small inland ponds that were not included in the open water class. Class 1 incorporates marshes in the northeast of the study region exhibiting relatively lower 2009 HH intensity that indicates possible shallow flooding in 2009; however, the restricted extent of Class 1 does not suggest pervasive flooding existed in the study region. In contrast, the extensiveness of class 2 demonstrates the general temporal and spatial uniformity of marshes surrounding Barataria Bay.

3.2. MLC Data Description and Comparison to Observational Data

3.2.1. MRD 2009 and 2010 Flight Lines

Because ground-based shoreline observations were available, we initially concentrated on nearshore similarities and differences exhibited between the 2009 and 2010 HH, HV, and VV color composites in the MLC data, where pre- and post-spill data were collected with identical flight-track and radar parameters (Figure 7(a,b)). Note that the greenish-blue shoreline fringe on the 2010 inset (zoomed image at bottom) indicating abnormal shoreline change is lacking on the 2009 inset. In addition, note the overall change of the interior marshes in 2010 as compared to 2009.
Nearshore marshes along shorelines with prominent changes between the 2009 and 2010 MLC data collections were aligned with locations identified during SCAT-based assessments of the distribution of oil-impact levels up until 25 June 2010 (Figure 2 and Figure 7(b)). Post-spill features on the MLC data indicative of oil occurring along the shoreline could extend up to 20–40 m into the marsh along the MRD flight line and the Grand Isle and Barataria Bay flight lines. Post-spill anomalies occurred nearly continuously along some sections of the shoreline and sporadically along others, so they were not associated with water levels in Barataria Bay. In contrast, the oil-impact classes (either with or without oil) assessed during SCAT exhibited no differential spatial correspondence with any observable feature in the pre-spill MLC data for the 2009 MRD flight line (Figure 7(a)).
We considered other ground-based data to validate polarimetric-based indicators of oil occurrence. Beyond the SCAT-produced oil-spill impact maps, oil occurrence at five shoreline sites (Figure 2, Table 2) that are contained on the MRD flight lines (e.g., Figure 3(b)) were documented on 23 June 2010. These site observations of heavy oil impact along the shoreline align with locations of prominent changes between the 2009 and 2010 MLC data of the MRD flight lines. At these five sites and at others observed from boat by the ground crew within the study area and contained within the MRD, Barataria Bay, and Grand Isle flight lines, the heavy oil impact extended between approximately 2 to 4 m from the shoreline into the marsh. The impacted marsh was structurally changed from a typically more vertical canopy orientation [30] to a more horizontal orientation, i.e., sections of the shoreline marsh had been damaged by the oil impact or by booms washing up on shore (e.g., Figure 3(b,c)). This type of structural change was common close to the shoreline and was a primary feature used by ground crews to document oil impact. We used structural change accompanied by oil occurrence as evidence of oil excursions into the interior marsh.
Figure 7. Multi-polarization multilooked (MLC) backscatter intensity data collected in 2009 (a) and 2010 (b) of the MRD flight line, with color composites illustrated as HH (red), HV (green), and VV (blue). The same reference table for color was used in 2009 and 2010 renditions.
Remotesensing 03 02630 g007
Further evidence of oil in the marsh was provided by field and helicopter reconnaissance surveys that occurred in late July through October 2010, two weeks to four months after cessation of the Deepwater Horizon oil discharge. Additional ground-based visual observations at the end of July 2010 confirmed that severe marsh structural damage occurring in a 2- to 4-m shore-normal marsh zone co-occurred with abnormal features in the post-spill MLC data of the MRD flight line; however, the post-spill MLC features could extend up to 40 m further into the marsh. The video surveys on 31 August and 1 September 2010 further documented the high spatial correspondence between evidence of oil-impacts along the shoreline and locations of the abnormal spectral features in the post-spill flight lines. Except for a few areas along the shorelines where there were indications of further oil penetration within the marsh, the video only gave evidence of oil impact along a narrow zone at the water and marsh interface (Figure 3(a,c)). A reconnaissance in the study area made by boat in October 2010 also confirmed the juxtaposition of severe shoreline oiling and canopy damage with abnormal shoreline features observed in the post-spill MLC flight lines.
Besides differences along the shoreline, the 2009 and 2010 data exhibit two prominent changes located in physically distinct areas. In Figure 7, the first area of change is located at the center-left of the flight lines in the interior marsh, and the second area is a broad band of marshes lying behind impacted shorelines predominantly in the overlap region of the three flight lines. Of these two prominent changes, the latter was the most likely to have resulted from oil intrusion. These latter areas were situated behind shorelines for which there were observed oil impacts, but the areas in question were not in the range where observations from the shoreline could have discerned the occurrence of oil at ground level.
The ability to map directly oil occurrences in the interior marsh (past 20 to 40 m from shoreline) relies on detecting extremely low concentrations of oil brought as surface-water films into the area and deposited onto the marsh subcanopy without accompanying structural damage. Two ground-based shoreline field observations support the capability of UAVSAR to detect oil in the interior marsh. During field reconnaissance conducted on the day of the UAVSAR overflight, a shoreline marsh site was observed where oil coated the lower stalks without observation of canopy structural damage (Figure 3(d)). During the October 2010 field reconnaissance, oil was also observed on the marsh plant stalks along a tidal creek within the interior marsh without the accompanying structural damage (Figure 3(e)). Both sites exhibited anomalous features in the post-spill MLC data in relation to the pre-spill MLC data.
Figure 8. Multi-polarization MLC backscatter intensity data for (a) the Barataria Bay (BB) and (b) the Grand Isle (GI) flight lines with the overlapping region in the BB, GI, and MRD lines shown. Color composites in the images shown are HH (red), HV (green), and VV (blue) (common color tables were used for the MRD, BB, and GI flight lines).
Remotesensing 03 02630 g008

3.2.2. Barataria Bay and Grand Isle 2010 Flight Lines

Within the overlapping portions of the three flight lines (Figure 1), anomalies similar to those exhibited in the post-spill MLC data of the MRD show up in features common to all flight lines that are in the overlap area, although the intensity, contrast, and shore-normal width and shore-parallel lengths differed (Figure 8(a,b)). Shoreline features that were linked to oil impacts in the 2009 and 2010 MRD comparison were visible in the MLC data of the Barataria Bay and Grand Isle flight lines as well. In addition, visual and videographic surveys substantiated the association of these shoreline features with evidence of oil occurrences in other marsh areas not covered by the MRD flight lines but that were covered by the two additional flight lines (Figure 1 and Figure 2). Patterns within the interior marsh displayed in the Barataria Bay and Grand Isle MLC data reflected similar patterns as those seen in the 2010 MRD data. In general, the MLC data of the Barataria Bay and Grand Isle flight lines exhibit the polarimetric signatures that characterized the predominant changes across the 2009 and 2010 MRD MLC data.

3.3. Polarimetric Decomposition and Classifications

3.3.1. Freeman-Durden Decomposition and Classification

The FD decomposition produced a continuous classification emphasizing the contribution per pixel of three different scattering mechanisms. High similarity between the MLC HH, HV, and VV intensity and FD double bounce, volumetric, and surface scatter RGB color composites in both the 2009 and 2010 MRD flight lines highlight the dependencies of the FD backscatter decomposition on the polarization pairs (Figure 7(a,b) and Figure 9(a,b)). Volumetric scatter was the dominant, roughness the secondary, and double-bounce the minor backscatter mechanisms exhibited in the 2009 pre-spill MRD classification. A comparison of the 2009 pre-spill and 2010 post-spill FD classifications indicated that many marshes lying interior to a shoreline with documented oil impacts exhibited a change in the dominant backscatter mechanism. In some cases these interior marshes, which had in 2009 exhibited roughness and, in some cases, volumetric backscatter mechanisms, exhibited a dominant double-bounce scattering mechanism in the 2010 post-spill FD decomposition. Locations of the marshes spatially exhibiting this change in scattering mechanism coincided with locations of the anomalous spectral changes observed in the 2009 and 2010 MLC data of the MRD flight lines. However, even though interior marshes exhibiting this change in scattering mechanism in the 2009 and 2010 FD-classification comparison were widespread within the study region, they were not as spatially extensive as were the changes highlighted during the comparisons of the 2009 and 2010 MLC data of the MRD flight lines.
Nearshore marshes displaying abnormal changes (when comparing the 2009 and 2010 MLC data of the MRD flight lines) were for the most part reproduced in the 2010 FD decomposition of the MRD MLC data (Figure 9(b)). In contrast to the interior marshes, however, the dominant backscattering behavior of features associated with shoreline oil impact changed from “roughness” in the 2009 FD decomposition to “volumetric scattering” in the 2010 FD decomposition. The shore-normal widths of these nearshore-change features could range from 20 m to 40 m, extending inland beyond the visually observed 2- to 4-m shoreline area of oil-related marsh damage. As noted, for marshes located further inland, even though the prominent nearshore change was coincident with the abnormal changes displayed in the 2009 and 2010 MLC data of the MRD flight lines, the FD recreation of these features were not as spatially extensive. As in the MLC data, the FD-classified nearshore-change features coincided well with evidence of shoreline oil occurrences.
Figure 9. Results of the Freeman-Durden (FD) decomposition of the 2009 (a) and 2010 (b) MLC data of the MRD flight lines. Colors depict dominant fractions of surface (blue), volumetric (green), and double-bounce (red) backscatter. The same color reference table was used in 2009 and 2010 renditions.
Remotesensing 03 02630 g009

3.3.2. Cloude-Pottier Decomposition and Classification

The CP decomposition classifications produced 16 classes representing different Entropy-Alpha-Anisotropy categories. The 2009 pre-spill CP decomposition of the MRD displayed low class variability and high spatial uniformity in the marshes, but the 2010 post-spill CP decomposition exhibited higher variability, predominantly because of the addition of a CP decomposition class that aligned with prominent spectral changes between the pre- and post-spill MLC data of the MRD flight lines occurring within the interior marsh (Figure 10(a,b)). These prominent changes are dominantly within interior marshes that primarily exhibited a change, between 2009 and 2010, from low and moderate entropy to low entropy, from high and low anisotropy to low anisotropy, and from low alpha (surface roughness) (CP Classes 6 and 9 (secondary)) to dominantly high alpha (double or even dihedral scatter) and some midlevel alpha volumetric (dipole) (CP Classes 7 and 8) scatter. Although still dominantly associated with surface roughness (Class 6), the CP classification exhibits an increase in volumetric scatter (Class 5) associated with nearshore marshes that include severe shoreline impacts.
Figure 10. Results of the CP decomposition of the 2009 (a) and 2010 (b) MLC data of the MRD flight lines. The same color reference table was used in 2009 and 2010 renditions.
Remotesensing 03 02630 g010
Figure 11. Results of the Wishart classification initiated with FD classes (see Figure 9) of the 2009 (a) and 2010 (b) MLC of the MRD flight lines. Note the wind-shadow water class on the 2009 inset. JW1-JW5 labels locate sample sites used for polarimetric signatures creation. The same color reference table was used in the 2009 and 2010 renditions.
Remotesensing 03 02630 g011

3.3.3. Wishart-Freeman-Durden Supervised Classification

Initiated with the per-pixel roughness, double-bounce, and volumetric-input fractions in the FD classification, the Wishart classification that can produce up to nine classes, produced two classes each for the roughness and double-bounce, and three class for the volumetric backscatter mechanisms (Figure 11(a,b)). For the central core of the study region, the 2009 and 2010 Wishart-FD classification largely mimicked prominent changes produced in the 2009 and 2010 FD decompositions of the MRD (Figure 9(a,b)). In oil-impacted areas of the 2010 MRD flight line, marshes that exhibited predominantly rough surface scattering behavior in 2009 were associated with double-bounce scatter dominance in the 2010 post-spill Wishart-FD classification of the MRD. Scattering dominance associated with nearshore marshes with observed oil-impact evidence switched from a surface roughness-dominant mechanism to a volumetric-scatter mechanism between 2009 and 2010 (from Class 3 to Class 9). The water classification changed between 2009 and 2010 to include a second water class associated with surface-oil. As discussed later, this is associated with the radar power return being reduced to near the instrument noise floor, as noted in [31], by oil damping the surface waves.
Figure 12. The Wishart classification initiated with CP classes (see Figure 10) of the 2009 (a) and 2010 (b) MLC data of the MRD flight lines. Possible oil contaminated marshes in the post-spill classification comprise the red and yellow classes. The same color reference table was used in the 2009 and 2010 renditions.
Remotesensing 03 02630 g012

3.3.4. Wishart-Cloude-Pottier Supervised Classification

The pre-spill Wishart-CP classification initiated with the 16 CP classes displayed higher class variability and lower spatial uniformity than exhibited in the pre-spill 2009 CP decomposition and classification of the MLC data of the MRD flight line (Figure 12(a)). Similarly, the spatial complexity of the post-spill Wishart-CP classification is higher than that observed in the CP classification of the post-spill flight lines (Figure 12(b)). The post-spill Wishart-CP classification contained two marsh classes centered within the area of observed oil occurrence. Their combined spatial distribution resembled the distinctive changes exhibited in the 2010 MLC data of the MRD flight line. In effect, the Wishart-CP classification recreated one marsh class indicative of oil occurrence largely similar to classes created with the FD, Wishart-FD, and CP decompositions and classifications. In addition, the Wishart-CP classification produced a second class that extended the first oil-related marsh class into interior marshes displaying abnormal change in the post- and pre-spill MLC data of the MRD flight lines. The other marsh area of notable change between 2009 and 2010 is located in interior marshes in the northeast of the study area. This area also exhibits change in all 2009 and 2010 map comparisons but was not an area of documented oil impacts.
Figure 13. Results of the FD decomposition of the 2010 MLC data of the (a) Barataria Bay (BB) and (b) Grand Isle (GI) flight lines, with the overlap area common to the BB, GI, and MRD lines indicated. MRD, BB, and GI renditions used the same color reference table.
Remotesensing 03 02630 g013

3.3.5. MRD, Barataria Bay, and Grand Isle MLC Data Decompositions and Classifications

In the overlap region, consistency varies between the post-spill MLC results, and the post-spill FD, CP, and Wishart polarimetric classifications. As in the MRD classifications, Wishart-FD closely followed FD results. Consistency between the MLC variation, FD, Wishart-FD (Wishart-FD not shown), and CP classifications for the Barataria Bay and Grand Isle (Figure 8(a,b), Figure 13(a,b) and Figure 14(a,b)) is high even though the look directions for the two lines differed by 180°. However, the FD and Wishart-FD classifications of the Barataria Bay and Grand Isle flight lines differ from the post-spill FD and Wishart-FD classifications of the MRD at the eastern and western most ends of the overlap region (Figure 9(b) and Figure 11(b)). In this case, the look direction for the MRD line was 98° different from that of the Barataria Bay and 82° different from Grand Isle flight lines. Relative to the FD classifications, CP classification correspondences are higher with the post-spill CP classification of the MRD (see Figure 10(b)). In contrast, even the moderate consistency of the post-spill Barataria Bay and Grand Isle Wishart-CP classifications (not shown) is lacking between these classifications and the post-spill Wishart-CP classification of the MRD (Figure 12(b)). Overall, the MLC variation and all classifications exhibit high to moderate consistency when look directions were directly opposite, however, when look directions differed by closer to ±90°, the CP classifications retained the highest and Wishart-CP the lowest consistency throughout the overlapped study region.
Figure 14. The CP decomposition of the 2010 MLC data of the (a) Barataria Bay (BB) and (b) Grand Isle (GI) flight lines, with the overlapping region common to the BB, GI, and MRD lines indicated. MRD, BB, and GI renditions used the same color reference table.
Remotesensing 03 02630 g014
Figure 15. Plots of polarimetric signatures of water at locations shown in Figure 11 for the 2009 and 2010 flight lines. Note the difference in vertical scale in c and d plots. Orientation angles near ±90° signify vertical scattering, while angles near 0° signify horizontal scattering components dominated the water surface backscatter. Ellipticity values near zero denote linear while those near ±45° denote circular polarizations.
Remotesensing 03 02630 g015

3.4. Surface-Oil Detection in Coastal Waters

We used the UAVSAR data to map the spatial extent of oil on the water surface within the study region and confirmed the results through observations by the field crew on the day of the 2010 MRD collection and by previous satellite collections. As shown in the pre- and post-spill comparison of MLC data and in all classifications analyzed, the pre-spill waters within Barataria Bay exhibit backscatter features typical of spatially variable wind disturbances of a water surface (e.g., Figure 11(a) and Figure 12(a)). In contrast, the post-spill MLC data and subsequent classifications exhibited two or sometimes three distinct water surfaces within the Barataria Bay waters and inland ponds (e.g., Figure 11(b) and Figure 12(b)). These distinct water features were largely persistent during the hour when the three 2010 MLC flight lines covering the study area were collected.
In order to substantiate that these patterns resulted from the presence and absence of surface water oil, polarimetric response plots (Figure 15) were created from MLC data extracted from inland tidal channels and Barataria Bay waters from the pre- and post-spill MRD flight lines (sample locations, Figure 11 (a,b)). The response plots exhibited expected changes from wind-wave roughened oil-free water surfaces to oil-damped surface waves [32]. In all cases, response plots of oil-free waters collected from the pre-spill MLC flight lines exhibited prominent peaks on the orientation axis at ±90°, suggesting a predominance of vertically oriented scatterers, and an ellipticity peak centered at zero, signifying a linear polarization (Figure 15(a,c,e,g,i)), all consistent with the well-known Bragg scattering mechanism for water [33]. In contrast, areas of water in the post-spill MRD flight line that were suspected of containing surface oil exhibited dampened backscatter returns that were 20–40 times less than their pre-spill value (Figure 15(b,f,h,j)), while water at the one location in the post-spill MRD flight line interpreted to be devoid of surface oil showed a backscatter power level consistent with the 2009 results (Figure 15(d)). An independent analysis found consistent results with the ones reported here, showing high entropy values for water in the interior of Barataria Bay where near-coincident C-band satellite data indicated oil presence [10]. These high entropy values have been shown to be associated with measurements of returns that are near the UAVSAR instrument noise floor where the noise, which is largely polarization independent, obscures the polarimetric signatures characteristic of Bragg scattering [31]. The non-oiled water returns were sufficiently far above the instrument noise floor to exhibit the Bragg scattering of polarimetric features [10]. Our results indicate that for the interior coastal waters the best indicator of surface oil presence is the radar return power.

4. Discussion

The collection of UAVSAR data during the Deepwater Horizon oil spill provided an unprecedented opportunity to determine the effectiveness of high spatial resolution and fully polarimetric airborne L-band SAR for mapping oil occurrences in coastal wetlands. Greatly increasing the potential for successful determination of SAR-based mapping effectiveness was the fortuitous near-anniversary UAVSAR collections (17 June 2009 and 23 June 2010) along flight lines over the extensively and heavily oiled marshes of Barataria Bay in eastern coastal Louisiana, enabling a direct comparison of backscatter properties before and after oil-spill impact. The high-performance, repeat-track stability of the UAVSAR platform also greatly enhanced the ability to perform change-detection comparisons of the 2009 and 2010 data collections. In addition, the near-anniversary dates of the 2009 and 2010 collections minimized variability in backscatter due to canopy structural changes, particularly phenological changes. Phenological variability was further minimized by the timing of collections, acquired during the full-growth stage of the marshes rather than during the transitional early spring and late fall seasons when rapid phenological changes occur. The availability of pre- and post-spill UAVSAR collections over exactly the same area helped substantiate that abnormal changes apparent in the 2010 data were likely caused by the presence of oil, although the possibility of shallow marsh flooding in 2009 does not allow us to unambiguously link changes in the interior marsh to oil presence.
As discussed, the dielectric properties of water and oil differ dramatically at microwave wavelengths, providing a basis for possible discernment of oil from water and soil influences on backscatter. One question concerning the detection of oil in the marsh was whether or not the presence of subcanopy standing water would influence detection. Water levels recorded in tidal creeks suggested the occurrence of shallow flooding during the 2009 UAVSAR collection; however, water-level recordings were obtained in tidal channels physically separated from the marsh platform diminishing their direct interpretability to marsh inundation [5]. Pre- and post-spill HH intensity comparison suggested possible inundation during the 2009 UAVSAR collection; however, the indicated inundation covered only the most interior portion of the oil impacted marshes of the study area. Conversely, the HH intensity comparison did substantiate the high consistency of the data collected in 2009 and 2010 of the marshes surrounding Barataria Bay and the recorded absence of marsh inundation at the time of the 2010 UAVSAR flight line. Another possibility for the slightly higher HH intensity in 2010 versus 2009 data is the occurrence of oil in the interior marshes. In addition, there are a number of instances where dramatic changes in the 2009 and 2010 MLC data were exhibited along the shoreline on one side of an island but not on the shoreline on the opposite side of the island. These observations contradict the idea that water-level changes were the root cause of the changes that we are attributing to oil exposure.

4.1. MLC Comparisons

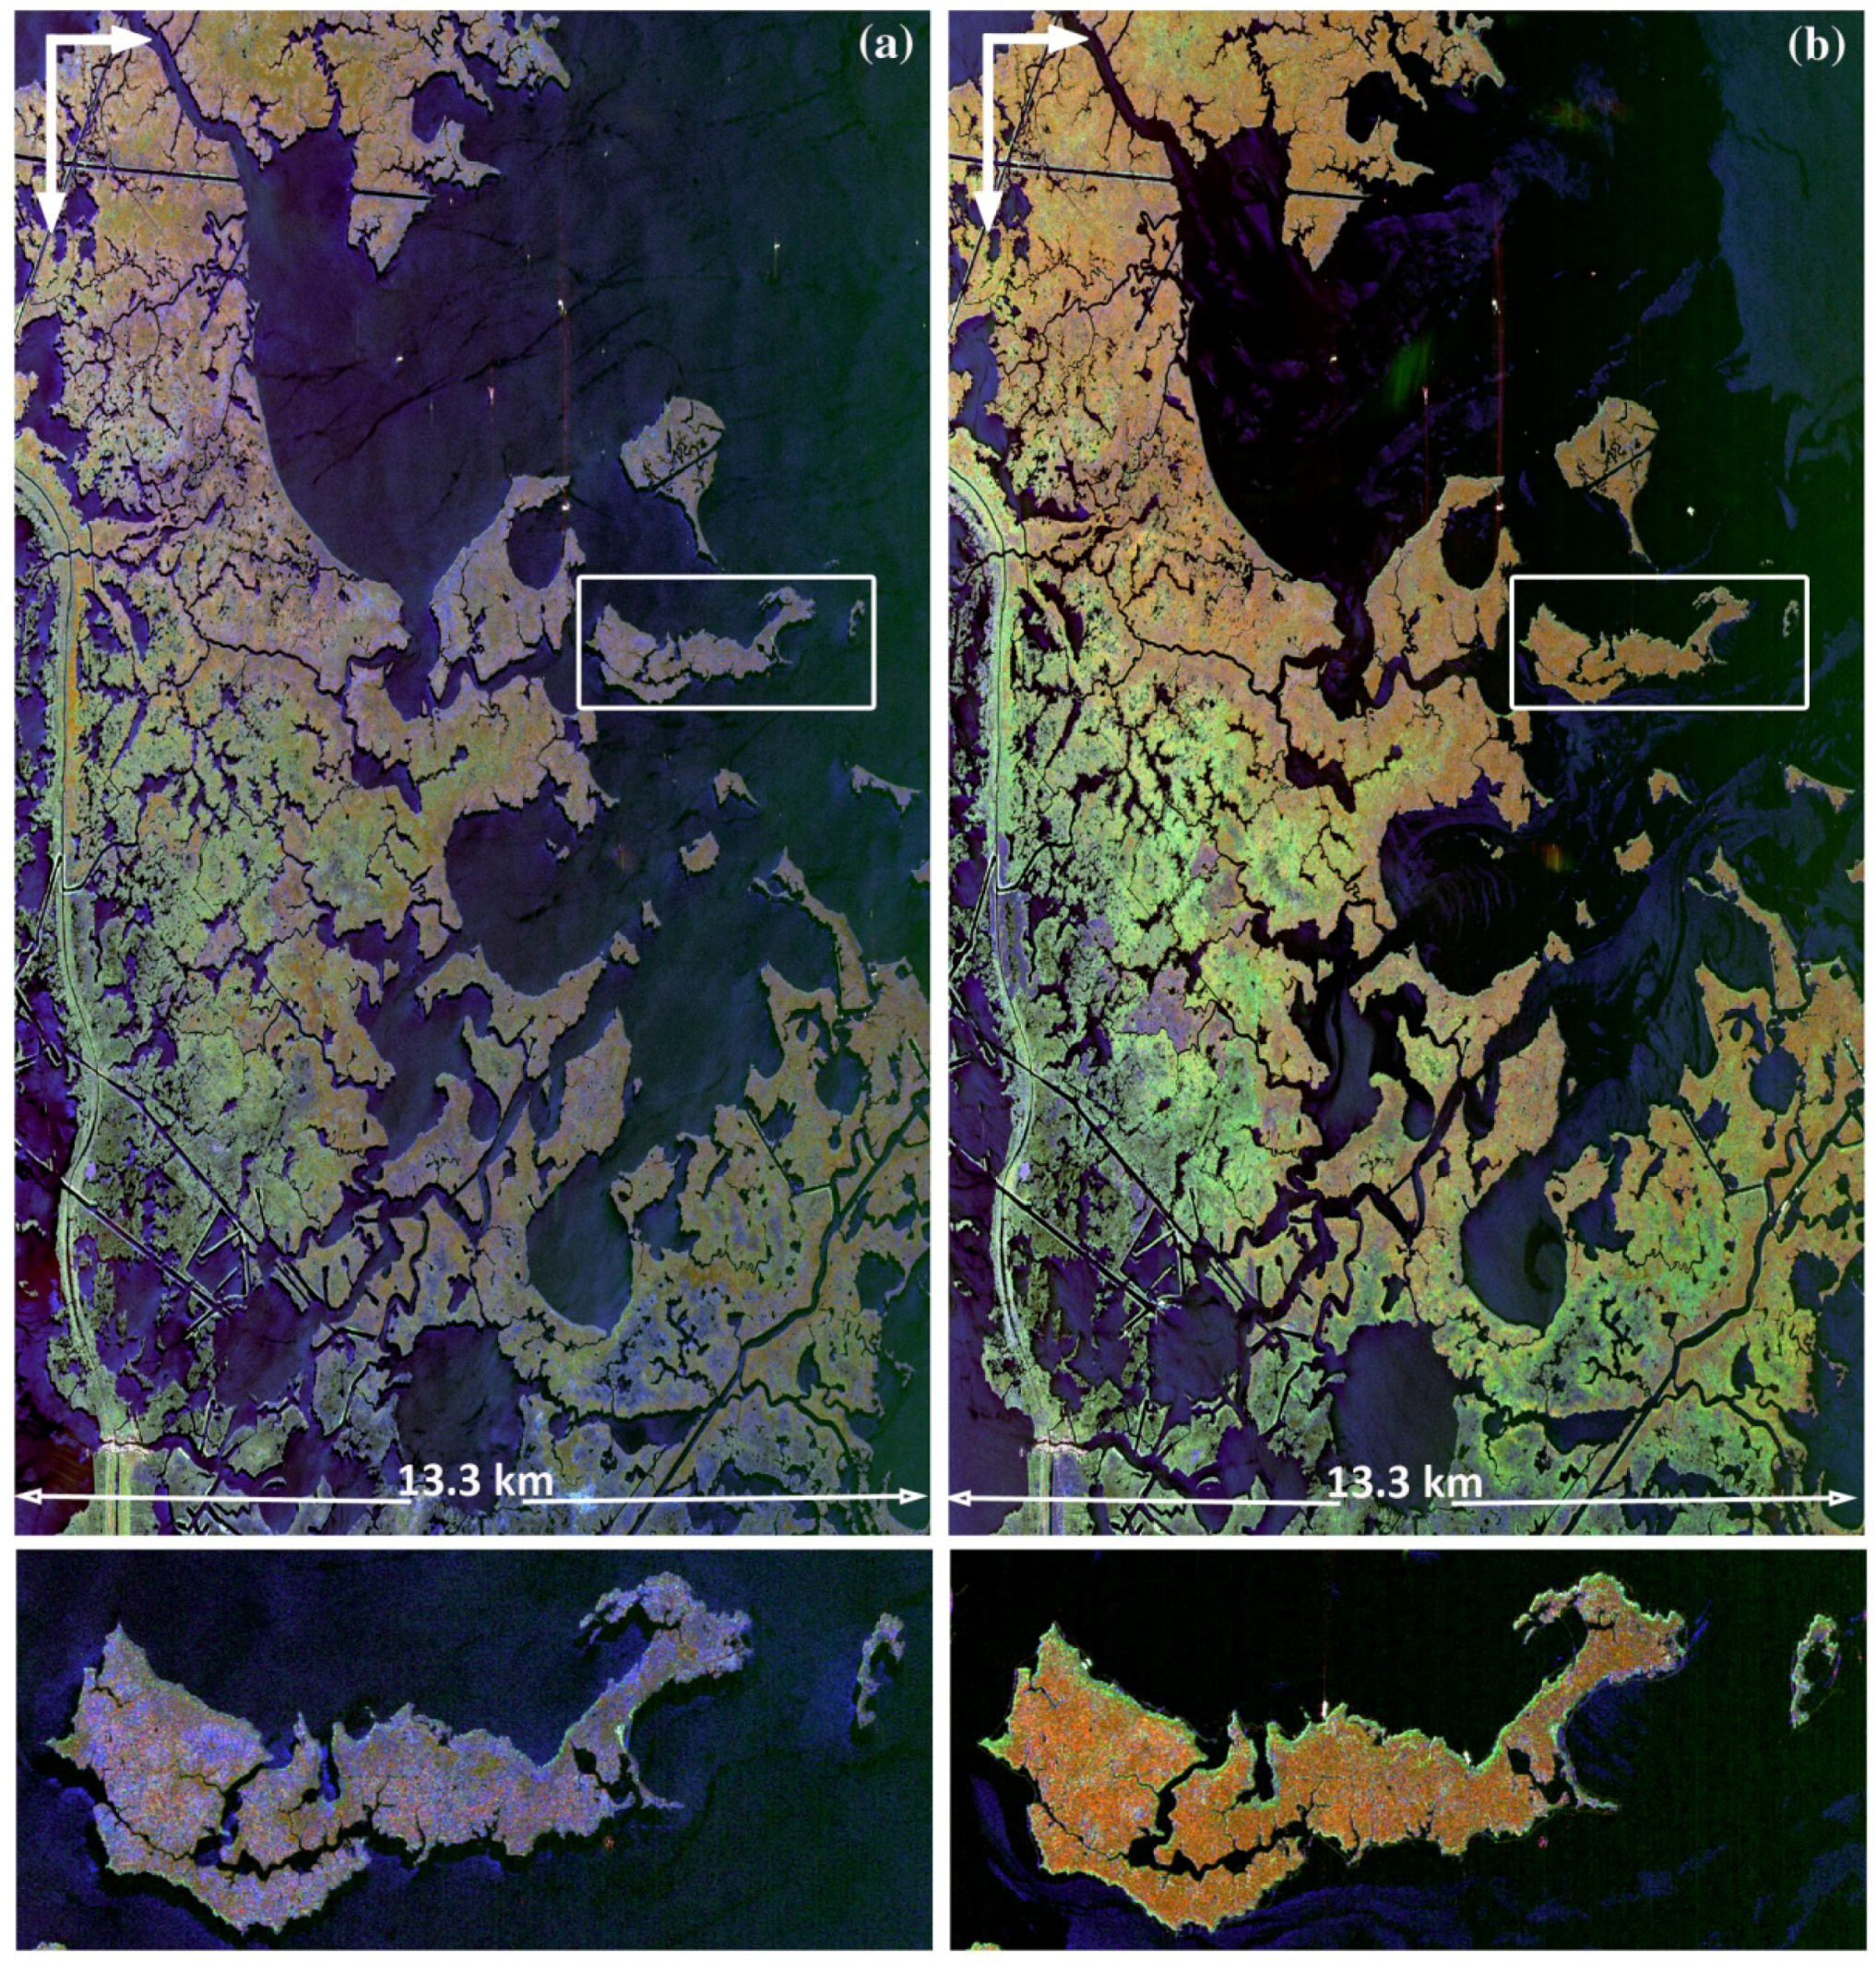
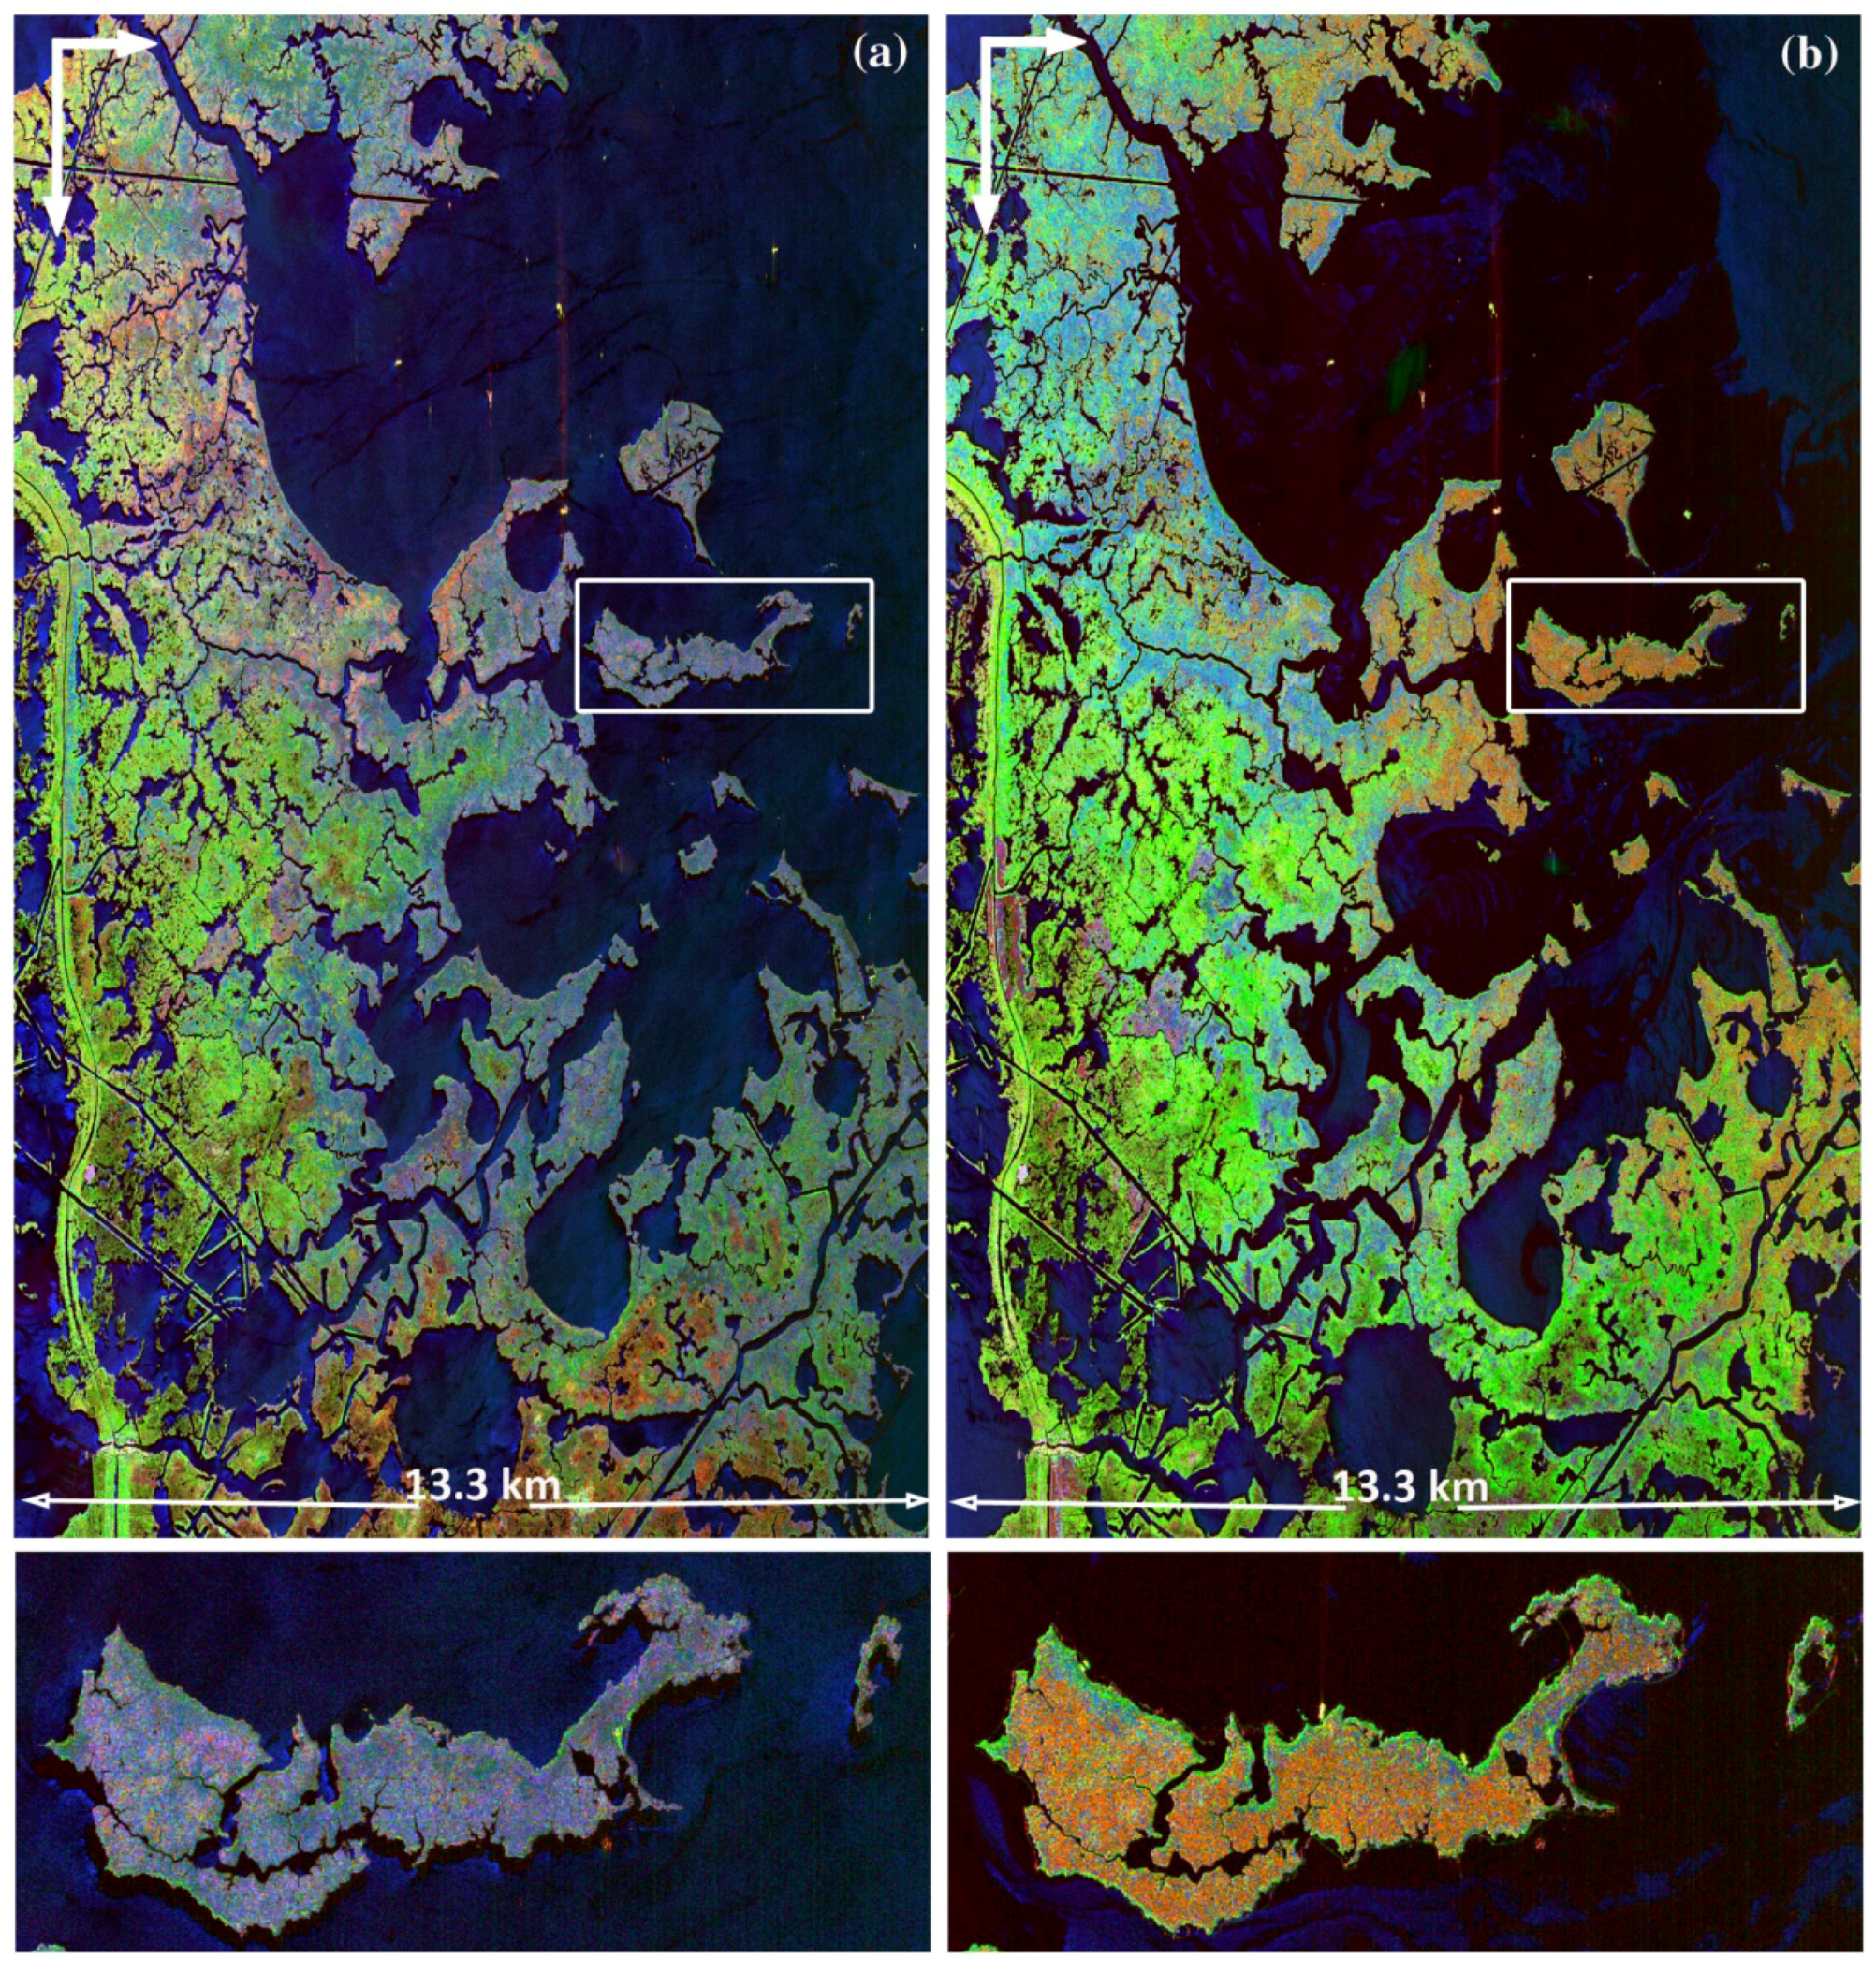
The MLC multi-polarization data collected pre- and post-spill differed considerably across the study area. Predominant differences represented oiled surface waters, damaged shoreline marshes, and backscatter changes within marshes in the vicinity of the impacted shorelines. These anomalous features identifiable in the MLC data of the post-spill flight line that are not identifiable in the pre-spill data provided the first evidence that oil occurrences within marshes, especially on vegetation, are distinguishable with PolSAR data. Similar features were also noted in the post-spill MLC data of the two flight lines that also included the study region but at different look directions.
The dramatic changes exhibited between the pre- and post-spill MLC data of the MRD flight lines, at times extending up to 40 m from the shoreline into the adjacent marsh, were confirmed at the immediate shoreline by SCAT-derived information, along with ground- and helicopter-based surveys made before, during, and after the post-spill UAVSAR collection. Ground-based observations estimated that the highly visible shoreline impacts related to a combination of canopy damage and the occurrence of oil coating on some subcanopy portion of the plants and sediments extended only 2–4 m into the marsh from the water’s edge. Extension of the oil impacts from those clearly visible at the immediate shoreline up to 40 m into the marsh provides evidence that the MLC data could detect subcanopy oil in the marsh without accompanying canopy structural damage, at least in marshes directly abutting heavily oiled shorelines.
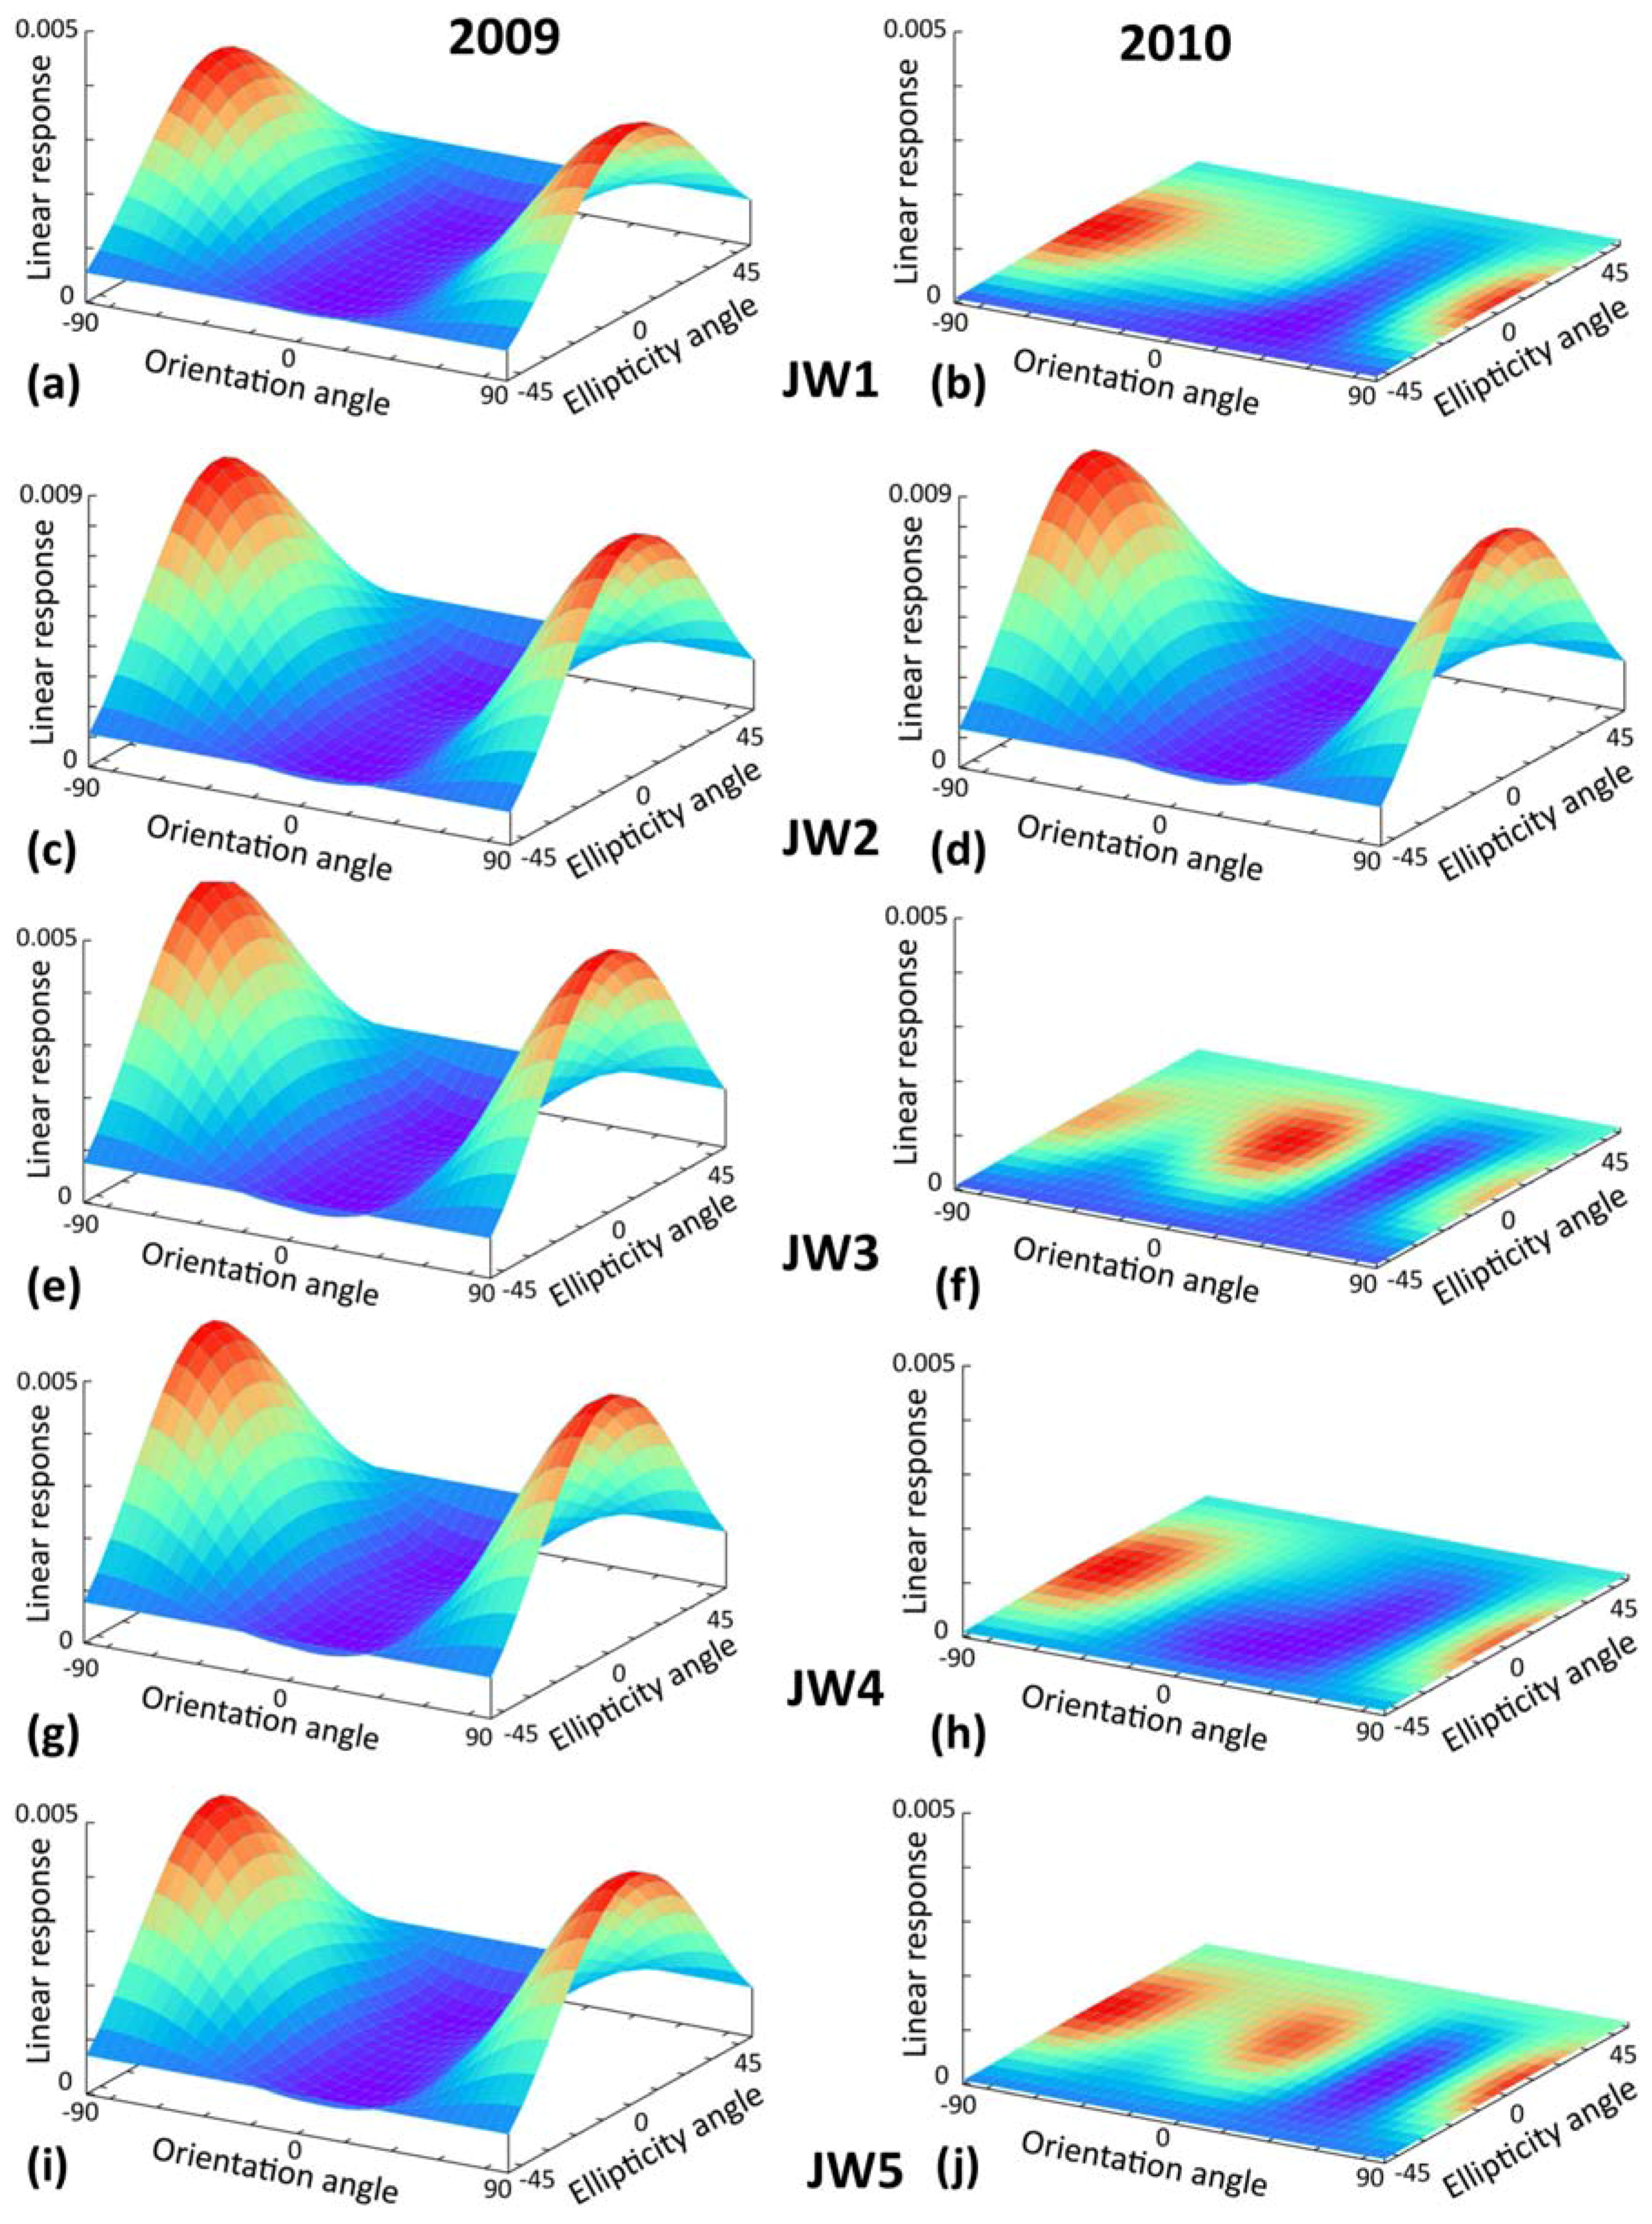
Reasonable evidence based on the MLC data also exists for the spatial extension of oil occurrence from the nearshore into the farther interior marsh in some areas. Evidence supporting deeper penetration of oil into the coastal marsh, particularly within the study region, is the concurrence of extensive oil-laden waters within Barataria Bay captured by satellite reconnaissance and sustained northerly winds and elevated tidal levels before the 2010 UAVSAR overflights. Polarimetric signature analyses established that while one of the post-spill water surface classes identified by the decompositions and classifications of the pre- and post-spill MLC data nearly replicated signatures of pre-spill class, the second post-spill class dominating the inner bay waters at the time of the 2010 UAVSAR overflight exhibited attenuated vertical backscatter indicating dampened water surfaces typical of surface oil. The concurrence and juxtaposition of persistent onshore winds, prolonged marsh flooding, and extensive oil-laden waters in the study area, the dramatically impacted shorelines, and the protective booms washed into the nearshore marsh, provides further evidence that oil-laden waters were driven deep into the interior marshes.
Outside the inferred detection of subcanopy oil in non-structurally damaged marshes based on extending the confirmed association between anomalies on the MLC data and heavily oil shorelines up to 40 m inland, we identified two distinct field sites where oil coatings occurred on the lower marsh stalks without canopy structural damage. Post-spill MLC data for both sites exhibited change features that were similar to those exhibited by shoreline marshes with combined oil and canopy damage and marshes immediately inland of those shorelines. Although these two sites contained heavily oiled subcanopies, they provided added evidence that fully polarimetic L-band SAR could detect oil in the marsh subcanopy coating some portion of the plants or soil surface without accompanying canopy damage. Even though waters traveling into the more interior marshes would have carried only thin surface films of oil, this evidence also supports the ability of UAVSAR data to detect oil coating plant stalks and sediment in the interior marshes.

4.2. Freedman-Durden and Cloude-Pottier Decompositions and Wishart Classifications

We studied oil-detection algorithms by decomposing the complete PolSAR backscatter information into the dominant backscatter mechanism for each pixel. The widely used FD and CP decompositions were used to map polarization-dependent backscatter as an operational method for determining changes in marsh structure and properties as evidence of oil intrusion into wetlands. The FD and CP decompositions and Wishart classifications based on those decompositions emphasized the abnormal changes noted between the pre- and post-spill MLC data of the MRD flight lines and generally separated those from marshes that did not exhibit changes. In both decompositions, however, the full inland extent of abnormal changes observed in the MLC data was not reproduced. In the FD, nearshore marsh that includes shoreline marshes of confirmed oil-spill impact exhibited a distinct change in backscatter mechanism from surface in 2009 to volumetric in 2010. Somewhat similarly, we observed an increase in volumetric backscatter in the post-spill CP decomposition of nearshore marshes, which were dominantly associated with surface backscatter in the pre-spill CP decomposition. In FD and CP decompositions, interior marshes that were likely to have been impacted by oil-laden waters were associated primarily with multiple-bounce (double or even number) scatter in post-spill flight lines and with surface scatter in pre-spill flight lines. The change in CP decomposition parameters was more expansive than for FD, extending from the core impact into the southeastern portion of the study area. In addition, the CP decomposition indicated that the pre- to post-spill change in scatter mechanism was accompanied by decreased entropy, i.e., by an increasing dominance of a single backscatter mechanism.
As in the MLC data comparisons, predominant changes exhibited in the FD and CP decompositions and classifications of the MLC data of the pre- and post-spill MRD flight lines were largely reflected in the post-spill classifications of the MLC data of the Barataria Bay and Grand Isle flight lines. In FD and CP classifications spatial correspondence between the Barataria Bay and Grand Isle results was high. However, the correspondence of the FD classification between the Barataria Bay, Grand Isle, and MRD data sets decreased at the extremes of the overlap of the flight lines. Therefore, spatial alignment in the FD classifications were high when SAR look directions were directly opposite but decreased when the look direction differed by closer to ±90°. The close correspondence obtained with opposite look directions was somewhat surprising given that the FD decomposition is not roll invariant [12]. In contrast, the CP H-α decomposition is roll invariant [34], which might account for the higher spatial correspondence between the Barataria Bay, Grand Isle, and MRD post-spill CP classifications for all look directions. Even though differences exist, abnormal features highlighted in the FD and CP decompositions and classifications largely coincide across multiple flight lines, independent of changes in SAR look direction and incidence angle. This robust correspondence of similar features in the classified MLC data extending beyond the multiple scene overlap study area provides additional evidence that abnormal changes across the 2009 and 2010 MLC data of the MRD flight lines are attributable to oil occurrences.
The Wishart-FD classification results closely replicated distributions and correspondences found in the three post-spill FD classifications. Because the Wishart-CP classification was not constrained to the seed dominant scatter mechanism, Wishart-CP and CP classes cannot be directly related. Even so, interior marshes that likely experienced oil impact were highlighted in the post-spill CP as well as Wishart-CP classification. While the pre-spill CP classification largely showed the marshes to exhibit more or less a uniform scatter mechanism, the pre-spill Wishart-CP classification clearly identified a variety of marsh classes. The post-spill Wishart-CP classification exhibited a class of marshes that extended from marshes highlighted as oil impacted further into the interior marshes. The Wishart-CP classification extended the CP decomposition class that most likely indicates oil contamination in the interior marshes, particularly in the southeast of the study area. The extended Wishart-CP class most closely reconstructed the abnormal changes in the marsh exhibited in the comparison of the pre- versus post-spill MLC data of the MRD. This same post-spill Wishart-CP class was present in the pre-spill Wishart-CP classification, although it became more extensive and spatially uniform at the time of the post-spill data collection. It is possible that marsh of similar structure and properties expanded throughout the study area from 2009 to 2010 or, given the spatial association of the second class with anomalous change features in the MLC data, that this second Wishart-CP class identifies a secondary class of marshes that contained some residual oil. We observe that a weakness of the Wishart-CP classification was its high sensitivity to changes in the input variance, in particular to changes related to the specific part of the flight line MLC data input and look angle.

5. Conclusions

We analyzed UAVSAR data collected during the 2010 Deepwater Horizon oil spill to assess the ability of a high-performance, fully polarimetric L-band SAR sensor system to detect oil occurrences in wetlands, including oil coating plant stalks and soil in the lower marsh canopy. Barataria Bay on the Louisiana state coastline was selected for concentrated study because it had experienced extensive oil impacts prior to the post-spill June 2010 UAVSAR overflights, it contained a high number of ground-based site observations, and it was fully imaged by several UAVSAR flight lines, including on a near-anniversary pre-spill date in 2009. The pre- and post-spill collections provided assessment of the effectiveness of a spatially and temporally targeted response and the capabilities of repeatable flight operations. Along with direct interpretation of the PolSAR data, we used Freeman-Durden (FD) and Cloude-Pottier (CP) decompositions of the multilooked complex (MLC) data to determine the physical basis for the abnormal changes observed in the MLC data and to provide a less subjective and more consistent method of retrieving polarimetric signatures that could be used to map the extent of oil intrusion into wetlands. Classification of FD and CP decomposition results was performed to enhance interpretation and comparison of MLC data collected pre- and post-spill and post-spill MLC data collected at different look directions.
Extensive observations of shoreline oil impacts made before, during, and after the UAVSAR collections confirmed that nearshore features in the post-spill MLC data included shoreline marshes exhibiting heavily oiling and structural damage and immediately inland marshes without structural damage at canopy level. Similar features were not evident in the pre-spill MLC data collected over the same area one year earlier. The FD decomposition of the MLC data and the Wishart classification seeded with the FD decomposition results (Wishart-FD) indicated that the prominence of the nearshore features resulted from a change in dominant scatter mechanism from before to after the spill. A similar transform was exhibited in the CP decomposition; however, the change was less pervasive than exhibited in the FD decomposition.
Changes exhibited in the pre- and post-spill MLC data and reproduced by FD and CP decompositions (although less extensively) and Wishart-FD and the Wishart classification seeded with CP decomposition results (Wishart-CP) also support excursion of oil further into the interior marsh. The pre- and post-spill FD and CP decompositions identify interior marsh that likely had contact with oil and that exhibited a changed dominant scatter mechanism from primarily surface to double or even bounce scatter. In the CP decomposition, this change in scatter mechanism also reflected the increased dominance of a single-scattering mechanism. The Wishart-CP classification best reproduced the abnormal change features in the interior marshes that were detected during the comparison of pre- and post-spill MLC data. One class in the Wishart-CP results mimicked change features identified in the FD, Wishart-FD, and CP classifications, and a second Wishart-CP class indicated spatial extension from that class further into the interior marsh.
Evidence provided by water-level recordings, wind data, and protection booms washed well up on the marsh substantiate that elevated flood conditions existed during the times when extensive oil slicks were observed by satellite in the northeastern apex of Barataria Bay starting a month prior to 2010 UAVSAR overflights. In addition, decompositions and classifications of the pre- and post-spill MLC data supported by polarimetric signature analyses confirmed Barataria Bay surface waters exhibited signatures typical of surface oil at the time of the 2010 UAVSAR overflight. This evidence supports the hypothesis that oil-laden waters penetrated into the interior marshes far from the shoreline; however, the lack of direct observational data within the interior marsh during the period when oil contamination possibly occurred and lingering uncertainty caused by possible flooding in the pre-spill flight line prevent absolute confirmation that backscatter changes in the interior marshes were associated with oil occurrences.
Abnormal features highlighted in the FD and CP decompositions and classifications largely coincide across multiple flight lines, independent of changes in SAR look direction and incidence angle. The FD decompositions (and Wishart-FD classifications) had the highest alignment when SAR look directions were directly opposite and the alignment was lowest when look directions differed nearer ±90º. The CP decompositions exhibited the highest spatial correspondences within all look directions. The Wishart-CP classification exhibited the least degree of conformity between the flight lines that were collected at different look directions.
Our most important result is direct confirmation that UAVSAR detected both shoreline damage and oil occurrences in the vicinity of impacted shorelines and that these impacts and occurrences were reproduced in backscatter decompositions and in the classifications based on those decompositions. These results confirm that low-noise, high-spatial resolution, PolSAR can be used to identify marsh areas affected by oil slicks and can be used to inform design of future satellite-based instruments for fine-scale wetland ecosystem monitoring. Our results also indicate that further studies are warranted to validate the potential capability of L-band radar to detect subcanopy oil impacts within interior marshes. In order to carry-out this validation, we recommend a series of tests under controlled or well-monitored surface conditions with a high resolution instrument such as UAVSAR, so that algorithms can be developed for satellite-based instruments with lower spatial resolution.

Acknowledgements

We acknowledge the support of Bruce Davis of the Department of Homeland Security, Kara Holekamp, Philip Kuper, and Steve Tate of the Stennis Space Center, and Darin Lee of the Louisiana State Office of Coastal Protection and Restoration, who collected the ground-site data in Barataria Bay during the UAVSAR overflights. We thank Francis Fields Jr. of the Apache Louisiana Minerals LLC, a subsidiary of Apache Corporation, for access to their properties and Jeff Deblieux IV of the Louisiana Land and Exploration Company, a subsidiary of Conoco Phillips, for access to their properties. We thank Buddy Goatcher of the US Fish and Wildlife Service (USFWS) and Warren Lorentz of the US Army Corps of Engineers for allowing the use of the helicopter video-survey imagery. We thank Robert Gosnell of the USFWS for access to the Southwest Louisiana National Wildlife Refuge Complex and Guthrie Perry of the Louisiana Department of Wildlife and Fisheries for access to the Rockefeller State Wildlife Refuge. Gratitude is extended to Dirk Werle of Aerde Environmental Research and Kevin Jones of PCI Geomatics for their thoughtful reviews and to Connie Herndon of US Geological Survey. The research described in this paper was carried out in part at the Jet Propulsion Laboratory, California Institute of Technology, under a contract with the National Aeronautics and Space Administration. Mention of trade names or commercial products is not an endorsement or recommendation for use by the US Government.

References

  1. Crone, T.J.; Tolstoy, M. Magnitude of the 2010 Gulf of Mexico oil leak. Science 2010, 330, 634. [Google Scholar] [CrossRef] [PubMed]
  2. Baker, J. Seasonal effects of oil pollution on salt marsh vegetation. Oikos 1971, 22, 106–110. [Google Scholar] [CrossRef]
  3. Hershner, C.; Lake, J. Effects of chronic oil pollution on a salt-marsh grass community. Mar. Biol. 1980, 56, 163–173. [Google Scholar] [CrossRef]
  4. Mendelssohn, I.; Lin, Q.; Carney, K.; Bryner, N.; Walton, W. Salt Marsh Recovery after in situ Burning for Oil Spill Remediation; Effects of Water Depth and Burn Duration; Report for US Department of Commerce; National Institute of Standards and Technology: Gaithersburg, MD, USA, 2000.
  5. Ramsey, E., III.; Werle, D.; Suzuoki, Y.; Rangoonwala, A.; Lu, Z. Limitations and potential of optical and radar satellite imagery to monitor environmental response to coastal emergencies in Louisiana, USA. J. Coast. Res. 2011, in press. [Google Scholar]
  6. Ramsey, E., III. Remote sensing of coastal environments. In Encyclopedia of Coastal Science; Encyclopedia of Earth Sciences Series; Schwartz, M.L., Ed.; Springer: Dordrecht, The Netherlands, 2005; pp. 797–803. [Google Scholar]
  7. Ramsey, E., III.; Nelson, G.; Sapkota, S.; Laine, S.; Verdi, J.; Krasznay, S. Using multiple polarization L-band radar to monitor marsh burn recovery. IEEE Trans. Geosci. Remote Sens. 1999, 37, 635–639. [Google Scholar] [CrossRef]
  8. Lee, J.-S.; Pottier, E. Polarimetric Radar Imaging: From Basics to Applications (Optical Science and Engineering); CRC Press: Boca Raton, FL, USA, 2009. [Google Scholar]
  9. Dobson, M.; Pierce, L.; Ulaby, F. Knowledge-based land-cover classification using ERS-1/JERS-1SAR composites. IEEE Trans. Geosci. Remote Sens. 1996, 34, 83–99. [Google Scholar] [CrossRef]
  10. Jones, C.E.; Minchew, B.; Holt, B.; Hensley, S. Studies of the Deepwater Horizon oil spill with the UAVSAR Radar. In Monitoring and Modeling of the Deepwater Horizon Oil Spill: A Record-Breaking Enterprise; American Geophysical Union Monograph Series; AGU: Washington, DC, USA, 2011; in press. [Google Scholar]
  11. Cloude, S.; Pottier, E.; Boerner, W.M. Unsupervised Image Classification using the Entropy/Alpha/Anisotropy Method in Radar Polarimetry. In Proceedings of The 2002 AIRSAR Earth Science and Application Workshop, Pasadena, CA, USA, 4–6 March 2002; p. 20.
  12. Putignano, C. PolSOM and TexSOM in Polarimetric SAR Classification. Ph.D. Thesis, Department of Computer, Systems and Production Engineering GeoInformation, Tor Vergata University, Rome, Italy, 2009; p. 163. [Google Scholar]
  13. Van Zyl, J. Unsupervised classification of scattering behavior using radar polarimetry data. IEEE Trans. Geosci. Remote Sens. 1989, 27, 36–45. [Google Scholar] [CrossRef]
  14. Shoreline Cleanup Assessment Techniques (SCAT) Maps . http://gomex.erma.noaa.gov/layerfiles/4809/metadata/cumulative_scat_houma.htm (accessed 1 September 2011).
  15. SONRIS (Strategic Online Natural Resources Information System) . Available online: http://sonris-www.dnr.state.la.us/www_root/sonris_portal_1.htm (accessed 10 December 2010).
  16. NOS/CO-OPS (National Ocean Service/Center for Operational Oceanographic Products & Services). NOAA Meteorological Data. Available online: http://tidesandcurrents.noaa.gov/gmap3/ (accessed on 1 September 2011).
  17. NOAA Satellite and Information Service. NESDIS Anomaly Analysis; Available online:. Available online: http://www.nesdis.noaa.gov/ (accessed on 1 September 2011).
  18. Davis, B.A.; Science and Technology Directorate, Emergency Preparedness and Response Portfolio, US Department of Homeland Security. Personal Communication.
  19. Cloude, S.; Pottier, E. A review of target decomposition theorems in radar polarimetry. IEEE Trans. Geosci. Remote Sens. 1996, 34, 498–518. [Google Scholar] [CrossRef]
  20. PCI Geomatics. Geomatica SPW 10.1 User Guide (SAR Polarimetry Workstation); PCI Geomatics Enterprises, Inc.: Richmond Hill, ON, Canada, 2007. [Google Scholar]
  21. dos Santos, J.; Narvaes, I.; Graca, P.; Goncalves, F. Polarimetric responses and scattering mechanisms of tropical forest in the Brazilian Amazon. In Advances in Geoscience and Remote Sensing; Jedlovec, G., Ed.; InTech: Vulkovar, Croatia, 2009; pp. 183–206. [Google Scholar]
  22. Woodhouse, I.; Turner, D. On the visualization of polarimetric response. Int. J. Remote Sens. 2003, 24, 1377–1384. [Google Scholar] [CrossRef]
  23. Touzi, R.; Deschamps, A.; Rother, G. Phase of target scattering for wetland characterization using polarimetric C-band SAR. IEEE Trans. Geosci. Remote Sens. 2009, 47, 3241–3261. [Google Scholar] [CrossRef]
  24. Freeman, A.; Durden, S. A three component scattering model for polarimetric SAR data. IEEE Trans. Geosci. Remote Sens. 1998, 36, 963–973. [Google Scholar] [CrossRef]
  25. Cloude, S.; Pottier, E. An entropy based classification scheme for land applications of polarimetric SAR. IEEE Trans. Geosci. Remote Sens. 1997, 35, 68–78. [Google Scholar] [CrossRef]
  26. Lee, J.S.; Grunes, M.; Ainsworth, T.; Du, L.J.; Schuler, D.; Cloude, S. Unsupervised classification using polarimetric decomposition and the complex Wishart classifier. IEEE Trans. Geosci. Remote Sens. 1999, 37, 2249–2258. [Google Scholar]
  27. Ouarzeddine, M.; Souissi, B.; Belhadj-Aissa, A. Unsupervised Classification Using Wishart Classifier. In Proceedings of the 3rd International Workshop on Science and Applications of SAR Polarimetry and Polarimetric Interferometry, Frascati, Italy, 22–26 January 2007.
  28. Nielsen, A.; Conradsen, K.; Skriver, H. Polarimetric Synthetic Aperture Radar Data and the Complex Wishart Distribution. In Proceedings of 13th Scandinavian Conference on Image Analysis (SCIA), Halmstad, Sweden, June 29–July 2, 2003; Bigun, J., Gustavsson, T., Eds.; Springer: Berlin, Germany, 2003; pp. 1082–1089. [Google Scholar]
  29. Ramsey, E., III; Lu, Z.; Suzuoki, Y.; Rangoonwala, A.; Werle, D. Monitoring duration and extent of storm surge flooding along the Louisiana coast with Envisat ASAR data. IEEE J. Sel. Topics Appl. Earth Obs. Remote Sens. 2011, 4, 387–399. [Google Scholar] [CrossRef]
  30. Ramsey, E., III; Nelson, G.; Baarnes, F.; Spell, R. Light attenuation profiling as an indicator of structural changes in coastal marshes. In Remote Sensing and GIS Accuracy Assessment; Lunetta, R., Lyon, J., Eds.; CRC Press: New York, NY, USA, 2004; pp. 59–73. [Google Scholar]
  31. Minchew, B.; Jones, C.E.; Holt, B. Polarimetric analysis of backscatter from the Deepwater Horizon oil spill Using L-band radar. IEEE Trans. Geosci. Remote Sens. 2011. submitted. [Google Scholar] [CrossRef]
  32. Fingas, M.F.; Brown, C.E. Review of oil spill remote sensing. Spill Sci. Tech. Bull. 1997, 4, 199–208. [Google Scholar] [CrossRef]
  33. Valenzuela, G. Theories for the interaction of electromagnetic and oceanic waves—A review. Bound-Lay. Meteorol. 1978, 13, 61–85. [Google Scholar] [CrossRef]
  34. Touzi, R. Target scattering decomposition in terms of roll-invariant target parameters. IEEE Trans. Geosci. Remote Sens. 2007, 45, 73–84. [Google Scholar] [CrossRef]

