Increasing Spatial Detail of Burned Scar Maps Using IRS‑AWiFS Data for Mediterranean Europe

Abstract
:1. Introduction
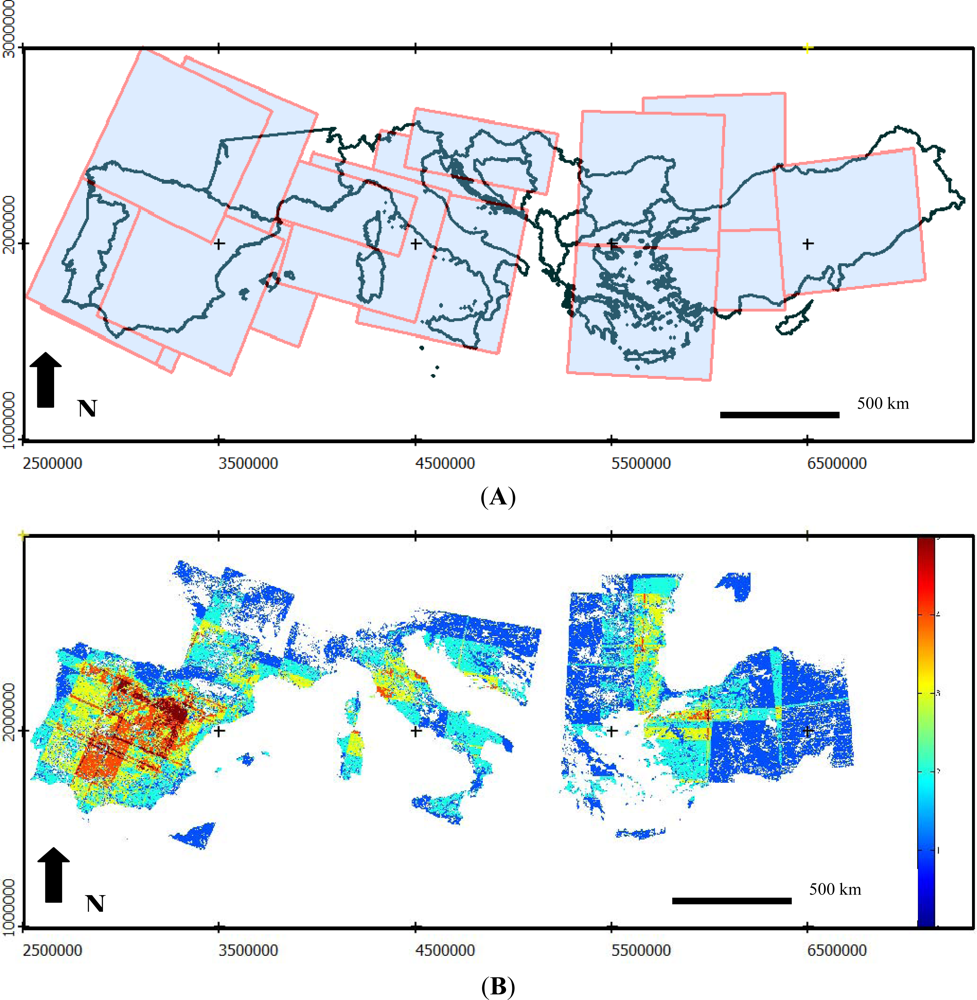
2. Study Area
3. Data
3.1. Satellite Imagery
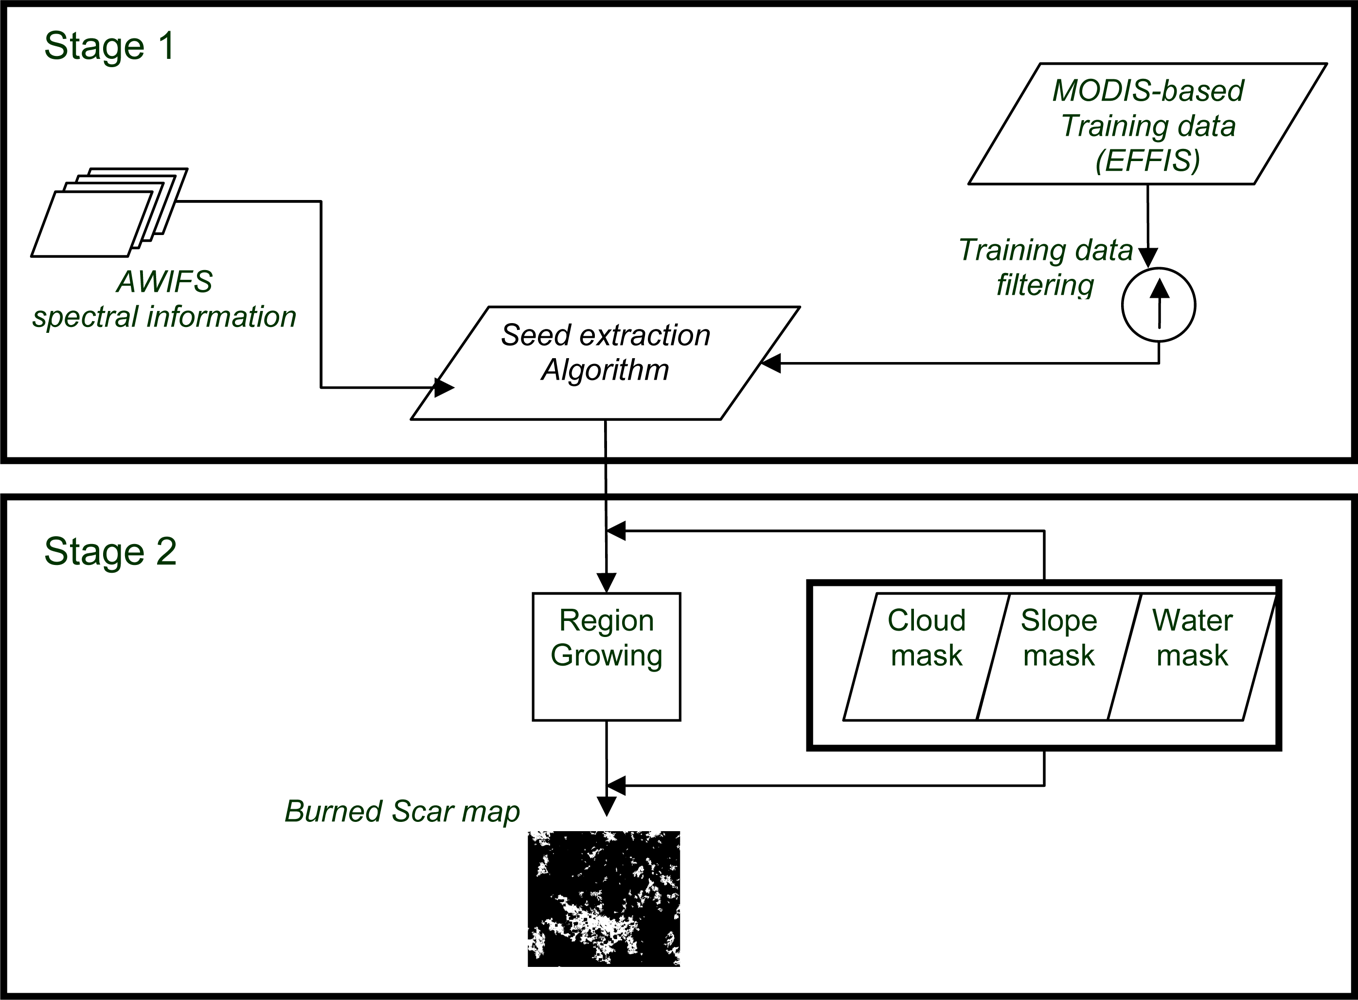
3.2. Burned Area Training Data
3.3. Ancillary Data
- A 100 m spatial resolution digital elevation model (DEM) resampled from the Version 3 of the Shuttle Radar Topographic Mission (SRTM) 90 m Digital Elevation Data [27]. For Eurasia the absolute height error and absolute geolocation error of the SRTM DEM have been estimated in 6.2 m and 8.8 m respectively [28]. Until a full validation of the ASTER Global Digital Elevation Model is carried out, the SRTM-DEM is the most complete and accepted high-resolution digital topographic database of Earth.
- The Forest Type Map 2006 (FTYP2006) at 25 m spatial resolution developed by the EC-JRC [28]. This product provides information about the distribution of broadleaved and coniferous forests. In addition to this information, this product also includes a water class at a spatial resolution of 25 m. The reported overall accuracy of the product calculated for a number of study sites over different environmental conditions is 88% [29].
- A series of 16-days MODIS composites at 250 m spatial resolution corresponding to the same dates of each of the AWiFS scenes. The original radiometrically calibrated and atmospherically corrected red wavelength reflectance MODIS are produced within the EFFIS pre-processing chain as 250 m rasters in LAEA/ETRS89 projection [30].
- CORINE Land Cover dataset (CLC) [31]. The CLC provides land use and land cover information at pan-European level. CLC is mostly produced on the basis of visual interpretation of high resolution remote sensing data including 44 land use/land cover classes mapped with a minimum mapping unit of 25 ha. The CLC 2006 update with a 100 m spatial resolution was used for this study. In the absence of definitive accuracy figures for CLC 2006, the figures for CLC 2000 provide a basic indication. The reliability of CLC 2000 at 95% confidence level was estimated at 87.0±0.7% [32].
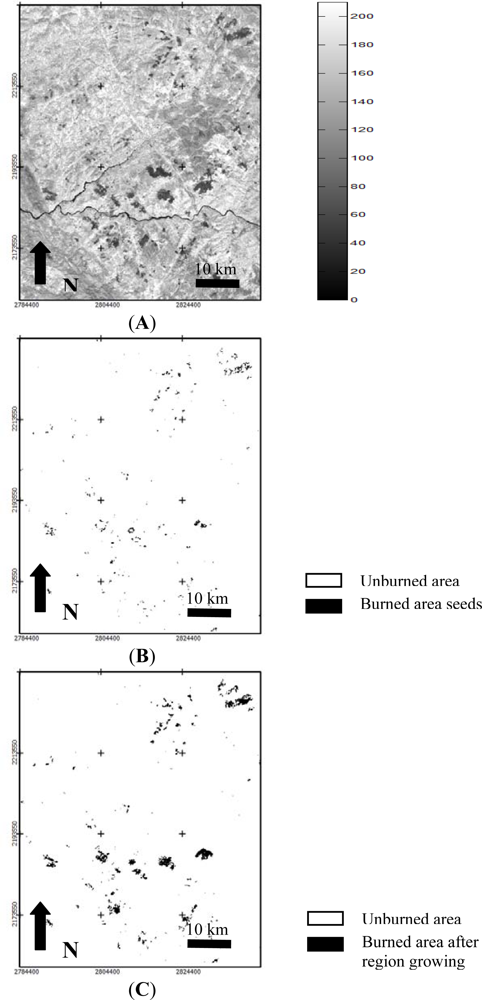
4. Methodology
5. Results and Discussion
6. Conclusions
Acknowledgments
References
- Csiszar, I.; Justice, C.O.; Mcguire, A.D.; Cochrane, M.A.; Roy, D.P.; Brown, F. Land use and fires. In Land Change Science: Observing, Monitoring, and Understanding Trajectories of Change on the Earth’s Surface; Gutman, G., Janetos, A.C., Justice, C.O., Moran, E.F., Mustard, J.F., Rindfuss, R.R., Skole, D., Turner, B.L., II, Cochrane, M.A., Eds.; Kluwer Academic Publishers: Dordrecht, The Netherlands, 2004. [Google Scholar]
- Bastarrika, A. Cartografía Automática de Área Quemada a Nivel Local-Regional Mediante Algoritmos de Contexto Espacial (in Spanish). Ph.D. Thesis, University of Alcalá, Alcalá de Henares, Spain. 2009. [Google Scholar]
- Pereira, J.M.C.; Sá, A.C.L.; Sousa, A.M.O.; Silva, J.M.N.; Santos, T.N.; Carreiras, J.M.B. Spectral characterization and discrimination of burned areas. In Remote Sensing of Large Wildfires in the European Mediterranean Basin; Chuvieco, E., Ed.; Springer-Verlag: Berlin, Germany, 1999; pp. 123–138. [Google Scholar]
- Chuvieco, E.; Congalton, R.G. Using cluster analysis to improve the selection of training statistics in classifying remotely sensed data. Photogramm. Eng. Remote Sensing 1998, 54, 1275–1281. [Google Scholar]
- Jakubauskas, M.E.; Lulla, K.P.; Mausel, P.W. Assessment of vegetation change in a fire-altered forest landscape. Photogramm. Eng. Remote Sensing 1990, 56, 371–377. [Google Scholar]
- Chuvieco, E.; Congalton, R.G. Mapping and inventory of forest fires from digital processing of TM data. Geocarto Int 1988, 3, 41–53. [Google Scholar]
- Pu, R.; Gong, P. Determination of burned scars using logistic regression and neural network techniques from a single post-fire Landsat 7 ETM+ image. Photogramm. Eng. Remote Sensing 2004, 70, 841–850. [Google Scholar]
- Kontoes, C.C.; Poilve, H.; Florsch, G.; Keramitsoglou, I.; Paralikidis, S. A comparative analysis of a fixed thresholding vs. a classification tree approach for operational burn scar detection and mapping. Int. J. Appl. Earth Obs. Geoinf 2009, 11, 299–316. [Google Scholar]
- Cochrane, M.A.; Souza, C.M. Linear mixture model classification of burned forests in the Eastern Amazon. Int. J. Remote Sens 1998, 19, 3433–3440. [Google Scholar]
- Polychronaki, A.; Gitas, I. Burned area mapping in Greece using SPOT-4 HRVIR images and object-based image analysis. Remote Sens 2012, 4, 424–438. [Google Scholar]
- Fraser, R.H.; Li, Z.; Chilar, J. Hotspot and NDVI Differencing Synergy (HANDS): A new technique for burned area mapping over boreal forest. Remote Sens. Environ 2000, 74, 362–376. [Google Scholar]
- Zhang, Y.-H.; Wooster, M.J.; Tutubalina, O.; Perry, G.L.W. Monthly burned area and forest fire carbon emission estimates for the Russian Federation from SPOT VGT. Remote Sens. Environ 2003, 87, 1–15. [Google Scholar]
- Tansey, K.; Grégoire, J.-M; Stroppiana, D.; Sousa, A.; Silva, J.M.N.; Pereira, J.M.C.; Boschetti, L.; Maggi, M.; Brivio, P.A.; Fraser, R.; Flasse, S.; Ershov, D.; Binaghi, E.; Graetz, D.; Peduzzi, P. Vegetation burning in the year 2000: Global burned area estimates from SPOT VEGETATION data. J. Geophys. Res.-Atmos 2004, 109, D14S03. [Google Scholar]
- Grégoire, J.-M.; Tansey, K.; Silva, J. M. N. The GBA2000 initiative: Developing a global burned area database from SPOT-VEGETATION imagery. Int. J. Remote Sens 2003, 24, 1369–1376. [Google Scholar]
- Simon, M.; Plummer, S.; Fierens, F.; Hoeltzemann, J.J.; Arino, O. Burned area detection at global scale using ATSR-2: The GLOBSCAR products and their qualification. J. Geophys. Res 2004, 109. [Google Scholar]
- Plummer, S.; Arino, O.; Simon, M.; Steffen, W. Establishing a Earth observation product service for the terrestrial carbon community: The GlobCarbon initiative. Mitig. Adapt. Strategies Glob. Chang 2006, 11, 97–111. [Google Scholar]
- Roy, D.P.; Boschetti, L.; Justice, C.O.; Ju, J. The Collection 5 MODIS Burned Area Product: Global evaluation by comparison with the MODIS active fire product. Remote Sens. Environ 2008, 112, 3690–3707. [Google Scholar]
- Sandau, R.; Paxton, L.; Esper, J. Trends and visions for small satellite missions. In Small Satellites for Earth Observation; Sandau, R., Röser, H.-P., Valenzuel, A., Eds.; Springer: Dordrecht, The Netherlands, 2008; pp. 27–39. [Google Scholar]
- San-Miguel-Ayanz, J.; Camia, A. Forest fires at a glance: Facts, figures and trends in the EU. In Living with Wildfires: What Science can Tell Us? A Contribution to the Science-Policy Dialogue; Birot, Y., Ed.; EFI: Joensuu, Finland, 2009; pp. 11–18. [Google Scholar]
- European Commission, Forest Fires in Europe 2008; EUR 23492 EN; Office for Official Publications of the European Communities: Luxembourg, 2009; p. 77.
- Pereira, J.M.C.; Teresa, N.S. Fire Risk and Burned Area Mapping in Portugal; Direcção-Geral das Florestas DGF: Lisbon, Portugal, 2003. [Google Scholar]
- Gonzalez-Alonso, F.; Merino-de-Miguel, S. Integration of AWiFS and MODIS active fire data for burn mapping at regional level using the Burned Area Synergic Algorithm (BASA). Int. J. Wildland Fire 2009, 18, 404–414. [Google Scholar]
- FAO. FAO Global Ecological Zones. 2001. Available online: http://www.fao.org/geonetwork/srv/en/main.home/ (accessed on 11 February 2011).
- European Commission, Forest Fires in Europe 2009; EUR 24910 EN; Office for Official Publications of the European Communities: Luxembourg, 2010; p. 98.
- IRS-P6 Data User’s Handbook; IRS 6/NRSA/NDC/HB 10/03; National Remote Sensing Agency: Hyderabad, India, 2003.
- INSPIRE. INSPIRE Directive. 2011. Available online: http://inspire.jrc.ec.europa.eu/ (accessed on 12 August 2011).
- Farr, T.G.; Rosen, P.A.; Caro, E.; Crippen, R.; Duren, R.; Hensley, S.; Kobrick, M.; Paller, M.; Rodriguez, E.; Roth, L.; Seal, D.; Shaffer, S.; Shimada, J.; Umland, J. The Shuttle Radar Topography Mission. Rev. Geophys 2007, 45, RG2004. [Google Scholar]
- Rodriguez, E.; Morris, C.S.; Belz, J.E.; Chapin, E.C.; Martin, J.M.; Daffer, W.; Hensley, S. An Assessment of the SRTM Topographic Products; Technical Report JPL D-31639; Jet Propulsion Laboratory: Pasadena, CA, USA, 2005; p. 143. [Google Scholar]
- Kempeneers, P.; Sedano, F.; Seebach, L.; Strobl, P.; San Miguel, J. Data fusion of different spatial resolution remote sensing images applied to forest type mapping. IEEE Trans. Geosci. Remote Sens 2011, 49, 4977–4986. [Google Scholar]
- San-Miguel-Ayanz, J.; Pereira, J.M.C.; Boca, R.; Strobl, P.; Kucera, J.; Pekkarinen, A. Forest fires in the European Mediterranean Region: Mapping and analysis of burned areas. In Earth Observation of Wildland Fires in Mediterranean Ecosystems; Chuvieco, E., Ed.; Springer-Verlag: Berlin, Germany, 2009; pp. 189–204. [Google Scholar]
- EEA. European Environmental Agency Data Service. 2010. Available online: http://www.eea.europa.eu/data-and-maps/data/ (accessed on 11 February 2011).
- EEA. The Thematic Accuracy of Corine Land Cover, Assessment Using LUCAS (Land Use/Cover Area Frame Statistical Survey). Technical Report No 7/2006. 2006. Available online: http://www.eea.europa.eu/publications/technical_report_2006_7/ (accessed on 12 February 2012).
- Sedano, F.; Kempeneers, P.; Strobl, P.; Vogt, P.; San Miguel, J. Towards a pan-European burnt scar mapping methodology based on single date high resolution optical remote sensing data. Int. J. Appl. Earth Obs. Geoinf 2011, in press.. [Google Scholar]
- Martin, P. Cartografía e inventario de incendios forestales en la Península Ibérica a partir de imágenes NOAA-AVHRR (in Spanish). Ph.D. Thesis, University of Alcalá, Alcalá de Henares, Spain. 1998. [Google Scholar]
- Bastarrika, A.; Chuvieco, E.; Martín, M.P. Mapping burned areas from Landsat TM/ETM+ data with a two-phase algorithm: Balancing omission and commission errors. Remote Sens. Environ 2011, 115, 1003–1012. [Google Scholar]
- Petropoulos, G.P.; Kontoes, C.; Keramitsoglou, I. Burnt area delineation from a uni-temporal perspective based on Landsat TM imagery classification using Support Vector Machines. Int. J. Appl. Earth Obs. Geoinf 2011, 13, 70–80. [Google Scholar]
- Anderson, J.A.; Rosenfeld, E. Neurocomputing: Foundations of Research; MIT Press: Cambridge, MA, USA, 1988. [Google Scholar]
- Kimes, D.S.; Nelson, R.F.; Manry, M.T.; Fung, A.K. Attributes of neural networks for extracting continuous vegetation variables from optical and radar measurements. Int. J. Remote Sens 1998, 19, 2639–2662. [Google Scholar]
- Al-Rawi, K.R.; Casanova, J.L.; Calle, A. Burned area mapping system and fire detection system, based on neural networks and NOAA-AVHRR imagery. Int. J. Remote Sens 2001, 22, 2015–2032. [Google Scholar]
- Brivio, P.A.; Maggi, M.; Binaghi, E.; Gallo, I. Mapping burned surfaces in sub-Saharan Africa based on multi-temporal neural classification. Int. J. Remote Sens 2003, 24, 4003–4018. [Google Scholar]
- Sunar, F.; Özkan, C. Forest fire analysis with remote sensing data. Int. J. Remote Sens 2001, 22, 2265–2277. [Google Scholar]
- Breiman, L. Bagging predictors. In Machine Learning; Kluwer Academic Publishers: Hingham, MA, USA, 1996. [Google Scholar]
- Hastie, T.; Thibsinari, R.; Friedman, J. The Elements of Statistical Learning. Data Mining, Inference and Prediction; Springer-Verlag: New York, NY, USA, 2001. [Google Scholar]
- González, R.C.; Woods, R.E. Digital Image Processing, 2nd ed.; Prentice Hall: Upper Saddle River, NJ, USA, 2002. [Google Scholar]
- Roy, D.P.; Lewis, P.E.; Justice, C.O. Burned area mapping using multi-temporal moderate spatial resolution data-A bi-directional reflectance model-based expectation approach. Remote Sens. Environ 2002, 83, 263–286. [Google Scholar]
- Sedano, F.; Kempeneers, P.; Strobl, P.; Vogt, P.; Seebach, L.; San Miguel, J. A cloud mask methodology for high resolution remote sensing data combining information from high and medium resolution optical sensors. ISPRS J. Photogramm 2012, in press. [Google Scholar]
- Roy, D.P.; Boschetti, L. Southern Africa Validation of the MODIS, L3JRC and GLOBCARBON Burned Area Products. IEEE Trans. Geosci. Remote Sens 2009, 47, 1032–1044. [Google Scholar]
- Holben, B.; Justice, C. An examination of spectral band ratioing to reduce the topographic effect in remotely sensed data. Int. J. Remote Sens 1981, 2, 115–133. [Google Scholar]


| ID | Country | RDA (ha) | DA (ha) | Area Difference (%) |
|---|---|---|---|---|
| 1 | Portugal | 12,075 | 7,262 | 39.86 |
| 2 | Italy | 8,059 | 4,832 | 40.05 |
| 3 | Spain | 7,570 | 4,446 | 41.27 |
| 4 | Spain | 7,288 | 5,572 | 23.55 |
| 5 | Spain | 7,165 | 3,525 | 50.80 |
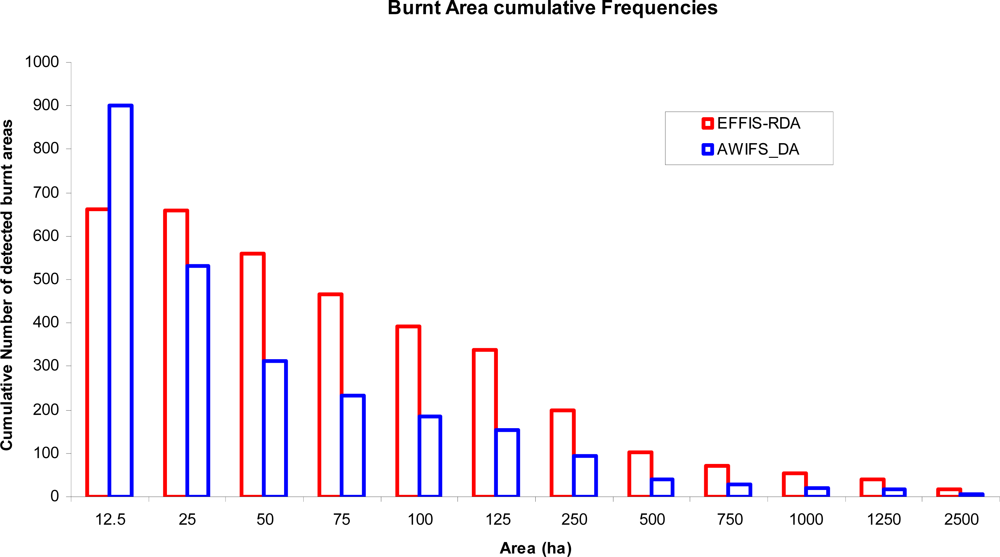
| Burned Areas Larger than (ha) | No Detected Burned Areas in EFFIS-RDA Map | No Undetected Burned Areas in IRS-AWiFS Map | Percentage of Detection Agreement (EFFIS-RDA as Reference) |
|---|---|---|---|
| 10 | 663 | 376 | 43.29 |
| 25 | 659 | 373 | 43.40 |
| 50 | 561 | 308 | 45.10 |
| 75 | 466 | 242 | 48.07 |
| 100 | 391 | 193 | 50.64 |
| 125 | 339 | 160 | 52.80 |
| 250 | 200 | 76 | 62.00 |
| 500 | 103 | 29 | 71.84 |
| 750 | 71 | 17 | 76.06 |
| 1,000 | 53 | 10 | 81.13 |
| 1,250 | 39 | 6 | 84.62 |
| 2,500 | 17 | 1 | 94.12 |
| Burned Areas Larger than (ha) | No Detected Burned Areas in IRS-AWiFS Map | No Undetected Burned Areas in EFFIS-RDA Map | Percentage of Detection Agreement (IRS-AWiFS as Reference) |
|---|---|---|---|
| 10 | 901 | 439 | 51.28 |
| 25 | 530 | 195 | 63.21 |
| 50 | 312 | 79 | 74.68 |
| 75 | 233 | 49 | 78.97 |
| 100 | 186 | 30 | 83.87 |
| 125 | 152 | 26 | 82.89 |
| 250 | 93 | 10 | 89.25 |
| 500 | 40 | 0 | 100.00 |
| 750 | 27 | 0 | 100.00 |
| 1,000 | 20 | 0 | 100.00 |
| 1,250 | 17 | 0 | 100.00 |
| 2,500 | 5 | 0 | 100.00 |
Share and Cite
Sedano, F.; Kempeneers, P.; Strobl, P.; McInerney, D.; San Miguel, J. Increasing Spatial Detail of Burned Scar Maps Using IRS‑AWiFS Data for Mediterranean Europe. Remote Sens. 2012, 4, 726-744. https://doi.org/10.3390/rs4030726
Sedano F, Kempeneers P, Strobl P, McInerney D, San Miguel J. Increasing Spatial Detail of Burned Scar Maps Using IRS‑AWiFS Data for Mediterranean Europe. Remote Sensing. 2012; 4(3):726-744. https://doi.org/10.3390/rs4030726
Chicago/Turabian StyleSedano, Fernando, Pieter Kempeneers, Peter Strobl, Daniel McInerney, and Jesús San Miguel. 2012. "Increasing Spatial Detail of Burned Scar Maps Using IRS‑AWiFS Data for Mediterranean Europe" Remote Sensing 4, no. 3: 726-744. https://doi.org/10.3390/rs4030726
APA StyleSedano, F., Kempeneers, P., Strobl, P., McInerney, D., & San Miguel, J. (2012). Increasing Spatial Detail of Burned Scar Maps Using IRS‑AWiFS Data for Mediterranean Europe. Remote Sensing, 4(3), 726-744. https://doi.org/10.3390/rs4030726