Hyperspectral Time Series Analysis of Native and Invasive Species in Hawaiian Rainforests

1
Centre for Remote Sensing and Earth Observation Processes (TAP), Flemish Institute for Technological Research (VITO), Boeretang 200, BE-2400 Mol, Belgium
2
Department of Global Ecology, Carnegie Institution for Science, 260 Panama Street, Stanford, CA 94305, USA
*
Author to whom correspondence should be addressed.
Remote Sens. 2012, 4(9), 2510-2529; https://doi.org/10.3390/rs4092510
Submission received: 26 June 2012
/
Revised: 21 August 2012
/
Accepted: 22 August 2012
/
Published: 29 August 2012
(This article belongs to the Special Issue Remote Sensing of Biological Diversity)
Abstract
:The unique ecosystems of the Hawaiian Islands are progressively being threatened following the introduction of exotic species. Operational implementation of remote sensing for the detection, mapping and monitoring of these biological invasions is currently hampered by a lack of knowledge on the spectral separability between native and invasive species. We used spaceborne imaging spectroscopy to analyze the seasonal dynamics of the canopy hyperspectral reflectance properties of four tree species: (i) Metrosideros polymorpha, a keystone native Hawaiian species; (ii) Acacia koa, a native Hawaiian nitrogen fixer; (iii) the highly invasive Psidium cattleianum; and (iv) Morella faya, a highly invasive nitrogen fixer. The species specific separability of the reflectance and derivative-reflectance signatures extracted from an Earth Observing-1 Hyperion time series, composed of 22 cloud-free images spanning a period of four years and was quantitatively evaluated using the Separability Index (SI). The analysis revealed that the Hawaiian native trees were universally unique from the invasive trees in their near-infrared-1 (700–1,250 nm) reflectance (0.4 > SI > 1.4). Due to its higher leaf area index, invasive trees generally had a higher near-infrared reflectance. To a lesser extent, it could also be demonstrated that nitrogen-fixing trees were spectrally unique from non-fixing trees. The higher leaf nitrogen content of nitrogen-fixing trees was expressed through slightly increased separabilities in visible and shortwave-infrared reflectance wavebands (SI = 0.4). We also found phenology to be key to spectral separability analysis. As such, it was shown that the spectral separability in the near-infrared-1 reflectance between the native and invasive species groups was more expressed in summer (SI > 0.7) than in winter (SI < 0.7). The lowest separability was observed for March–July (SI < 0.3). This could be explained by the invasives taking advantage of the warmer summer period to expand their canopy. There was, however, no specific time window or a single spectral region that always defined the separability of all species groups, and thus intensive monitoring of plant phenology as well as the use of the full-range (400–2,500 nm) spectrum was highly advantageous in differentiating each species. These results set a basis for an operational invasive species monitoring program in Hawai’i using spaceborne imaging spectroscopy.
1. Introduction
Invasive species rank second only to habitat loss as a threat to biodiversity and ecosystem processes. Invasive plant species can change entire habitats by penetrating the native canopy and eventually replacing it [1]. At times, fundamental ecosystem processes such as nitrogen (N) cycling as well as disturbance regimes such as fire frequency are altered by the introduced species, resulting in a major change in biological diversity and ecosystem functioning [2].
Effective management of introduced species starts with monitoring and mapping, which is a central component of the biological diversity protection programs of many government agencies and non-governmental organizations worldwide [3]. Remote detection and mapping of biodiversity and invasive species from airborne or spaceborne instruments is promising (review by [4]), but operational approaches are lacking because of our limited biophysical understanding of when remotely sensed signatures indicate the presence of unique species—native or invasive—within and across ecosystems. The spectra express the biochemical and structural properties of the vegetation, but translating that to species composition requires an increased understanding of the spectral separability of species at different levels of ecological and taxonomic aggregation.
In this light, Asner et al. [2] reported on the spectral separability of the most common native and invasive tree species found in tropical and subtropical forests of Hawai’i. Using high spatial resolution airborne imaging spectroscopy, Asner et al. [2] found that the reflectance and derivative-reflectance signatures of Hawaiian native trees were generically unique from those of introduced trees; while N-fixing trees were spectrally unique from non-fixing trees. The observed spectral differences were quantitatively linked to differences in leaf pigment, nutrient and structural properties, and the findings were used to develop a new invasive species monitoring capability in Hawai’i based on imaging spectroscopy [5].
In the current study we extend the work of Asner et al. [2] by including a temporal dimension to the analysis. Although clear spectral differences among the major groups of species were demonstrated, previous findings [2] were based on a single January 2005 image acquisition. Seasonal and inter-seasonal variation in canopy spectral properties were ignored, yet phenological differences throughout and between growing seasons can affect the spectral separability of species [6,7]. A temporal analysis of the spectral separability is thus important not only to broaden our understanding of how to translate the biochemical and structural properties of the vegetation to species composition, but also to place previous results in the proper temporal context. Intensive monitoring of plant species dynamics allows us to capture the phenological differences among taxa, which in turn, can aid in determining the best time to discriminate between targeted species [8]. Whereas such an intensive temporal spectral analysis is not generally feasible using airborne campaigns, the advent of spaceborne imaging spectrometer missions (e.g., Hyperion, EnMap, Prisma) is increasing the availability of hyperspectral time series enabling temporal analysis of vegetation dynamics.
Here we focus on a montane rainforest in Hawai’i using an Earth Observing-1 Hyperion time series composed of 22 cloud-free images captured over a period of four years. Native forests in the study area are dominated by the keystone Hawaiian tree species Metrosideros polymorpha and the native N-fixing species Acacia koa. However, these forests have been heavily invaded by several introduced tree species [9, 10]. Two of the most severe threats are the N-fixing Morella faya and the non-fixing Psidium cattleianum tree species. Our Hyperion dataset provided a unique way to evaluate the spectro-temporal separability of these four major upper canopy tree species, each of which falls into a different plant group: (i) non-fixing native; (ii) N-fixing native; (iii) non-fixing invasive; and (iv) N-fixing invasive. We addressed the following research questions: Are the spectral differences between the species groups originally observed by Asner et al. [2] consistent over time? Or does phenology plays a significant role in determining the spectral separability of these tree species? Which time of year is best suited for discriminating different species groups? Can we integrate spectral information from different times of year to optimize spectral separability, or is there a specific time of year that allows for systematic separation of species groups? Answering these questions is requisite to advancing invasive species mapping and monitoring efforts in Hawai’i.
2. Materials and Methods
2.1. Study Area and Remote Sensing
This study focused on a 1,500 ha rainforest in Hawai’i Volcanoes National Park on the Island of Hawai’i (Figure 1). The island is located at approximately 20° north latitude, which creates a seasonal sunlight cycle [11] that affects forest chemical phenology and leaf area index (LAI) [12]. The area is located at approximately 1,200 m above sea level, and characterized by a mean annual rainfall of 2,500 mm [13,14] and an annual temperature fluctuating between 14 °C in winter and 17 °C in summer [1]. The young volcanic soils are poor in N [1]. The dominant native Hawaiian overstory tree species are Metrosideros polymorpha and the N-fixing Acacia koa [5,15]. Yet, infestations of two highly invasive tree species, N-fixing Morella faya and the non-fixing Psidium cattleianum, are widespread. Psidium was introduced from Brazil in 1825 and is among the most highly invasive trees in Hawai’i [16]. Morella was introduced from the Azores about fifty years ago, and is also considered highly invasive.
Different life strategies results in structural and physiological differences between species and over time. Metrosideros forests in the area are approximately 20 m tall and have a LAI of about 3 [5]. Its foliage is low in N (0.7–0.8%) and water concentrations (45–55%; [12]). The native Acacia has a comparable leaf water content, but a much higher leaf N content (2.6–2.9%) than Metrosideros. The invasive Morella is characterized by a LAI > 5, and a moderate leaf water content ranging of 50–65%. Due to its N-fixing capacity, the leaf N concentration is relatively high (1.5–1.9%). Psidium trees have an LAI of around 4, a leaf canopy water content of approximately 60%, and an average leaf N content of 1.2% [2]. Currently, about 35% of the montane rainforest canopy is covered by Metrosideros, 20% by Acacia, 25% by Morella and 20% by Psidium.
No cloud-free images could be acquired in April and May. For all other months, at least one cloud-free Hyperion image covering the study area was acquired. Most images with little to no cloud cover were obtained in winter (December–February) or summer (July–August), corresponding to the two drier times of year [13].
The Hyperion data were processed to apparent surface reflectance using the ACORN-5LiBatch (Imspec LLC, Palmdale, CA, USA) atmospheric correction model. Subsequently, a destriping algorithm was applied to compensate for miscalibration between cross-track detectors. A cubic spline curve was fit to the water bands at 940 and 1,140 nm in each pixel to reduce effects of miscalibration and modeling errors introduced by atmospheric correction. Full details on the preprocessing chain can be found in [18]. The spectral information in 1,800–2,500 nm was not considered in further analysis due to its low signal-to-noise (SNR) ratio.
Based on our knowledge of the study area, and spatially guided by data from an airborne, very high resolution image dataset [19], each of the targeted species patches with approximately 100% canopy cover were selected for analyses of the Hyperion images. Approximately 400 spectra (or image pixels) were selected for each species and used to build species-specific databases. These time series were then used to evaluate spectral-phenological changes among species throughout the year.
2.2. Spectral Separability
For each image in the time series, the spectral separability of the different species was quantified using a Separability Index (SI) [20,21], defined as the ratio of the between-class variability and the within-class variability:
where Rmean,1,i and Rmean,2,i are the mean reflectance values at wavelength i for endmember class 1 and endmember class 2, respectively, and σ1,i and σ2,i are the standard deviations of class 1 and 2, respectively. The higher the SI value, the more separable are the two species in the given waveband.
The SI was not only calculated for the calibrated reflectance spectra but we also worked with the 1st derivative spectra. A Savitzky-Golay smoothing filter (filter size = 50 nm) was applied prior to derivative analysis [22,23]. Due to its increased sensitivity to noise, higher order derivatives were not included in the separability analysis [24]. Further, we also analyzed the SI of the temporal spectral displacement or the temporal spectral derivative. Temporal displacement spectra were calculated as the per-waveband difference in reflectance between two consecutive time steps or images in the time series. This transformation of the image data is intended to highlight spectral changes due to differences in phenology between species.
3. Results and Discussion
3.1. Species Comparisons
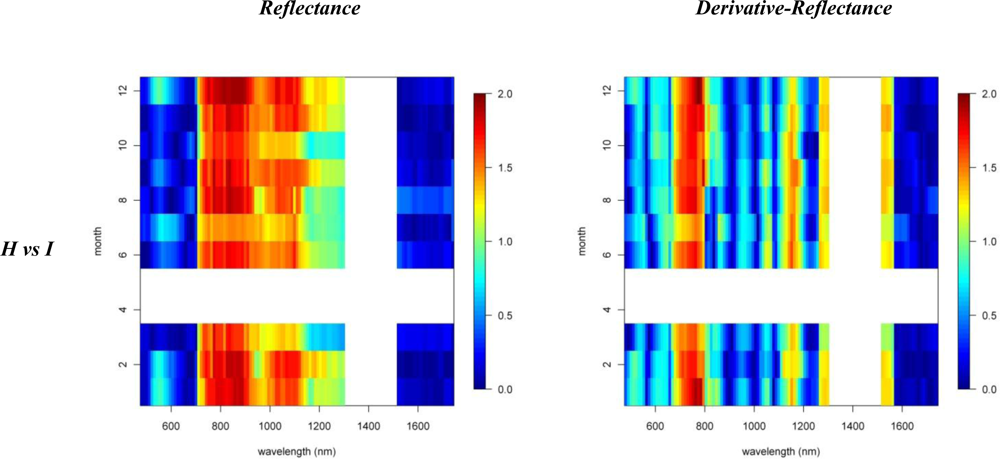
Figures 2 and 3 provide the spectro-temporal SI charts for the different pairwise species comparisons of the original reflectance and derivative-reflectance spectra, respectively. Similar charts for the temporal displacement spectra are presented in Figures 4 and 5. The X and Y axes of the charts represent the spectral bands and the time scale, respectively. The charts were compiled from the 22 cloud free images (see Section 2.1), and the color coding shows the monthly SI values. Per month all endmember spectra (of different years, Table 1) were included in the SI calculation. Be aware that the color coding key is specific to each panel, as not to discard subtle differences in the temporal dynamics of SI. Figures 4 and 5 show the SI charts for the temporal spectral displacement spectra, i.e., the change in reflectance between consecutive time steps. The charts should be interpreted as an indicator for species differences in the change in reflectance between two consecutive months, keeping in mind that no images were available in April and May.
Next we will systematically discuss the spectral differences between the different species groups. Recall that Metrosideros polymorpha is a proxy for a Hawaiian non-fixing tree (H); Acacia Koa a typical example of a Hawaiian N-fixer (HN); Morella faya a representative invasive N-fixing tree (IN); and Psidium cattleianum an invasive non-fixer (I).
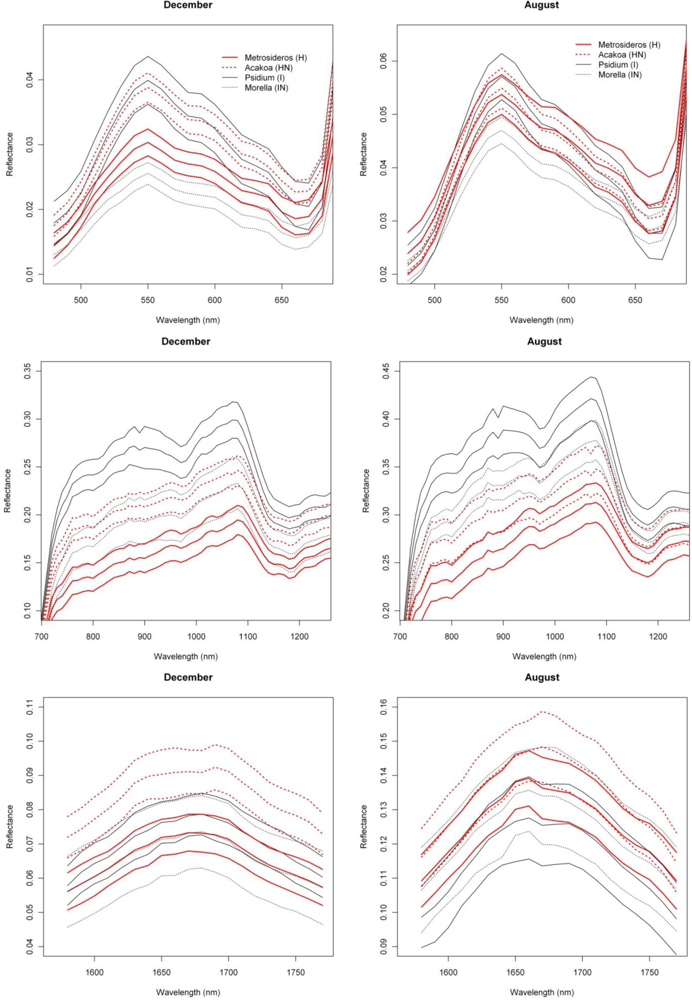
With SI values exceeding 1.5, the spectral reflectance differences between H and I were highest in the near-infrared-1 domain between 680 and 1080 nm (Figure 2). Although consistently high throughout the year, the highest SI values (>1.9), and therefore best separability between H and I, were observed in December and January, particularly for the 770–870 nm spectral range (Figure 2). Corroborating the findings of Asner et al. [2], we found that the non-fixing invader (I) had significantly higher reflectance in the near-infrared as compared to H. This is illustrated in Figure 6 presenting the mean and standard deviation spectra for H and I in December and August. The year-round strong separability in this spectral domain could be attributed to a higher LAI for the invader [2]. Metrosideros is a slow-growing hardwood native species with a relatively stable canopy structure and chemistry throughout the year [12]. Compared to the near-infrared-1, SI values for the near-infrared-2 (1,090–1,270 nm) were systematically lower (Figure 2). Yet the highest values (∼1.3) were again observed in winter. Little to no differences between species were observed in the shortwave-infrared (SI < 0.3, Figure 2).
In our densely foliated canopies the near-infrared-2 and the shortwave-infrared reflectance were foremost dominated by variations in canopy water content, but to varying canopy depths [2]. As described by [12] the shortwave-infrared reflectance has a lower “effective photon penetration depth” (EPPD) compared to near-infrared-2 reflectance. Consequently, while the shortwave-infrared reflects mainly the upper canopy water content, the amount of foliage that contributes to the Hyperion reflectance spectrum is maximal in the 1,125–1,300 nm region. This explained the difference in separability between spectral domains as well as the slight increase in near-infrared-2 reflectance in winter which could be attributed to relative changes in LAI. During these winter months the green bands centered around 550 nm also showed a slight increase in separability (SI = 0.8) compared to the rest of the year (Figure 2). In December I showed higher reflectance in this spectral domain compared to H (Figure 6) because of yellowing of Psidium leaves due to unfavorable low sun conditions at a time when precipitation is high (Asner, unpublished data).
The first derivative transformed data indicated separability opportunities similar to those provided by the reflectance data (Figure 2). A year round high separability was observed for the 670-770 nm 1st-d reflectance (SI ranging between 1.5 and 2), with slightly higher SI values in December and January (Figure 2). Figure 7, showing the 1st-d reflectance spectra for the H and I libraries in December and August, verified this increased spectral difference in the red edge region. Although not as expressed, particularly in the summer months we also observed SI values > 1 for the 1st-d reflectance band centered around 1,150 nm (Figure 2). This absorption feature is associated with canopy water and the increased derivative values (Figure 7; or steeper slope in the original reflectance spectra, Figure 6) for Psidium support the higher leaf water content values reported in [2]. The analysis as such indicated that especially in summer months the difference in leaf water content between H and I increased which translated itself in a better spectral discrimination in the derivative spectra.
Analysis of the temporal spectral displacement did not add significant information in terms of spectral separability between H and I (all SI values < 0.7, Figure 4). Yet the highest SI were observed for the September–February transition in the 720–770 nm bands which again could be attributed to the more dynamic LAI for Psidium at the one side and the relative stable Metrosideros canopy at the other.
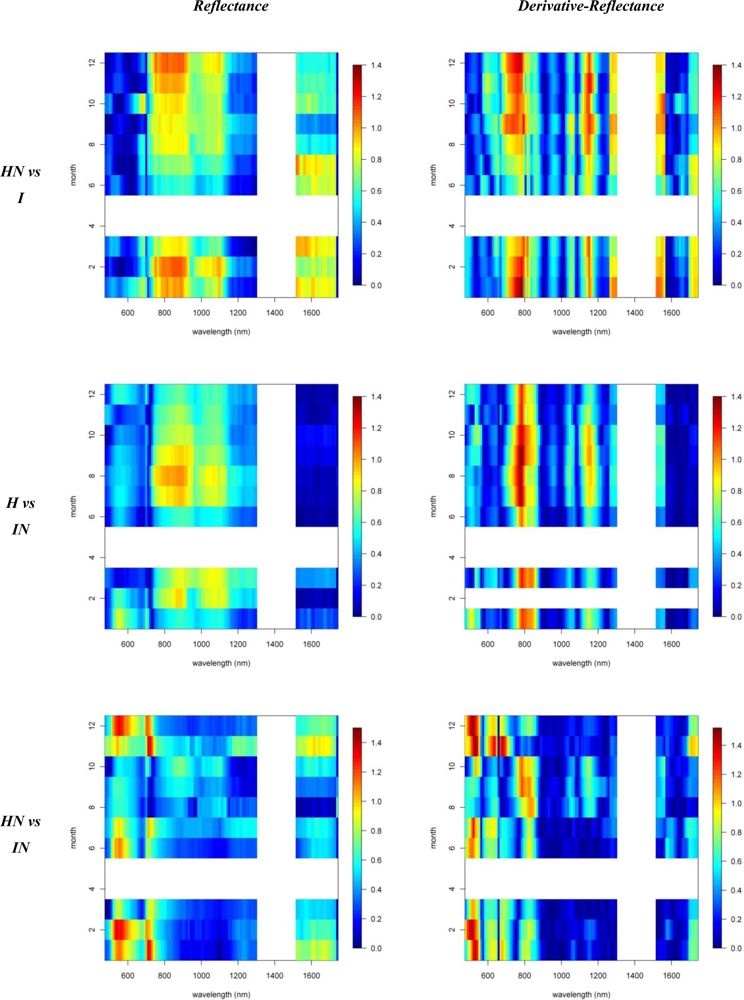
Similar spectral differences as observed between H and I were also observed when comparing HN and I. The highest SI values (1–1.2) were obtained for the near-infrared-1 (Figure 6) and 670–770 nm 1st-d reflectance bands (red edge) and there was a tendency for increased separability in winter (Figure 2). In the transition period from summer to winter we also noticed the increased separability (SI > 1) in the 1,150 nm derivative reflectance band (canopy water) which was also observed when comparing H and I. As opposed to the H-I comparison, however, the spectral separability in the near-infrared-2 (canopy water) and the visible wavebands was relatively low (SI < 0.4) while in the first half of the year the separability in the shortwave-infrared (1,550–1,800 nm) was relatively high (SI > 0.9; Figure 2) due to an overall higher shortwave-infrared reflectance of Acacia Koa (HN) in winter months (Figure 6).
When comparing H and IN, the near-infrared-1 plateau is the best spectral reflectance domain for separating these species. However, separability was highest in summer, rather than winter (SI >1 in August and September vs. SI < 0.7 in December and January, Figure 2). Morella exhibited increased reflectance compared to Metrosideros, but Figure 6 indicates that the difference between these species in the near-infrared-1 was lower in December than August. This confirmed the earlier results of [9] and [12], who showed a similar trend in LAI for a smaller endmember library and a shorter time series, respectively. Morella produces more photosynthetically active leaves in summer meanwhile the native canopy remains relatively stable [12]. The near-infrared-2 (canopy water) and shortwave-infrared (upper-canopy water) did not contribute significantly to spectral separability (<0.4) which points to limited differences in canopy water content between H and IN (Figure 2). This corroborated the results of Asner et al. [2] in which destructive field measurements showed high resemblance between the leaf water content of both species (51% for Metrosideros vs. 52% for Morella). Although the observations were made only during winter months, our temporal spectral analysis indicates a limited difference in canopy water content throughout the year.
The 1st-d reflectance spectra remained useful in separating H and IN. The red edge derivative bands, between 720 and 770 nm, were the most discriminating, with a clear shift towards higher separability in summer months (Figure 2). The temporal displacement spectra proved useful in separating species (Figure 4) particularly during the transition period from February to June, which showed a relatively high separability potential for the near-infrared (SI ranging between 0.7 and 1). This could be explained by an increase in Morella LAI towards the summer [12]. Slightly higher SI values were also observed for the temporal shift in visible and shortwave-infrared reflectance during the seasonal transition periods February–June and September–December (SI around 0.6, Figure 4). This was related to the yellowing of Morella leaves during the unfavorable wet winter conditions and increasing leaf chlorophyll concentration in the winter-summer transition period [12]. In comparison, the Metrosideros canopy remained relatively stable throughout the entire year.
As opposed to previous comparisons, the spectral separability between HN and IN was not well expressed in the near-infrared-1 reflectance plateau (Figure 2). However, we found a clear increase in spectral separability in August–November (SI around 0.8) compared to the winter months (SI < 0.2). This trend was also confirmed by the spectral libraries shown in Figure 6 and could be attributed to a slight increase in LAI for Morella when conditions are favorable [12]. Yet, the 520–570 nm band was better suited to separating both species, except for the August–October period for which SI dropped from >1 to <0.7. The same trend could be observed for the shortwave-infrared reflectance with a drop from 0.8 in winter to <0.4 in the rest of the year (Figure 2). Morella clearly showed lower reflectance in both the green (higher chlorophyll) and shortwave-infrared (higher upper canopy water) bands (Figure 6).
Winter separability was further increased in the 1st-d reflectance band centered around 520 nm, with SI values exceeding 1.5 (Figure 2) due to stronger Chl-b absorption in Morella (Figure 7). Finally, analysis of the temporal shift indicated a significantly different behavior between Morella and Acacia in the transition from October to December in the visible reflectance (SI > 1; Figure 4). This resulted from an increase in visible reflectance for Morella compared to Acacia (and all other species, Figure 6). As mentioned above, this was due to the yellowing of Morella leaves in the unfavorable wetter periods of the year when photosynthetic active radiation is low. For the near-infrared a considerable difference in spectral shift was observed for the transition from July to August (SI around 0.8). In this period the increase in near-infrared reflectance was more expressed for Morella than for Acacia, again explained by an increase in Morella’s LAI in summer.
A comparison between invasive species I and IN showed that, in winter months, the near-infrared reflectance band centered around 720 nm has strong discriminative power (SI between 1.5 and 2, Figure 3). The reflectance bands around 540 nm also showed relatively high SI values in winter ranging between 1.2 and 1.5. SI dropped slightly in summer to 0.8–1, while in November and March, the typical seasonal transition months, separability was low in this spectral domain (Figures 3 and 6). However, with a consistently high discriminative power (SI values between 1 and 2) throughout the entire year the 1st-d reflectance in the bands centered around 530 nm, 620 nm and 690 nm probably were best suited to separation of these species (Figure 3). Differences in temporal reflectance shifts were most pronounced in the visible reflectance during the transition from October to January and February to June (SI up to 0.8, Figure 5). In the near-infrared and shortwave-infrared the temporal shift was most expressed during the February–July transition (SI around 0.8; Figure 5). The observed differences were predominantly in the visible reflectance and were most likely to be linked to the significant differences in leaf N content between I and IN. While Asner et al. [2] reported a leaf N content of ∼1.2% for Psidium, the average N content of Morella foliage in the study area was around 2.0%. Based on this assumption, the temporal analysis suggested that the differences in leaf N, or leaf pigmentation in general, were highest in winter and lowest in summer.
Similar differences were observed between H and HN, with an overall better discrimination in winter, in the near-infrared-2 (canopy water) and shortwave-infrared (upper canopy water) reflectance (Figure 3). The highest SI values were observed for the 690–920 nm (SI >1) and 540 nm (SI between 0.7 in November–December and 1 in January–February) wavebands. This was due to the higher LAI of Acacia and the higher leaf chlorophyll content for Metrosideros (Figure 6) [2]. For the 750 nm 1st-d reflectance, a systematic difference between both species was observed (SI > 1) throughout the year (Figure 3). In winter the 510 nm 1st-d reflectance also showed consistent differences between both species (SI > 0.7) which again could be attributed to differences in leaf chlorophyll content (Figure 3). The difference in temporal displacement between H and HN was generally low (SI < 0.5; Figure 5), with the highest separability in the visible domain due to differences in leaf pigmentation and N content.
To summarize, Table 2 provides a separability matrix indicating the season, spectral region, and SI value for the period of greatest overall separability among species.
3.2. Invasive vs. Native
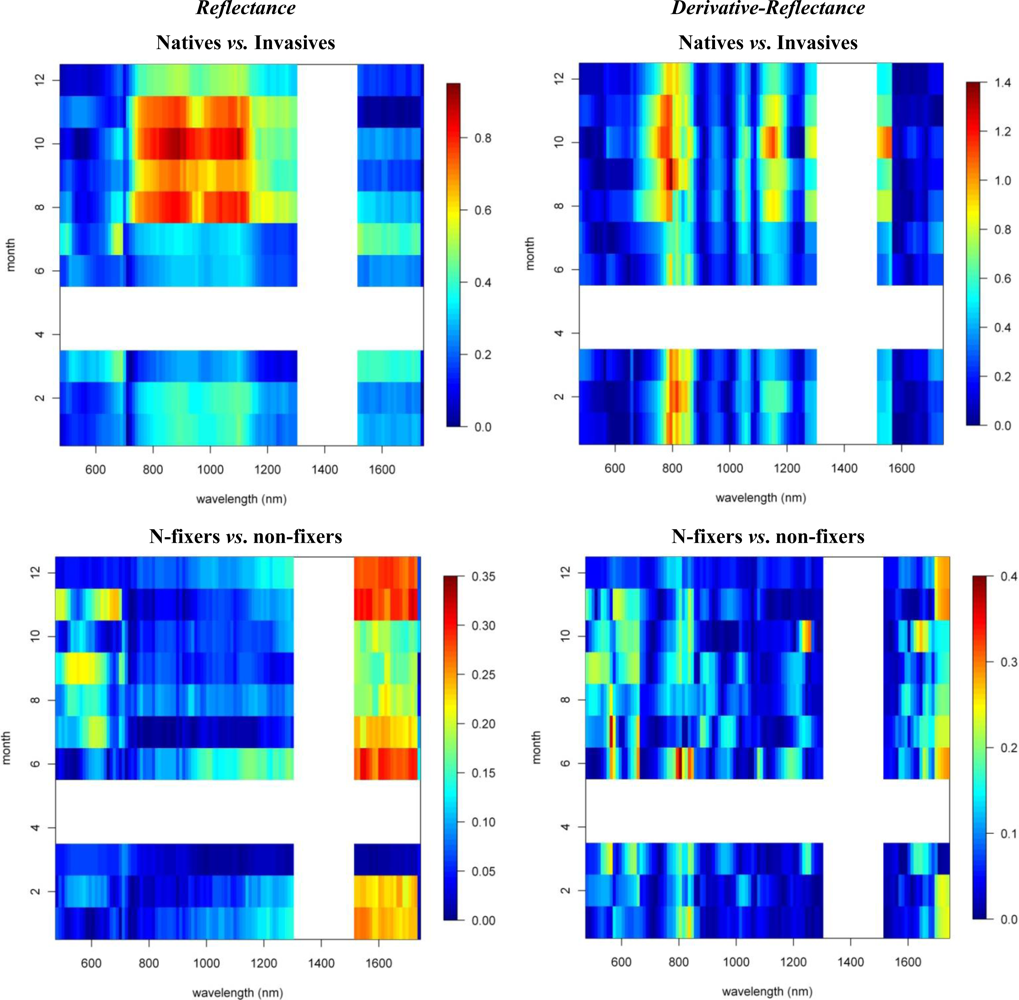
To study the overall spectral separability between invasive and native species, we regrouped the spectral database by combining the spectral information of both invasive species, I and IN, in one class and the native species, H and HN, in another. We then carried out the spectral separability tests on these two distinct groups of plants. The spectro-temporal separability maps are shown in Figure 8.
As expected, the overall discriminative power was lower than the pairwise species comparisons (SI < 0.9). The near-infrared-1 reflectance plateau was best suited to separation of the invasive and native species groups (Figure 8). However, SI values exceeding 0.7 were observed only between August and November, while separability progressively declined through the winter (SI < 0.4). The lowest values were observed for March–July (SI < 0.3). The increased separability was the result of the systematic higher near-infrared reflectances of invasive trees, as compared to native Hawaiian species (Figure 6), driven by higher LAI values among the invasives. Although Asner et al. [2] came to the same conclusion based on their January observation, our results indicated that the August–September period was better suited for the spectral separation, detection and monitoring of invasive species extent in Hawaiian rainforests.
3.3. N-Fixing vs. Non-Fixing
With SI values < 0.4, no consistent differences in the reflectance, 1st-d reflectance (Figure 8) and temporal displacement spectra (results not shown) of N-fixing and non-fixing trees was observed. The visible (June–November) and shortwave-infrared (January–June) reflectance performed best in discriminating both groups, although the overlap between the species groups was significant, as demonstrated in Figure 6, resulting in a low to very low SI of 0.2–0.25 (Figure 8).
Notwithstanding the strong overlap, improved separability in the visible and shortwave-infrared reflectance corresponded to the difference in leaf N concentrations present between both species groups [2]. These spectral domains are major contributors to the prediction of leaf N concentration [25]. Due to the stoichiometric balance between chlorophyll and N in plant leaves [26], the spectral reflectance weightings for leaf N closely agreed with those of leaf pigments. Further it is well acknowledged that protein-N absorptions exist in the shortwave-infrared region [19,27,28]. The reason for the increased spectral overlap between the species groups (SI< 0.4) might be the combined result of differences in leaf water content and LAI between and among the species groups, obscuring as such the absorption features associated with N.
4. Conclusions
Biological invasions are among the most important threats to biodiversity and ecosystem processes, especially in island ecosystems, such as the Hawaiian Islands, where ecosystems undergo rapid changes following the introduction and proliferation of exotic species. Many efforts are made to develop methods to map and monitor the spread of new species, and to understand their impact on native ecosystems. In this light, remote sensing can play a crucial role. Despite its undeniable potential, reliable remote sensing methods for the detection of invasive plant species over large areas have not been widely established. In part, this is due to an incomplete understanding of the spectral separability of species at different levels of ecological and taxonomic aggregation.
In 2008, Asner et al. [2] published a comprehensive assessment of the spectral separability of the most common tree species found in the (sub)tropical forests of Hawai’i. The analysis revealed significant spectral differences among native and invasive species which could be linked to relative differences in leaf pigment, nutrient and structural properties. In the current study we greatly expanded this research to include a temporal dimension to the analysis. Asner et al. [2] focused on data from a single acquisition window in January only. Here we analyzed the spectral separability, quantitatively evaluated using the Separability Index (SI),of four key upper canopy tree species: two natives and two invasives, found in the Hawaiian rainforests using a four year time series of Hyperion images. In general terms we could verify the results of Asner et al. [2] in that native and invasive trees are unique in their reflectance and derivative spectral properties. To a lesser extent N-fixing trees are also spectrally unique from non-fixing trees. While invasive trees generally have a higher near-infrared-1 (700–1,250 nm) reflectance (due to higher LAI) compared to native trees (0.4 > SI > 1.4), the higher leaf N content of N-fixing trees expresses itself through slightly increased separabilities in the visible and shortwave-infrared spectral properties compared to non-fixing trees (SI = 0.4). We could further demonstrate clear seasonal patterns in the spectral separability of the species. It was for instance shown that the spectral separability in the near-infrared-1 reflectance between the native and invasive species groups was more expressed in summer (SI > 0.7) than in winter (SI < 0.7). The lowest values were observed for March–July (SI < 0.3). This could be explained by the invasives taking advantage of the warmer summer period to expand their canopy. Overall, highest separability was observed between Metrosideros (non-fixing native) and Morella (non-fixing invasive) with SI values for the 770–870 nm reflectance exceeding 1.9 in winter; and between Acacia (N-fixing native) and Psidium (N-fixing invasive) with SI values for the derivative reflectance in 530, 630 and 690 nm ranging between 1 and 2 throughout the year.
Our findings here, together with those from previous work [1,2,29–34], highlight the fact that differing life strategies and functional properties among species directly express themselves in spectral differences. We further revealed the importance of phenology in our spectral separability analysis. By intensive monitoring of the plant species dynamics in Hawai’i we were able to identify specific acquisition windows and spectral regions better or less suited for species specific image classification. Thereby, this study can also be seen as a sensible response to Hesketh and Azofeifa [8], who were critical of the utility of spectral databases for in-situ species-based studies. Although we share these authors’ concern that inter-seasonal variation in leaf optical properties can be significant, we are still convinced that spectral databases are useful to identify the best seasons and spectral regions for separation of individual species of interest; information that is crucial for optimal image tasking and analysis when setting up an operational monitoring scheme.
Acknowledgments
The research presented in this paper is funded by the Belgian Science Policy Office in the framework of the STEREO II Programme—Project VEGEMIX (SR/67/146). The Carnegie Airborne Observatory is supported by the W.M. Keck Foundation, the Gordon and Betty Moore Foundation, the Grantham Foundation for the Protection of the Environment, and William Hearst III. This study was supported by a grant from the NASA Terrestrial Ecology Program. The scientific input of Luc Bertels, Kristof Van Tricht, Reinout Van Bets, Roberta Martin, Laurent Tits and David Knapp is gratefully acknowledged.
References
- Vitousek, P.M.; Walker, L.R. Biological invasion by Myrica faya in Hawai’i: Plant demography, nitrogen fixation, ecosystem effects. Ecol. Monogr 1989, 59, 247–265. [Google Scholar]
- Asner, G.P.; Jones, M.O.; Martin, R.E.; Knapp, D.E.; Hughes, R.F. Remote sensing of native and invasive species in Hawaiian rainforests. Remote Sens. Environ 2008, 112, 1912–1926. [Google Scholar]
- Mack, R.N.; Simberloff, D.; Londsdale, W.M.; Evans, H.; Clout, M.; Bazzaz, F. Biotic invasions: Causes, epidemiology, global consequences, and control. Ecol. Appl 2000, 10, 689–710. [Google Scholar]
- He, K.S.; Rocchini, D.; Neteler, M.; Nagendra, H. Benefits of hyperspectral remote sensing for tracking plant invasions. Divers. Distrib 2011, 17, 381–392. [Google Scholar]
- Asner, G.P.; Knapp, D.E.; Kennedy-Bowdoin, T.; Jones, M.O.; Martin, R.E.; Boardman, J.; Hughes, R.F. Invasive species detection in Hawaiian rainforests using airborne imaging spectroscopy and LiDAR. Remote Sens. Environ 2008, 112, 1942–1955. [Google Scholar]
- Dennison, P.E.; Roberts, D.A. The effects of vegetation phenology on endmember selection and species mapping in Southern California Chaparral. Remote Sens. Environ 2003, 87, 123–135. [Google Scholar]
- Hesketh, M.; Sanchez-Azofeifa, G.A. The effect of seasonal spectral variation on species classification in the Panamanian Tropical Forest. Remote Sens. Environ 2012, 118, 73–82. [Google Scholar]
- Somers, B.; Asner, G.P. Invasive species mapping in Hawaiian rainforests using multi-temporal Hyperion spaceborne imaging spectroscopy. IEEE J. Sel. Top. Appl. Earth Obs 2012. [Google Scholar] [CrossRef]
- Vitousek, P.M.; Walker, L.R.; Whiteacre, L.D.; Mueller-Dombois, D.; Matson, P.A. Biological invasion by Myrica faya alters ecosystem development in Hawaii. Science 1987, 238, 802–804. [Google Scholar]
- D’Antonio, C.M.; Vitousek, P.M. Biological invasions by exotic grasses, the grass/fire cycle, and global change. Ann. Rev. Ecol. Systemat 1992, 23, 63–87. [Google Scholar]
- Giambelluca, T.W.; Martin, R.E.; Asner, G.P.; Huang, M.; Mudd, R.G.; Nullet, M.A.; DeLay, J.K.; Foote, D. Evapotranspiration and energy balance of native wet montane cloud forest in Hawaii. Agr. For. Meteorol 2009, 149, 230–243. [Google Scholar]
- Asner, G.P.; Martin, R.E.; Carlson, K.M.; Rascher, U.; Vitousek, P.M. Vegetation-climate interactions among native and invasive species in Hawaiian rainforest. Ecosystems 2006, 9, 1041–1054. [Google Scholar]
- Giambelluca, T.M.; Nullet, M.A.; Schroeder, T.A. Rainfall Atlas of Hawaii; Department of Land and Natural Resources: Honolulu, HI, USA, 1986. [Google Scholar]
- Armstrong, R.W. Atlas of Hawaii, 2nd ed; University of Hawaii Press: Honolulu, HI, USA, 1983. [Google Scholar]
- Harrington, R.A.; Fownes, J.H.; Meinzer, F.C.; Scowcroft, P.G. Forest growth along a rainfall gradient in Hawaii: Acacia koa stand structure, productivity, foliar nutrients, and water- and nutrient-use efficiencies. Oecologia 1995, 102, 277–284. [Google Scholar]
- Smith, C.W. Impact of Alien Plants on Hawai’i’s Native Biota. In Hawai’i’s Terrestrial Ecosystems: Preservation and Management; Stone, C.P., Scott, J.M., Eds.; University of Hawaii Cooperative National Park Resources Studies Unit: Honolulu, HI, USA, 1985; pp. 180–250. [Google Scholar]
- Asner, G.P.; Knapp, D.E.; Kennedy-Bowdoin, T.; Jones, M.O.; Martin, R.E.; Boardman, J.; Field, C.B. Carnegie Airborne Observatory: In-flight fusion of hyperspectral imaging and waveform light detection and ranging (wLiDAR) for three-dimensional studies of ecosystems. J. Appl. Remote Sens 2007, 1. n°013536. [Google Scholar]
- Asner, G.P.; Heidebrecht, K.B. Imaging spectroscopy for desertification studies: Comparing AVIRIS and EO-1 Hyperion in Argentina drylands. IEEE Trans. Geosci. Remote Sens 2003, 41, 1283–1296. [Google Scholar]
- Asner, G.P.; Vitousek, P.M. Remote Analysis of biological invasion and biogeochemical change. Proc. Natl. Acad. Sci. USA 2005, 102, 4383–4386. [Google Scholar]
- Somers, B.; Delalieux, S.; Verstraeten, W.; van Aardt, J.; Albrigo, G.; Coppin, P. An automated waveband selection technique for optimized hyperspectral mixture analysis. Int. J. Remote Sens 2010, 31, 5549–5568. [Google Scholar]
- Somers, B.; Delalieux, S.; Stuckens, J.; Verstraeten, W.; Coppin, P. A weighted linear spectral mixture analysis approach to address endmember variability in agricultural production systems. Int. J. Remote Sens 2009, 30, 139–147. [Google Scholar]
- Savitzky, A.; Golay, M.J.E. Smoothing and differentiation of data by simplified least squares procedures. Anal. Chem 1964, 36, 1627–1639. [Google Scholar]
- Somers, B.; Delalieux, S.; Verstraeten, W.; Verbesselt, J.; Lhermitte, S.; Coppin, P. Magnitude and shape related feature integration in hyperspectral mixture analysis to monitor weeds in citrus orchards. IEEE Trans. Geosci. Remote Sens 2009, 47, 3630–3642. [Google Scholar]
- Thenkabail, P.S.; Enclona, E.A.; Ashton, M.S.; van der Meer, B. Accuracy assessments of hyperspectral waveband performance for vegetation analysis applications. Remote Sens. Environ 2004, 91, 354–376. [Google Scholar]
- Curran, P.J. Remote sensing of foliar chemistry. Remote Sens. Environ 1989, 30, 271–278. [Google Scholar]
- Yoder, B.J.; Pettigrew-Crosby, R.E. Predicting nitrogen and chlorophyll content and concentrations from reflectance spectra (300–2500 nm) at leaf and canopy scales. Remote Sens. Environ 1995, 53, 199–211. [Google Scholar]
- Martin, M.E.; Aber, J.D. High spectral resolution remote sensing of forest canopy lignin, nitrogen, and ecosystem processes. Ecol. Appl 1997, 7, 431–444. [Google Scholar]
- Smith, M.L.; Martin, M.E.; Plourde, L.; Ollinger, S.V. Analysis of hyperspectral data for estimation of temperate forest canopy nitrogen concentrations: Comparison between an airborne (AVIRIS) and spaceborne (Hyperion) sensor. IEEE Trans. Geosci. Remote Sens 2003, 41, 1332–1337. [Google Scholar]
- Hughes, R.F.; Denslow, J.S. Invasion by a N2-fixing tree alters function and structure in wet lowland forests of Hawaii. Ecol. Appl 2005, 15, 1615–1628. [Google Scholar]
- Durand, L.Z.; Goldstein, G. Photosynthesis, photoinhibition, and nitrogen use efficiency in native and invasive tree ferns in Hawaii. Oecologia 2001, 126, 345–354. [Google Scholar]
- Baruch, Z.; Goldstein, G. Leaf construction cost, nutrient concentration, and net CO2 assimilation of native and invasive species in Hawaii. Oecologia 1999, 121, 183–192. [Google Scholar]
- Clark, M.; Roberts, D.A. Species-level differences in hyperspectral metrics among tropical rainforest trees as determined by a tree-based classifier. Remote Sens 2012, 4, 1820–1855. [Google Scholar]
- Mirik, M.; Ansley, R.J. Utility of satellite and aerial images for quantification of canopy cover and infilling rates of the invasive woody species honey mesquite on rangeland. Remote Sens 2012, 4, 1947–1962. [Google Scholar]
- Evangelista, P.H.; Stohlgren, T.J.; Morisette, J.T.; Kumar, S. Mapping invasive Tamarisk: A comparison of single scene and time-series analyses of remotely sensed data. Remote Sens 2009, 1, 519–533. [Google Scholar]
Figure 1.
Overview of the Hawai’i Volcanoes National Park on the Island of Hawai’i (19.4°N, 155.2°W; imagery from the Carnegie Airborne Observatory; [17]).
Figure 1.
Overview of the Hawai’i Volcanoes National Park on the Island of Hawai’i (19.4°N, 155.2°W; imagery from the Carnegie Airborne Observatory; [17]).
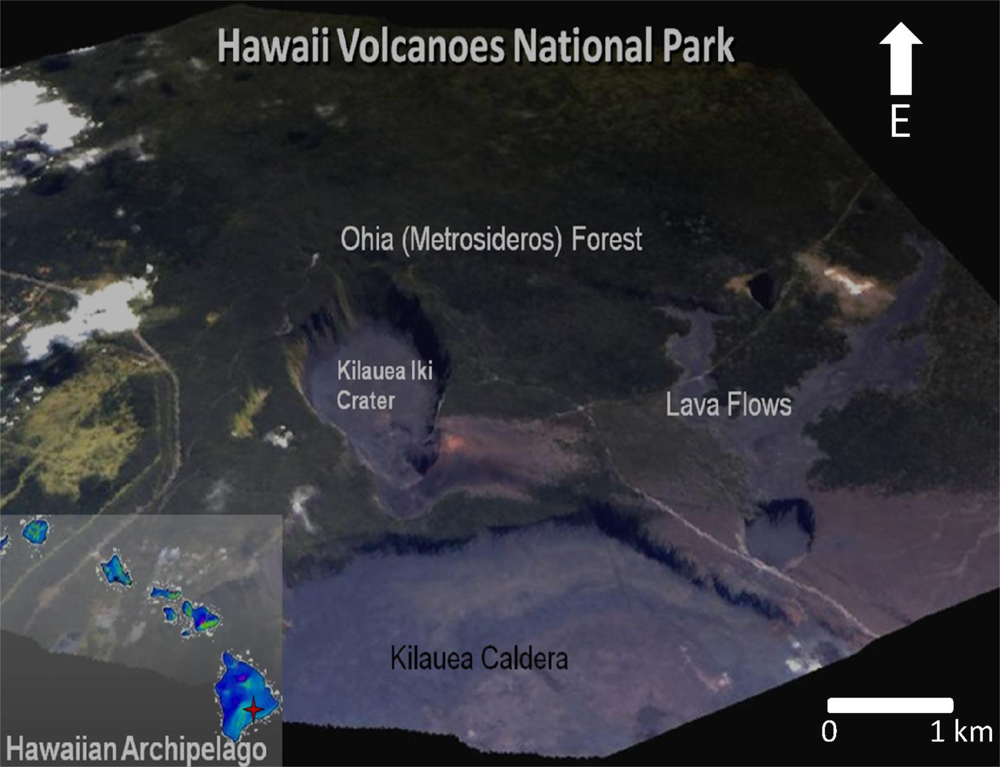
Figure 2.
Reflectance and 1st-d reflectance spectro-temporal Separability Index charts for the pairwise species comparisons.
Figure 2.
Reflectance and 1st-d reflectance spectro-temporal Separability Index charts for the pairwise species comparisons.


Figure 3.
Reflectance and 1st-d reflectance spectro-temporal Separability Index chart for the pairwise comparison of (i) invasives and (ii) natives.
Figure 3.
Reflectance and 1st-d reflectance spectro-temporal Separability Index chart for the pairwise comparison of (i) invasives and (ii) natives.
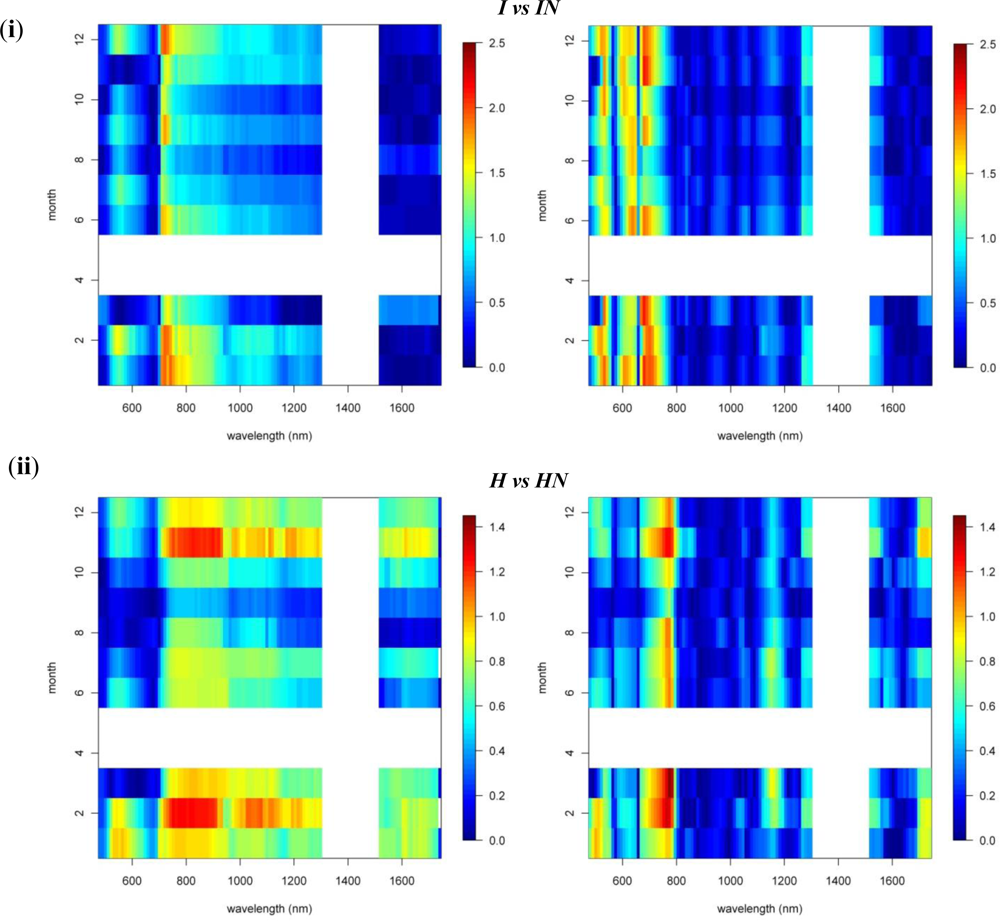
Figure 4.
Spectro-temporal SI charts for the pairwise species comparisons of the temporal displacement spectra (i.e., temporal derivatives or the change in reflectance between two consecutive time steps/months).
Figure 4.
Spectro-temporal SI charts for the pairwise species comparisons of the temporal displacement spectra (i.e., temporal derivatives or the change in reflectance between two consecutive time steps/months).
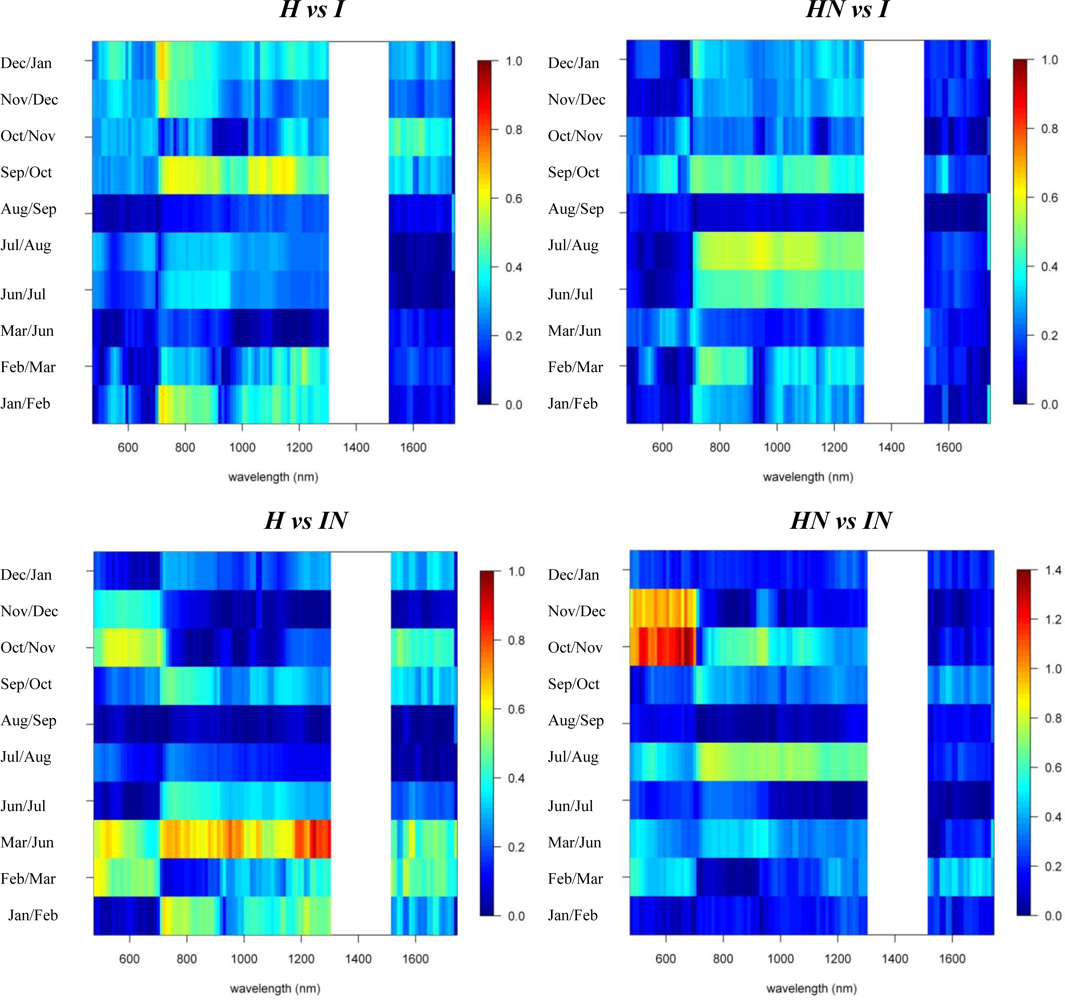
Figure 5.
The spectro-temporal SI charts for the pairwise comparison of (i) invasives and (ii) natives of the temporal displacement spectra (i.e., temporal derivatives).
Figure 5.
The spectro-temporal SI charts for the pairwise comparison of (i) invasives and (ii) natives of the temporal displacement spectra (i.e., temporal derivatives).
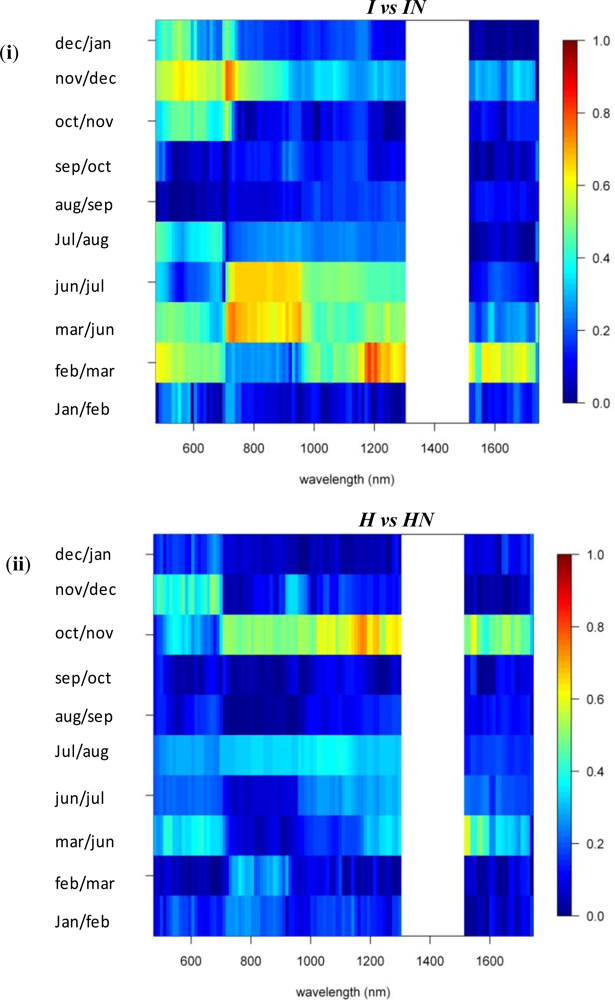
Figure 6.
Mean and 95% confidence interval for December and August reflectance of native and invasive species for the visible, near-infrared and shortwave-infrared. Approximately 400 spectra (or image pixels) were selected for each species (see Section 2.1).
Figure 6.
Mean and 95% confidence interval for December and August reflectance of native and invasive species for the visible, near-infrared and shortwave-infrared. Approximately 400 spectra (or image pixels) were selected for each species (see Section 2.1).

Figure 7.
Mean and 95% confidence interval for December and August 1d-reflectance of native and invasive species. Approximately 400 spectra (or image pixels) were selected for each species (see Section 2.1).
Figure 7.
Mean and 95% confidence interval for December and August 1d-reflectance of native and invasive species. Approximately 400 spectra (or image pixels) were selected for each species (see Section 2.1).
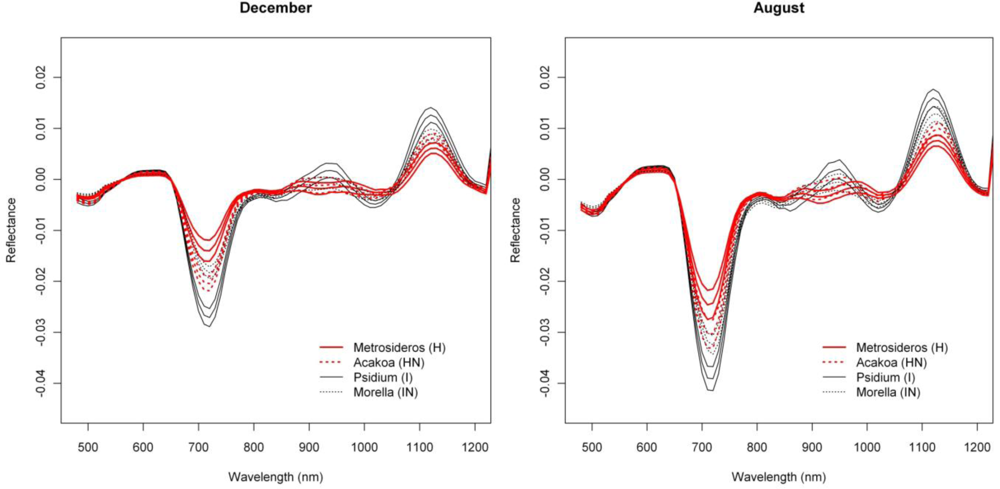
Figure 8.
Reflectance and 1st-d reflectance spectro-temporal Separability Index charts for the comparisons of native vs. invasive tree species.
Figure 8.
Reflectance and 1st-d reflectance spectro-temporal Separability Index charts for the comparisons of native vs. invasive tree species.

| 2004 | 2005 | 2006 | 2007 | |
|---|---|---|---|---|
| January | X | X | ||
| February | X | |||
| March | X | |||
| April | ||||
| May | ||||
| June | X | X | ||
| July | X | X | ||
| August | XX | X | X | X |
| September | XX | |||
| October | XX | |||
| November | X | X | ||
| December | X | X | X | |
Table 2.
Separability matrix indicating the season, spectral region, format (R = reflectance, D = derivative reflectance, T = temporal displacement spectra) and SI value for the period of greatest overall separability.
| HN | IN | I | |
|---|---|---|---|
| Winter | Summer | Winter | |
| H | R690–920 nm (SI > 1) | D720–770 nm, Tfeb–jun, 700–1250 nm (0.7–1) | R770–870 nm (>1.9) |
| Winter | Winter | ||
| HN | D520 nm (>1.5) | D760–770 nm (1–1.2) | |
| All seasons | |||
| IN | D530 nm, D630 nm, D690 nm (1–2) |
Share and Cite
MDPI and ACS Style
Somers, B.; Asner, G.P. Hyperspectral Time Series Analysis of Native and Invasive Species in Hawaiian Rainforests. Remote Sens. 2012, 4, 2510-2529. https://doi.org/10.3390/rs4092510
AMA Style
Somers B, Asner GP. Hyperspectral Time Series Analysis of Native and Invasive Species in Hawaiian Rainforests. Remote Sensing. 2012; 4(9):2510-2529. https://doi.org/10.3390/rs4092510
Chicago/Turabian StyleSomers, Ben, and Gregory P. Asner. 2012. "Hyperspectral Time Series Analysis of Native and Invasive Species in Hawaiian Rainforests" Remote Sensing 4, no. 9: 2510-2529. https://doi.org/10.3390/rs4092510