Article

Mineral Mapping Using Simulated Worldview-3 Short-Wave-Infrared Imagery

1
Physics Department, Naval Postgraduate School, 833 Dyer Rd., Monterey, CA 93943, USA
2
Remote Sensing Center, Naval Postgraduate School, 833 Dyer Rd., Monterey, CA 93943, USA
3
Perry Remote Sensing, LLC, 9105 East Wesley Ave, Denver, CO 80231, USA
*
Author to whom correspondence should be addressed.
Remote Sens. 2013, 5(6), 2688-2703; https://doi.org/10.3390/rs5062688
Submission received: 27 March 2013 / Revised: 15 May 2013 / Accepted: 15 May 2013 / Published: 27 May 2013
(This article belongs to the Special Issue Geological Remote Sensing)

Abstract

:
WorldView commercial imaging satellites comprise a constellation developed by DigitalGlobe Inc. (Longmont, CO, USA). Worldview-3 (WV-3), currently planned for launch in 2014, will have 8 spectral bands in the Visible and Near-Infrared (VNIR), and an additional 8 bands in the Short-Wave-Infrared (SWIR); the approximately 1.0–2.5 μm spectral range. WV-3 will be the first commercial system with both high spatial resolution and multispectral SWIR capability. Airborne Visible/Infrared Imaging Spectrometer (AVIRIS) data collected at 3 m spatial resolution with 86 SWIR bands having 10 nm spectral resolution were used to simulate the new WV-3 SWIR data. AVIRIS data were converted to reflectance, geographically registered, and resized to the proposed 3.7 and 7.5 m spatial resolutions. WV-3 SWIR band pass functions were used to spectrally resample the data to the proposed 8 SWIR bands. Characteristic reflectance signatures extracted from the data for known mineral locations (endmembers) were used to map spatial locations of specific minerals. The WV-3 results, when compared to spectral mapping using the full AVIRIS SWIR dataset, illustrate that the WV-3 spectral bands should permit identification and mapping of some key minerals, however, minerals with similar spectral features may be confused and will not be mapped with the same detail as using hyperspectral systems. The high spatial resolution should provide detailed mapping of complex alteration mineral patterns not achievable by current multispectral systems. The WV-3 simulation results are promising and indicate that this sensor will be a significant tool for geologic remote sensing.

Graphical Abstract

1. Introduction

WorldView imaging satellites comprise a planned constellation of commercial, orbiting platforms developed by DigitalGlobe Inc. (Longmont, CO, USA) and built by Ball Aerospace & Technologies (Boulder, CO, USA). Financed partially by the National Geospatial-Intelligence Agency (NGA), WorldView satellite systems are launched from Vandenberg Air Force Base on Delta II rockets. WorldView-1 (WV-1) was launched in 2007 with a panchromatic (PAN) imaging system capable of 50-cm spatial resolution [1]. With no multispectral bands on board, the primary purpose of this single-band PAN system was to rapidly collect high-spatial resolution (or hi-res) imagery, especially suited for generating detailed digital elevation model (DEM) data. The major improvement of WV-1 over other hi-res commercial systems at the time included state-of-the-art geo-locational capability, improved accuracy, and flexibility in programming and tasking that vastly improved the collection of 2-pass data necessary for DEM generation. WV-1 allowed for a 1.7-day revisit time, acquiring 750,000 square kilometers of imagery per day. The next big milestone was encountered with the launch of WorldView-2 (WV-2) in 2009 offering hi-res PAN data at 46-cm pixel size plus visible and near-infrared (VNIR) bands at 1.85-m spatial resolution [2]. WV-2 was the first system to collect eight hi-res multispectral bands ranging in wavelengths from 0.4 to 1.04 μm, selected primarily for vegetation, coastal, and land-use applications. DigitalGlobe plans to launch WorldView-3 (WV-3) in 2014 offering a similar PAN and VNIR band set, complemented by eight short-wave infrared (SWIR) bands ranging from 1.21 to 2.365 μm (Table 1) [3,4]. It will also have an additional 12 bands included for atmospheric compensation [3]. 
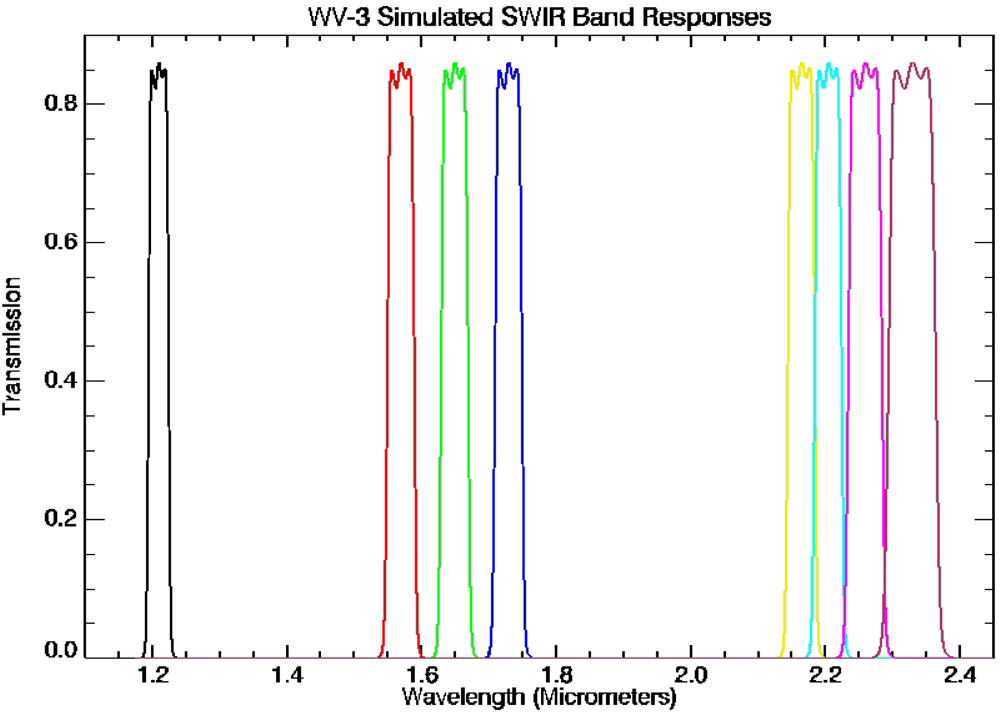
Figure 1 shows the proposed WV-3 SWIR band passes. WV-3, with approximately 3.7 m SWIR spatial resolution, will be the first commercial system with both VNIR and SWIR multispectral capability. The SWIR data at 7.5 m spatial resolution will be available for purchase. Commercial pricing has not yet been determined. It is expected that the inclusion of the new SWIR bands will significantly impact surface compositional modeling, and mapping of rock and soil exposures worldwide. Potential applications include improved geologic mapping; environmental/soil/disaster monitoring; exploration for petroleum, minerals, and geothermal resources; as well as other non-renewable resource assessments (especially suited for developing countries). This paper summarizes mineral mapping results achieved by modeling the proposed WV-3 SWIR spectral bands shown in Figure 1 using the Airborne Visible/Infrared Imaging Spectrometer (AVIRIS), extraction of SWIR spectral signatures and spectral mapping, and comparison to results from NASA’s on-orbit Advanced Spaceborne Thermal Emission and Reflection Radiometer (ASTER) multispectral sensor, which has 6 SWIR bands at 30 m resolution [5,6]. This simulation and analysis focuses on the WV-3 SWIR bands, as this is the unique added capability, the VNIR and SWIR measure different physical phenomena, and most spectral features for alteration minerals occur in the SWIR. Combined analysis of the SWIR bands with the WV-3 VNIR bands may also offer additional capabilities, but that evaluation is beyond the scope of this initial investigation.

2. Simulation of WV-3 Using Imaging Spectrometer Data

Imaging spectrometry is defined as “the simultaneous measurement of continuous spectra and images in up to hundreds of spectral channels or bands” [7]. These data, now commonly referred to as “Hyperspectral Imagery” or “HSI” are unique in that they provide a full spectrum for each image pixel and can be analyzed using either spatial or spectral approaches, or some combination of the two. The large number of spectral bands makes them ideal for use in simulating other lower spectral resolution datasets [8]. AVIRIS HSI data acquired 14 October 2010 of Cuprite, Nevada were used to simulate the eight WV-3 SWIR bands. Cuprite is an example of an altered hydrothermal system with an abundance of well-exposed minerals with characteristic absorption features in the SWIR. It has been used for over 35 years as a test site for validating spectral remote sensing data [714]. The 2010 AVIRIS data cover the area in five overlapping flightlines with 224 spectral bands in the 0.4–2.5 μm spectral range at 10 nm spectral resolution and 3 m spatial resolution (Figure 2). A total of 86 AVIRIS SWIR bands from 1.0 to 2.5 μm were used for this simulation. Radiance data provided by Jet Propulsion Laboratory (JPL) were geocorrected and mosaicked, and converted to apparent reflectance using an atmospheric model based approach “ACORN” [15,16]. No attempt was made to model minerals using the WV-3 VNIR bands, as these are the same as WV-2 (in service since 2009), most mineral absorption features (with the notable exception of iron minerals) are located in the 2.0–2.5 μm range, and spectral features in VNIR spectral region are caused by different physical processes and thus usually analyzed separately from the SWIR [13].
The reflectance-corrected AVIRIS spectral data were resampled to the proposed WV-3 SWIR spectral range and bands using the spectral responses shown in Figure 1 and spatially resampled to WV-3 spatial resolutions of 3.4 m and 7.5 m using pixel aggregation (neighborhood averaging). Only the SWIR bands were considered in this simulation and mineral mapping evaluation, as these represent new information not available from the previous WV-2 and other commercial MSI sensors. The selection of the SWIR bands is also based on the fact that this wavelength range is where the key absorption bands occur for the known minerals at this site (and for most geologic materials). Additionally no attempt was made to account for possible signal-to-noise (SNR) differences between the AVIRIS data and the simulated WV-3 SWIR data, as the SNR specifications for WV-3 are not currently available. As a result, the simulated data and analysis results described here represent “best case results”. If WV-3 ends up having very low SNR, this will likely have negative effects on the sensor’s capabilities for mineral mapping using spectral approaches. The simulated WV-3 data were further co-registered to orthorectified ASTER data for comparison. The ASTER data were also corrected to apparent reflectance using the ACORN model.

3. Mineral Mapping

Mineral reflectance spectra of key minerals known to occur at Cuprite at specific locations based on spectral libraries and previous research [714] were extracted as regions of interest (ROIs) from the AVIRIS, ASTER, and simulated WV-3 data for use in spectral classification and mineral mapping. 
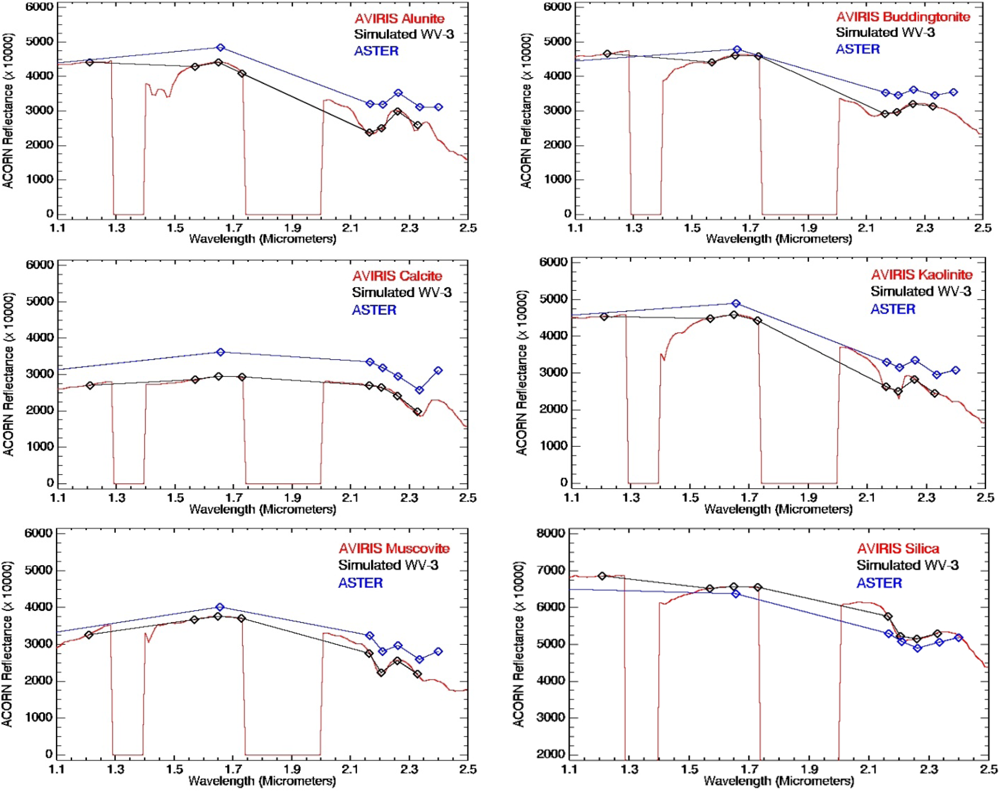
Figure 3 shows a comparison of the extracted mean spectra. The AVIRIS spectra are comparable to laboratory-measured library spectra and illustrate the full spectral character of the alteration minerals. The multispectral ASTER data and simulated WV-3 spectra show the discrete sampling of key spectral absorption features by both ASTER (6 bands) and WV-3 (8 bands), generally resulting in good separation for common alteration minerals, however, some ambiguities are apparent. ASTER has demonstrated the viability of detailed multispectral mineral mapping from space [6,14,1719]. We expect that WV-3 SWIR will perform similarly, with the added advantage of higher spatial resolution and additional bands improving mineral exploration, mine characterization, and spectral mapping.
The ROIs used to derive the endmember spectra shown in 
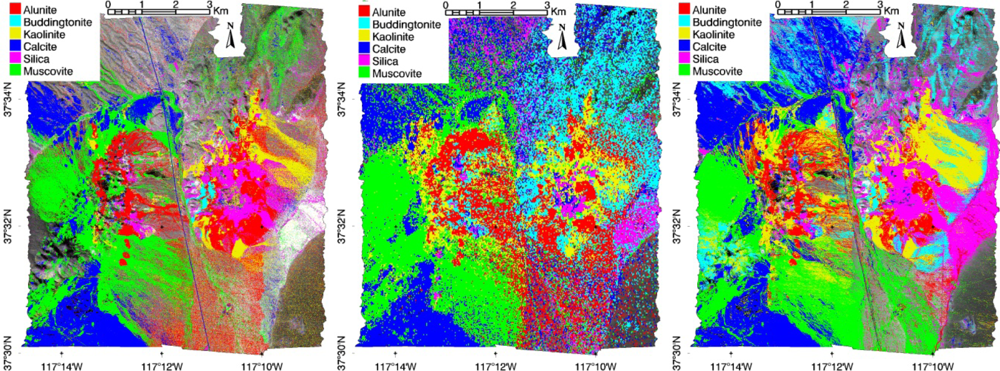
Figure 3 were used to run a Minimum distance (supervised) classification on the 86 band AVIRIS SWIR data and the simulated WV-3 SWIR data to demonstrate typical information content available using “standard” multispectral classification approaches (Figure 4). The Minimum Distance classification uses the mean vectors of each class in multi-dimensional space and calculates the Euclidean distance from each image pixel vector to the mean vector for each class [20]. A standard deviation threshold was used to exclude highly dissimilar pixels. Comparison of the WV-3 results to the AVIRIS data using a confusion matrix approach with the AVIRIS Minimum Distance classification acting as surrogate ground truth shows a excellent match (overall accuracy of 93.34% with a Kappa Coefficient of 0.9081) (Tables 2 and 3) [21,22]. Comparison of the diagonals of each matrix indicates the observed agreement between the two maps for each mineral, with a score of 100% being perfect agreement. The Kappa Coefficient, a statistical measure of agreement taking into account all of the categories, has a value close to zero when the observed agreement is the same as expected by chance and a value approaching one with perfect agreement [21]. The classifications and the confusion matrix for the Minimum Distance classifications demonstrate that comparable results can be generated from the two datasets using multispectral approaches, but don’t really assess the accuracy of those results with respect to the full mineral information available from the HSI data based on a physical mixing model. Comparison to AVIRIS mineral maps derived using HSI analysis approaches based on spectral matching and unmixing illustrates that there are significant errors in the Minimum Distance classifications (Figure 4). One of these approaches, the Mixture-Tuned-Matched-Filtering (MTMF) spectral mapping approach [23] was used to map the spatial distribution of the spectrally predominant mineralogy at the Cuprite, NV site and demonstrates how the WV-3 simulate data should perform for more specific mineral mapping approaches (Figure 4(Right); Figure 5). Thus, even though the Minimum Distance classification results are consistent and show high correlation between the AVIRIS and simulated WV-3 data, they do not provide a true measure of WV-3’s viability for mineral mapping using physics-based approaches incorporating physical and mathematical models tied to spectral signatures and mineral mixing.
Hyperspectral data are more typically analyzed using spectral matching or spectral unmixing methods, which take advantage of the full spectral signature for each material and a physical model to account for within pixel mixing of multiple materials. Mixture-Tuned-Matched-Filtering (MTMF) is a method for locating a known signature in the presence of a mixed or unknown background by combining a linear detector and spectral unmixing [23]. It is ideally suited for use where materials with distinct spectral signatures occur within a single pixel, and allows both identification and abundance estimation. Spectral mixing has been previously observed and reported at the Cuprite site [13]. The MTMF image-maps produced for this simulation Figure 4(Right) and Figure 5(Left) generally correspond to previous mineral mapping results using a variety of multispectral and hyperspectral sensors [1114], however, as no detailed ground truth map actually exists for the site (other than those generated using hyperspectral data), it is difficult to make absolute accuracy comparisons.
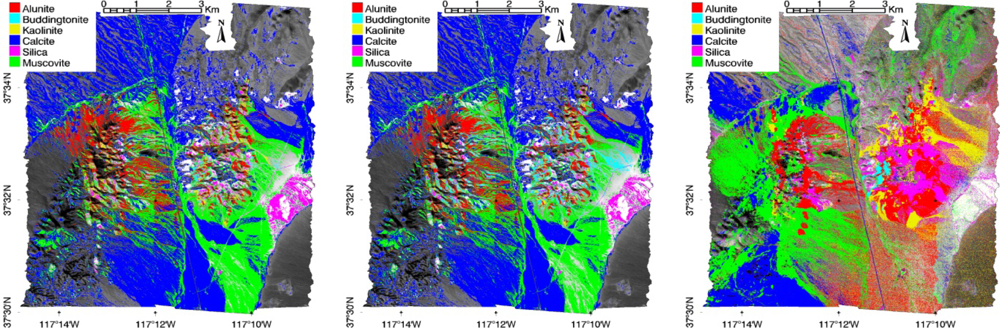
For the purposes of this research, the AVIRIS mineral map (Figure 4(Right) and Figure 5(Left)) was selected for use as surrogate ground truth, and ASTER data for the Cuprite site and the simulated WV-3 shows spatial patterns for specific minerals that are similar to AVIRIS mineral mapping results; however, in addition to a more noisy appearance likely caused by mineral mixing at the ASTER 30 m pixel, there are some other rather obvious problems with the multispectral mapping results (errors of commission). The simulated WV-3 MTMF results (Figure 5(Right)) appear to more accurately replicate the AVIRIS mineral patterns for specific minerals, but there are again some obvious errors of omission and commission. In both cases, the multispectral sensors appear to do surprisingly well in defining the mineralogy at the site using the SWIR signatures and the hyperspectral analysis approach, despite having only a few spectral bands compared to the AVIRIS data. Unfortunately, however, it is also clear that the subtle differences between the multispectral signatures, particularly for similar minerals like kaolinite, alunite, muscovite, and silica (all with features near 2.2 μm) result in confusion between similar minerals mapped in the WV-3 simulated data. In addition, the ASTER results are also likely more affected by linear (areal) spectral mixing because of their larger 30 m pixels.
Additional quantitative comparisons of MTMF mineral maps derived from the ASTER data and analysis of the WV-3 simulated data compared to the AVIRIS mineral mapping result were accomplished using the confusion matrix approach (Table 4). There are significant errors of commission and omission in all cases because of lower spectral resolution and for ASTER, also spectral mixing. It is significant to note that while the statistical measures show problems with the analysis on a per-pixel basis, that visual inspection of the image classes (Figure 5) indicates that the WV-3 data actually do well at reproducing the main mineral patterns mapped at Cuprite using the AVIRIS data.
The confusion matrices for these data demonstrate that the per-pixel match between the mineral AVIRIS and WV-3 mineral mapping results is only poor to fair using Kappa Coefficient criteria [21,22] (Tables 3 and 4). We note, however, that significant portions of the error are attributable to unclassified areas (Table 4), meaning that rather than misidentification of materials, that many of the errors are ones where no identification was possible using the multispectral data. This is not an unexpected result, however, as multispectral data are inherently less well suited to mineral mapping than HSI data because they don’t resolve all the spectral features. Improved performance is demonstrated by excluding unclassified pixels from the error analysis (Table 4). Further examination of the ASTER confusion matrix (Table 4) and extracted spectra (Figure 3) shows that performance is higher for calcite and buddingtonite than other minerals because they have spectral features at unique locations (near 2.34 and 2.11 μm respectively) with respect to the other minerals. Confusion between minerals with similar features near 2.2 μm such as alunite, kaolinite, muscovite, and silica is high. This is the result of confusion between similar minerals at lower multispectral spectral resolution, as well as spectral mixing effects. For the simulated WV-3 data, examination of the confusion matrices shows that performance is higher for calcite and buddingtonite; however, there is still confusion between minerals with similar features such as alunite, kaolinite, muscovite, and silica, which at high spectral resolution all have characteristic spectral features near 2.2 μm (Table 4, Figure 3).
In both the ASTER and WV-3 cases, ambiguities typically result in “over classification” using the multispectral systems compared to more specific AVIRIS results. That is, minerals are often identified in the MSI data where no specific mineral dominates as indicted by the HSI data analysis. This is mostly likely the result, however, of multiple similar mineral signatures combining to resemble a given mineral due to the reduced MSI spectral resolution. The HSI data are more sensitive to individual minerals in mineral mixtures. The WV-3 multispectral data appear to “fill in” some of the unmapped areas on AVIRIS (these represent additional ambiguities in multispectral images). It is significant to note that both multispectral datasets still produce spatially coherent highly detailed mineral maps that visually match the main spatial patterns in the AVIRIS data, and that the simulated WV-3 data perform significantly better than the ASTER data.
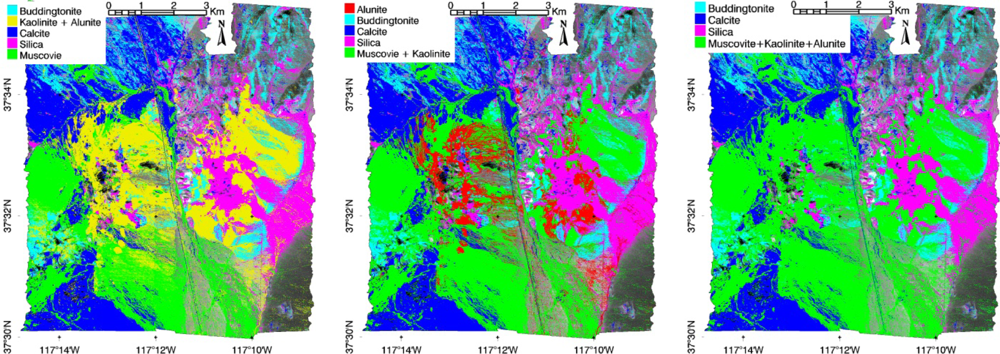
Previous work has demonstrated that that mapping errors caused by similar spectral features can be mitigated somewhat by grouping similar minerals for analysis [6]. Accordingly, we combined some of the simulated WV-3 results for similar minerals and performed confusion matrix analyses on the combined mineral maps (Figure 6) versus the same minerals combined for AVIRIS (not shown). Improved performance is observed in all cases according to the statistics (Table 5); however, comparing the images with the original AVIRIS mineral map in Figure 5(Right) demonstrates that significant important information has been lost. The key minerals shown in the AVIRIS map in Figure 5 are combined for improved per-pixel statistical accuracy, but information about the overall spatial pattern is reduced. 
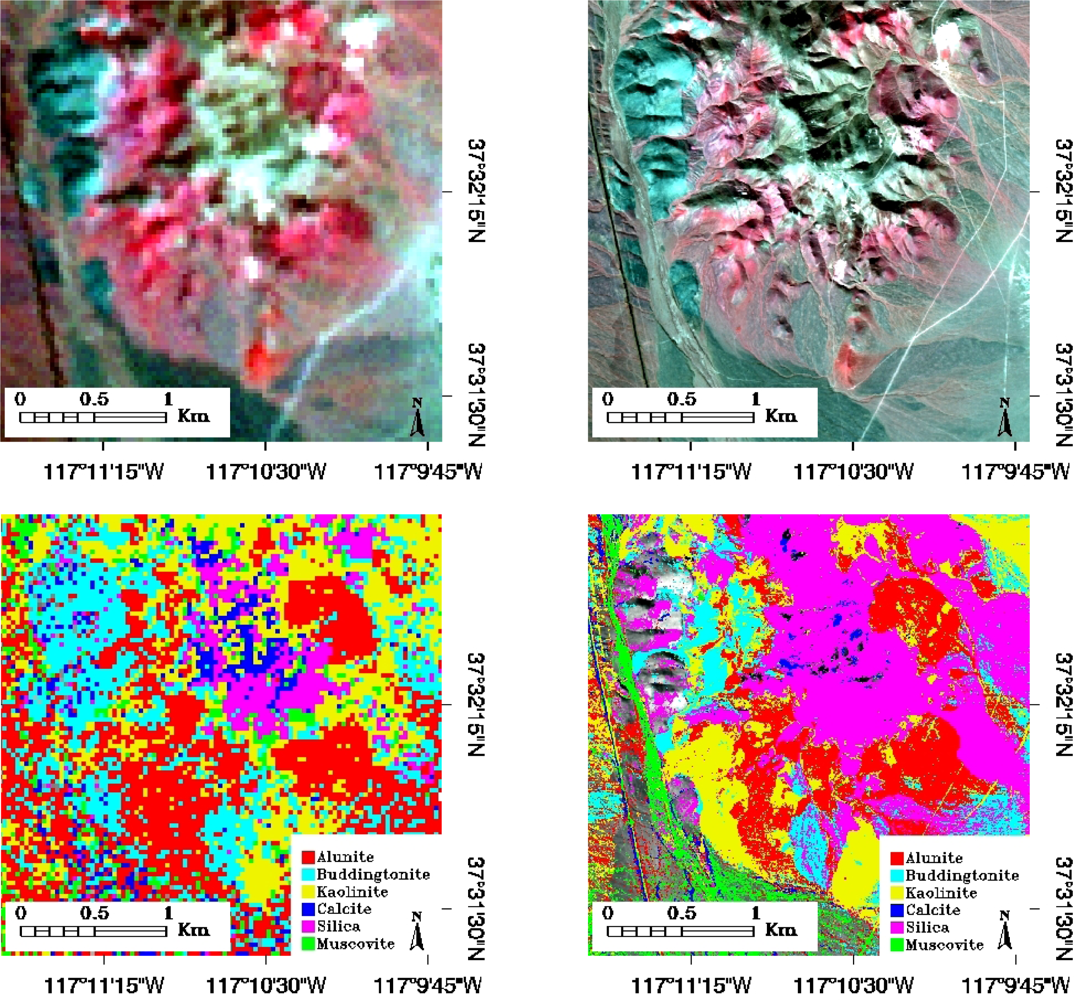
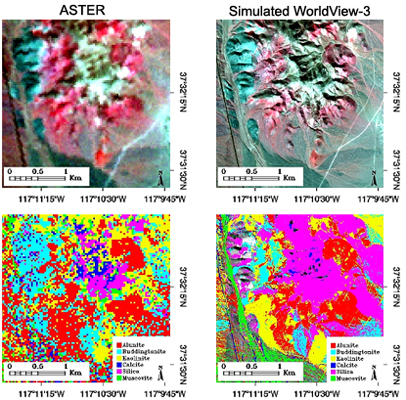
Figure 7 provides a final illustration of the spatial resolution advantage of WV-3 versus ASTER.
Based on these results, and demonstrated real-world ASTER mineral mapping successes, we expect that Worldview-3 will also be successful for mineral mapping using the new SWIR bands and that results will be improved over those determined from ASTER data. Clearly the WV-3 data will provide much sharper images of areas of interest, leading to improved literal analysis and interpretation. In addition, the mineral maps of the simulated WV-3 high spatial resolution data illustrate the advantage of reduced spectral mixing in the higher spatial resolution WV-3 data, leading to more spatially coherent mapping of key minerals. The patterns in the simulated WV-3 data more closely match those of the hyperspectral AVIRIS data compared to the ASTER results, and key mineral patterns are preserved, even where error analysis statistics indicate only fair individual pixel mineral matching performance.

4. Conclusions

This study presents the results of simulated multispectral Worldview-3 (WV-3) data analysis for Short Wave Infrared (SWIR) mineral mapping for hydrothermal ore deposits. WV-3 is a new multispectral remote sensing system to be launched during 2014 by DigitalGlobe, and will provide combined high (7.5 m) spatial resolution and SWIR spectral bands not available from any other source. Because WV-3 is the first of its kind to offer these added SWIR capabilities at high spatial resolution, the interest (particularly from the commercial mineral exploration community) is expected to be extremely high. This is in many ways the sensor that this community has been waiting for—high spatial resolution, global coverage, and increased spectral mapping capabilities. Another multispectral imager, the Advanced Spaceborne Thermal Emission and Reflection Radiometer (ASTER), which has 30 m spatial resolution and had 6 spectral bands in the SWIR (these failed in 2008) was extensively used by the mining industry. The launch of WV-3 is highly anticipated and we expect that the new capabilities of WV-3 will be even more valuable.
Based on these observations and the pending WV-3 launch, simulated SWIR WV-3 imagery was produced utilizing high spatial and spectral resolution Airborne Visible/Infrared Imaging Spectrometer (AVIRIS) (hyperspectral or HSI) data and the proposed WV-3 spatial and spectral responses to validate and quantify the likely SWIR mapping performance, specifically for hydrothermal alteration minerals. AVIRIS data for a well-known altered area (Cuprite, NV, USA) were spectrally and spatially resampled to the WV-3 specifications, and spectral mapping methods were applied to detecting and mapping minerals known to occur for the site. Most multispectral data are analyzed using statistical methods; results shown here for a typical classification method (Minimum Distance supervised classification) illustrate that high consistency can be achieved between the multispectral and hyperspectral classifications using statistical methods. In fact, total agreement was greater than 90% between these two datasets when using this approach. Unfortunately, however, despite this high agreement, spectral signatures and previous mineral mapping demonstrate that the statistical methods do not actually accurately map the known mineral distributions, mainly because they do not take into account the physical mixing model (multiple materials linearly mixing within each pixel).
The idea of utilizing spectral signatures and hyperspectral analysis approaches for multispectral mineral mapping represents a unique approach. Only the 8 well-placed SWIR bands proposed for WV-3 make this worth considering. Confusion matrix analyses comparing the simulated WV-3 mapping results to full-spectral-resolution AVIRIS data indicate that this approach was only partially successful, however, principally because of the similarity of many minerals when using only a few multispectral bands (versus HSI, with up to hundreds of spectral bands). The simulated WV-3 data allowed extraction and mapping of specific mineral spectra; however, spectra for certain similar minerals are only subtly different. These include a broad range of minerals with absorption features near 2.2 μm (such as kaolinite, alunite, muscovite, and silica), which are easily confused in the simulated WV-3 data. Simulated WV-3 performance for specific minerals ranged from approximately 40%–60% match for minerals with similar absorption features to 75%–85% match for minerals with distinctly different absorption features. Even so, standard HSI analysis methods were successfully applied to the WV-3 data to produce detailed mineral maps that separated some of these materials. The AVIRIS data produce a more conservative (and accurate) mineral map taking mineral mixing into consideration, however, the WV-3 data do capture the known alteration patterns at the Cuprite, Nevada site. Additional error analysis demonstrates that improved performance in terms of the classification statistics can be achieved by combining mineral classes with similar spectral signatures. When similar minerals are grouped together, matches between the HSI and WV-3 data improve to better than approximately 75% match. While this does improve the overall accuracy, the images, however, clearly show that there is valuable mineralogic information in the mineral maps produced using the full mineral suite that cannot be replicated in the reduced endmember case. This points towards the need to include additional, narrower multispectral SWIR bands in future sensors.
These simulation results demonstrate that WV-3 will provide significant new capabilities for multispectral mineral mapping from space. The simulated WV-3 data produce similar low spectral resolution spectra to those extracted from reflectance-corrected ASTER data; however WV-3 will significantly outperform ASTER for mineral mapping because of additional SWIR bands and the improvement in spatial resolution to 7.5 m from ASTER’s 30 m pixel size. The limited release (government only) 3.7 m spatial resolution data will be even more capable. The WV-3 simulation does demonstrate reduced capabilities compared to AVIRIS, however, manifested as misclassification and “smoothing” of the spectral mapping because of confusion between similar minerals. This is not unexpected (hyperspectral data are inherently more capable), and despite this fact, the 7.5 m spatial resolution and the simulated spectral resolution appear to generally be well suited to resolving typical mineral occurrences in a hydrothermally altered area. The WV-3 spectral bands should permit identification and mapping of key minerals, while the improved spatial resolution will provide improved discrimination of complex alteration mineral patterns. The WV-3 results are promising and indicate that this sensor will be a significant tool for geologic remote sensing. Additional research is required for additional sites with different mineral distributions. There may also be some benefit to combined analysis of the eight (8) WV-3 visible/near infrared (VNIR) bands with the SWIR bands. This will require further research and case histories.

Acknowledgments

Specifications for the WV-3 SWIR configuration and band passes were provided by DigitalGlobe, LLC. AVIRIS data were acquired and processed to radiance by the Jet Propulsion Laboratory (JPL).
  • Conflicts of InterestThe author declares no conflict of interest. Use of brand names in this manuscript does not indicate endorsement by the United States Government.

References

  1. Worldview-1 Specifications. Available online: http://www.digitalglobe.com/downloads/WorldView1-DS-WV1-Web.pdf (accessed on 24 May 2013).
  2. Worldview-2 Specifications. Available online: http://www.digitalglobe.com/downloads/WorldView2-DS-WV2-Web.pdf (accessed on 24 May 2013).
  3. Worldview-3 Specifications. Available online: https://www.digitalglobe.com/downloads/WorldView3-DS-WV3-Web.pdf (accessed on 24 May 2013).
  4. Kruse, F.A.; Perry, S.L. Mineral Mapping Using Simulated Short-Wave-Infrared Bands Planned for DigtalGlobe Worldview-3. Proceedings of Imaging and Applied Optics Technical Digest, Monterey, CA, USA, 24–28 June 2012.
  5. Yamaguchi, Y.; Kahle, A.B.; Tsu, H.; Kawakami, T.; Pniel, M. Overview of Advanced Spaceborne Thermal Emission Reflectance Radiometer. IEEE Trans. Geosci. Remote Sens 1998, 36, 1062–1071. [Google Scholar]
  6. Kruse, F.A.; Perry, S.L. Improving multispectral mapping by spectral modeling with hyperspectral signatures. J. Appl. Remote Sens. 2009, 3. [Google Scholar] [CrossRef]
  7. Goetz, A.F.H.; Vane, G.; Solomon, J.E.; Rock, B.N. Imaging spectrometry for Earth remote sensing. Science 1985, 228, 1147–1153. [Google Scholar]
  8. Kruse, F.A.; Taranik, J.V.; Coolbaugh, M.; Michaels, J.; Littlefield, E.F.; Calvin, W.M.; Martini, B.A. Effect of reduced spatial resolution on mineral mapping using imaging spectrometry—Examples using HyspIRI-simulated data. Remote Sens 2011, 3, 1584–1602. [Google Scholar]
  9. Abrams, M.J.; Ashley, R.P.; Rowan, L.C.; Goetz, A.F.H.; Kahle, A.B. Mapping of hydrothermal alteration in the Cuprite Mining District, Nevada, using aircraft scanner images for the spectral region 0.46–2.36 micrometers. Geology 1977, 5, 713–718. [Google Scholar]
  10. Ashley, R.P.; Abrams, M.J. Alteration Mapping Using Multispectral Images—Cuprite Mining District, Esmeralda County, Nevada; US Geological Survey Open File Report 80-367; United States Department of the Interior: Washington, DC, USA, 1980; p. 17. [Google Scholar]
  11. Kruse, F.A.; Kierein-Young, K.S.; Boardman, J.W. Mineral mapping at Cuprite, Nevada with a 63 channel imaging spectrometer. Photogramm. Eng. Remote Sensing 1990, 56, 83–92. [Google Scholar]
  12. Swayze, G.A. The Hydrothermal Structural History of the Cuprite Mining District, Southwestern Nevada: An Integrated Geological and Geophysical Approach. 1997; p. 399. [Google Scholar]
  13. Clark, R.N.; Swayze, G.A.; Livo, K.E.; Hoefen, T.; Kokaly, R.F.; Sutley, S.J.; Dalton, J.B.; McDougal, R.R.; Gent, C.A. Imaging spectroscopy: Earth and planetary remote sensing with the USGS Tetracorder and expert systems. J. Geophys. Res 2003, 108, 5-1–5-44. [Google Scholar]
  14. Rowan, L.C.; Hook, S.J.; Abrams, M.J.; Mars, J.C. Mapping hydrothermally altered rocks at Cuprite, Nevada, using the Advanced Spaceborne Thermal Emission and Reflection Radiometer (ASTER), a new satellite-imaging system. Econ. Geol 2003, 98, 1019–1027. [Google Scholar]
  15. Kruse, F.A. Comparison of ATREM, ACORN, and FLAASH Atmospheric Corrections Using Low-Altitude AVIRIS Data of Boulder, Colorado. Proceedings of 13th JPL Airborne Geoscience Workshop, Pasadena, CA, USA, 31 March–2 April 2004; Available online: ftp://popo.jpl.nasa.gov/pub/docs/workshops/04_docs/Kruse-JPL2004_ATM_Compare.pdf (accessed on 24 May 2013).
  16. Imspec, LLC. ACORN 6 User’s Manual; Imspec LLC: Palmdale, CA, USA, 2010; p. 121. Available online: http://www.imspec.com (accessed on 24 May 2013).
  17. Rowan, L.C.; Mars, J.C.; Simpson, C.J. Lithologic mapping of the Mordor, NT, Australia ultramafic complex by using the Advanced Spaceborne Thermal Emission and Reflection Radiometer (ASTER). Remote Sens. Environ 2005, 99, 105–126. [Google Scholar]
  18. Hubbard, B.E.; Crowley, J.K. Mineral mapping on the Chilean-Bolivian altiplano using co-orbital ALI, ASTER and Hyperion imagery: Data dimensionality issues and solutions. Remote Sens. Environ 2005, 99, 173–186. [Google Scholar]
  19. Mars, J.C.; Rowan, L.C. Regional mapping of phyllic- and argillic-altered rocks in the Zagros magmatic arc, Iran, using Advanced Spaceborne Thermal Emission and Reflection radiometer (ASTER) data and logical operator algorithms. Geosphere 2006, 2, 161–186. [Google Scholar]
  20. Richards, J.A.; Jia, X. Remote Sensing Digital Image Analysis an Introduction, 4th ed.; Springer: Berlin/Heidelberg, Germany, 2006. [Google Scholar]
  21. Monserud, R.A.; Leemans, R. Comparing global vegetation maps with the Kappa-statistic. Ecol. Model 1992, 62, 275–293. [Google Scholar]
  22. Congalton, R.G. A review of assessing the accuracy of classifications of remotely sensed data. Remote Sens. Environ 1991, 37, 35–46. [Google Scholar]
  23. Boardman, J.W.; Kruse, F.A. Analysis of imaging spectrometer data using n-dimensional geometry and a mixture-tuned matched filtering (MTMF) approach. IEEE Trans. Geosci. Remote Sens 2011, 49, 4138–4152. [Google Scholar]
Figure 1. Filter functions provided by DigitalGlobe for the proposed WV-3 Short-Wave-Infrared (SWIR) spectral bands.
Remotesensing 05 02688f1
Figure 2. (Left) Airborne Visible/Infrared Imaging Spectrometer (AVIRIS) True Color image (0.65, 0.55, 0.45 μm, RGB) of the Cuprite site; (Right) AVIRIS SWIR color image (2.10, 2.20, 2.34 μm, RGB) of the Cuprite site.
Remotesensing 05 02688f2
Figure 3. Comparison of AVIRIS (red), simulated WV-3 (black), and ASTER (blue) characteristic spectral signatures (mean endmember spectra) for selected minerals at the Cuprite site.
Remotesensing 05 02688f3
Figure 4. (Left) Minimum Distance classification at 7.5 m resolution using 86 AVIRIS SWIR bands; (Center) Minimum Distance classification at 7.5 m using 8 simulated WV-2 SWIR bands; (Right) MTMF mineral map at 7.5 m resolution using 86 AVIRIS SWIR bands. Visual comparison and the confusion matrix (Table 2) indicates that the AVIRIS and simulated WV-3 supervised classification produces similar, highly correlated results, however, neither really matches the known mineral distribution at Cuprite very well (Right and [13,14]).
Remotesensing 05 02688f4
Figure 5. (Left) Mixture-Tuned-Matched-Filtering (MTMF) mineral map at 7.5 m resolution using 86 AVIRIS SWIR bands in the analysis; (Center) MTMF Mineral Map at 30 m resolution using ASTER’s 5 SWIR bands; (Right) MTMF Mineral Map at 7.5 m spatial using the 8 simulated WV-2 SWIR bands. Visual comparison indicates that the simulated WV-3 mineral map does a better job than ASTER of preserving the key mineral patterns shown in the AVIRIS analysis.
Remotesensing 05 02688f5
Figure 6. AVIRIS MTMF mineral maps at 7.5 m spatial resolution for several different combinations of similar minerals (Left) Kaolinite and Alunite combined (Center) Kaolinite and Muscovite combined (Right) Kaolinite, Alunite, and Muscovite combined. Note the significant loss of detail regarding specific important mineral patterns mapped by AVIRIS (and the simulated WV-3 using all the minerals) in Figure 5.
Remotesensing 05 02688f6
Figure 7. (Top Left) Enlarged portion of the ASTER SWIR color composite image at 30 m spatial resolution (SWIR bands 4, 6, 8 or 1.66, 2.21, 2.34 μm as RGB). (Top Right) Simulated Worldview-3 SWIR color composite image at 7.5 m spatial resolution (SWIR bands 3, 6, 8 or 1.65, 2.20, 2.33 μm as RGB). (Bottom Left) Enlarged portion of ASTER SWIR mineral map from Figure 4. (Bottom Right) Worldview-3 SWIR mineral map. Note the high level of detail in the Worldview-3 SWIR color composite image compared to the ASTER color image and the corresponding improvement in the Worldview-3 mineral map (a combination of high spectral and spatial resolution).
Remotesensing 05 02688f7
Table 1. The proposed Worldview-3 (WV-3) VNIR and SWIR Spectral Bands.
Band NameCenter Wave (nm)Min Band Edge (nm)Max Band Edge (nm)
MS1 (NIR 1)835770 ± 5895 ± 5
MS2 (Red)660630 ± 5690 ± 5
MS3 (Green)545510 ± 5580 ± 5
MS4 (Blue)480450 ± 5510 ± 5
MS5 (Red Edge)725705 ± 5745 ± 5
MS6 (Yellow)605585 ± 5625 ± 5
MS7 (Coastal)425400 ± 5450 ± 5
MS8 (NIR 2)950860 ± 51,040 ± 12
SWIR-11,2101,195 ± 21,225 ± 2
SWIR-21,5701,550 ± 41,590 ± 4
SWIR-31,6601,640 ± 41,680 ±4
SWIR-41,7301,710 ± 41,750 ± 4
SWIR-52,1652,145 ± 22,185 ± 2
SWIR-62,2052,185 ± 42,225 ± 4
SWIR-72,2602,235 ± 42,285 ± 4
SWIR-82,3302,295 ± 42,365 ± 4
Table 2. Confusion matrix comparing Minimum Distance classifications for simulated WV-3 to AVIRIS results. Overall accuracy comparing the WV-3 (Figure 4(Center)) to the AVIRIS (Figure 4(Left)) is 93.34%; Kappa Coefficient is 0.9081. This falls in the Excellent category (Table 3) [21]; however, note the disparities compared to Figure 4(Right). The high match (95%) for Calcite is particularly troublesome, as the MTMF mineral map and previous mineral mapping [13,14] shows that the main areas of Calcite occurrence in the southwest corner of the image were not mapped and most of the areas that were mapped as Calcite by the Minimum Distance classification should probably be mapped as other minerals or as unclassified.
ClassUnClassAluniteBudd.KaoliniteCalciteSilicaMusovTotal
UnClass95.695.210.104.520.9314.7615.2351.44
Alunite0.0387.680.000.000.490.001.384.47
Budd.2.870.0099.7633.420.002.140.001.78
Kaolinite0.240.000.1262.060.000.000.000.55
Calcite1.114.590.000.0095.430.000.1626.89
Silica0.050.000.020.000.0083.100.001.46
Muscov.0.012.520.000.003.150.0083.2313.41
Total100.00100.00100.00100.00100.00100.00100.00100.00
Table 3. Threshold values used for separating the different degrees of agreement for the Kappa statistic. From [21], used with permission.
Lower BoundDegree of AgreementUpper Bound
<0.05No0.05
0.05Very Poor0.20
0.20Poor0.40
0.40Fair0.55
0.55Good0.70
0.70Very Good0.85
0.85Excellent0.99
0.99Perfect1.00
Table 4. (a) Confusion matrix comparing ASTER mineral mapping to AVIRIS mineral mapping. Overall accuracy is 35.05%, Kappa Coefficient is 0.2074 (Poor, Table 3); (b) Confusion matrix comparing simulated WV-3 mineral mapping to AVIRIS. Overall accuracy is 50.92%, Kappa Coefficient is 0.3843 (Poor); (c) Confusion matrix comparing ASTER mineral mapping to AVIRIS mineral mapping, excluding unclassified pixels. Overall accuracy is 35.99%, Kappa Coefficient is 0.2397 (Poor); (d) Confusion matrix comparing simulated WV-3 mineral mapping to AVIRIS, excluding unclassified pixels. Overall accuracy is 63.43%, Kappa Coefficient is 0.5406 (upper limit of Fair).
(a) ASTER to AVIRIS confusion matrix
ClassUnClassAluniteBudd.KaoliniteCalciteSilicaMusovTotal
UnClass38.7512.4811.7718.374.6919.0011.2324.9
Alunite10.9027.856.0814.843.564.316.7911.50
Budd.16.3929.9771.2836.238.6653.5112.9720.31
Kaolinite4.148.244.4812.032.192.0721.997.99
Calcite12.879.271.758.2267.874.9215.4117.37
Silica7.013.863.943.524.1113.524.425.97
Muscov.9.938.330.716.788.922.6827.1811.96
Total100.00100.00100.00100.00100.00100.00100.00100.00
Table 4. (a) Confusion matrix comparing ASTER mineral mapping to AVIRIS mineral mapping. Overall accuracy is 35.05%, Kappa Coefficient is 0.2074 (Poor, Table 3); (b) Confusion matrix comparing simulated WV-3 mineral mapping to AVIRIS. Overall accuracy is 50.92%, Kappa Coefficient is 0.3843 (Poor); (c) Confusion matrix comparing ASTER mineral mapping to AVIRIS mineral mapping, excluding unclassified pixels. Overall accuracy is 35.99%, Kappa Coefficient is 0.2397 (Poor); (d) Confusion matrix comparing simulated WV-3 mineral mapping to AVIRIS, excluding unclassified pixels. Overall accuracy is 63.43%, Kappa Coefficient is 0.5406 (upper limit of Fair).
(b) Worldview-3 to AVIRIS confusion matrix
ClassUnClassAluniteBudd.KaoliniteCalciteSilicaMusovTotal
UnClass45.3916.921.2118.502.6110.7311.4428.11
Alunite4.3034.690.263.552.060.323.757.45
Budd.13.724.2073.548.912.239.393.519.30
Kaolinite6.2414.1420.7646.844.038.4914.4711.55
Calcite11.465.340.716.5382.440.505.7915.60
Silica10.136.773.267.082.3167.935.1310.89
Muscov.8.5617.950.268.594.312.6555.9017.10
Total100.00100.00100.00100.00100.00100.00100.00100.00
Table 4. (a) Confusion matrix comparing ASTER mineral mapping to AVIRIS mineral mapping. Overall accuracy is 35.05%, Kappa Coefficient is 0.2074 (Poor, Table 3); (b) Confusion matrix comparing simulated WV-3 mineral mapping to AVIRIS. Overall accuracy is 50.92%, Kappa Coefficient is 0.3843 (Poor); (c) Confusion matrix comparing ASTER mineral mapping to AVIRIS mineral mapping, excluding unclassified pixels. Overall accuracy is 35.99%, Kappa Coefficient is 0.2397 (Poor); (d) Confusion matrix comparing simulated WV-3 mineral mapping to AVIRIS, excluding unclassified pixels. Overall accuracy is 63.43%, Kappa Coefficient is 0.5406 (upper limit of Fair).
(c) ASTER to AVIRIS confusion matrix (no unclassified)
ClassUnClassAluniteBudd.KaoliniteCalciteSilicaMusovTotal
UnClass
Alunite31.826.8918.183.745.327.6513.72
Budd.34.2580.7944.399.0966.0614.6127.22
Kaolinite9.415.0714.742.302.5524.7713.14
Calcite10.591.9910.0671.216.0717.3624.48
Silica4.414.464.314.3116.694.985.71
Muscov.9.520.808.319.363.3130.6215.73
Total100.00100.00100.00100.00100.00100.00100.00
Table 4. (a) Confusion matrix comparing ASTER mineral mapping to AVIRIS mineral mapping. Overall accuracy is 35.05%, Kappa Coefficient is 0.2074 (Poor, Table 3); (b) Confusion matrix comparing simulated WV-3 mineral mapping to AVIRIS. Overall accuracy is 50.92%, Kappa Coefficient is 0.3843 (Poor); (c) Confusion matrix comparing ASTER mineral mapping to AVIRIS mineral mapping, excluding unclassified pixels. Overall accuracy is 35.99%, Kappa Coefficient is 0.2397 (Poor); (d) Confusion matrix comparing simulated WV-3 mineral mapping to AVIRIS, excluding unclassified pixels. Overall accuracy is 63.43%, Kappa Coefficient is 0.5406 (upper limit of Fair).
(d) Worldview-3 to AVIRIS confusion matrix (no unclass)
ClassUnClassAluniteBudd.KaoliniteCalciteSilicaMusovTotal
UnClass
Alunite41.750.264.362.120.354.2311.76
Budd.5.0674.4410.942.2910.523.965.94
Kaolinite17.0221.0157.474.149.5116.3418.70
Calcite6.420.728.0184.650.566.5422.06
Silica8.143.308.692.3776.095.8013.17
Muscov.21.600.2610.534.432.9763.1328.38
Total100.00100.00100.00100.00100.00100.00100.00
Table 5. Confusion matrices comparing simulated WV-3 mineral mapping to AVIRIS mineral mapping for combinations of similar minerals. (a) Kaolinite and Alunite combined (no unclassified): Overall accuracy is 67.80%; Kappa Coefficient is 0.5642 (Good); (b) Kaolinite and Muscovite combined (no unclassified): Overall accuracy is 70.24%; Kappa Coefficient is 0.5729 (Good); (c) Kaolinite, Alunite, and Muscovite combined (no unclassified): Overall accuracy is 80.83%; Kappa Coefficient is 0.6432 (Good).
(a) Worldview-3 to AVIRIS confusion matrix (Kaolinite and Alunite combined)
ClassUnClassAluniteBudd.KaoliniteCalciteSilicaMusovTotal
UnClass
Alunite
Budd.74.447.232.2910.523.965.94
Kaolinite21.2859.906.269.8620.5730.46
Calcite0.727.0184.650.566.5422.06
Silica3.308.352.3776.095.8013.17
Muscov.0.2617.534.432.9763.1328.38
Total100.00100.00100.00100.00100.00100.00
Table 5. Confusion matrices comparing simulated WV-3 mineral mapping to AVIRIS mineral mapping for combinations of similar minerals. (a) Kaolinite and Alunite combined (no unclassified): Overall accuracy is 67.80%; Kappa Coefficient is 0.5642 (Good); (b) Kaolinite and Muscovite combined (no unclassified): Overall accuracy is 70.24%; Kappa Coefficient is 0.5729 (Good); (c) Kaolinite, Alunite, and Muscovite combined (no unclassified): Overall accuracy is 80.83%; Kappa Coefficient is 0.6432 (Good).
(b) Worldview-3 to AVIRIS confusion matrix (Muscovite and Kaolinite combined)
ClassUnClassAluniteBudd.KaoliniteCalciteSilicaMusovTotal
UnClass
Alunite41.750.262.120.354.2711.76
Budd.5.0674.442.2910.525.935.94
Kaolinite
Calcite6.420.7284.650.566.9522.06
Silica8.143.302.3776.096.6113.17
Muscov.38.6221.288.5712.4876.2347.08
Total100.00100.00100.00100.00100.00100.00
Table 5. Confusion matrices comparing simulated WV-3 mineral mapping to AVIRIS mineral mapping for combinations of similar minerals. (a) Kaolinite and Alunite combined (no unclassified): Overall accuracy is 67.80%; Kappa Coefficient is 0.5642 (Good); (b) Kaolinite and Muscovite combined (no unclassified): Overall accuracy is 70.24%; Kappa Coefficient is 0.5729 (Good); (c) Kaolinite, Alunite, and Muscovite combined (no unclassified): Overall accuracy is 80.83%; Kappa Coefficient is 0.6432 (Good).
(c) Worldview-3 to AVIRIS confusion matrix (Kaolinite, Alunite, and Muscovite combined)
ClassUnClassAluniteBudd.KaoliniteCalciteSilicaMusov+Total
UnClassKaol+Alu
Alunite
Budd.74.442.2910.525.655.94
Kaolinite
Calcite0.7284.650.566.7822.06
Silica3.302.3776.097.1113.17
Mus+K+A21.5410.6812.8380.4658.84
Total100.00100.00100.00100.00100.00

