Evaluation of Digital Classification of Polarimetric SAR Data for Iron-Mineralized Laterites Mapping in the Amazon Region

Abstract
:
1. Introduction
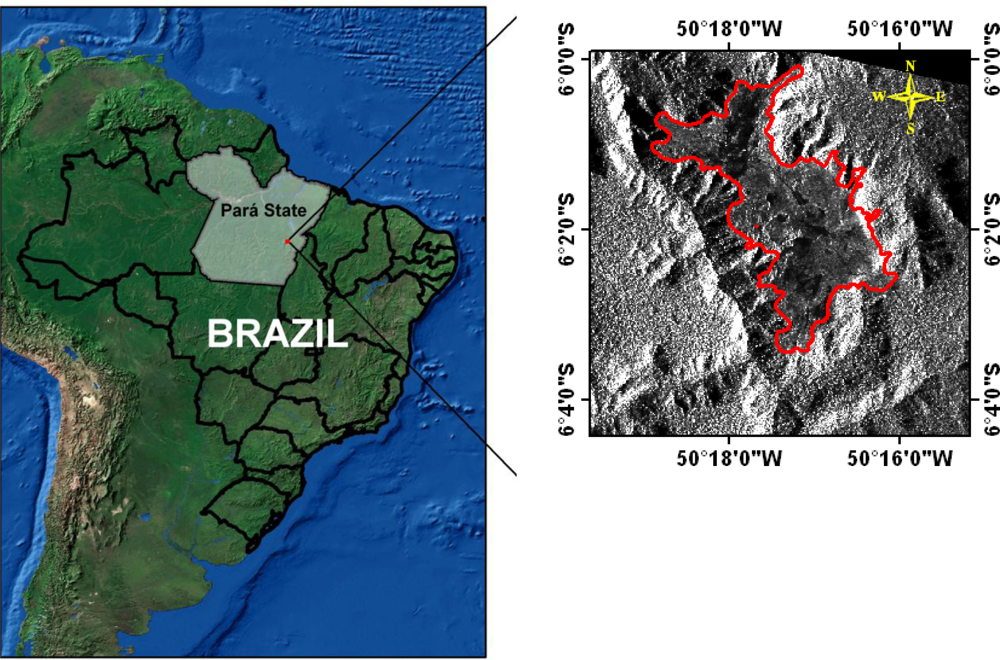
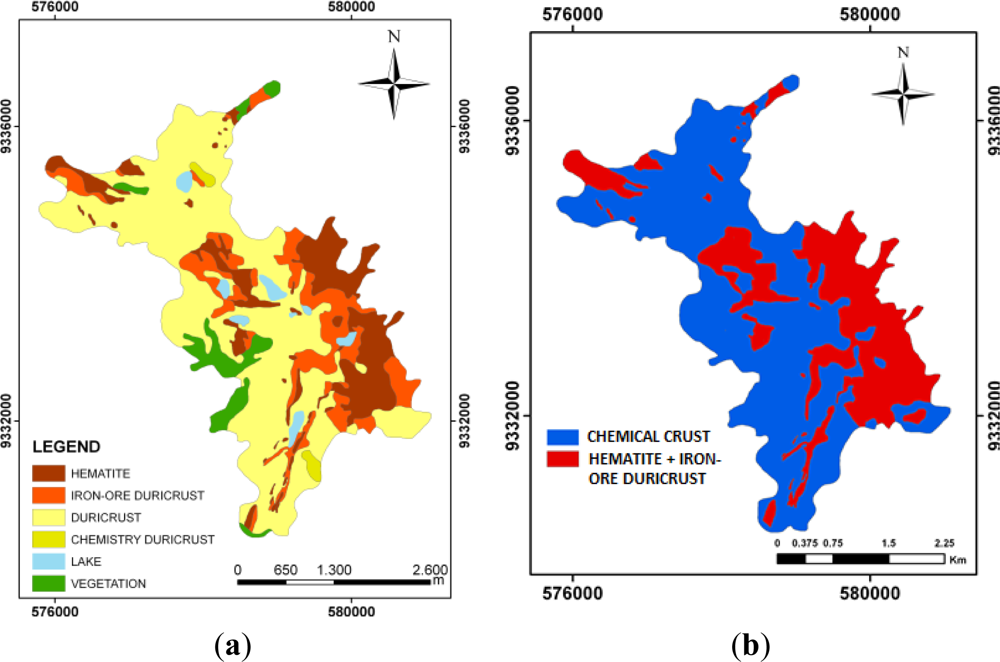
2. Study Area
3. Material and Methods
- (i)
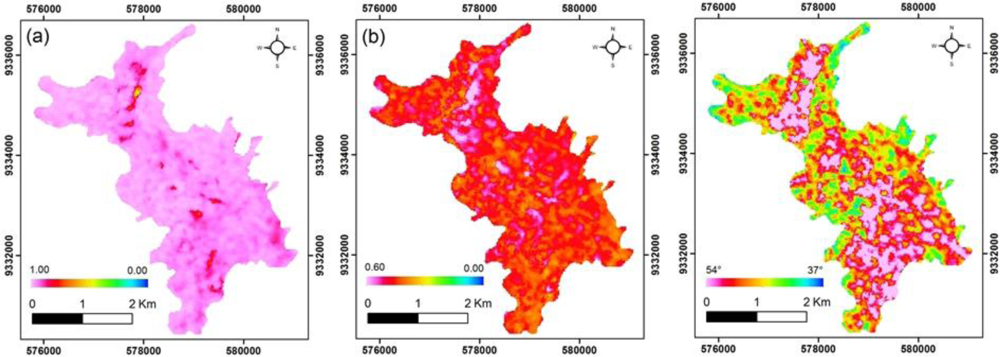
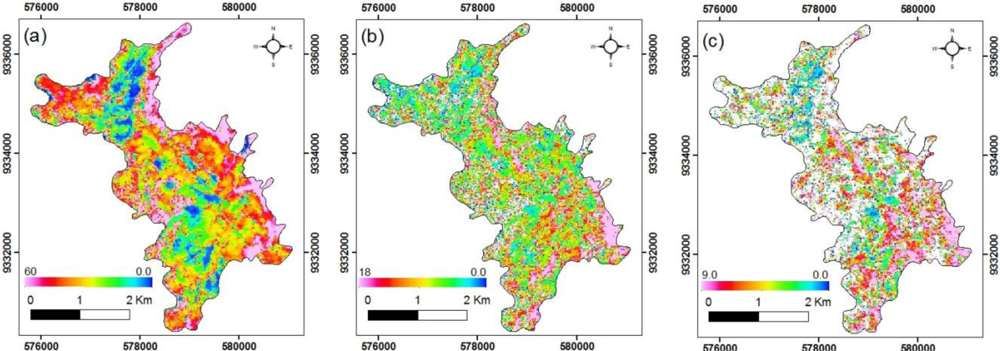
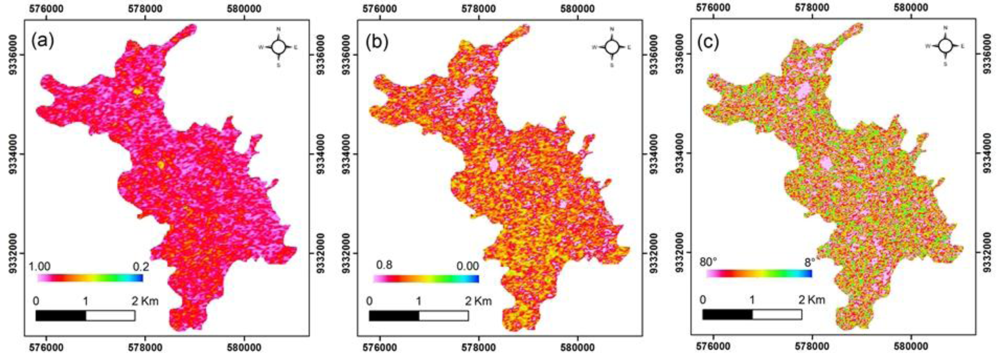
- Entropy (H), which measures the degree of randomness or statistical disorder of the scattering process (H = 0 indicates the presence of a totally polarized signal, which implies that the scattering is controlled by a pure or localized target, whereas H = 1 implies that scattering is due to a number of well-distributed targets);
- (ii)
- Anisotropy (A), defined as a complementary parameter to entropy, which provide information on the relative importance of the second and third scattering mechanisms based on the relationship between their respective eigenvalues (λ2 and λ3). In practical terms, anisotropy may be used as a source of discrimination when H > 0.7. This is because, when entropy is low, λ2 and λ3 are affected considerably by noise, as is anisotropy [29];
- (iii)
- Mean alpha angle (ᾱ) stands for the indicator of the mean scattering mechanism. A value close to zero relates surface reflection for scattering, from a dipole ᾱ equals π/4 and reaches π/2 when the target consists in a metallic dihedral scatterer.
4. Results and Discussion
4.1. Polarimetric Decomposition Method
4.1.1. Cloude-Pottier Method
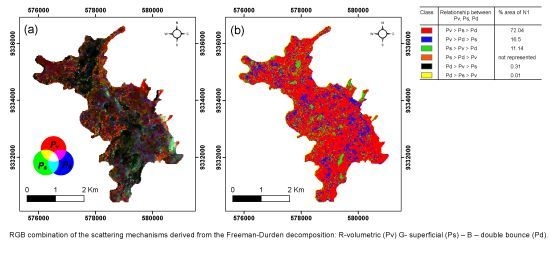
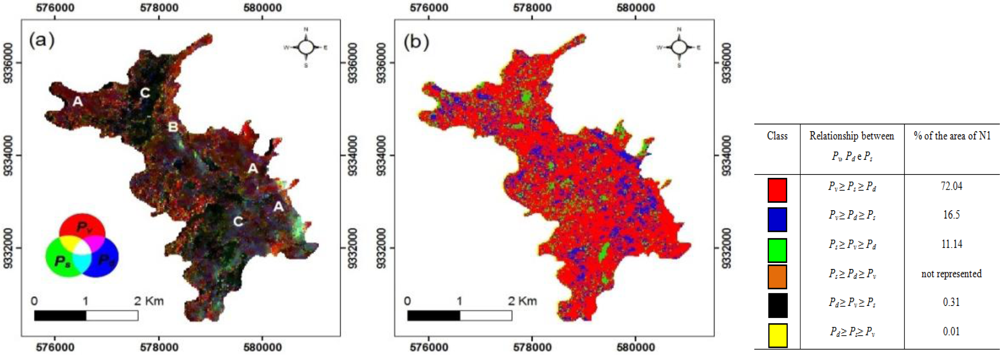
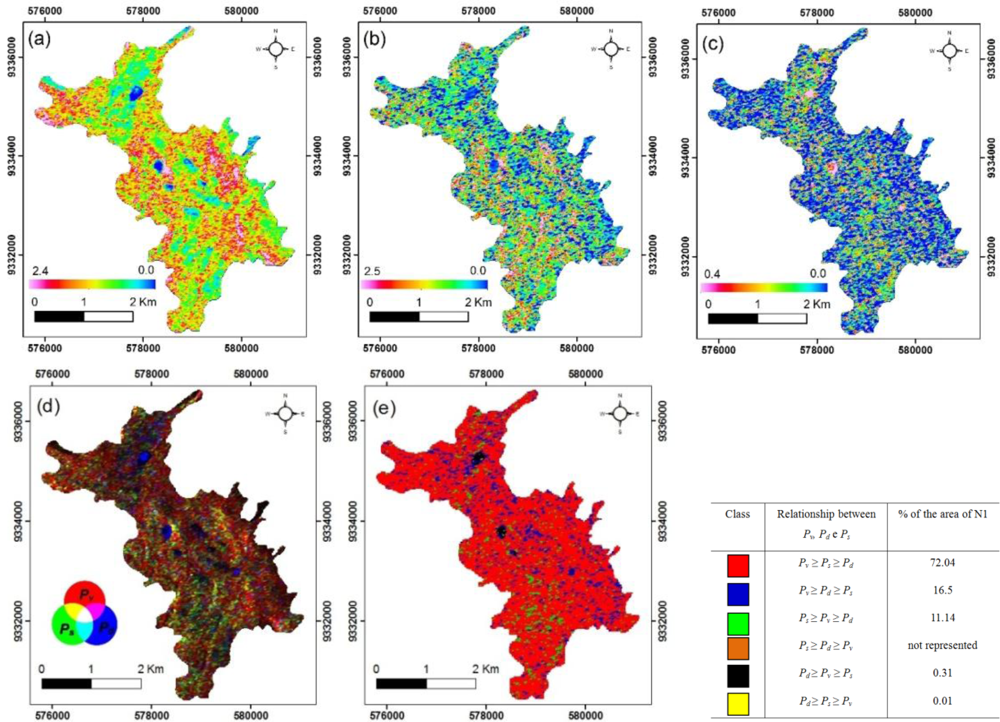
4.1.2. Freeman-Durden Polarimetric Decomposition Method
4.2. Classification Methods Based on Hybrid Processes
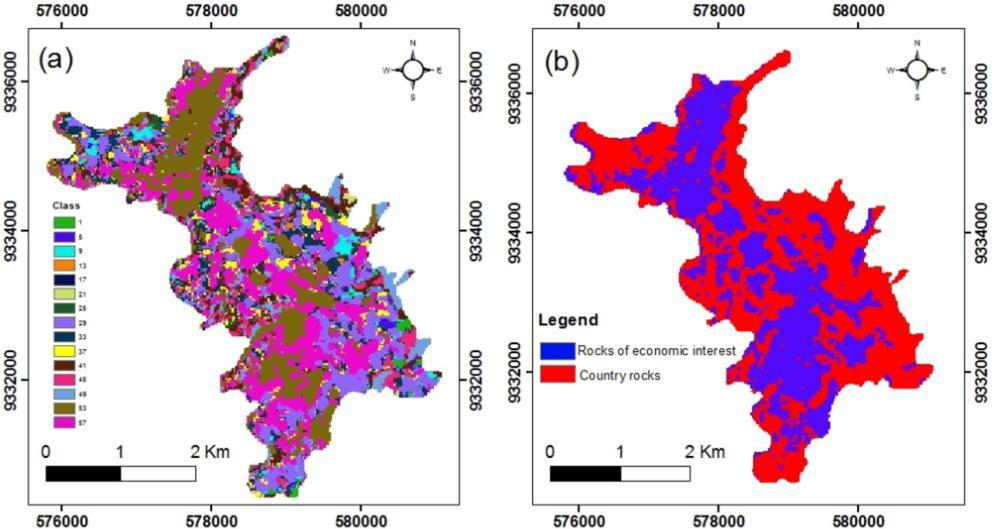
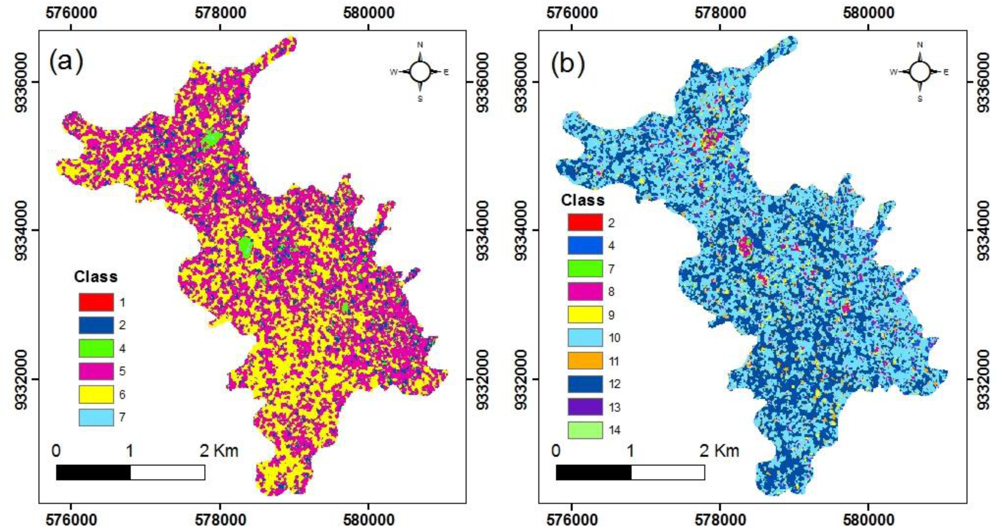
4.2.1. Wishart-Cloude-Pottier Classification
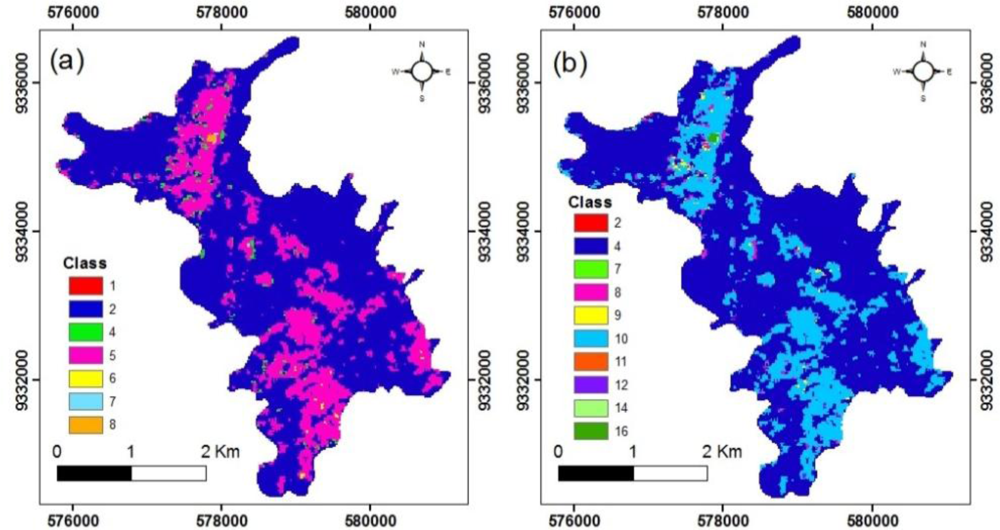
4.2.2. Wishart-Freeman-Durden Classification
4.3. Discussion
5. Conclusions
- (1)
- For both frequencies, Cloude-Pottier and Freeman-Durden decompositions help to understand the different scattering mechanisms in relation to the surface covers. However, Freeman-Durden RGB color composite using L-band presented the best result, providing insights concerning scattering mechanisms in physical properties of main mineralized laterites.
- (2)
- Results of the unsupervised classification for both datasets using the H-ᾱ plane did not show good spatial correspondence with the geological map. The inclusion of anisotropy did not improve the classification result.
- (3)
- The Wishart-H-ᾱ-A and Wishart-Freeman-Durden hybrid classifications presented low levels of performance with Kappa values lower than 0.20. Accuracy for the identification of units of economic interest ranged from 55% to 69%, albeit with high commission error values.
- (4)
- Comparing both frequencies, the performance of L-band was superior. This was probably due to the way that the landscape roughness was perceived by the sensors. Taking the Peake and Oliver criterion into account [41], the roughness scale for the discrimination of rock alteration products in the area is closer to L than to C-band.
Acknowledgments
- Conflict of InterestThe authors declare no conflict of interest.
References
- Paradella, W.R.; Bignelli, P.A.; Veneziani, P.; Pietsch, R.W; Toutin, T. Airborne and spaceborne Synthetic Aperture Radar (SAR) integration with Landsat TM and gamma ray spectrometry for geological mapping in a tropical rainforest environment, the Carajás Mineral Province, Brazil. Int. J. Remote. Sens 1997, 18, 1483–1501. [Google Scholar]
- Paradella, W.R.; Santos, A.R.; Dall’Agnol, R.; Pietsch, R.W.; Sant’Anna, M.V. A geological investigation based on airborne (SAREX) and spaceborne (RADARSAT-1) SAR integrated products in the Central Serra dos Carajás Granite area, Brazil. Can. J. Remote Sens 1998, 21, 76–392. [Google Scholar]
- Paradella, W.R.; Santos, A.R.; Veneziani, P.; Morais, M.C. Synthetic aperture radar for geological applications in the moist tropics: Experiences from the brazilian amazon region. Res. Bras. Geociências 2000, 30, 538–542. [Google Scholar]
- Pedroso, E.C.; Rivard, B.; Crósta, A.P.; Souza Filho, C.R.; Miranda, F.P. Reconnaissance geologic mapping in the Tapajós Mineral Province, Brazilian Amazon, using spaceborne SAR imagery and airborne geophysics. Can. J. Remote Sens 2001, 27, 669–678. [Google Scholar]
- Teruiya, R.K.; Paradella, W.R.; Santos, A.R.; Dall’Agnol, R.; Veneziani, P. Integrating airborne SAR, Landsat TM and airborne geophysics data for improving geological mapping in the Amazon region: The Cigano granite, Carajás Province, Brazil. Int. J. Remote Sens 2008, 29, 3957–3974. [Google Scholar]
- Santos, J.R.; Mura, J.C.; Paradella, W.R.; Dutra, L.V.; Gonçalves, F.G. Mapping recent deflorestation in the Brazilian Amazon using simulated L-band MAPSAR imagens. Int. J. Remote Sens 2008, 29, 4879–4884. [Google Scholar]
- Morais, M.C.; Paradella, W.R.; Freitas, C.C. An assessment of the discrimination of irion mineralized laterites in the amazon region (Carajás Province) based on textural attributes from C-band Airbone SAR data. Asian J. Geoinf 2002, 2, 11–19. [Google Scholar]
- Gama, F.F.; Dos Santos, J.R.; Mura, J.C. Eucalyptus biomass and volume estimation using interferometric and polarimetric SAR data. Remote Sens 2010, 2, 939–956. [Google Scholar]
- Trisasongko, B.; Lees, B.; Paull, D. Polarimetric classification in a tailings deposition area at the Timika Mine Site. Mine Water Environ 2006, 25, 246–250. [Google Scholar]
- Hugenholtz, C.; van der Sanden, J. Polarimetric SAR Geomorphic Mapping in the Intertidal Zone, Minas Basin, Bay of Fundy, Nova Scotia; Canada Centre for Remote Sensing: Ottawa, Canada, 2001; p. 23. [Google Scholar]
- Ramsey, E., III; Rangoonwala, A.; Suzuoki, Y.; Jones, C.E. Oil detection in a coastal marsh with polarimetric Synthetic Aperture Radar (SAR). Remote Sens 2011, 3, 2630–2662. [Google Scholar]
- Yonezawa, C.; Watanabe, M.; Saito, G. Polarimetric decomposition analysis of ALOS PALSAR observation data before and after a landslide event. Remote Sens 2012, 4, 2314–2328. [Google Scholar]
- Silva, M.F.F.; da Rosa, N.A. Estudos Botânicos na área do Projeto Ferro Carajás, Serra Norte. I—Aspectos Fito-Ecológicos dos Campos Rupestres. Proceedings of Congresso Nacional de Botânica, Manaus, Brasil, 22–27 January 1984.
- Araújo, O.J.B.; Maia, R.G.N. Projeto Especial Mapas de Recursos Minerais, de Solos e de Vegetação Para a Área do Programa Grande Carajás. Subprojeto Recursos Minerais; Folha SB.22-Z-A. DNPM/CPRM: Serra dos Carajás-Estado do Pará, Brasília, Brazil, 1991; p. 136.
- Tallarico, F.H.B.; Figueiredo, B.; Groves, D.I.; Kositcin, N.; Cnaughton, N.J.; Fletcher, I.R. Geology and SHRIMP U-Pb geochronology of the Igarapé Bahia deposit, Carajás Copper-Gold Belt, Brazil: An Archean (2.57 Ga) example of Iron-Oxide Cu-Au-(U-REE). Miner. Econ. Geol 2005, 100, 7–28. [Google Scholar]
- Meirelles, E.M.; Hirata, W.K.; Amaral, A.F.; Medeiros Filho, C.A.; Gato, W.C. Geologia das folhas Carajás e Rio Verde, Província mineral dos Carajás, estado do Pará. Congresso Brasileiro De Geologia 1984, 5, 2164–2174. [Google Scholar]
- Beisiegel, V.R.; Bernadelli, A.L.; Drommond, N.F.; Ruff, A.W.; Tremaine, J.W. Geologia e recursos minerais de Serra dos Carajás. Res. Bras. Geociências 1973, 3, 215–242. [Google Scholar]
- Maurity, C.W.; Kotschoubey, B. Evolução recente da cobertura de alteração no platô N1- Serra dos Carajás-PA: Degradação, pseudocarstificação, espeleotemas. Bol. Mus. Para. Emílio Goeldi 1995, 7, 331–362. [Google Scholar]
- Resende, N.P.; Barbosa, A.L.M. Relatório de Pesquisas de Minério de Ferro, Distrito Ferrífero da Serra dos Carajás, Estado do Pará; Relatório Final; AMZA: Belém, PA, Brazil, 1972; Volume 1. [Google Scholar]
- Lobato, L.M; Rosière, C.A.; Baars, F.J.; Figueiredo e Silva, R.C.; Zucchetti, M.; Rios, F.J.; Seoane, J.C.S.; Mendes, G.E.; Maciel, A.L. Relatório de Atividades Nº 07, Projeto Caracterização de Distritos Mineiros da Amazônia—Alvo Ferro Carajás; FINEP (Fundo Mineral-MCT)–DNPM–ADIMB: Brasília, Brazil, 2005; p. 28. [Google Scholar]
- Mura, J.C.; Paradela, W.R.; Dutra, L.V.; Santos, J.R.; Rudorff, B.F.T.; Miranda, F.P.; Silva, M.M.Q.; Silva, W.F. MAPSAR images simulation based on L-band polarimetric data from SAR-R99B airborne sensor (SIVAM system). Sensors 2009, 9, 102–117. [Google Scholar]
- Mura, J.C.; Correia, A.H. Calibração Preliminar dos Dados SAR Polarimétricos em Banda L do Sensor R99B do CENSIPAM. Proceedings of Simposio Brasileiro de Sensoriamento Remoto—SBSR, Florianólopis, Brazil, 21–16 April 2007; pp. 4951–4958.
- Quegan, S.A. A uniform algorithm for phase and cross-talk calibration of polarimetric data—Theory and observation. IEEE Trans. Geosci. Remote Sens 1994, 32, 89–99. [Google Scholar]
- Luscombe, A. Image Quality and Calibration of RADARSAT-2. Proceedings of 2009 IEEE International Geoscience and Remote Sensing Symposium (IGARSS), Cape Town, South Africa, 12–17 July 2009; pp. 757–760.
- Woodhouse, I. Introduction to Microwave Remote Sensing; CRC Press: Boca Raton, FL, USA, 2006; p. 369. [Google Scholar]
- Freeman, A.; Durden, S.L. A three-component scattering model for polarimetric SAR data. IEEE Trans. Geosci. Remote Sens 1998, 36, 963–973. [Google Scholar]
- Cloude, S.R.; Pottier, E. An entropy based classification scheme for land application of polarimetric SAR. IEEE Trans. Geosci. Remote Sens 1997, 35, 68–78. [Google Scholar]
- Moriyama, T.; Uratsuka, S.; Umehara, T.; Maeno, H.; Satake, M.; Nadai, A.; Nakamura, K. Polarimetric SAR image analysis using model fit for urbanstructure. IEICE Trans. Commun 2005, E88-B, 1244–1242. [Google Scholar]
- Lee, S.E.; Pottier, E. Polarimetric Radar Imaging: From Basics to Applications; CRC Press/Taylor & Francis Group: Boca Raton, FL, USA, 2009; p. 398. [Google Scholar]
- Lee, J.S.; Grunes, M.R. Feature Classification Using Multi-Look Polarimetric SAR Imagery. Proceedings of International Geoscience and Remote Sensing Society, Houston, TX, USA, 26–29 May 1992; I, pp. 77–79.
- Lee, J.S.; Grunes, M.R.; Ainsworth, T.L.; Li-Jen, D.U.; Schuler, D.L.; Cloude, S.R. Unsupervised classification using polarimetric decomposition and the complex Wishart classifier. IEEE Trans. Geosci. Remote Sens 1999, 37, 2249–2258. [Google Scholar]
- Pottier, E.; Lee, J.S. Unsupervised Classification Scheme of POLSAR Images Based on the Complex Wishart Distribution and the H/A/Alpha—Polarimetric Decomposition Theorem. Proceedings of European Conference on Synthetic Aperture Radar, Munich, Germany, 23–25 May 2000.
- Lee, J.S.; Grunes, M.R.; Pottier, E.; Ferro-Famil, L. Unsupervised terrain classification preserving polarimetric scattering characteristics. IEEE Trans. Geosci. Remote Sens 2004, 42, 722–731. [Google Scholar]
- Congalton, R.G.; Green, K. Assessing the Accuracy of Remotely Sensed Data—Principles and Practices, 2nd ed; CRC Press: Boca Raton, FL, USA, 2008; p. 210. [Google Scholar]
- Ulaby, F.T.; Moore, R.K.; Fung, A.K. Microwave Remote Sensing: Active and Passive; Artech House Press: Boston, MA, USA, 1982; Volume II, pp. 457–1064. [Google Scholar]
- Mattia, F.; Le Toan, T.; Souyris, J.; de Carolis, G.; Floury, N.; Posa, F.; Pasquariello, G. The effect of superface roughness on multifrequency polarimetric SAR data. IEEE Trans. Geosci. Remote Sens 1997, 35, 954–966. [Google Scholar]
- Morais, M.C.; Pereira, P.M., Jr.; Paradella, W.R. Potencial of SAR Data (L-HH-HV-VV) to Discriminate Iron-Mineralised Laterites in the Region Amazon (Carajás Province) Based on Textural Attributes. Proceedings of Simpósio Brasileiro de Sensoriamento Remoto—SBSR, Florianólopis, Brazil, 21–16 April 2007; pp. 2069–2078.
- Evans, D.L.; Farr, T.G.; van Zyl, J.J.; Zebker, H.A. Radar polarimetry: Analysis tools and applications. IEEE Tran. Geosci. Remote Sens 1988, 26, 774–789. [Google Scholar]
- Zebker, H.A.; van Zyl, J.J.; Held, D.N. Imaging radar polarimetry from wave synthesis. J. Geophys. Res 1987, 92, 683–701. [Google Scholar]
- Shelat, Y.; Leblon, B.; Larocque, A.; Harris, J.; Jefferson, C.; Lentz, D.; Tschirhart, V. Effects of incidence angles on mapping accuracy of surficial materials in the Umiujalik Lake area, Nunavut, using RADARSAT-2 polarimetric SAR images. Part 2. Polarimetric analysis. Can. J. Remote Sens 2012, 38, 404–423. [Google Scholar]
- Peake, W.H; Oliver, T.L. The Response of Terrestrial Surfaces at Microwaves Frequencies; Technical Report 2770–7; Ohio State University: Columbus, OH, USA, 1971. [Google Scholar]
- Silva, A.Q.; Paradella, W.R.; Freitas, C.C.; Oliveira, C.G. Relationship between PALSAR backscatter and surface-roughness parameter from iron laterites in Carajás, Amazon Region. IEEE Trans. Geosci. Remote Sens 2009, 47, 4027–4031. [Google Scholar]
- Gaddis, L.R. Lava flow characterization at Pisgah volcanic Field, California, with, multiparameter imaging radar. Geol. Soc. Am. Bull 1992, 104, 695–703. [Google Scholar]
- Dierking, W. Quantitative roughness characterization of geological surfaces and implications for radar signature analysis. IEEE Trans. Geosci. Remote Sens 1999, 37, 2397–2412. [Google Scholar]


| Parameter | Sensor | |
|---|---|---|
| R99B | RADARSAT-2 | |
| Frequency GHz (Band) | 1.28 (L) | 5.40 (C) |
| Wave length (cm) | 23.9 | 5.6 |
| Polarization | HH/HV/VH/VV | HH/HV/VH/VV |
| (Acquisition mode) | (Quad-Pol) | (Fine-Quad-Pol) |
| Processing level | SLC * | SLC * |
| Type of data (n. de looks) | Polarimetric (8) | Polarimetric (1) |
| Resolution/m (rg × az.) | 6.0 × 0.5 | 5.2 × 7.6 |
| Pixel spacing/cm (rg × az.) | 2.5 × 1 (slant) | 4.73 × 4.98 (slant) |
| Orbit | Descending | Ascending |
| Acquisition date | 15/June/2005 | 15/Nov/2008 |
| Incidence angle interval | 53.37°–67.23° | 31.297°–32.987° |
| Zone | Entropy, H | Alpha, ᾱ (°) | Scattering Type |
|---|---|---|---|
| 1 | 0.9–1.0 | 55–90 | High Entropy Multiple Scattering |
| 2 | 0.9–1.0 | 40–45 | High Entropy Vegetation Scattering |
| 3 | 0.9–1.0 | 0–40 | High Entropy Surface Scattering |
| 4 | 0.5–0.9 | 50–90 | Medium Entropy Multiple Scattering |
| 5 | 0.5–0.9 | 40–50 | Medium Entropy Vegetation Scattering |
| 6 | 0.5–0.9 | 0–40 | Medium Entropy Surface Scattering |
| 7 | 0–0.5 | 47.5–90 | Low Entropy Multiple Scattering Events |
| 8 | 0–0.5 | 42.5–47.5 | Low Entropy Dipole Scattering |
| 9 | 0–0.5 | 0–42.5 | Low Entropy Surface Scattering |
| Sensor | Algorithm | Global Kappa | Accuracy (%) for the Class of Economic Interest | Omission Error (%) | Commission Error (%) |
|---|---|---|---|---|---|
| R99B | Wishart-H-ᾱ | 0.16 | 55 | 44 | 58 |
| Wishart-H-ᾱ-A | 0.14 | 68 | 32 | 60 | |
| Wishart-Freeman-Durden | 0.16 | 69 | 31 | 60 | |
| RADARSAT-2 | Wishart-H-ᾱ | 0.09 | 38 | 62 | 59 |
| Wishart-H-ᾱ-A | 0.08 | 42 | 58 | 60 | |
| Wishart-Freeman-Durden | 0.08 | 51 | 50 | 61 |
| Roughness | |||
|---|---|---|---|
| Smooth hrms< | Intermediate <hrms< | Rough hrms> | |
| RADARSAT2 (λ = 5.6 cm, θi = 32°) | 0.264 | 0.264−1.651 | 1.651 |
| R99B (λ = 23.9 cm, θi = 55°) | 1.667 | 1.667−10.417 | 10.417 |
© 2013 by the authors; licensee MDPI, Basel, Switzerland This article is an open access article distributed under the terms and conditions of the Creative Commons Attribution license (http://creativecommons.org/licenses/by/3.0/).
Share and Cite
Da Silva, A.D.Q.; Paradella, W.R.; Freitas, C.C.; Oliveira, C.G. Evaluation of Digital Classification of Polarimetric SAR Data for Iron-Mineralized Laterites Mapping in the Amazon Region. Remote Sens. 2013, 5, 3101-3122. https://doi.org/10.3390/rs5063101
Da Silva ADQ, Paradella WR, Freitas CC, Oliveira CG. Evaluation of Digital Classification of Polarimetric SAR Data for Iron-Mineralized Laterites Mapping in the Amazon Region. Remote Sensing. 2013; 5(6):3101-3122. https://doi.org/10.3390/rs5063101
Chicago/Turabian StyleDa Silva, Arnaldo De Q., Waldir R. Paradella, Corina C. Freitas, and Cleber G. Oliveira. 2013. "Evaluation of Digital Classification of Polarimetric SAR Data for Iron-Mineralized Laterites Mapping in the Amazon Region" Remote Sensing 5, no. 6: 3101-3122. https://doi.org/10.3390/rs5063101