Article

Estimating Total Discharge in the Yangtze River Basin Using Satellite-Based Observations

1
School of Earth Sciences and Engineering, Hohai University, Nanjing 210098, China
2
State Key Laboratory of Hydrology-Water Resources and Hydraulic Engineering, Hohai University, Nanjing 210098, China
*
Author to whom correspondence should be addressed.
Remote Sens. 2013, 5(7), 3415-3430; https://doi.org/10.3390/rs5073415
Submission received: 20 May 2013 / Revised: 11 July 2013 / Accepted: 12 July 2013 / Published: 17 July 2013

Abstract

:
The measurement of total basin discharge along coastal regions is necessary for understanding the hydrological and oceanographic issues related to the water and energy cycles. However, only the observed streamflow (gauge-based observation) is used to estimate the total fluxes from the river basin to the ocean, neglecting the portion of discharge that infiltrates to underground and directly discharges into the ocean. Hence, the aim of this study is to assess the total discharge of the Yangtze River (Chang Jiang) basin. In this study, we explore the potential response of total discharge to changes in precipitation (from the Tropical Rainfall Measuring Mission—TRMM), evaporation (from four versions of the Global Land Data Assimilation—GLDAS, namely, CLM, Mosaic, Noah and VIC), and water-storage changes (from the Gravity Recovery and Climate Experiment—GRACE) by using the terrestrial water budget method. This method has been validated by comparison with the observed streamflow, and shows an agreement with a root mean square error (RMSE) of 14.30 mm/month for GRACE-based discharge and 20.98 mm/month for that derived from precipitation minus evaporation (P − E). This improvement of approximately 32% indicates that monthly terrestrial water-storage changes, as estimated by GRACE, cannot be considered negligible over Yangtze basin. The results for the proposed method are more accurate than the results previously reported in the literature.

1. Introduction

The ability of Gravity Recovery and Climate Experiment (GRACE) to detect continental water-storage variations has been proven during recent years. The terrestrial water-storage is virtually a measure of total water content in surface stores, soil layers, ice (including snow), groundwater reservoirs and biomass (which is negligible in most cases) [1]. GRACE has been used for estimating regional water-storage variations in a number of locations, for instance: the Amazon River basin [24]; the Ganges River basin [5]; the Congo River basin [6]; the Orinoco River basin [7]; and the Yangtze River (Chang Jiang) basin [8]. Other important studies from GRACE related to the monitoring of water-storage are: groundwater withdrawal in India [9]; contributions of glaciers and ice caps to sea-level rise [10,11]; monitoring the mass balance of Antarctica [12] and Greenland [1315]; and Alaskan permafrost groundwater storage changes [16]. In this study, we focus on the Yangtze River basin, which is an important region in China in terms of culture, society and economy, and it plays an important role in the ecological environmental conservation of China [17].
Hu et al. [8], for example, compared the seasonal water-storage over the Yangtze basin derived from GRACE data and two hydrologic models: the Climate Prediction Center (CPC) and the Global Land Data Assimilation (GLDAS). Their results showed good agreement (7 mm of equivalent water height) in terms of the differences in annual amplitudes between GRACE and the model predictions using fifteen months of GRACE spherical harmonic solutions, from April 2002 to December 2003. Furthermore, Wang et al. [18] investigated the ability of GRACE to monitor the water systems area (a set of five sub-basins) of the Three Gorges reservoir by comparing the inversion results from GRACE with the results of the CPC model. They found that the root mean square error (RMSE) is 21 mm for the total water-storage changes. Zhao et al. [19] used the first release of the Delft Institute of Earth Observation and Space Systems (DEOS) Mass Transport (DMT-1) model, based on GRACE data, to analyze water-storage changes in the Yangtze basin. Their results showed that the water-storage of the Yangtze basin has a large and statistically significant increase, 7 ± 1.6 mm/yr, over the period of February 2003 to May 2008. Huang et al. [20] considered the soil moisture and snow water equivalent as an estimation of water-storage and they found that the Yangtze basin is drying up. The results were based on data obtained from Interim Reanalysis Data (ERA-Interim) and Noah model from GLDAS for the period between 1979 and 2010.
In [21], Huang et al. examined the changes in the water-storage of the Yangtze basin over a period of approximately seven years using monthly gravity fields of GRACE and water level measurements. Because of the limited resolution of the GRACE satellite data, they concluded that no changes could be detected in the water-storage capacity, owing to the water impoundment of the Three Gorges Dam (TGD). However, Wang et al. [22] applied a novel approach for isolating the signal from mass changes for the water impoundment of the TGD. The TGD’s contribution from water-storage changes was isolated by using the WaterGAP Global Hydrology Model (WGHM) and the residual (GRACE-WGHM) was compared to in situ measurements of volume changes. Wang et al. [22] concluded that GRACE can detect the mass shift and retrieve the amplitudes of large surface water-storage changes in a concentrated area that is smaller than GRACE’s spatial resolution.
All of the aforementioned studies outline the potential of GRACE for investigating water-storage and its changes within the Yangtze basin. However, there have been efforts to incorporate other data sets in estimating total basin discharge [23] at a river basin scale, for example, atmospheric models that predict precipitation minus evaporation (we use evaporation to describe all processes of vaporization). Syed et al. [24] have used satellite measurements of variations in continental water-storage from the GRACE mission to present first estimates of monthly freshwater discharge from the entire Pan-Arctic for the period 2003–2005. The methodology published in [23,24] has been used by Syed et al. [25] to estimate the monthly freshwater discharge from continents, drainage regions, and global land for the period of 2003–2005. In [26], Seo et al. used a novel approach, which avoids influences from uncertainties in the estimation of atmospheric moisture flux, in order to evaluate the global fresh water discharge by solving the water balance equation over the oceans.
To the best of our knowledge, there has been only one application, carried out by Syed et al. [25], that estimates the total freshwater discharge from Yangtze basin for the three-year period from 2003 to 2005. Their results show a correlation coefficient of 0.92 between the annual cycles of the observed streamflow and estimated discharges for the Yangtze basin. Syed et al. [23] pointed out that the limitation in the use of the terrestrial water budget equation is the high uncertainties of evaporation. However, this has never been tested before. Hence, the aims of the present study are to estimate the total discharge of the Yangtze basin by using the terrestrial water budget equation and to assess if the water-storage (as derived from GRACE) can be considered negligible in this estimation. To achieve these goals, we applied precipitation data from: the Tropical Rainfall Measuring Mission (TRMM); data on water-storage changes derived from the latest Level-02 (Release-05) GRACE data from three processing centers (i.e., Center for Space Research—CSR, Jet Propulsion Laboratory—JPL, and GeoForschungsZentrum—GFZ); and evaporation predictions from four versions of GLDAS version 1 (CLM, Mosaic, Noah and VIC) [27]. The results are compared with a time series of in situ streamflow data.

2. Methods and Data Sources

2.1. Datasets

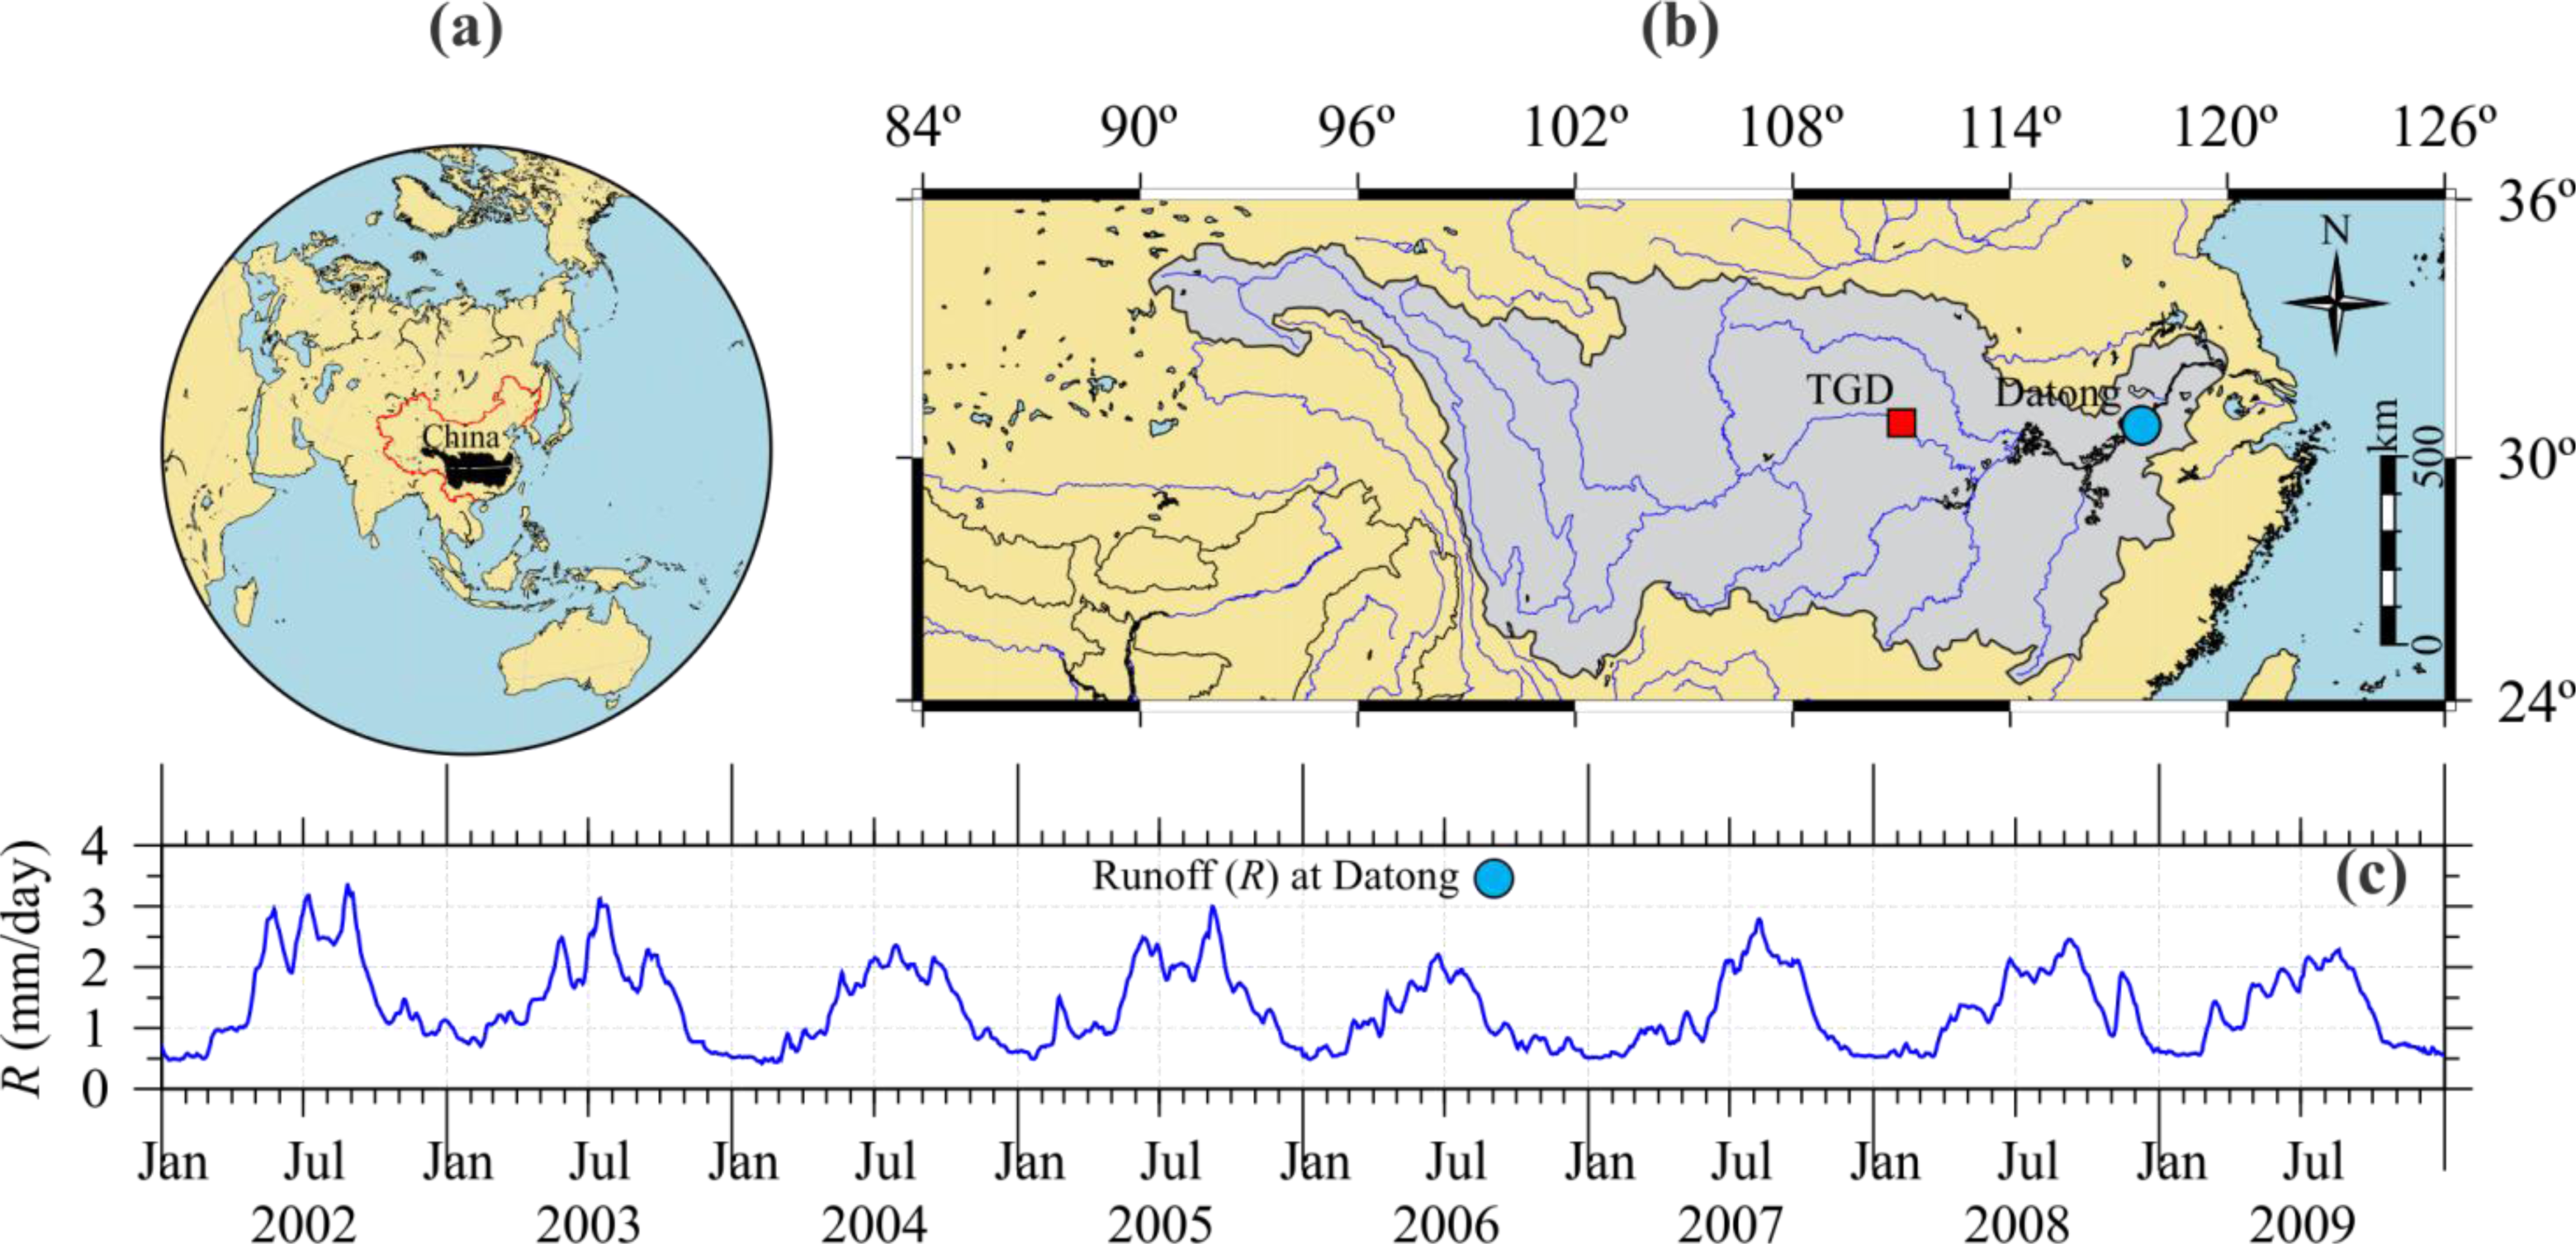
2.1.1. Study Area and In Situ Discharge of Yangtze River

The Yangtze River basin lies within the subtropical zone in China [20], see Figure 1a. The Yangtze River originates in the highlands of the east Qinghai-Tibet Plateau. It owes its streamflow to the glaciers of the Dangla Mountain Range. Besides the glaciers from plateau, the Yangtze River receives discharge from numerous tributaries and lakes, Lake Poyang in particular, till it finally reaches the East China Sea at Shanghai. In the present study, daily streamflow observations for the Yangtze basin were obtained from the Datong gauging station from the Yangtze River Estuary Survey Bureau of Hydrology and Water Resource, Ministry of Water Resources. Datong is located near the Yangtze Estuary and measures the contribution from an upstream area of approximately 1.7 × 10⁶ km2 (Figure 1b). Owing to tidal effects, it is not possible to measure streamflow from a station at the mouth of the Yangtze River (Datong is the tidal limit of the estuary). In order to convert the observed streamflow (m3/s) at the Datong station into daily net surface runoff rate (mm/day) per unit area over Yangtze basin, the drainage area size is required (∼1.7 × 10⁶ km2). Thus, monthly surface runoff rate (R in mm/month) for the basin was computed as the sum of the daily surface runoff rate.

2.1.2. Precipitation Data

In this study, we used the global monthly accumulated rain grids supplied by the TRMM, as Level-3 V7 products, more specifically the TRMM 3B43. TRMM is a joint satellite mission of Goddard Space Flight Centre (GSFC), from the National Aeronautics and Space Administration (NASA), and the Japan Aerospace Exploration Agency (JAXA) [28]. The TRMM Multi-satellite Precipitation Analysis (TMPA) was designed to combine all available precipitation datasets from different satellite sensors and monthly surface rain gauge data to provide an estimate of precipitation at spatial resolution of 0.25°(arc-degree) [28]. Since the end of 1997, the TRMM has provided monthly rainfall rates for tropical and subtropical regions. Owing to the availability of the discharge and GRACE products at the time of the study, the time period used is limited from January 2003 to December 2009 (total 84 months).

2.1.3. Hydrological Models

GRACE-derived values of water-storage anomalies are of potential importance as stand-alone quantities or when combined with other data types, for example, land surface models that offer detailed estimates of distributed hydrological fluxes and storages. The Global Land Data Assimilation System (GLDAS) is generating a series of land surface state (e.g., soil moisture and surface temperature) and flux (e.g., evaporation and sensible heat flux) products simulated by four land surface models (CLM, Mosaic, Noah and VIC) [27,2931]. We used four versions (CLM, Mosaic Noah, and VIC) of the GLDAS Version 1 (GLDAS-1) 1.0° resolution. This was necessary because of the lack of a spatial evaporation data set necessary to estimate the total discharge by using the terrestrial water budget.

2.1.4. GRACE Level 2 Products

The GRACE observations are processed at: the Center for Space Research (CSR), University of Texas; the Jet Propulsion Laboratory (JPL); the GeoForschungsZentrum (GFZ); the Centre National d’Études Spatiales (CNES); the Delft Institute of Earth Observation and Space Systems (DEOS), Delft University of Technology; and at a few other institutions. The final results, known as Level 2 (L2) products, are usually monthly geopotential solutions expressed in terms of spherical harmonic coefficients (truncated at certain degree and order d/o), which are widely used to study mass changes in the Earth system. Furthermore, each center follows different data processing methodologies, which might cause some differences in the solutions [32]. Thus, the new Release-05 (RL05) L2 products from the three GRACE project processing centers (CSR, JPL, GFZ) were used for this study. Whiles the JPL and CSR still recommend that users replace C20 estimates from Satellite Laser Ranging (SLR), the GFZ recommends that users maintain the RL05 estimates of C20. As in Chen et al. [11], GRACE-estimated C20 coefficients for the JPL and CSR were replaced by the values derived from SLR [33]. The monthly degree 1 coefficients for all solutions were used from Swenson et al. [34]. The data for this study include 84 CSR-RL05 (d/o 60), 84 JPL-RL05 (d/o 90, some are of d/o 60) and 84 GFZ-RL5 (d/o 90) GRACE monthly solutions, covering the period from January 2003 to January 2010. The missing period is June 2003 for the three processing centers. The RL05 products for 2002 are not available yet (6 June 2013).

2.2. Methodology

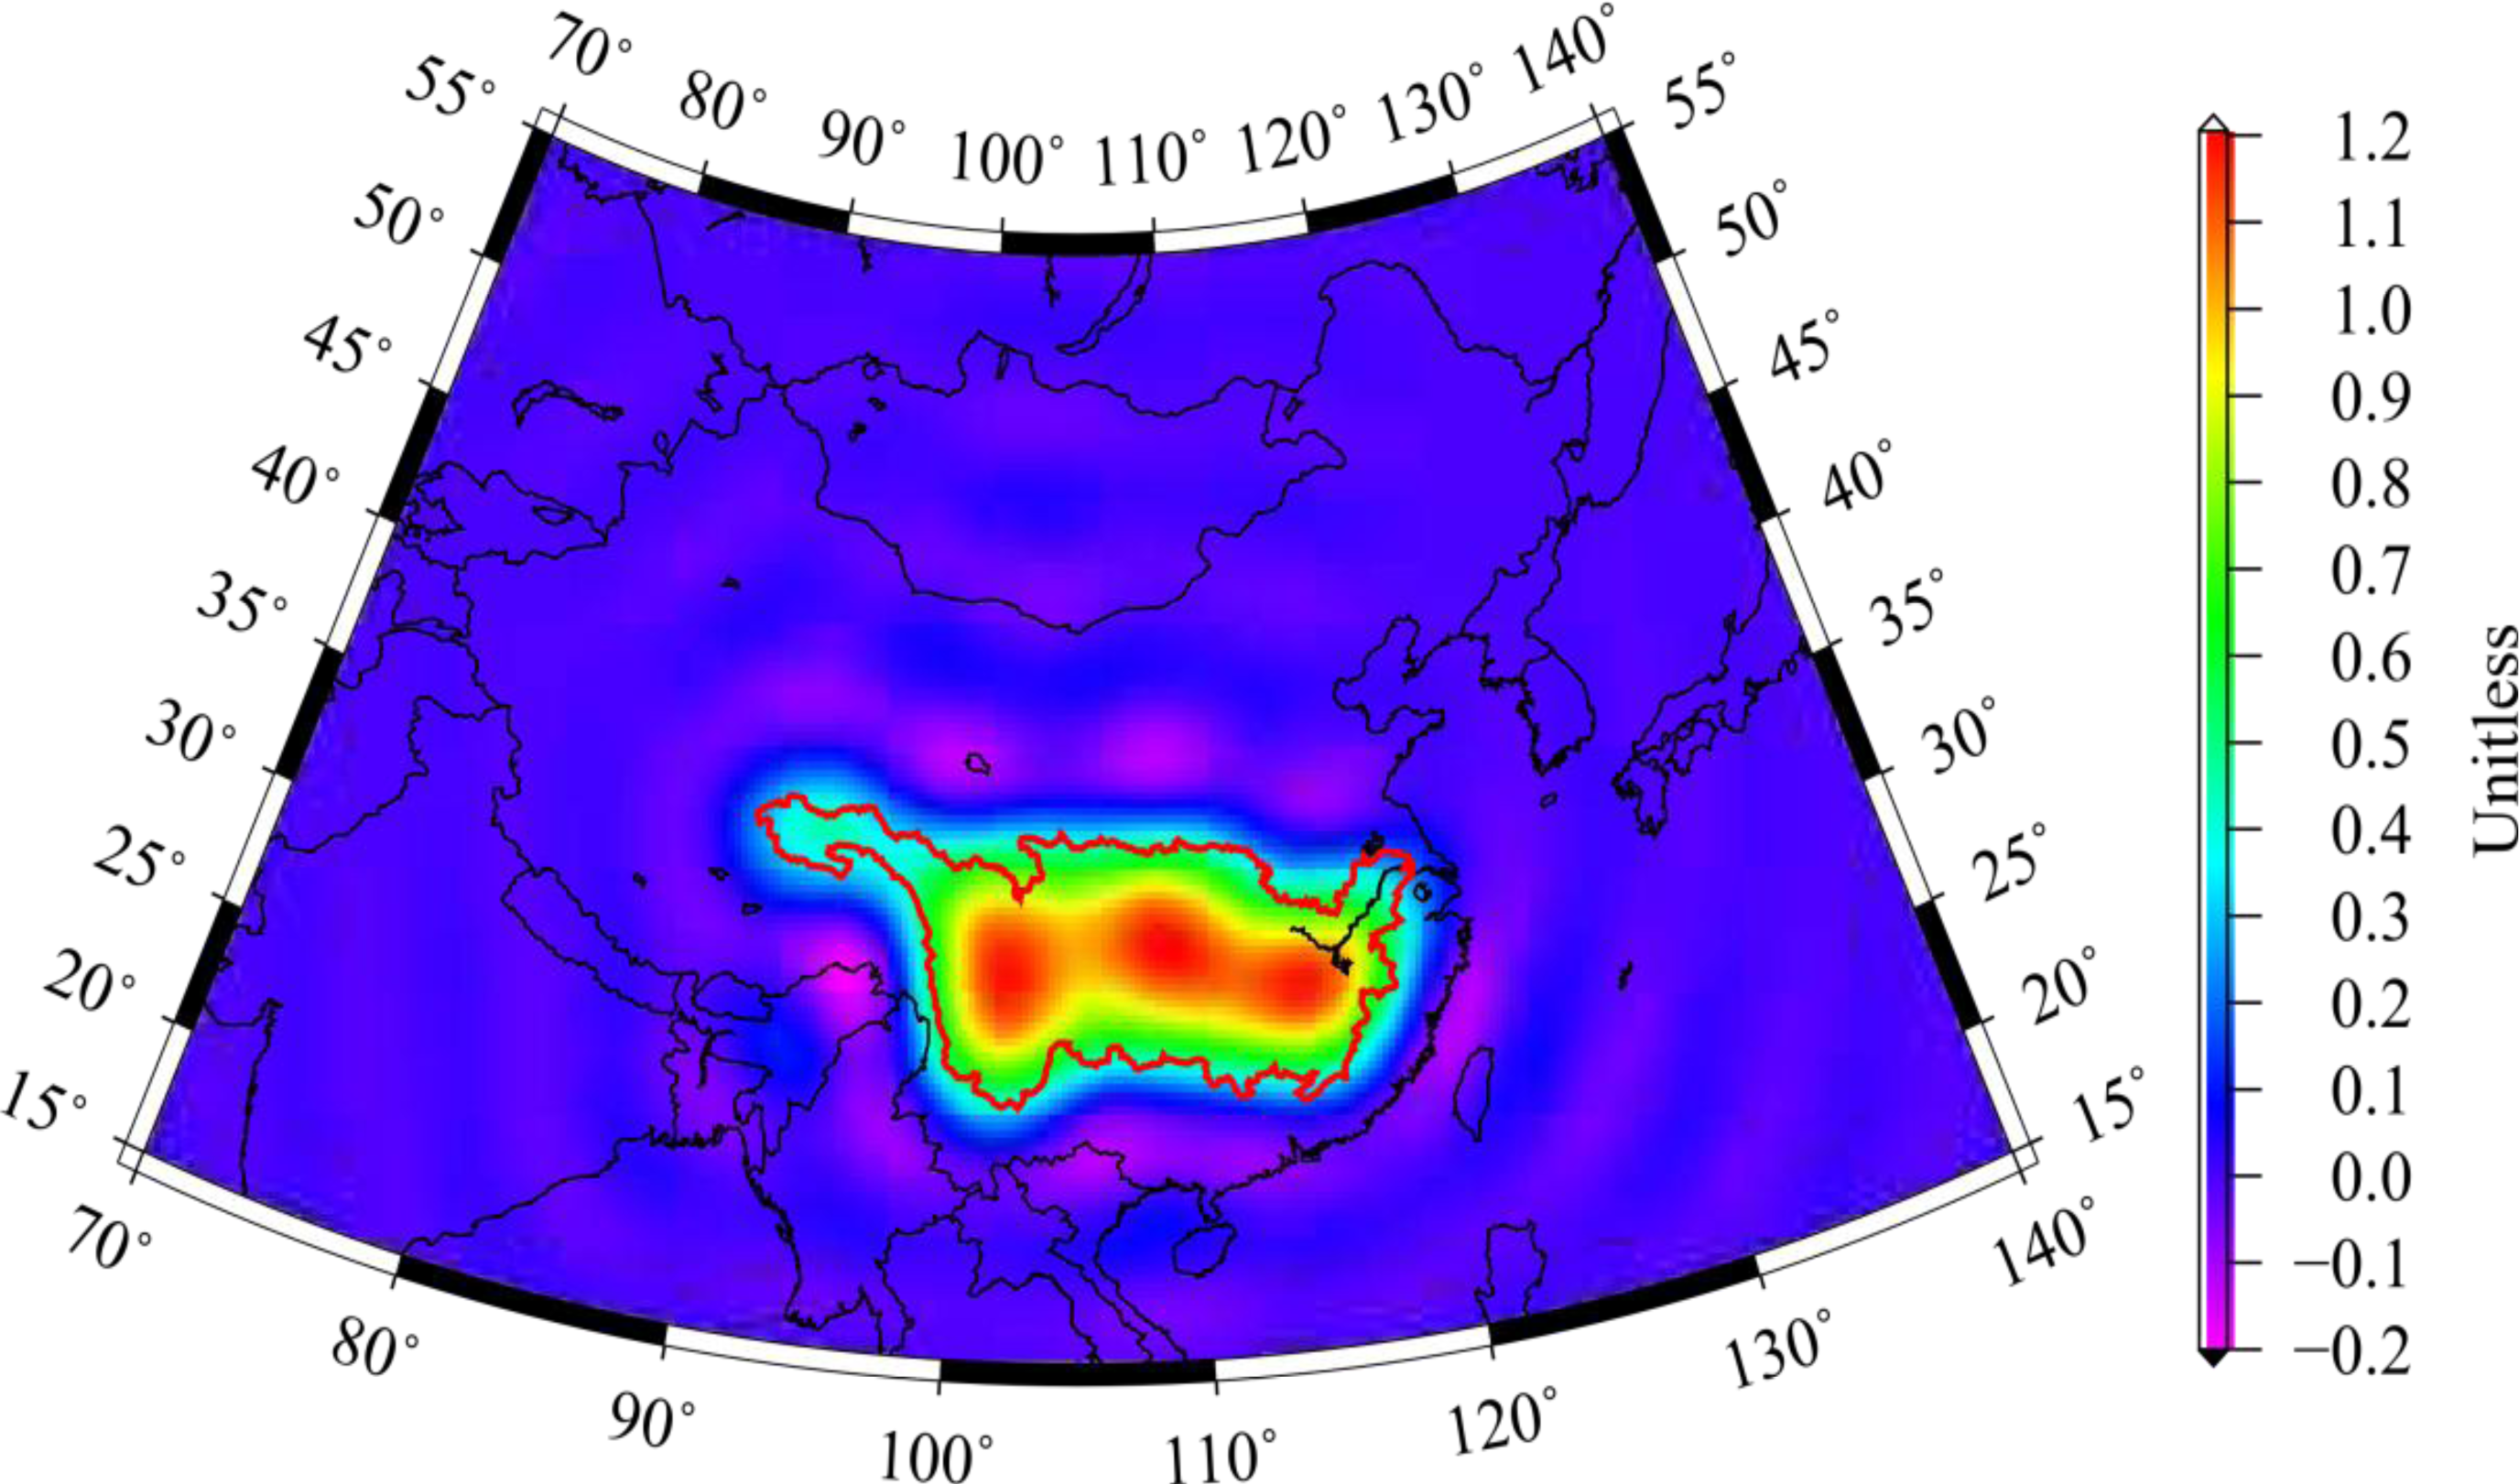
2.2.1. Computation of Water-Storage Variations from GRACE

The sets of coefficients from JPL and GFZ were truncated at d/o 60 to ensure compatibility with the ones from CSR. This limit fixes the spatial resolution ρ at approximately 334 km at the equator ( ρ π n R with R = 6,371 km is the radius of the Earth and n is the degree). Each monthly Stokes’s coefficients data set was reduced by the individual long-term mean (the difference between coefficients of a month t and the mean gravity field obtained as the time average of the available coefficients). Thus, only the time-variable component of the change in surface mass can be recovered (for details see [35]). The GRACE-based land water solution, computed with the methodology described in Wahr et al. [35], provides the water-storage anomaly values δS (i.e., deviations from a reference value), usually expressed in terms of equivalent water height (or equivalent water thickness).
GRACE gravity fields at high order coefficients exhibit a high level of noise which is known as “stripes” in the spatial domain [36,37]. Therefore, in order to obtain coherent results, it is necessary to remove these stripes in post-processing by reducing correlated errors with minimal impact on the real signal. These correlations can be reduced, using either an empirical method based on a polynomial fit [38], or an a priori synthetic model of the observation geometry [39]. In this study, the polynomial fit scheme filter suggested by Chen et al. [40] was applied to the residual Stokes coefficients. For residual Stokes’ coefficients with orders 6 and above, a least squares fit of degree 4 polynomial was removed from the even and odd degree coefficient pairs [41]. In Chen et al. [41], they call this procedure the de-correlation filter; hereafter, abbreviated as P4M6. After P4M6 filtering, a 300-km Gaussian low-pass filter was applied to further suppress the remaining short-wavelength errors [38].
A regional average of the water-storage anomalies was computed by defining a mask with a perimeter shown by the solid red line in Figure 2 of [42]. Following Klees et al. [43], the spatial smoothing reduces the noise and also introduces a bias in the estimated monthly mean water-storage. In order to reduce this, we applied a scale factor, k, of 1.0442 required to restore the amplitudes for the Yangtze basin. We used the methodology from Landerer and Swenson (cf. Section 4.1 of [44]) to estimate the scale factor k. The water-storage estimates from Noah driven GLDAS were first converted to spherical harmonic coefficients and truncated up to d/o 60. These spherical harmonic coefficients were then used to estimate the regional water-storage by using the mask in Figure 2 and the two step filtering scheme (i.e., P4M6 and Gaussian 300-km). The scale factor was then obtained through a least squares minimization as [44]:
v = i = 1 84 ( δ S i u k δ S i f ) 2
where δSu and δSf is the unfiltered (true) and filtered, respectively, water-storage time series from January 2003 to December 2009 (84 months). It is important to note that the scale factor does not match the GRACE-derived water-storage to those of GLDAS; it only gives the relative signal attenuation and restores the signal to its “original” form. Thus, when working with other gridded datasets, one only needs to scale the GRACE signals with the gain factor for consistent comparisons [44].

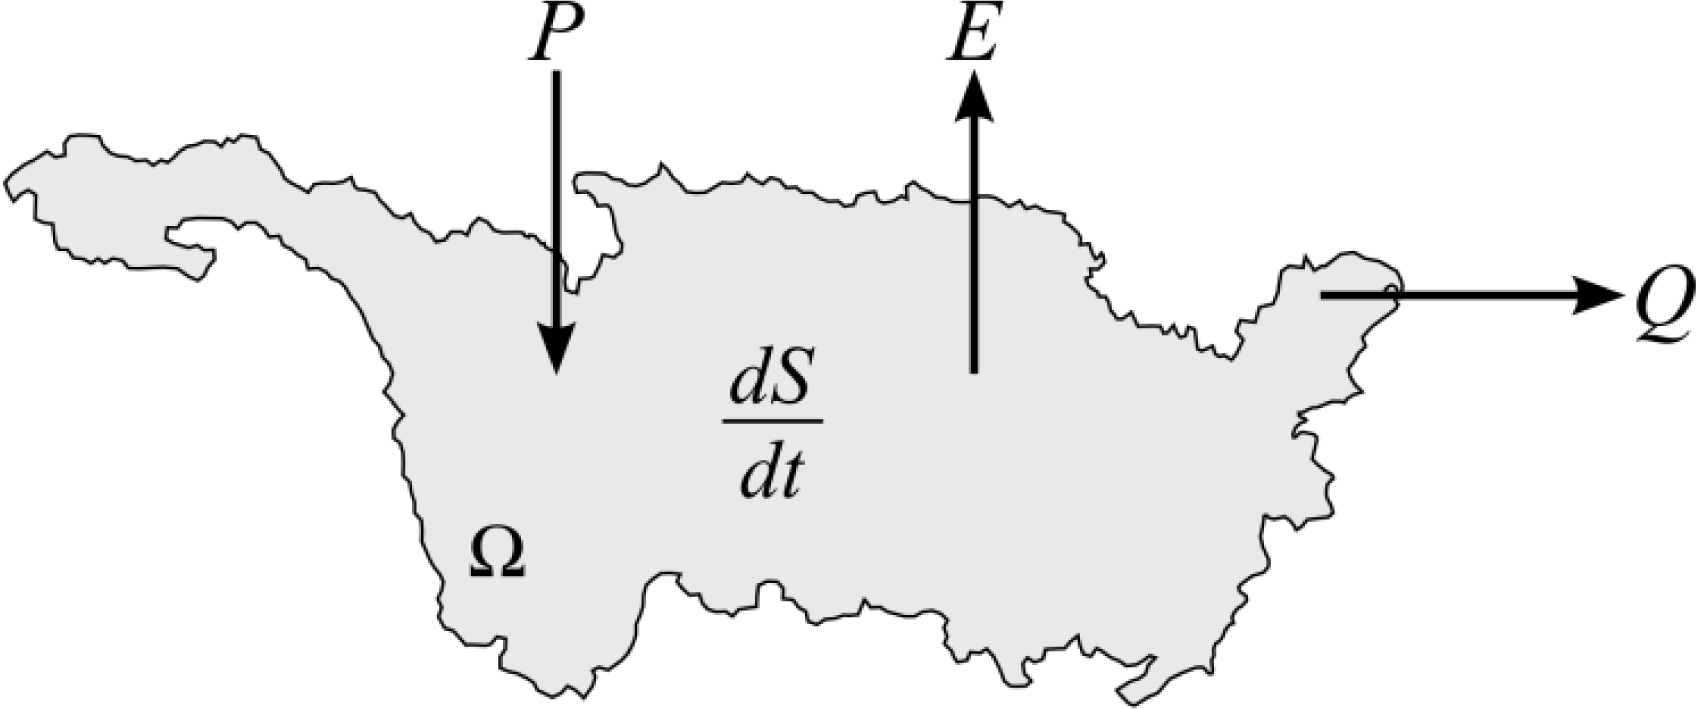
2.2.2. Computation of Total Discharge using Terrestrial Water Budget

Water budget methods are based on the principle of conservation of mass, applied to some part of the hydrologic cycle. Figure 3 shows a simplified diagram to represent the water cycle where only the land surface is considered. Over a land surface of area Ω (cf. Figure 3), the mean evaporation rate, E, can be expressed in terms of the water balance equation as follows [45]:
E = P + [ ( Q ri + Q gi ) ( Q ro + Q go ) ] d S d t
where P is the areal mean rate of precipitation; Qri is the total surface inflow, Qro is the total surface outflow, Qgi is the total groundwater inflow, and Qgo is the total groundwater outflow rates, all per unit area; and S is the water volume stored per unit area. If the area Ω s a natural river basin, bounded by natural divides, the outflow terms (Qro and Qgo) are generally larger than inflow terms (Qri and Qgi). Thus, Q = (Qro + Qgo) – (Qri + Qgi) represents the total basin discharge. Generally, these hydrological variables are expressed in terms of water mass (mm of equivalent water height) or pressure (kg/m2) per day.
Equation (2) can be solved directly for Q as:
Q = P E Δ S
where the variables in Equation (3) are the monthly values of total discharge, precipitation, evaporation, and
Δ S = S ( t 2 ) S ( t 1 )
is the water-storage variation between times t1 and t2 (in which the subscripts 1 and 2 refer to the beginning and the end of the month). Note that here, ΔS in Equation (3) is the derivative called “water-storage changes”. With regard to the total discharge estimated using the GRACE-derived water-storage changes over Yangtze basin, it is important to mention that this value includes the total surface inflows and outflows, total groundwater inflows and outflows, as well as tidal inflows and outflows [23].
Given that the difference between S and δS is a constant value (mean of the study period), the following equation can be derived from numerical differentiation using the center difference (two-sided difference):
Δ S i 1 2 ( δ S i + 1 δ S i 1 )
where ΔSi is the approximation of the water mass variations of month i necessary in Equation (3) for estimates of the total basin discharge Q. As mentioned in Section 2.1.4, the RL05 of L2 products (Stokes’s coefficients) are missing for 2002. To calculate the water-storage change (ΔS) for January 2003, the water-storage anomaly (δS) of December 2002 is necessary. Thus, the water-storage changes were calculated during the period February 2003 to December 2009. This time span was adopted because the two records (GRACE and observed streamflow) overlap for the period January 2003 to December 2009. Monthly water-storage anomalies for the missing period of June 2003 were interpolated based on values corresponding both to the previous and following months [36].
Furthermore, as reported by Syed et al. [23], the difficulty in the direct application of Equation (3) is the high uncertainty of E (evaporation). To estimate evaporation over the Yangtze basin we used the four versions of GLDAS (Section 2.1.3). As in Xue et al. [46], we assessed the relative quality of the GLDAS-estimated evaporation by using a proxy of E from water balance method. Several authors (e.g., [36,47,48]) have used evaporation predicted by the GLDAS to validate results derived from a combined approach of using GRACE and other data sets. In Rodell et al. [47], an RMSE of 0.83 mm/day (∼24.9 mm/month) was found over the Mississippi River basin; in Ramillien et al. [36], 0.53 mm/day (∼15.9 mm/month) was determined over the Yangtze basin; and Cesanelli and Guarracino [48] found 0.83 mm/day (∼24.9 mm/month) over the Salado basin in Argentina. Typically, they reach values of approximately 28.8 mm/month, which seems to be the current level of accuracy of GRACE solutions in terms of the water-storage changes for large river basins. For comparison with the GRACE-derived water-storage changes, TRMM precipitation data and the four versions (CLM, Mosaic, Noah and VIC) of GLDAS-estimated evaporation were used. In this regard, we did not apply a filter scheme as for GRACE because the water-storage anomalies were rescaled (cf. sub-Section 2.2.1).

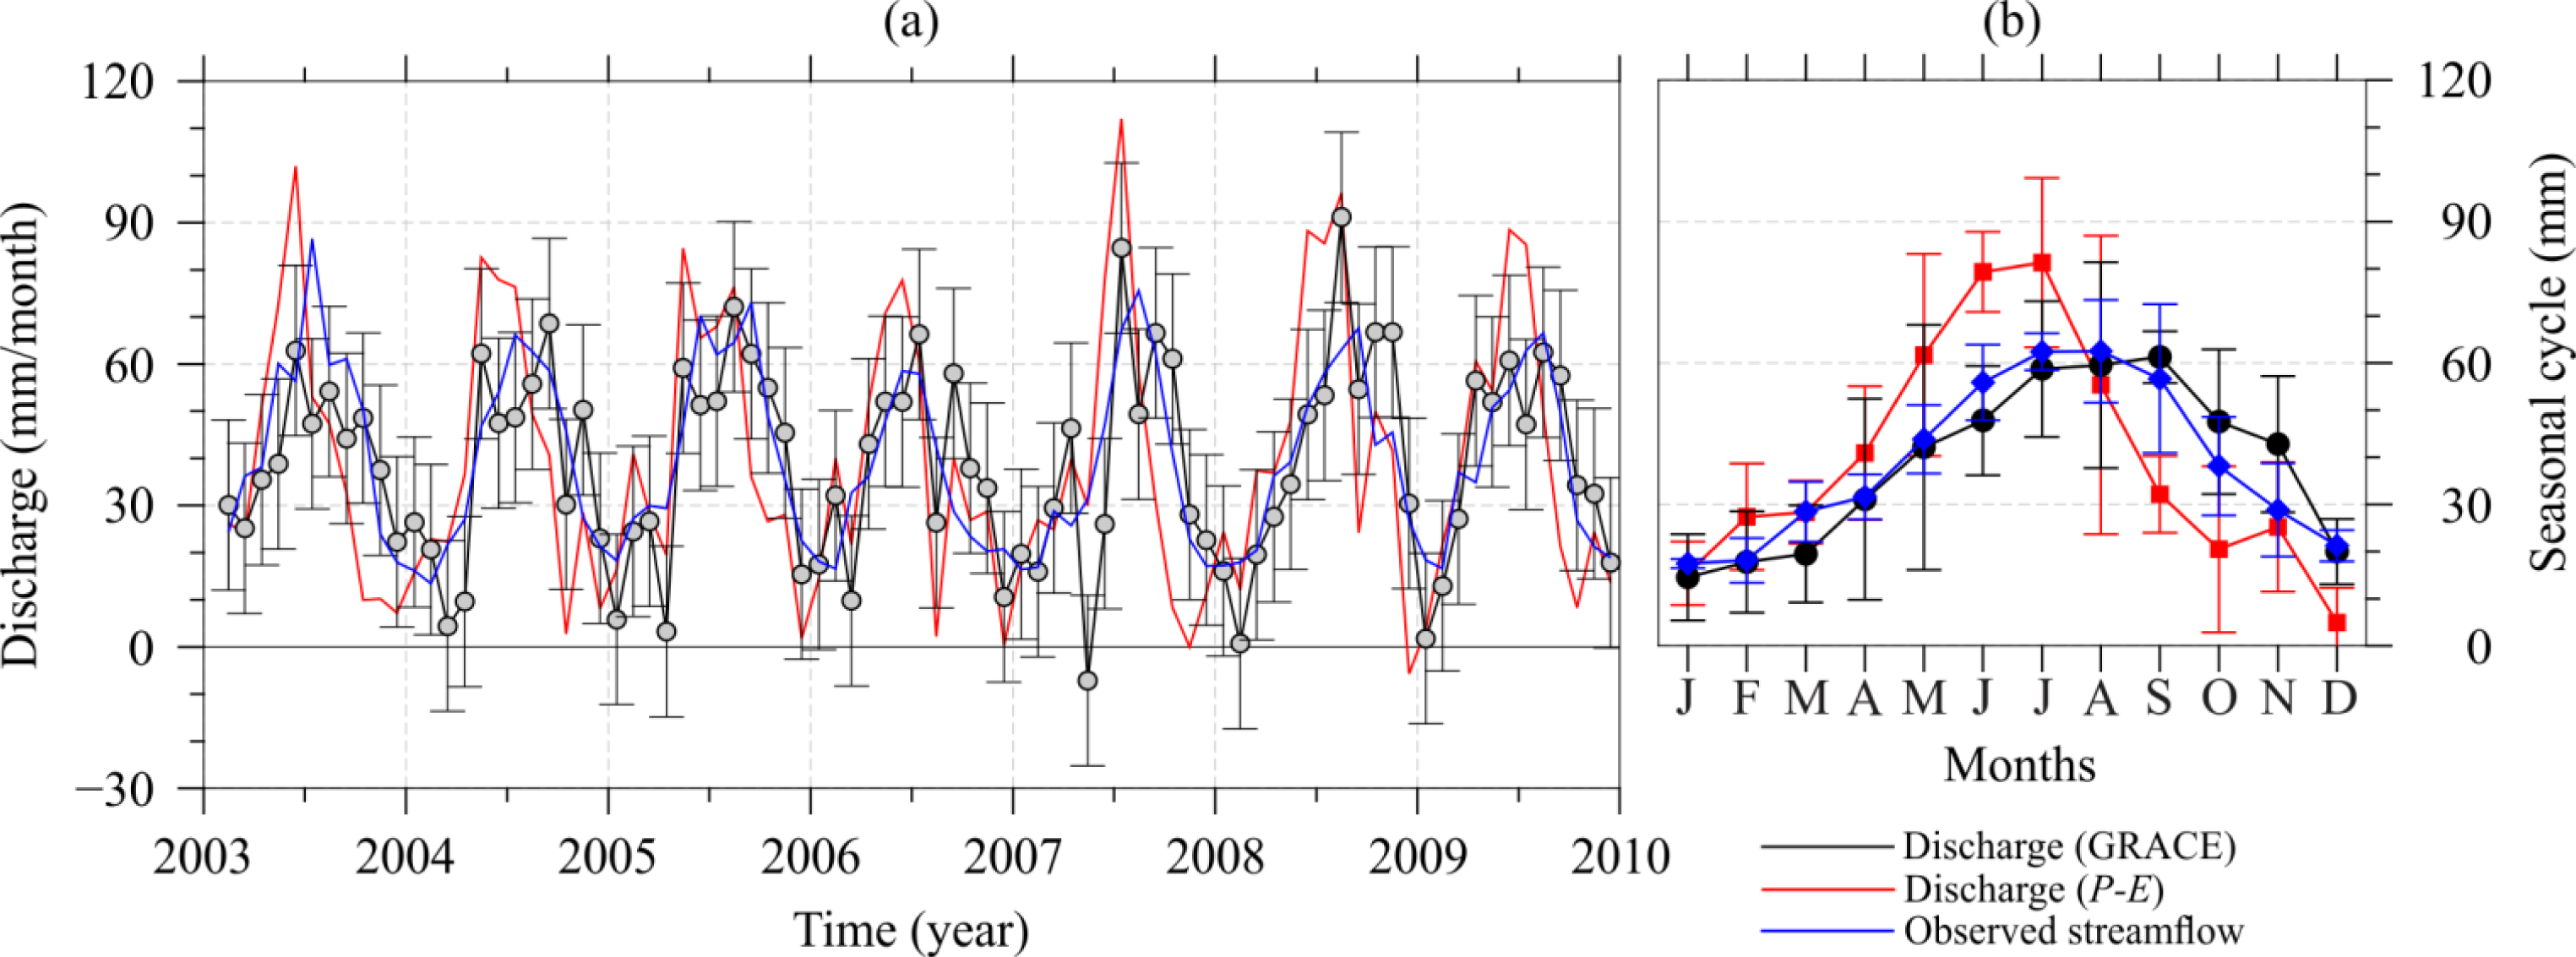
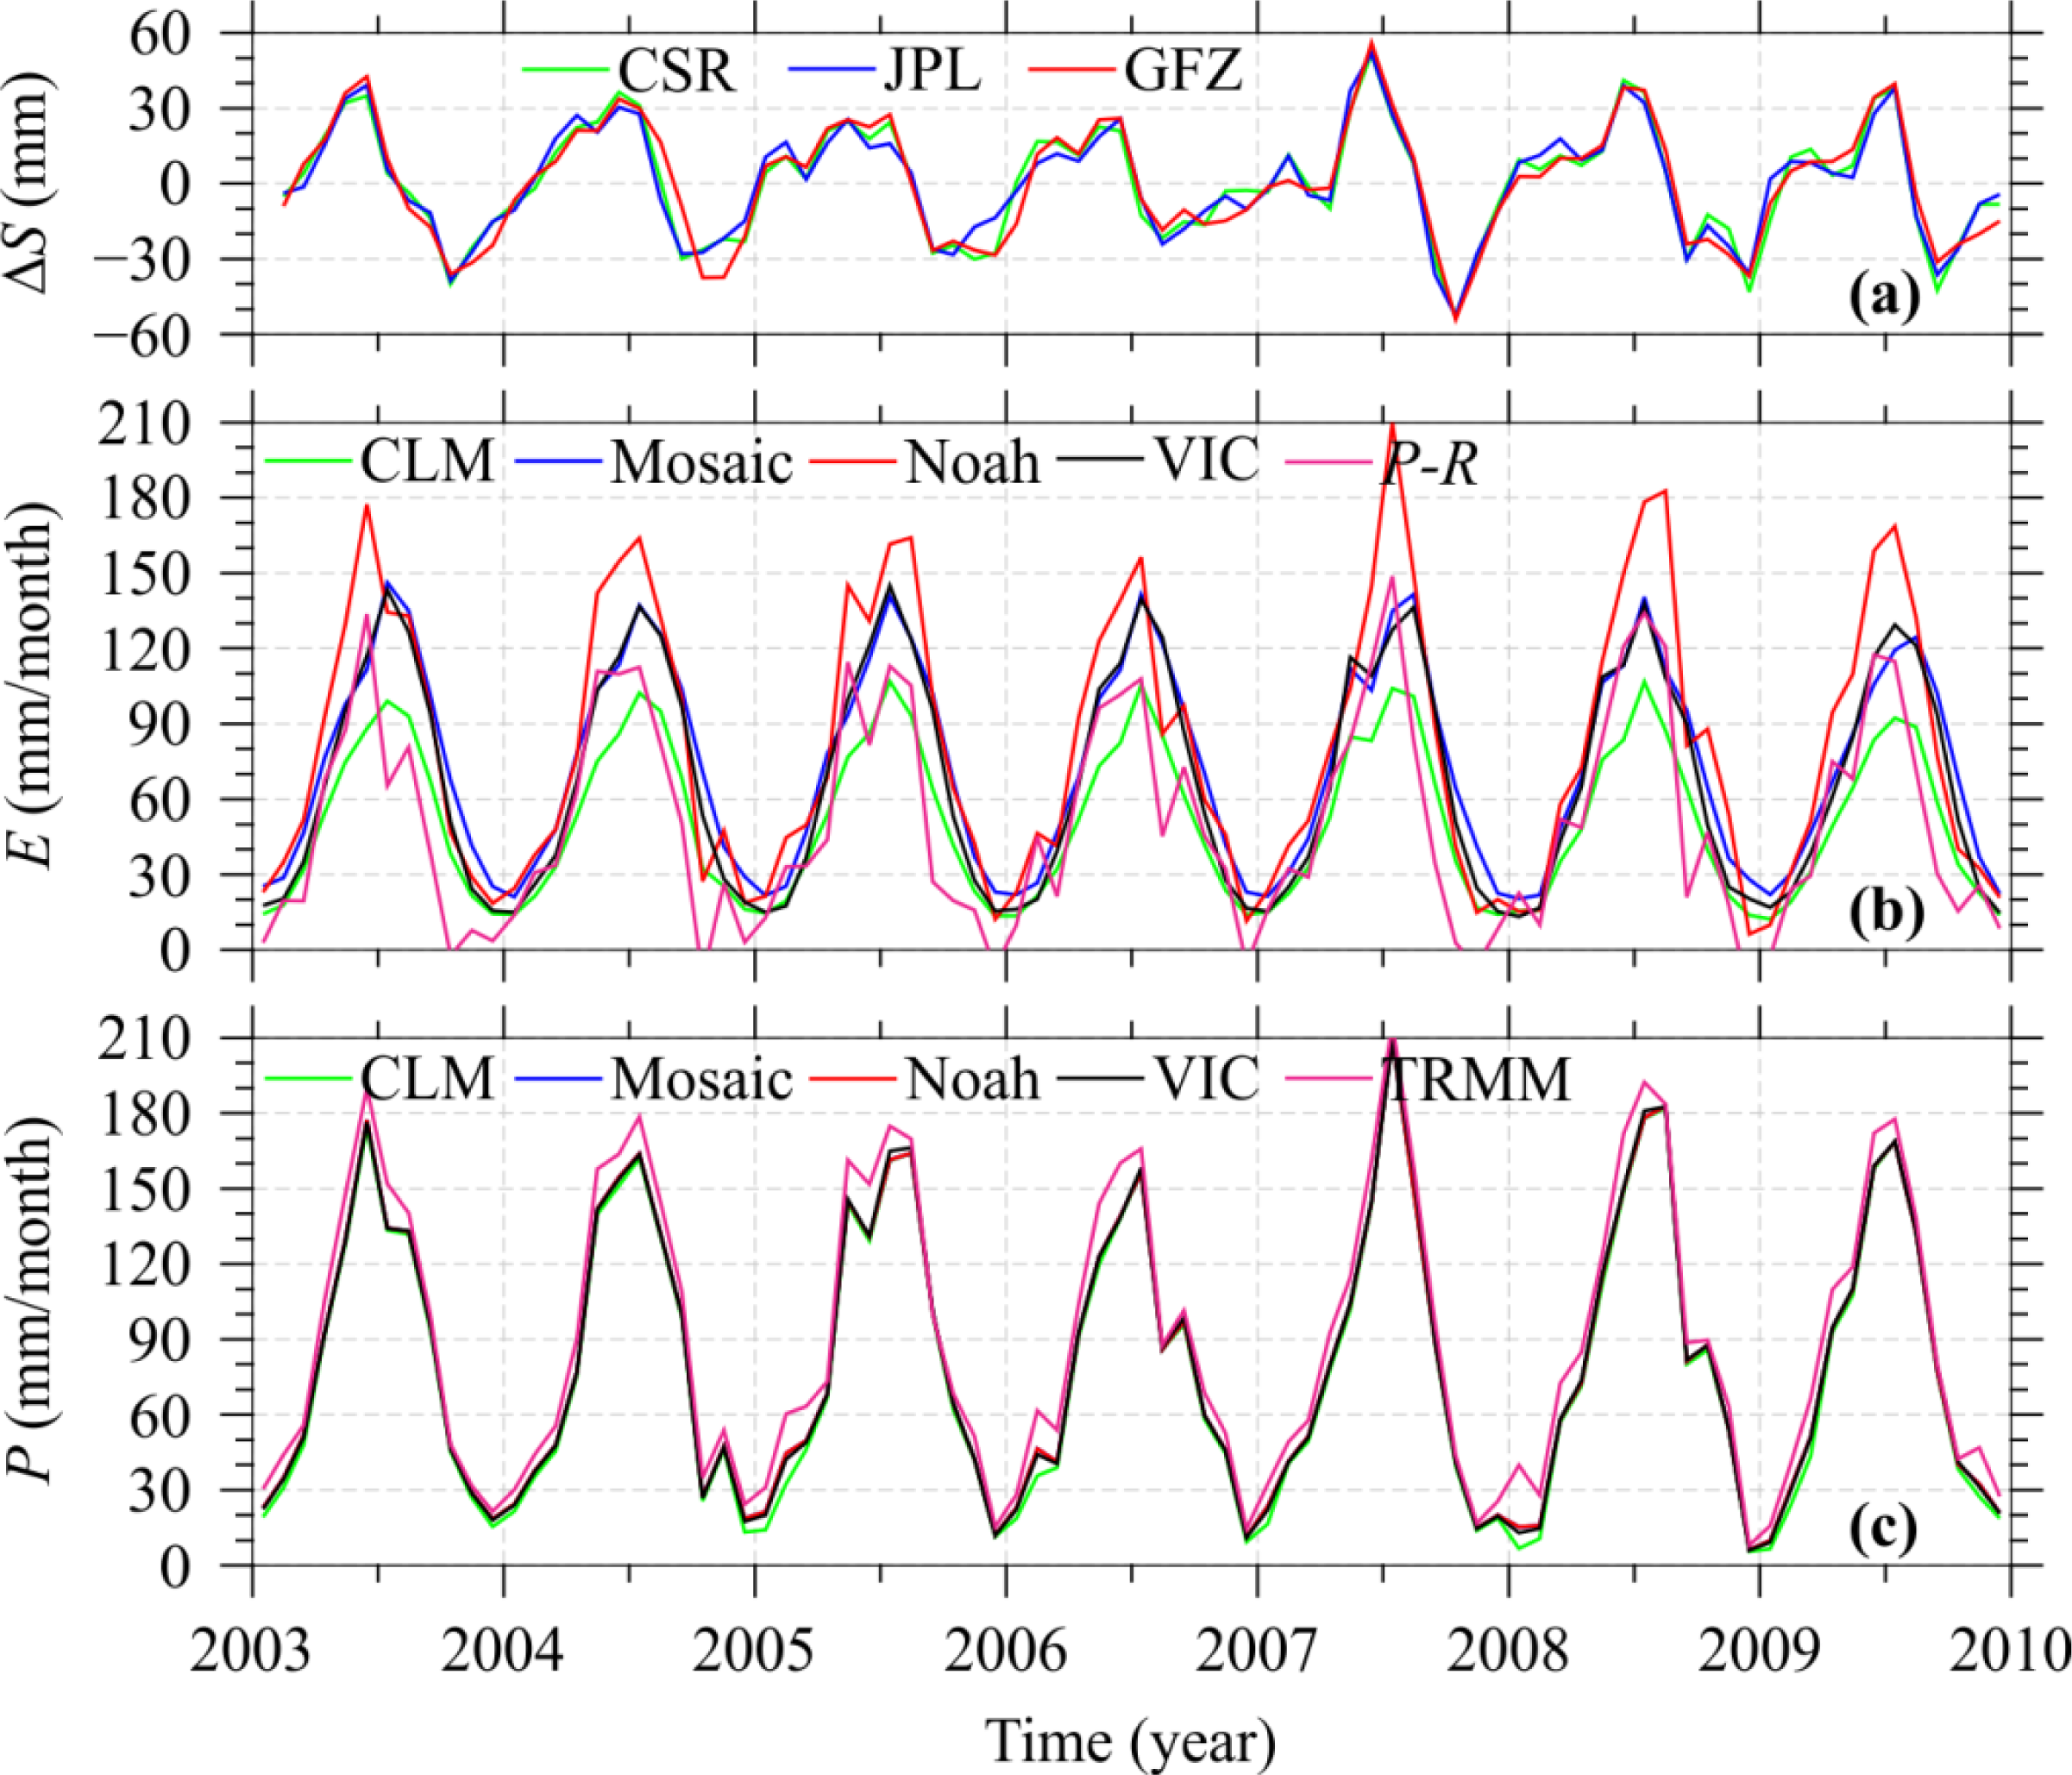
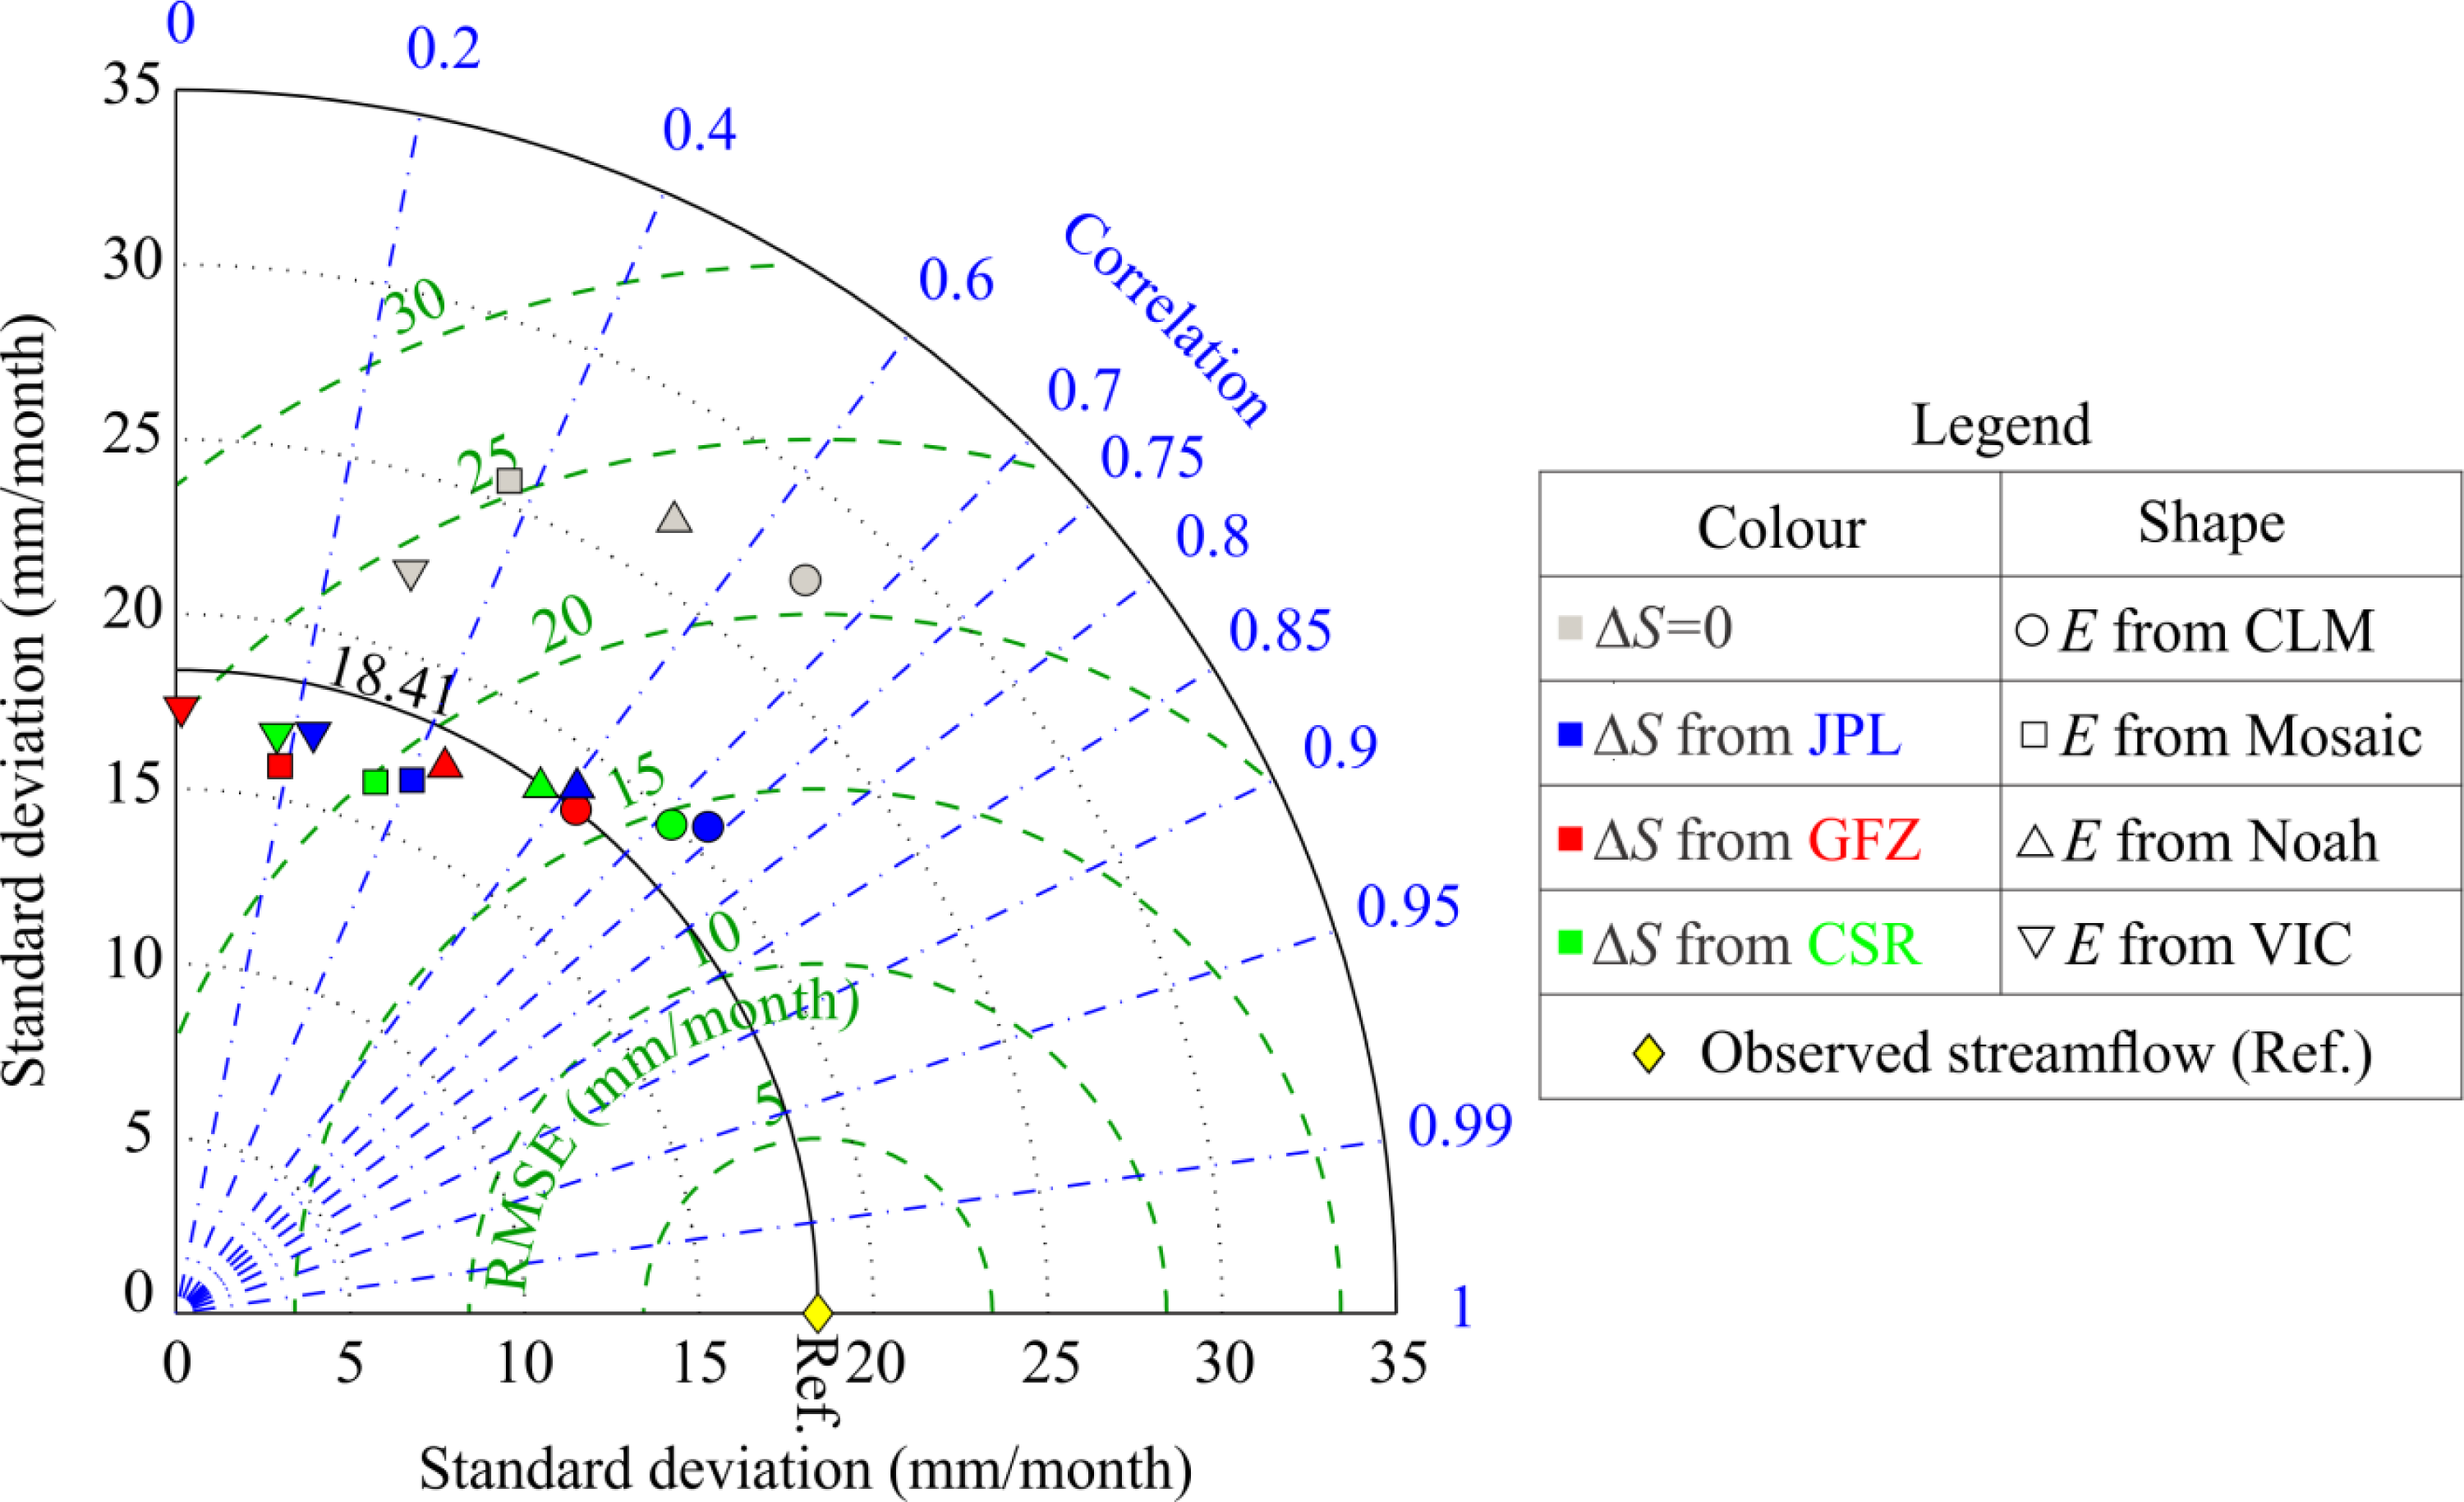
3. Results and Discussion

Overall, the results presented in Figure 4a show that the GRACE-derived water-storage changes by using the RL05 of L2 products (i.e., spherical harmonic coefficients) from the three different processing centers (i.e., CSR, GFZ and JPL) are in good agreement. Even without replacing the GFZ-estimated C20 by those derived from SLR (cf. [11]). We performed a cross-correlation between the three time series of water-storage changes. We found a correlation coefficient of 0.96 between CSR and GFZ, 0.98 between CSR and JPL, and 0.95 between GFZ and JPL, which are significant at the 95% confidence level. All GRACE solutions show comparable root mean square (RMS) signals between 22.32 mm (CSR), 23.04 mm (GFZ) and 21.57 mm (JPL). The four evaporation products (Figure 4b) show similar seasonal behavior over the Yangtze basin over the period of study (January 2003 to December 2009). However, a relative comparison in terms of the amplitude between CLM-estimated evaporation and the other three models (Mosaic, Noah and VIC) shows that CLM has the lowest value. We decided to check this by using the proxy of evaporation from water balance method considering E ≈ PR, i.e., ΔS = 0, where R is the observed streamflow. We found that the Mosaic, VIC and Noah estimated evaporation have the worst results in terms of bias (22.54, 16.81 and 12.90 mm/month, respectively) and RMSE (33.85, 29.37 and 26.29 mm/month, respectively). Thus, it seems that the CLM-estimated evaporation has the best performance for the basin with a bias of 0.55 mm/month and an RMSE of 20.89 mm/month.
In [46], Xue et al. pointed out that the uncertainties in the evaporation products come from various sources such as meteorological and surface cover data as well as the algorithm used. Details of these forcing data are provided in [27]. Here, we investigated the time series of the forcing data in terms of precipitation over Yangtze basin. The Figure 4c shows that the CLM, Mosaic, Noah and VIC estimated precipitation all have similar fluctuations among them, but slight differences to those of TRMM. There are negative biases for all four versions of GLDAS precipitation products, for CLM it is −11.64 mm/month, for both Mosaic and Noah it is approximately −9.32 mm/month, and for VIC it is −9.36 mm/month. It seems that the GLDAS precipitation has a dry bias over Yangtze basin; this will need to be investigated as well as the systematic error from other input variables in GLDAS (e.g., downward shortwave radiation forcing).
The Taylor diagram [49] (Figure 5) presents the results of statistical comparisons between the observed streamflow (Ref.) and: GRACE-estimated discharge by using different process centers (CSR, GFZ and JPL) combined with evaporation predicted from four versions of GLDAS (CLM, Mosaic, Noah and VIC); by considering the water-storage changes equal a zero (ΔS = 0, i.e., QPE). In general, the RMSE between GRACE-based discharge and observed streamflow are less than 25 mm/month (∼0.83 mm/day). The lowest RMSEs are found with JPL, CSR and GFZ by combing evaporation predicted from CLM which are approximately 14.30, 14.62 and 16.02 mm/month with correlation coefficients of 0.74, 0.71 and 0.62, respectively. Additionally, the residuals between observed streamflow and derived discharge by considering water-storage changes equal a zero provide RMSEs of 20.98, 33.96, 26.36, and 29.51 for CLM, Mosaic, Noah and VIC, respectively. For some reasons, not explored in this study, CLM-estimated evaporation delivers the best results over Yangtze basin. The overall agreement between the observed streamflow and estimated discharge is better than that of PE. An improvement of approximately 32% between the best estimation by using GRACE (i.e., JPL/CLM) and the best estimation by using PE is noted in terms of RMSE. This means that GRACE-derived water-storage changes seem to play an important role in the water balance at a seasonal time scales. The annual accumulated ΔS between 2004 and 2009 reveals that the largest value was 27.98 mm in 2008 and the smallest was 3.86 mm in 2009 which is equivalent to approximately 5% and 1% of the annual accumulated PE, respectively.
Because the results using coefficients from CSR, GFZ, and JPL are statistically identical over Yangtze basin, for the remainder of this study we utilized only the total discharge estimated by JPL/CLM. The same holds for CLM-estimated evaporation due to its good performance in terms of the bias and RMSE. Overall, the results presented in Figure 6a show that the estimated total basin discharge (black line) and observed streamflow (blue line) are in consensus for the Yangtze basin. These results for the Yangtze basin are comparable to that of Syed et al. in [25], who applied a different methodology and data sets (atmospheric moisture storage and divergence from two available global reanalysis products (National Centers for Environmental Protection and National Center for Atmospheric Research NCEP–NCAR). Their results for the total discharge derived from GRACE–NCEP–NCAR for the Yangtze basin (see Figure 2 of Syed et al. [25]) indicate seasonal cycles with magnitudes of approximately 119 km3 (∼66 mm considering the Yangtze basin’s area equal 1.8 × 10⁶ km2) peak-to-peak with a correlation coefficient of 0.92. As such, our results show that this range is not consistent with the total variation in the estimated total basin discharge time series (∼47 mm) in Figure 6b and similarly, we found a correlation coefficient of 0.93. The difference between both results (∼19 mm) could be associated with a difference in the methods of GRACE data processing (e.g., RL03 vs. RL05), coupled land-atmosphere water mass balance (here we used only land), the duration of the study periods, and the size of the study area. Additionally, Syed et al. [24] mentioned that the error in atmospheric moisture flux from reanalysis affects the accuracy of the estimated total discharge. For comparison, Figure 6b also shows that the variability of the estimated discharges using PE (red line) and the observed streamflow are in weak agreement in terms of the amplitude and phase within the Yangtze basin.
The variability of the estimated discharge by using PE (red line in Figure 6a) often exceeds that shown by the observed streamflow. In contrast, the annual cycles of the GRACE-derived discharge can in part explain the majority of the discrepancies in terms of the amplitude and phase. For the Yangtze basin, the inclusion of GRACE-estimated water-storage changes leads to a better representation of the discharge. The magnitude of the annual amplitude for PE discharge is 32.0 mm/month, whereas is it only 23.4 mm/month for the observed streamflow and 22.0 mm/month for the GRACE-derived results (Table 1). Additionally, estimated low flows are similar for GRACE-based discharge and those from PE, however, lower than observed streamflow (Figure 6a). The phase shift between the time series (Figure 6) can be verified in Table 1 at both annual and semi-annual time scales. For the case of GRACE-estimated discharge and observed streamflow this phase difference is approximately 0.51 ± 0.22 months (generally, observed streamflow precedes the GRACE-estimated discharge). We observed a time lag between precipitation and observed streamflow of approximately 0.8 ± 0.12 months. We also performed a comparison with the PE estimated discharges where a phase lag between the observed streamflow and predicted discharge is approximately −1.11 ±0.18 months (generally, the observed streamflow lags that predicted by PE).
The results from this study are comparable with previous GRACE-based study on discharge [23,25], the noted inconsistencies are perhaps explained by the fundamental differences between the two methodologies and data sets. The Yangtze basin was chosen as the study region owing to the availability of the observed streamflow data. However, it is worth mentioning that the discharge of a river (streamflow) is a hydrological flux that represents the spatially integrated upstream hydrological process [50]. As such, the evaluation of the GRACE-estimated discharge would be more realistic if the estimated discharge is properly routed through the river basin as, e.g., in Zaitchik et al. [50]. This is one limitation of our study; we thus plan to repeat the validation in future work by using, e.g., the source-to-sink routing scheme [50]. Furthermore, the runoff originating downstream of the Datong gauging station is unmeasured, but as the comparisons were made in mm/month, the error which we can made due to the different river basins is reduced. Overall, the results are encouraging and show that the method could be applied to any large drainage basins.

4. Conclusions

We assessed the total discharge of the Yangtze basin on a monthly time scale from February 2003 to December 2009 by using the terrestrial water budget approach. This method uses water-storage changes derived from the Gravity Recovery and Climate Experiment (GRACE) measurements; precipitation measured by, e.g., the Tropical Rainfall Measurement Mission (TRMM); and evaporation, e.g., simulated by the Global Land Data Assimilation System (GLDAS). We found that the estimated discharge of the Yangtze basin was correlated well with the observed streamflow (0.74) and showed an RMSE of 14.30 mm/month (∼0.48 mm/day) (by using the GRACE-JPL derived water-storage changes and GLDAS-CLM simulated evaporation). The GRACE-derived results showed that the inclusion of water-storage changes improved the results against precipitation minus evaporation (QPE) in approximately 32% in terms of the RMSE. This means that the water-storage changes, as derived from GRACE’s measurements, play a crucial role in estimate discharge. In light of these findings, we believe that our results will help Hydrologists and Oceanographers improve their understanding of the energy cycle between the Yangtze River and the East China Sea. Future work will entail refining our results by exploiting accurate evaporation data and the evaluation of the estimated discharge by properly routed through the Yangtze River basin.

Acknowledgments

Vagner G. Ferreira acknowledges the support of grant 2012B01314 from the Hohai University. Zheng Gong acknowledges the State Key Development Program of Basic Research of China (2010CB429001), the Program for New Century Excellent Talents in University (Grant No. NCET-12-0841), and the National Natural Science Foundation of China (Grant No. 51009062 and Grant No. 51179067). We also thank the satellite teams from the TRMM mission, the science teams from the GRACE processing centers (CSR, JPL, GFZ) for providing the monthly gravity fields. The GLDAS data used in this study were acquired as part of the mission of NASA’s Earth Science Division and were archived and distributed by the Goddard Earth Sciences (GES) Data and Information Services Center (DISC). The work of these engineers and scientists is the basis for our investigations. The spherical harmonic expansions of the GLDAS and the mask function in Figure 2 were performed by using the FORTRAN code dragon. We would also like to thank the six anonymous reviewers and the associated editor for their helpful comments in enhancing the first submission of this manuscript.

Conflict of Interest

The author declares no conflict of interest.

References

  1. Cazenave, A.; Chen, J. Time-variable gravity from space and present-day mass redistribution in the Earth system. Earth Planet. Sci. Lett 2010, 298, 263–274. [Google Scholar]
  2. Chen, J.L.; Wilson, C.R.; Tapley, B.D.; Yang, Z.L.; Niu, G.Y. 2005 drought event in the Amazon River basin as measured by GRACE and estimated by climate models. J. Geophys. Res 2009, 114, B05404. [Google Scholar]
  3. Frappart, F.; Ramillien, G.; Ronchail, J. Changes in terrestrial water storage versus rainfall and discharges in the Amazon basin. Int. J. Climatol. 2013. [Google Scholar] [CrossRef] [Green Version]
  4. Pokhrel, Y.N.; Fan, Y.; Miguez-Macho, G.; Yeh, P.J.-F.; Han, S.-C. The role of groundwater in the Amazon water cycle: 3. Influence on terrestrial water storage computations and comparison with GRACE. J. Geophys. Res.-Atmos 2013, 118, 3233–3244. [Google Scholar]
  5. Schmidt, R.; Schwintzer, P.; Flechtner, F.; Reigber, C.; Güntner, A.; Döll, P.; Ramillien, G.; Cazenave, A.; Petrovic, S.; Jochmann, H.; et al. GRACE observations of changes in continental water storage. Global Planet. Chang 2006, 50, 112–126. [Google Scholar]
  6. Crowley, J.W.; Mitrovica, J.X.; Bailey, R.C.; Tamisiea, M.E.; Davis, J.L. Land water storage within the Congo Basin inferred from GRACE satellite gravity data. Geophys. Res. Lett 2006, 33, L19402. [Google Scholar]
  7. Syed, T.H.; Famiglietti, J.S.; Rodell, M.; Chen, J.; Wilson, C.R. Analysis of terrestrial water storage changes from GRACE and GLDAS. Water Resour. Res 2008, 44, W02433. [Google Scholar]
  8. Hu, X.; Chen, J.; Zhou, Y.; Huang, C.; Liao, X. Seasonal water storage change of the Yangtze River basin detected by GRACE. Sci. China Ser. D 2006, 49, 483–491. [Google Scholar]
  9. Rodell, M.; Velicogna, I.; Famiglietti, J.S. Satellite-based estimates of groundwater depletion in India. Nature 2009, 460, 999–1002. [Google Scholar]
  10. Jacob, T.; Wahr, J.; Pfeffer, W.T.; Swenson, S. Recent contributions of glaciers and ice caps to sea level rise. Nature 2012, 482, 514–518. [Google Scholar]
  11. Chen, J.L.; Wilson, C.R.; Tapley, B.D. Contribution of ice sheet and mountain glacier melt to recent sea level rise. Nat. Geosci 2013, 6, 549–552. [Google Scholar]
  12. Velicogna, I. Increasing rates of ice mass loss from the Greenland and Antarctic ice sheets revealed by GRACE. Geophys. Res. Lett 2009, 36, L19503. [Google Scholar]
  13. Luthcke, S.B.; Zwally, H.J.; Abdalati, W.; Rowlands, D.D.; Ray, R.D.; Nerem, R.S.; Lemoine, F.G.; McCarthy, J.J.; Chinn, D.S. Recent Greenland ice mass loss by drainage system from satellite gravity observations. Science 2006, 314, 1286–1289. [Google Scholar]
  14. Chen, J.L.; Wilson, C.R.; Tapley, B.D. Interannual variability of Greenland ice losses from satellite gravimetry. J. Geophysi. Res 2011, 116, B07406. [Google Scholar]
  15. Bergmann, I.; Ramillien, G.; Frappart, F. Climate-driven interannual ice mass evolution in Greenland. Global Planet. Chang. 2012, 82–83, 1–11. [Google Scholar]
  16. Muskett, R.R.; Romanovsky, V.E. Alaskan permafrost groundwater storage changes derived from GRACE and ground measurements. Remote Sens 2011, 3, 378–397. [Google Scholar]
  17. Wang, W.; Xing, W.; Yang, T.; Shao, Q.; Peng, S.; Yu, Z.; Yong, B. Characterizing the changing behaviours of precipitation concentration in the Yangtze River Basin, China. Hydrol. Process. 2012. [Google Scholar] [CrossRef]
  18. Wang, H.-S.; Wang, Z.-Y.; Yuan, X.-D.; Wu, P.; Rangelova, E. Water storage changes in Three Gorges water systems area inferred from GRACE time-variable gravity data. Chin. J. Geophys 2007, 50, 650–657. [Google Scholar]
  19. Zhao, Q.-L.; Liu, X.-L.; Ditmar, P.; Siemes, C.; Revtova, E.; Hashemi-Farahani, H.; Klees, R. Water storage variations of the Yangtze, Yellow, and Zhujiang river basins derived from the DEOS Mass Transport (DMT-1) model. Sci. China Earth Sci 2010, 54, 667–677. [Google Scholar]
  20. Huang, Y.; Salama, M.S.; Krol, M.S.; van der Velde, R.; Hoekstra, A.Y.; Zhou, Y.; Su, Z. Analysis of long-term terrestrial water storage variations in Yangtze River basin. Hydrol. Earth Syst. Sci 2012, 9, 11487–11520. [Google Scholar]
  21. Huang, H.; Song, D.S.; Yun, H.S.; Lee, D.H.; Cho, J.M. Water level change caused from three gorges dam construction in Yangtze River Basin. Proceedings of the 11th International Coastal Symposium, Szczecin, Poland, 9–14 May 2011; pp. 1672–1675.
  22. Wang, X.; de Linage, C.; Famiglietti, J.; Zender, C.S. Gravity Recovery and Climate Experiment (GRACE) detection of water storage changes in the Three Gorges Reservoir of China and comparison with in situ measurements. Water Resour. Res 2011, 47, W12502. [Google Scholar]
  23. Syed, T.H.; Famiglietti, J.S.; Chen, J.; Rodell, M.; Seneviratne, S.I.; Viterbo, P.; Wilson, C.R. Total basin discharge for the Amazon and Mississippi River basins from GRACE and a land-atmosphere water balance. Geophys. Res. Lett 2005, 32, L24404. [Google Scholar]
  24. Syed, T.H.; Famiglietti, J.S.; Zlotnicki, V.; Rodell, M. Contemporary estimates of Pan-Arctic freshwater discharge from GRACE and reanalysis. Geophys. Res. Lett 2007, 34, L19404. [Google Scholar]
  25. Syed, T.H.; Famiglietti, J.S.; Chambers, D.P. GRACE-based estimates of terrestrial freshwater discharge from basin to continental scales. J. Hydromet 2009, 10, 22–40. [Google Scholar]
  26. Seo, K.-W.; Waliser, D.E.; Tian, B.; Famiglietti, J.S.; Syed, T.H. Evaluation of global land-to-ocean fresh water discharge and evapotranspiration using space-based observations. J. Hydrol 2009, 373, 508–515. [Google Scholar]
  27. Rodell, M.; Houser, P.R.; Jambor, U.; Gottschalck, J.; Mitchell, K.; Meng, C.-J.; Arsenault, K.; Cosgrove, B.; Radakovich, J.; Bosilovich, M.; et al. The global land data assimilation system. Bull. Am. Meteorol. Soc 2004, 85, 381–394. [Google Scholar]
  28. Huffman, G.J.; Adler, R.F.; Bolvin, D.T.; Gu, G.; Nelkin, E.J.; Bowman, K.P.; Hong, Y.; Stocker, E.F.; Wolff, D.B. The TRMM Multisatellite Precipitation Analysis (TMPA): Quasi-global, multiyear, combined-sensor precipitation estimates at fine scales. J. Hydrometeorol 2007, 8, 38–55. [Google Scholar]
  29. Koster, R.D.; Suarez, M.J. Modeling the land surface boundary in climate models as a composite of independent vegetation stands. J. Geophys. Res 1992, 97, 2697. [Google Scholar]
  30. Liang, X.; Lettenmaier, D.P.; Wood, E.F.; Burges, S.J. A simple hydrologically based model of land surface water and energy fluxes for general circulation models. J. Geophys. Res 1994, 99, 14415. [Google Scholar]
  31. Ek, M.B. Implementation of Noah land surface model advances in the national centers for environmental prediction operational mesoscale Eta model. J. Geophys. Res 2003, 108, 8851. [Google Scholar]
  32. Klees, R.; Liu, X.; Wittwer, T.; Gunter, B.C.; Revtova, E.A.; Tenzer, R.; Ditmar, P.; Winsemius, H.C.; Savenije, H.H.G. A comparison of global and regional GRACE models for land hydrology. Surv. Geophys 2008, 29, 335–359. [Google Scholar]
  33. Cheng, M.; Tapley, B.D. Variations in the Earth’s oblateness during the past 28 years. J. Geophys. Res 2004, 109, B09402. [Google Scholar]
  34. Swenson, S.; Chambers, D.; Wahr, J. Estimating geocenter variations from a combination of GRACE and ocean model output. J. Geophys. Res 2008, 113, B08410. [Google Scholar]
  35. Wahr, J.; Molenaar, M.; Bryan, F. Time variability of the Earth’s gravity field: Hydrological and oceanic effects and their possible detection using GRACE. J. Geophys. Res 1998, 103, 30205–30229. [Google Scholar]
  36. Ramillien, G.; Frappart, F.; Güntner, A.; Ngo-Duc, T.; Cazenave, A.; Laval, K. Time-variations of the regional evapotranspiration rate from GRACE satellite gravimetry. Water Resour. Res 2006, 42, W10403. [Google Scholar]
  37. Chen, J.L.; Wilson, C.R.; Famiglietti, J.S.; Rodell, M. Spatial sensitivity of the Gravity Recovery and Climate Experiment (GRACE) time-variable gravity observations. J. Geophys. Res 2005, 110, B08408. [Google Scholar]
  38. Swenson, S.; Wahr, J. Post-processing removal of correlated errors in GRACE data. Geophys. Res. Lett 2006, 33, L08402. [Google Scholar]
  39. Kusche, J. Approximate decorrelation and non-isotropic smoothing of time-variable GRACE-type gravity field models. J. Geodesy 2007, 81, 733–749. [Google Scholar]
  40. Chen, J.L.; Wilson, C.R.; Tapley, B.D.; Grand, S. GRACE detects coseismic and postseismic deformation from the Sumatra-Andaman earthquake. Geophys. Res. Lett 2007, 34, L13302. [Google Scholar]
  41. Chen, J.L.; Wilson, C.R.; Tapley, B.D.; Longuevergne, L.; Yang, Z.L.; Scanlon, B.R. Recent La Plata basin drought conditions observed by satellite gravimetry. J. Geophy. Res 2010, 115, D22108. [Google Scholar]
  42. Swenson, S.; Wahr, J. Methods for inferring regional surface-mass anomalies from Gravity Recovery and Climate Experiment (GRACE) measurements of time-variable gravity. J. Geophys. Res. 2002. [Google Scholar] [CrossRef]
  43. Klees, R.; Zapreeva, E.A.; Winsemius, H.C.; Savenije, H.H.G. The bias in GRACE estimates of continental water storage variations. Hydrol. Earth Syst. Sci 2007, 11, 1227–1241. [Google Scholar]
  44. Landerer, F.W.; Swenson, S.C. Accuracy of scaled GRACE terrestrial water storage estimates. Water Resour. Res 2012, 48, W04531. [Google Scholar]
  45. Brutsaert, W. Hydrology: An Introduction; Cambridge University Press: New York, NY, USA, 2005; p. 142. [Google Scholar]
  46. Xue, B.-L.; Wang, L.; Li, X.; Yang, K.; Chen, D.; Sun, L. Evaluation of evapotranspiration estimates for two river basins on the Tibetan Plateau by a water balance method. J. Hydrol 2013, 492, 290–297. [Google Scholar]
  47. Rodell, M.; Famiglietti, J.S.; Chen, J.; Seneviratne, S.I.; Viterbo, P.; Holl, S.; Wilson, C.R. Basin scale estimates of evapotranspiration using GRACE and other observations. Geophys. Res. Lett 2004, 31, L20504. [Google Scholar]
  48. Cesanelli, A.; Guarracino, L. Estimation of regional evapotranspiration in the extended Salado Basin (Argentina) from satellite gravity measurements. Hydrogeol. J 2011, 19, 629–639. [Google Scholar]
  49. Taylor, K.E. Summarizing multiple aspects of model performance in a single diagram. J. Geophys. Res 2001, 106, 7183–7192. [Google Scholar]
  50. Zaitchik, B.F.; Rodell, M.; Olivera, F. Evaluation of the global land data assimilation system using global river discharge data and a source-to-sink routing scheme. Water Resour. Res 2010, 46, W06507. [Google Scholar]
Figure 1. (a) Location of the study area in China; (b) Yangtze River basin (shadowed portion with an area of approximately 1.8 × 10⁶ km2), Three Gorges Dam (TGD) and the Datong Hydrologic Station. The graphical scale is related to the parallel 30°; (c) Daily net surface runoff (R) of Datong Hydrologic station.
Remotesensing 05 03415f1
Figure 2. The average function (mask) adopted for the Yangtze basin analysis. The solid red line represents the perimeter of the Yangtze basin.
Remotesensing 05 03415f2
Figure 3. A simplified scheme for the relation of quantities in the land water budget.
Remotesensing 05 03415f3
Figure 4. (a) Monthly Gravity Recovery and Climate Experiment (GRACE)-derived water-storage changes from the three different processing centers (Center for Space Research (CSR), Jet Propulsion Laboratory (JPL) and GeoForschungsZentrum (GFZ)); (b) Monthly evaporations from four versions of Global Land Data Assimilation System (GLDAS) (CLM, Mosaic, Noah and VIC) and those estimated by PR; (c) Tropical Rainfall Measurement Mission (TRMM) precipitation and those estimated by GLDAS (CLM, Mosaic, Noah and VIC).
Remotesensing 05 03415f4
Figure 5. Taylor’s diagram of statistical comparison between the time series of observed streamflow (reference) at Datong hydrological station and estimated discharge rates.
Remotesensing 05 03415f5
Figure 6. (a) Monthly estimated Yangtze total basin discharge (black line) and observed streamflow (blue line) as well as estimated discharge with those of PE (red line). The error bars in GRACE-derived discharge were calculated by using the Equation (7) of [36] and Equation (28) of [42] with a 95% confidence; (b) Comparison of the seasonal cycles of estimated discharge with those of PE and observed streamflow. The error bars represent the standard deviation for the monthly mean values.
Remotesensing 05 03415f6
Table 1. Coefficients for least squares best fit over the time window of February 2002 to December 2009 with confidence level of 95%.
VariablesAnnualSemi-Annual

Amplitude (mm/month)Phase (month)Amplitude (mm/month)Phase (month)
Obs. streamflow23.4 ±1.36.8 ±0.12.7 ±1.32.8 ±0.9
Discharge (GRACE)22.0 ±2.27.3 ±0.22.5 ±2.26.6 ±1.7
Discharge (PE)32.0 ±2.45.6 ±0.18.4 ±2.411.8 ±0.5

