Automatic Registration Method for Fusion of ZY-1-02C Satellite Images

Abstract
:
1. Introduction
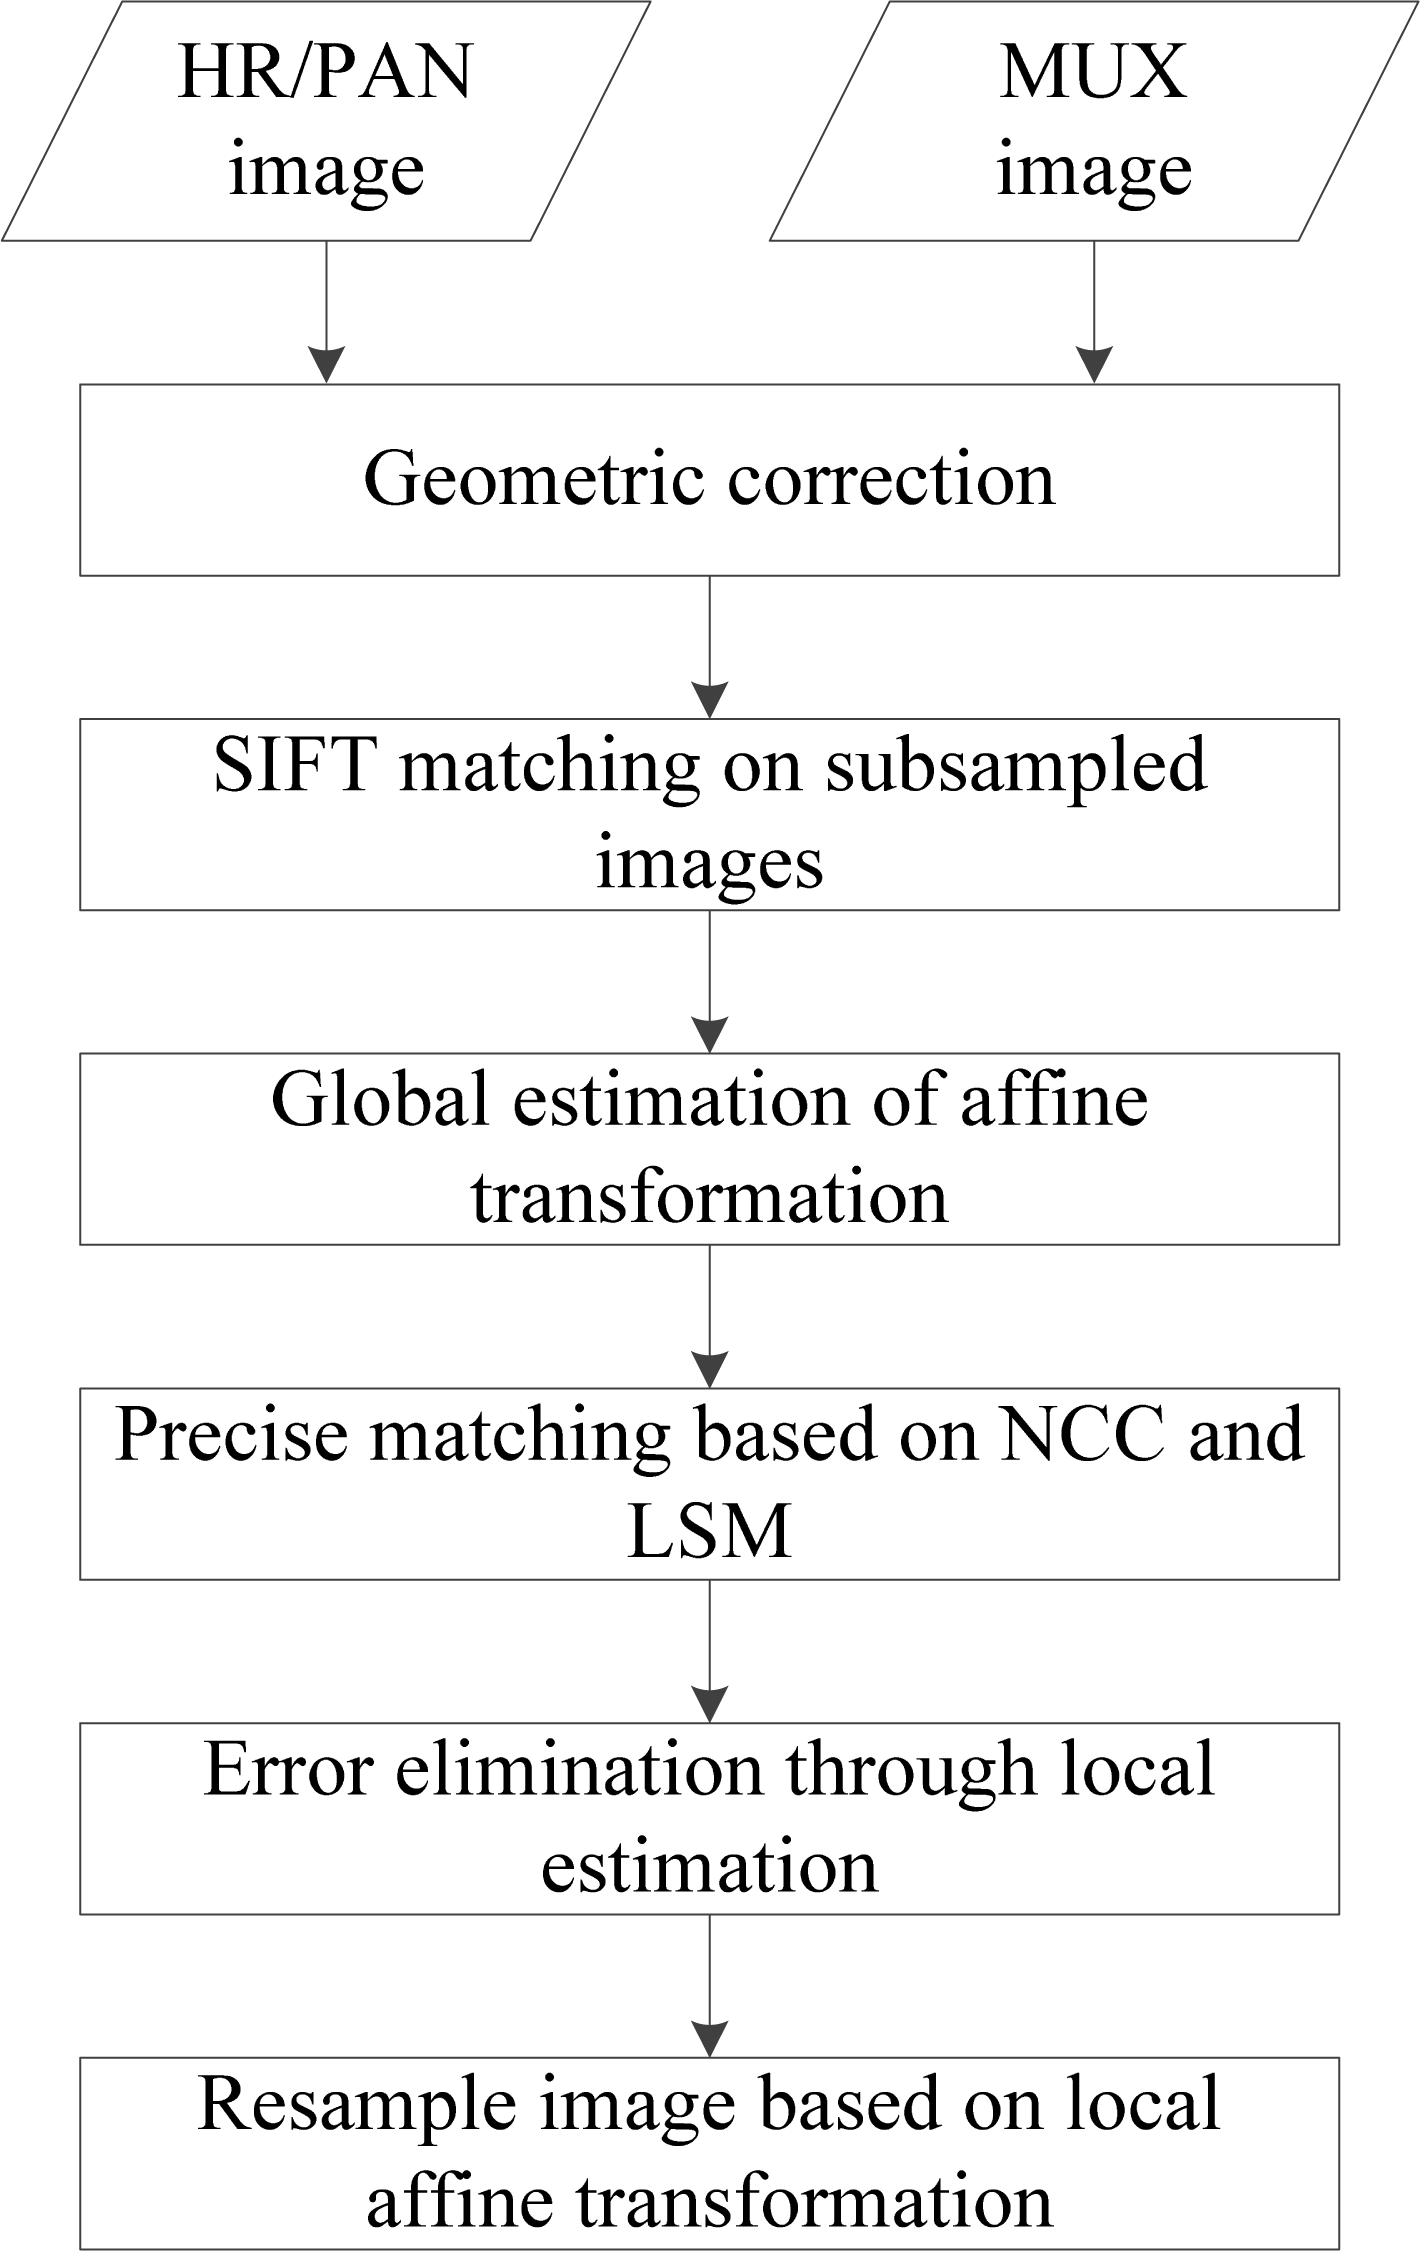
2. Methodology
2.1. Geometric Correction
2.2. SIFT Matching on Subsampled Images
2.2.1. Image Subsampling
2.2.2. SIFT Matching
2.3. Global Estimation of Affine Transformation
2.4. Precise Matching Based on NCC and LSM
2.4.1. Feature Extraction
2.4.2. Matching Based on NCC and LSM
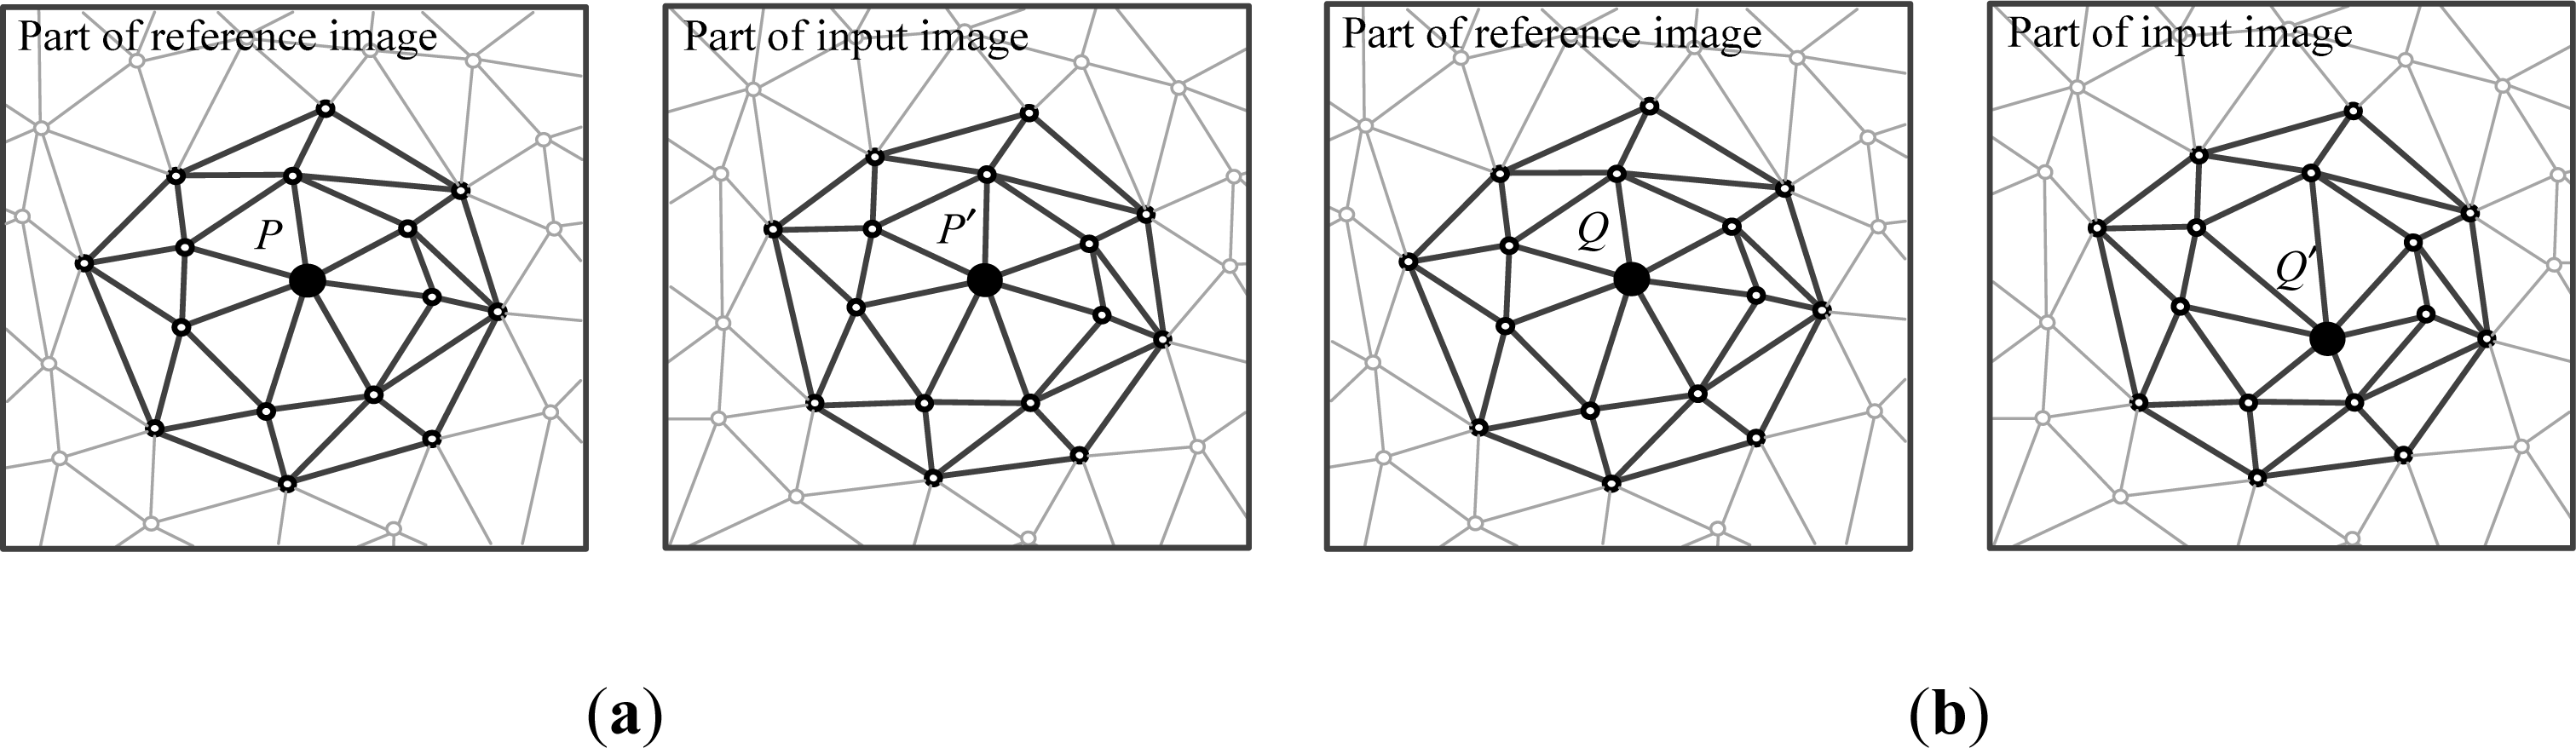
2.5. Error Elimination through Local Estimation
- (1) A TIN is constructed using the coordinates of matching points, and the points in TIN are judged one by one in the following steps;
- (2) Several nearest neighboring points around the current judging point are collected based on the TIN structure. The neighboring points are determined by an iterative method: first, all the points adjacently connected to the judging point are collected; then, more points that are adjacently connected to the collected points are found and gathered continually. In our approach, the recommended number of iteration times is 2, as shown in Figure 2;
- (3) Based on the coordinates of the collected matching points, affine transformation parameters of the local distortion can be estimated;
- (4) The residual error of the judging point is calculated using the affine parameters obtained previously. If the error is greater than a certain threshold (which is twice the RMSE in our approach), the judging point and its corresponding point are eliminated as a false match. Otherwise, we go to step (2) to judge the next point;
- (5) After traversing all the points in the TIN, we return to step (1) to reconstruct a new TIN using the remaining points. The process continues until the residual errors of all points meet the requirements.
2.6. Resample Image Based on Local Affine Transformation
3. Experiments and Results
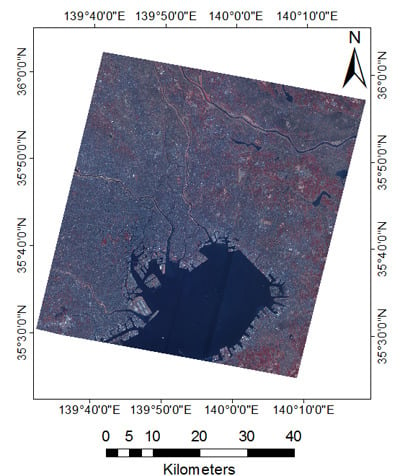
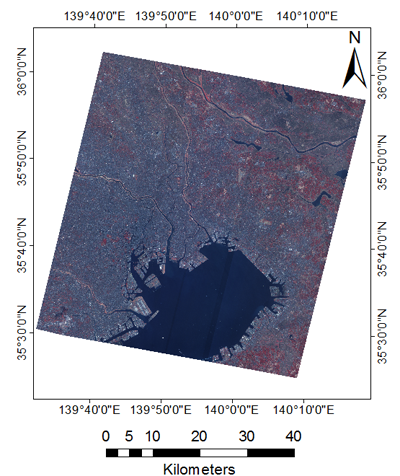
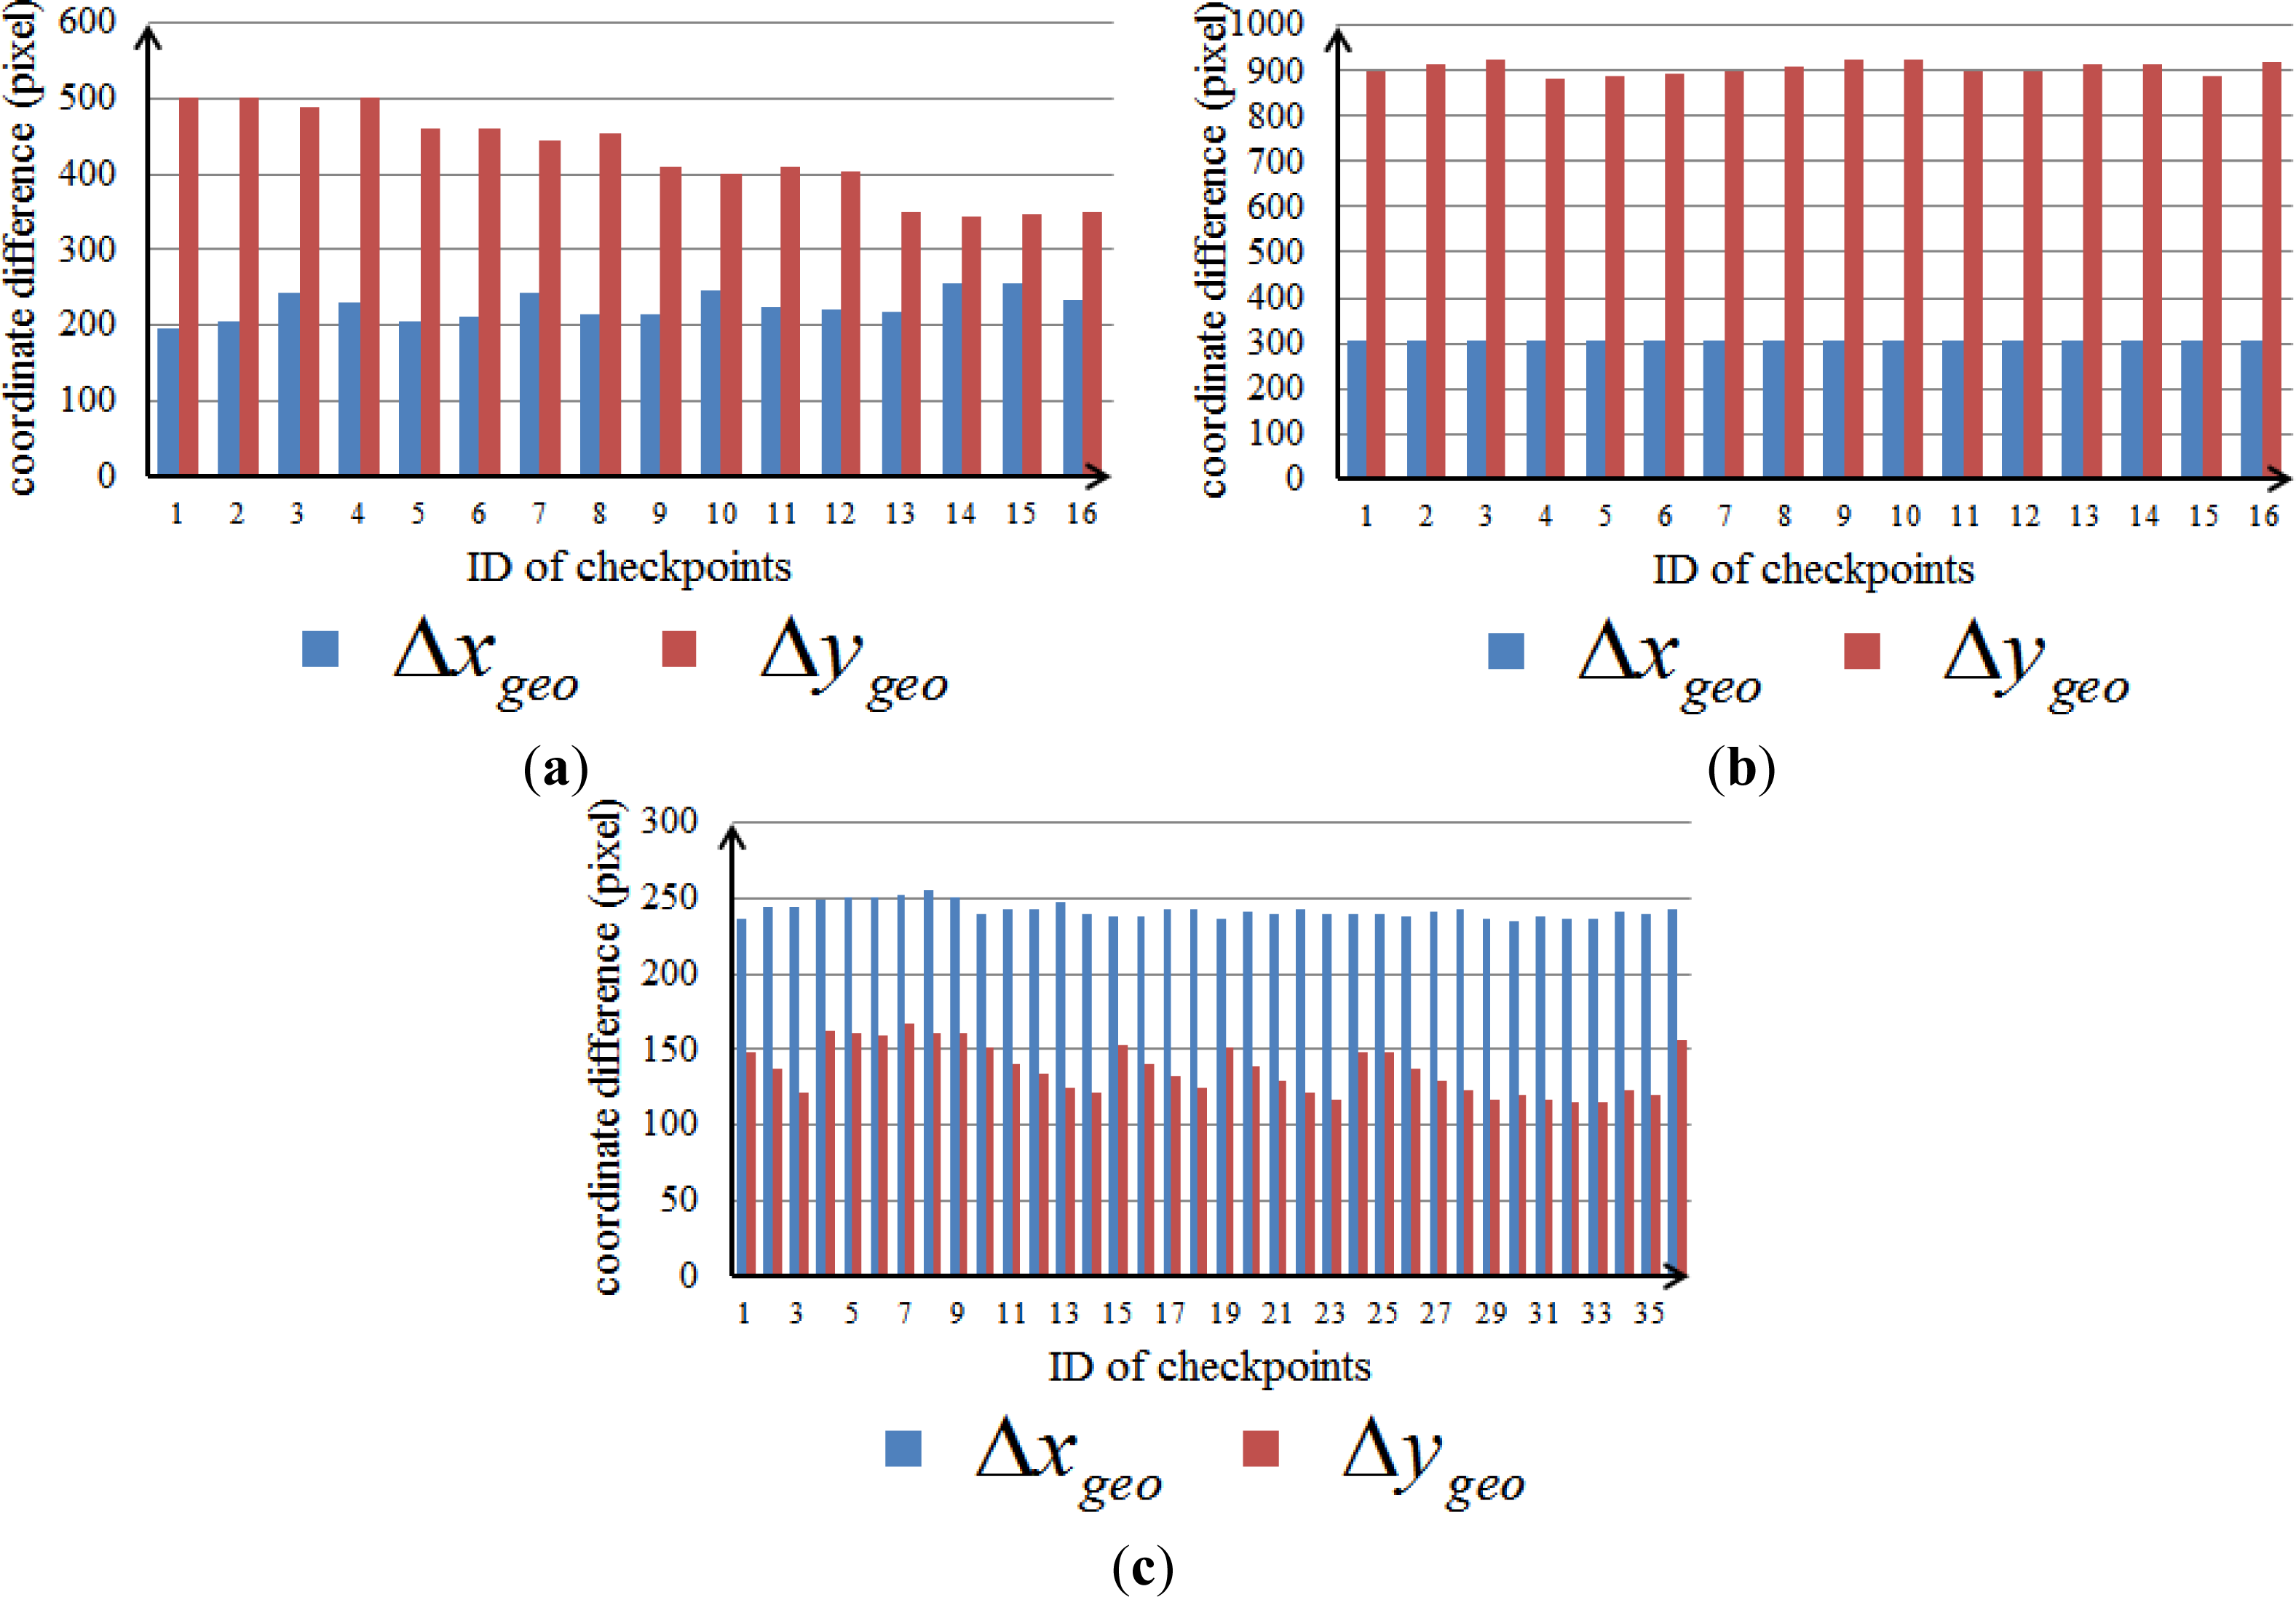
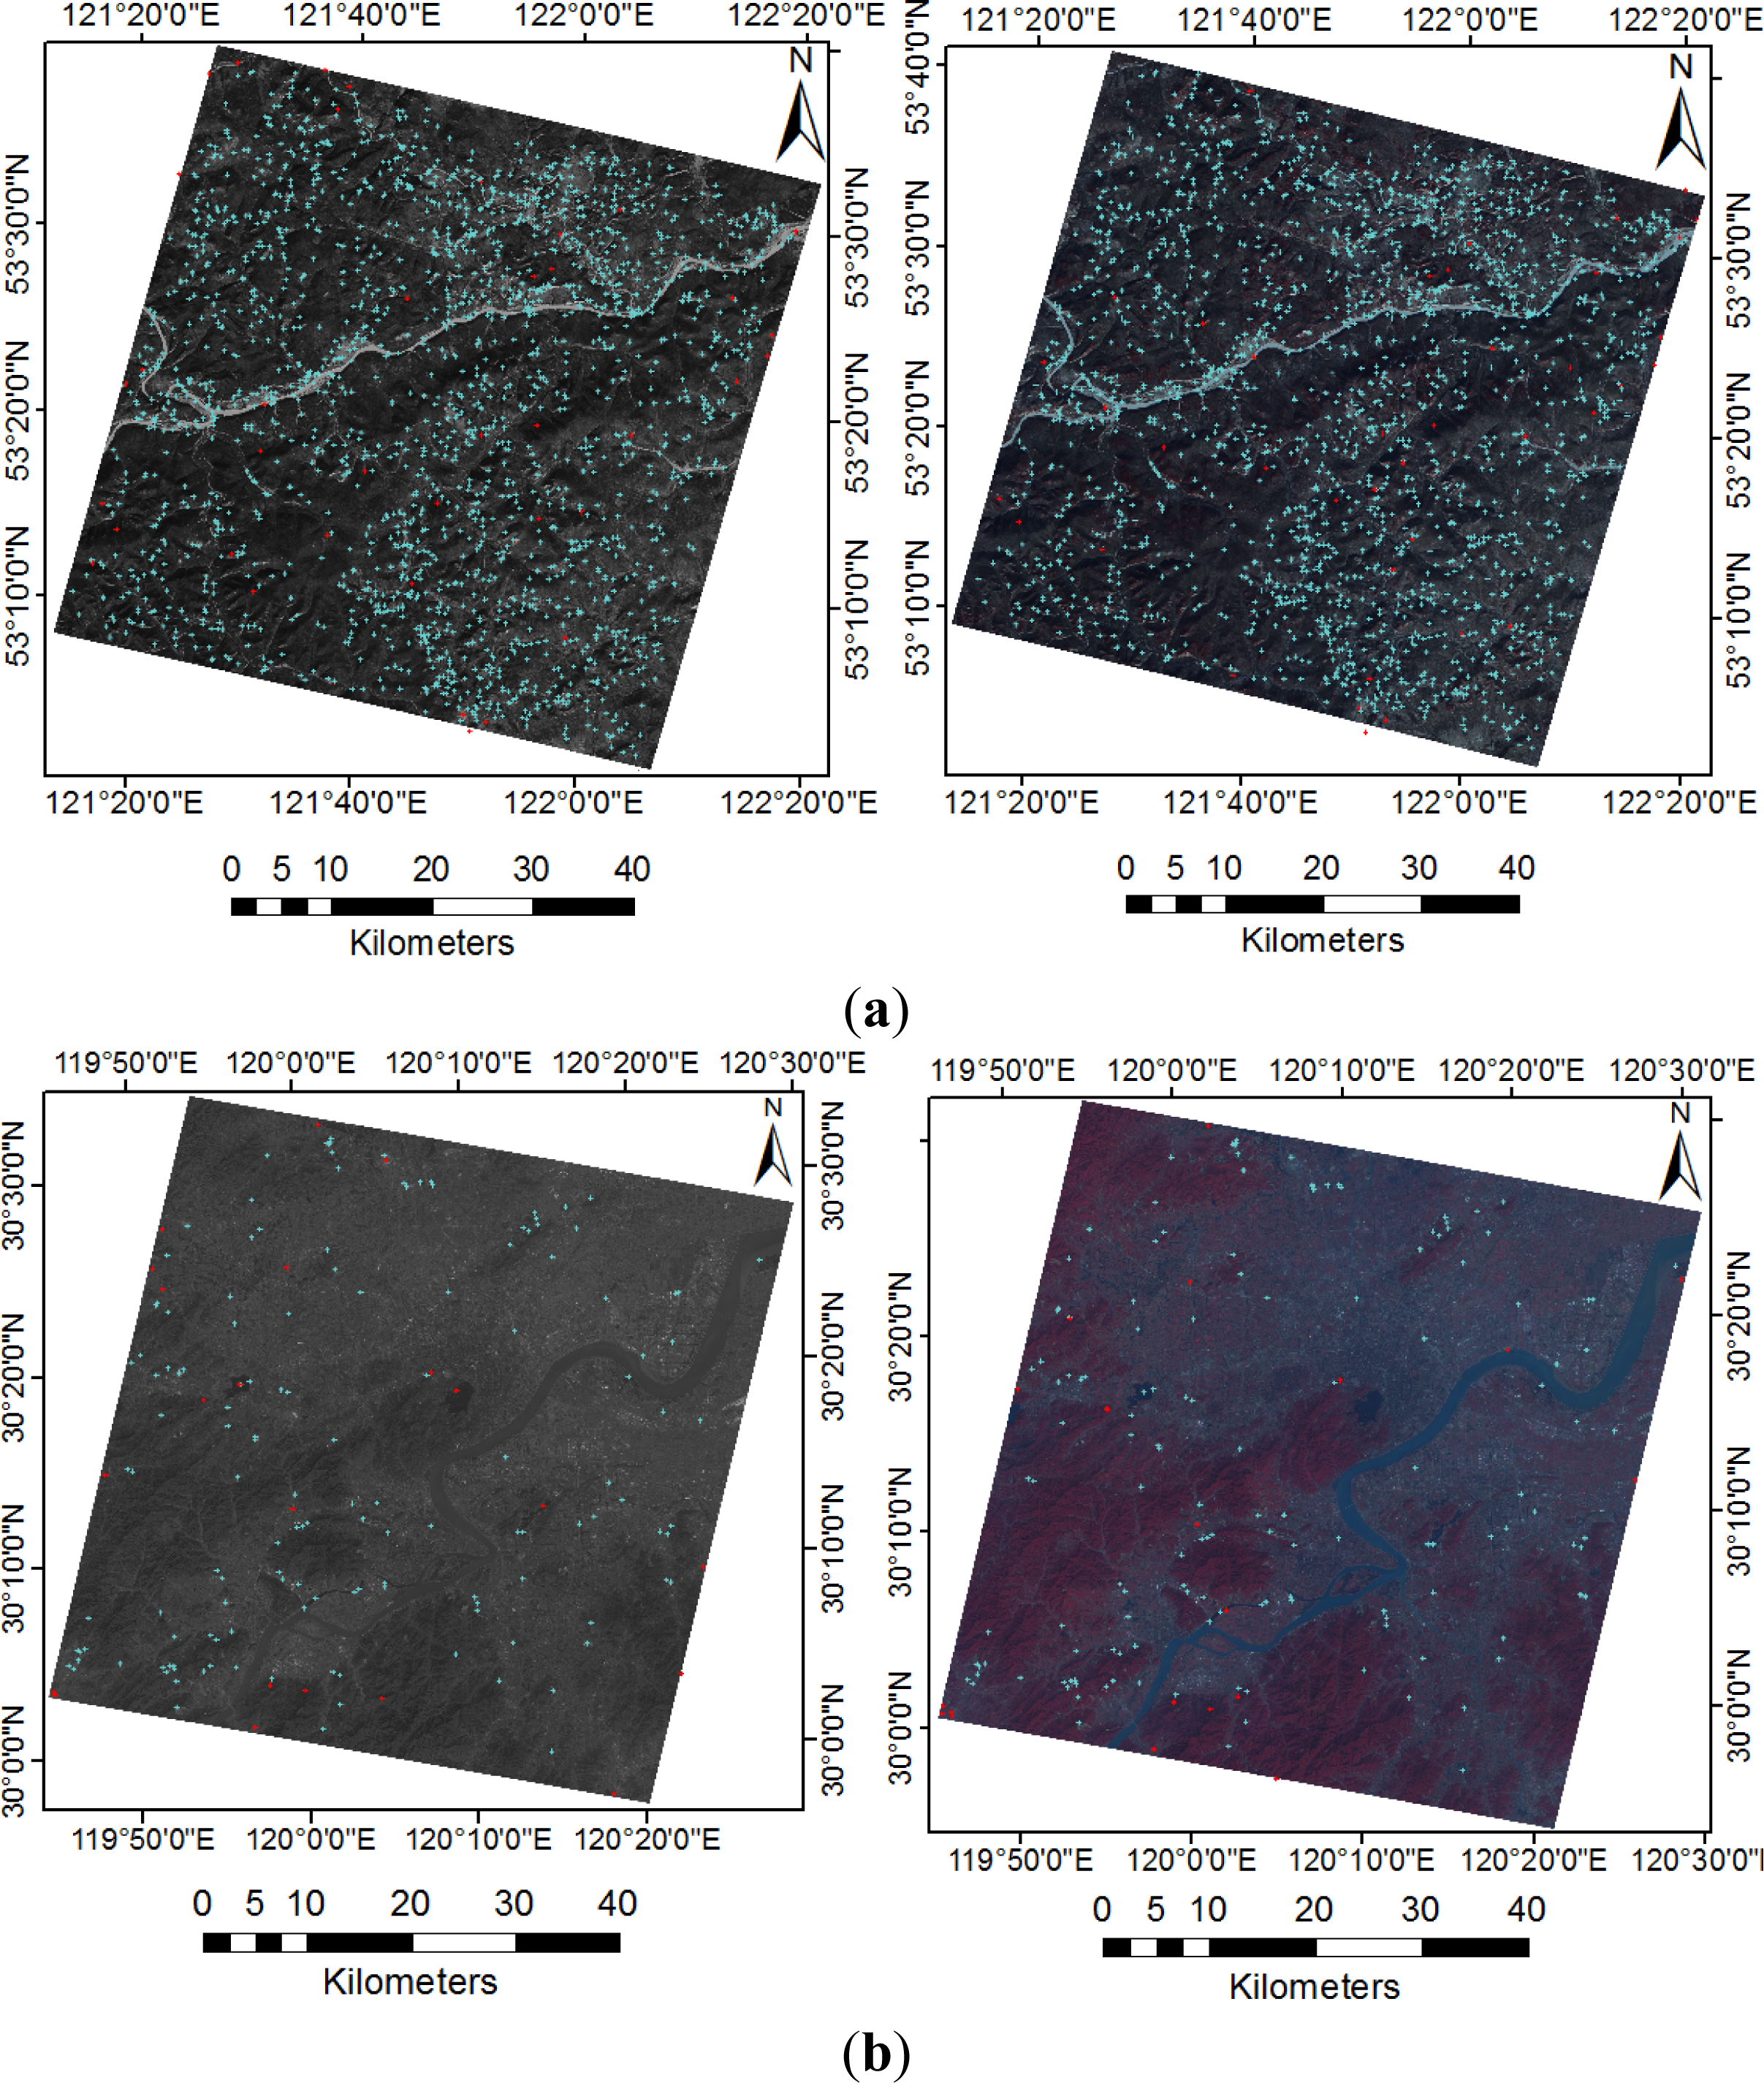
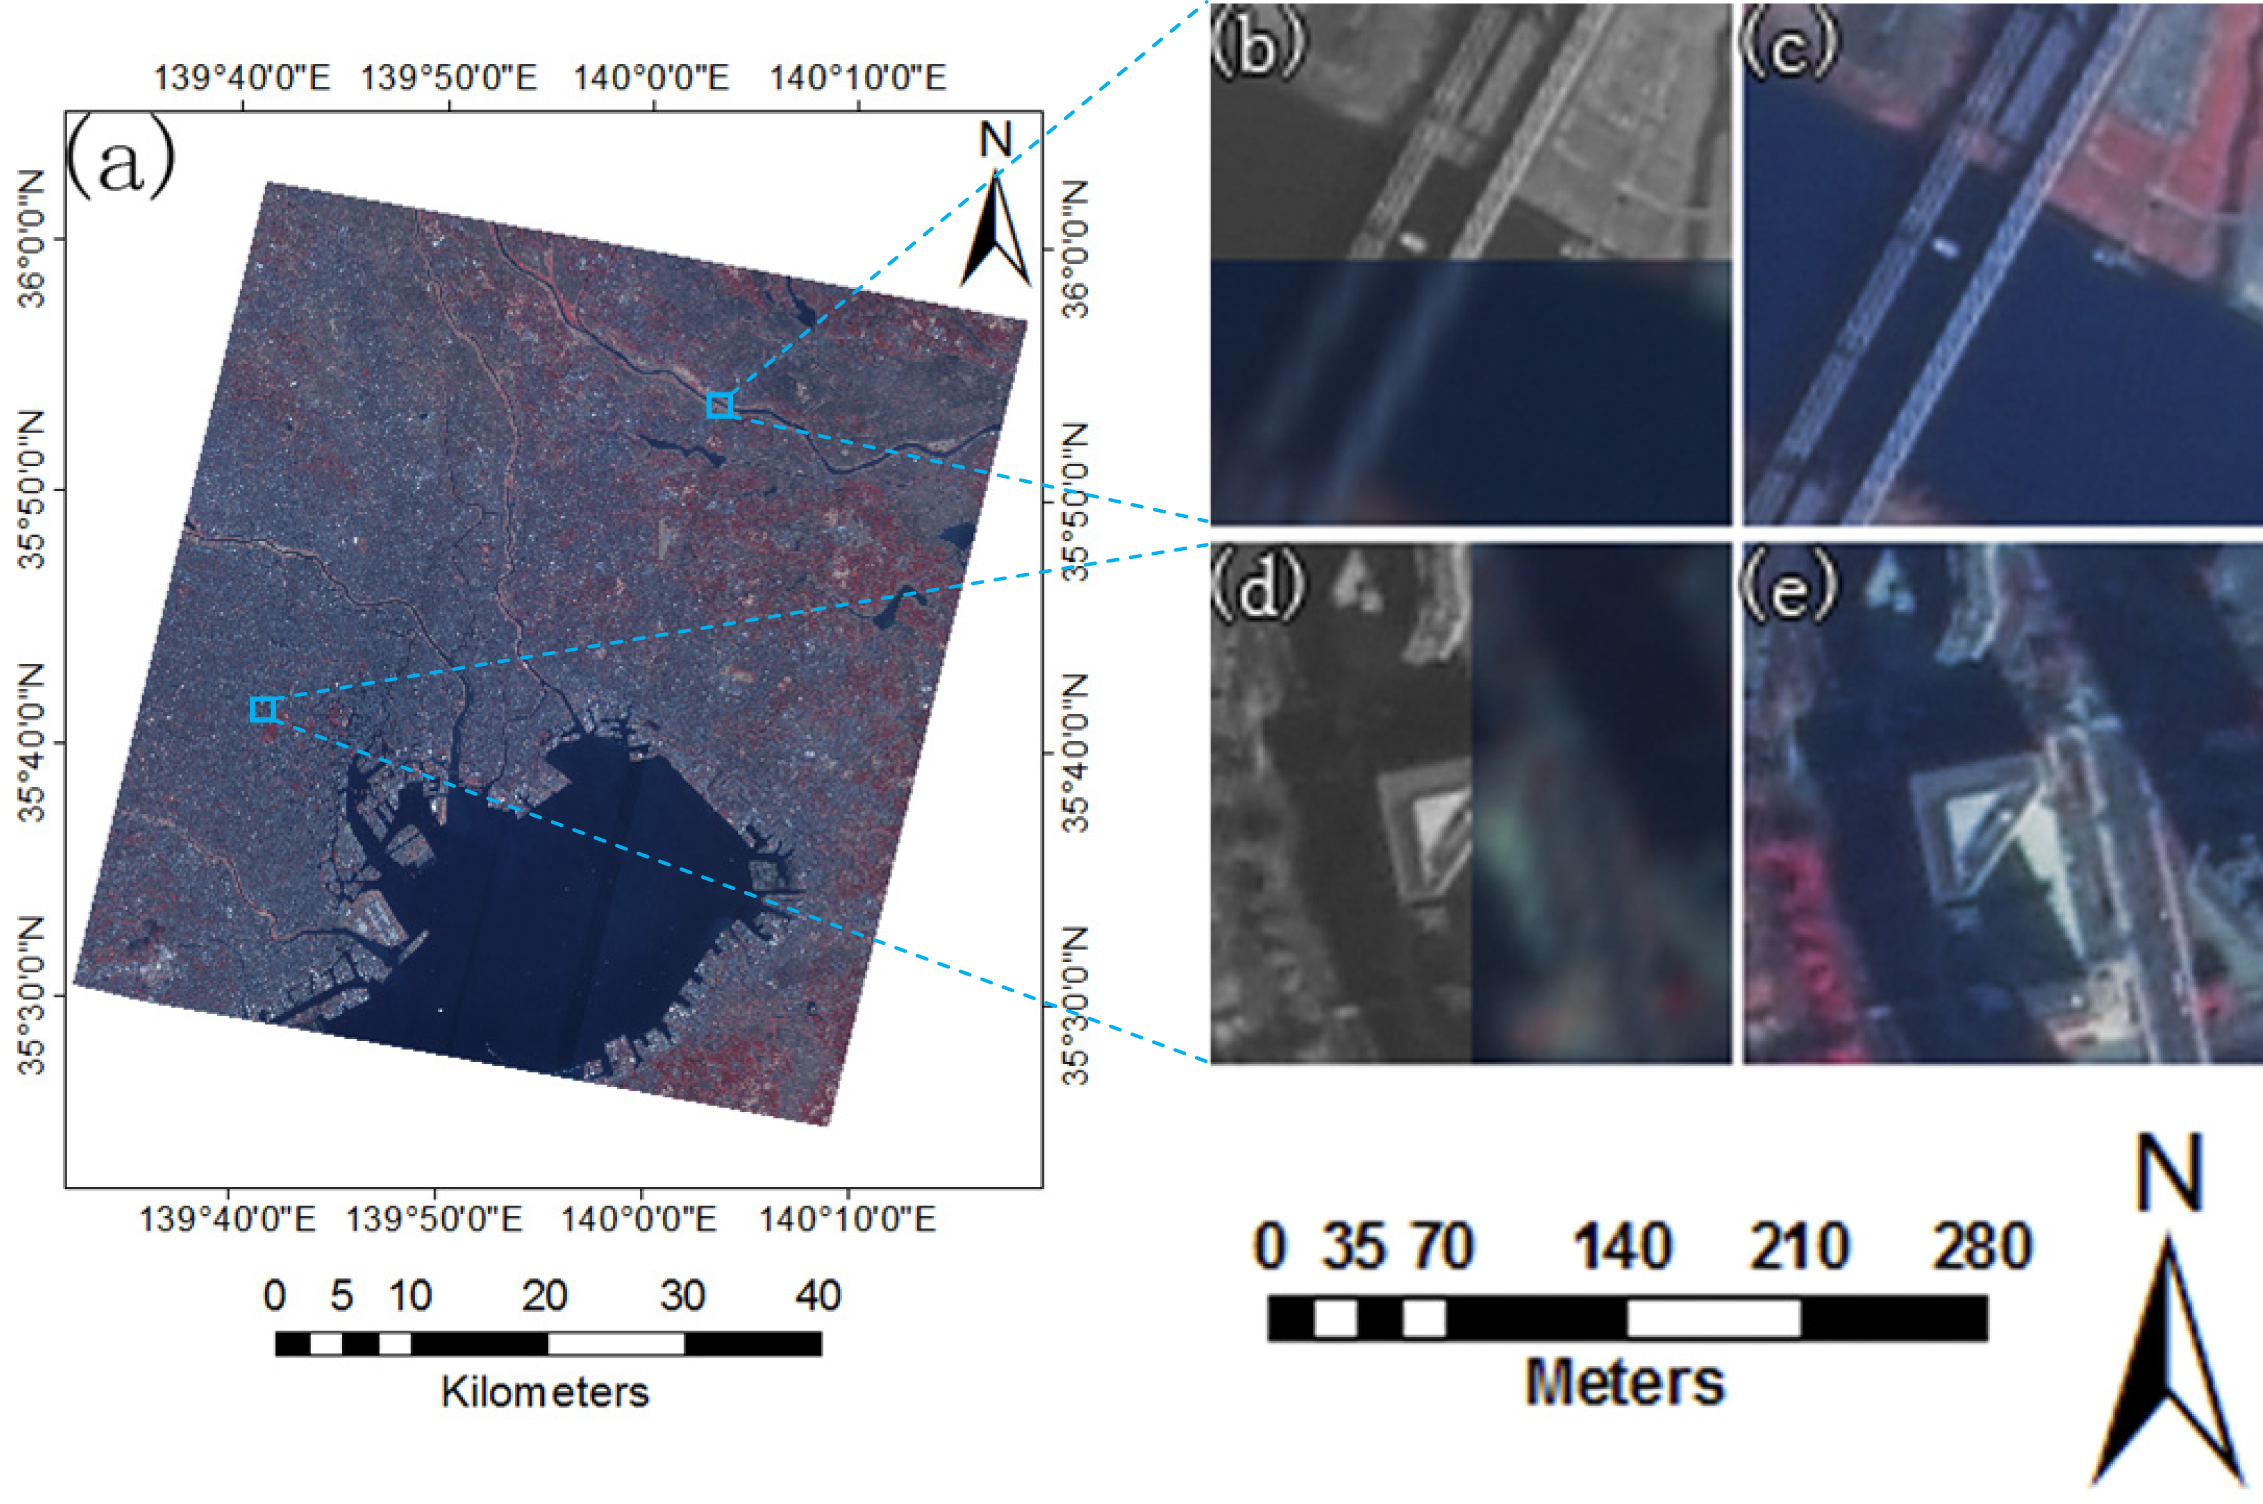
3.1. Description and Accuracy Analysis of Test Data
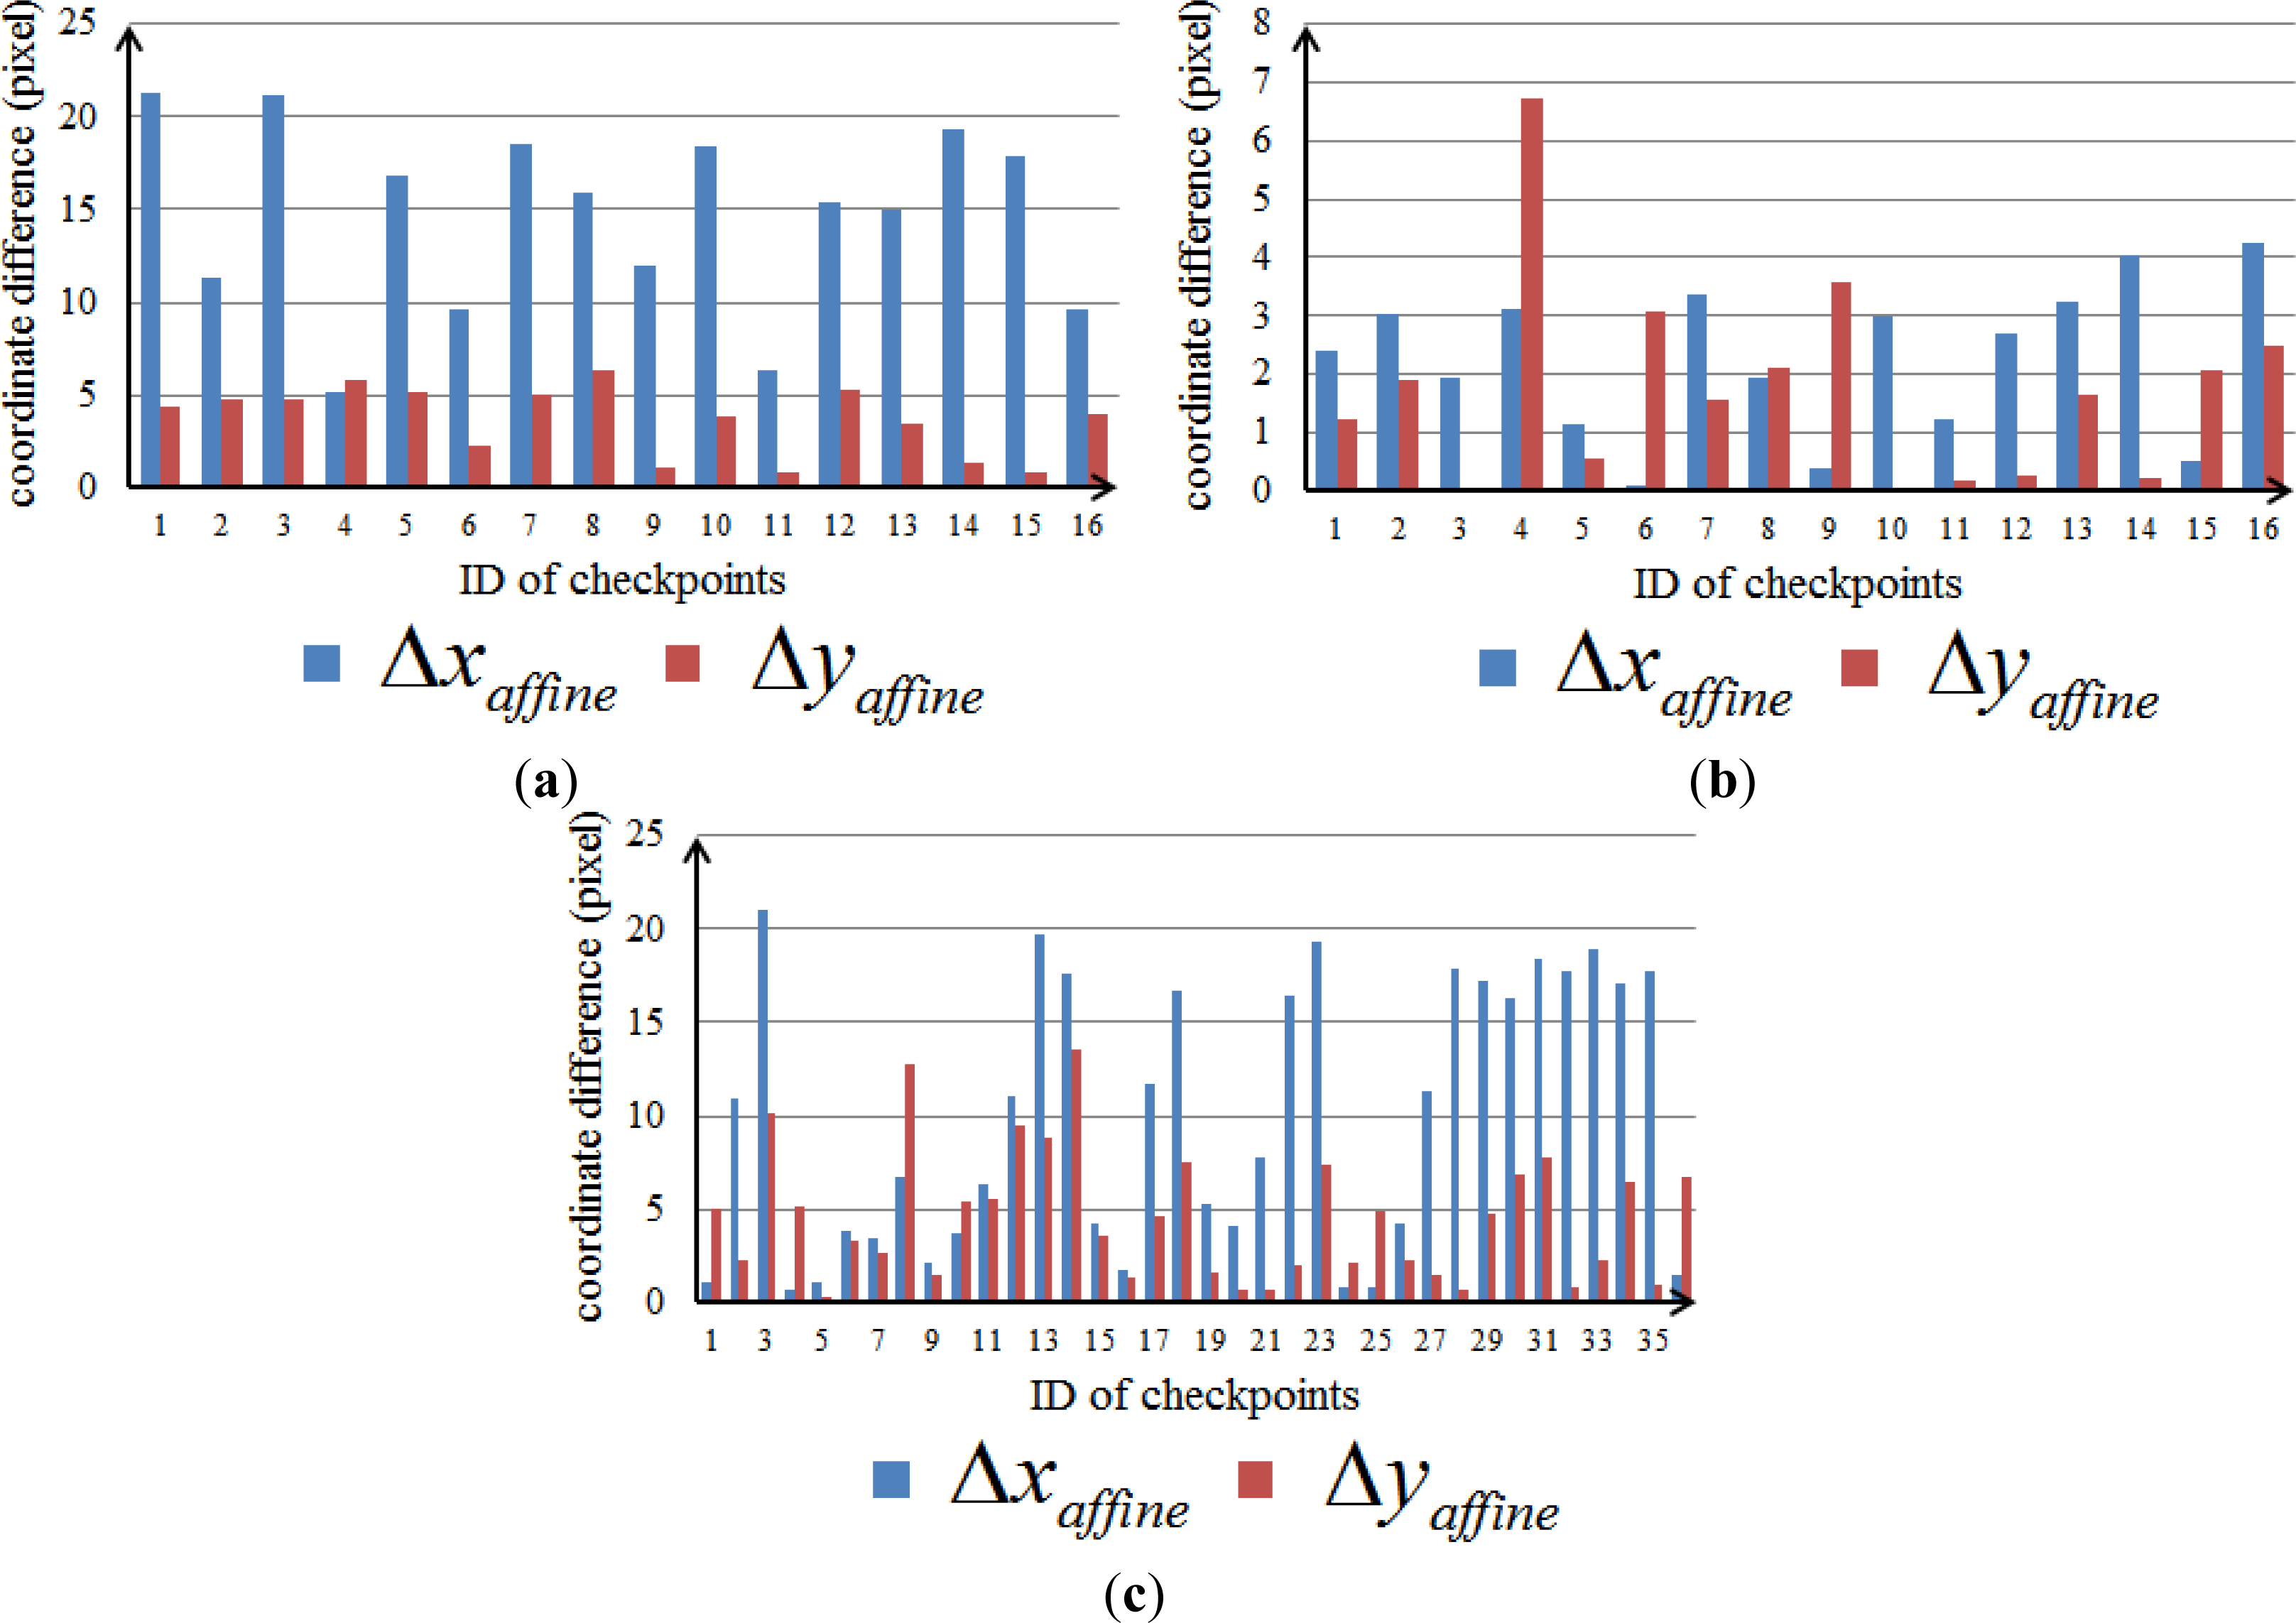
3.2. Determining Global Affine Parameters
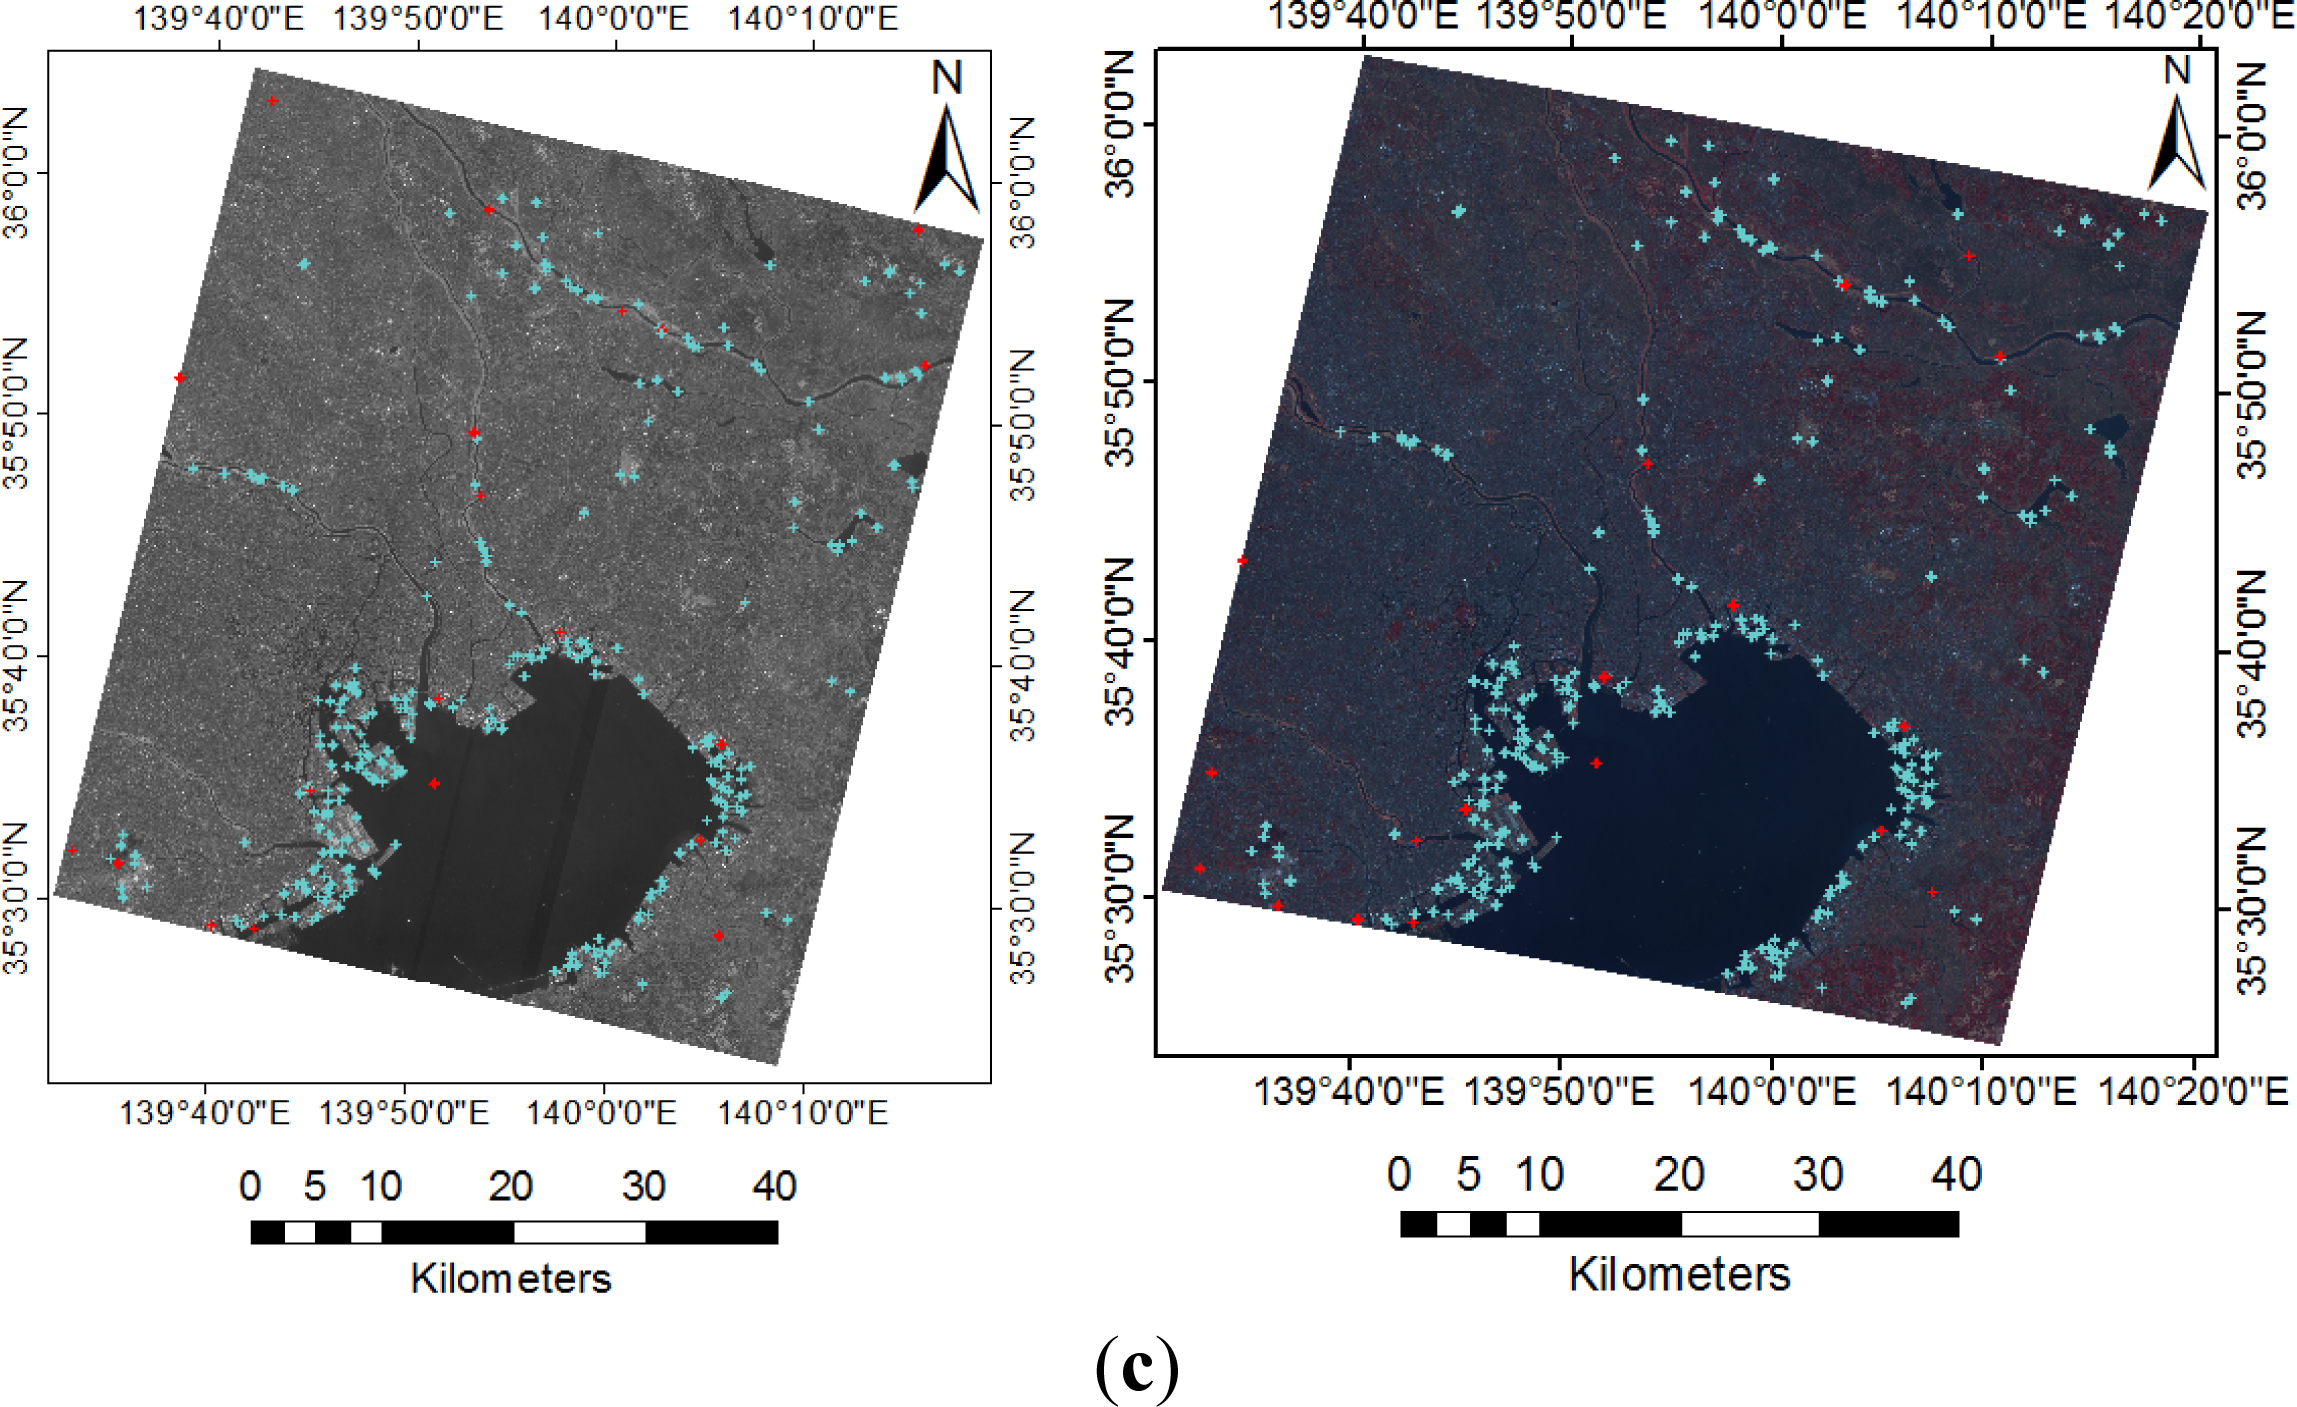
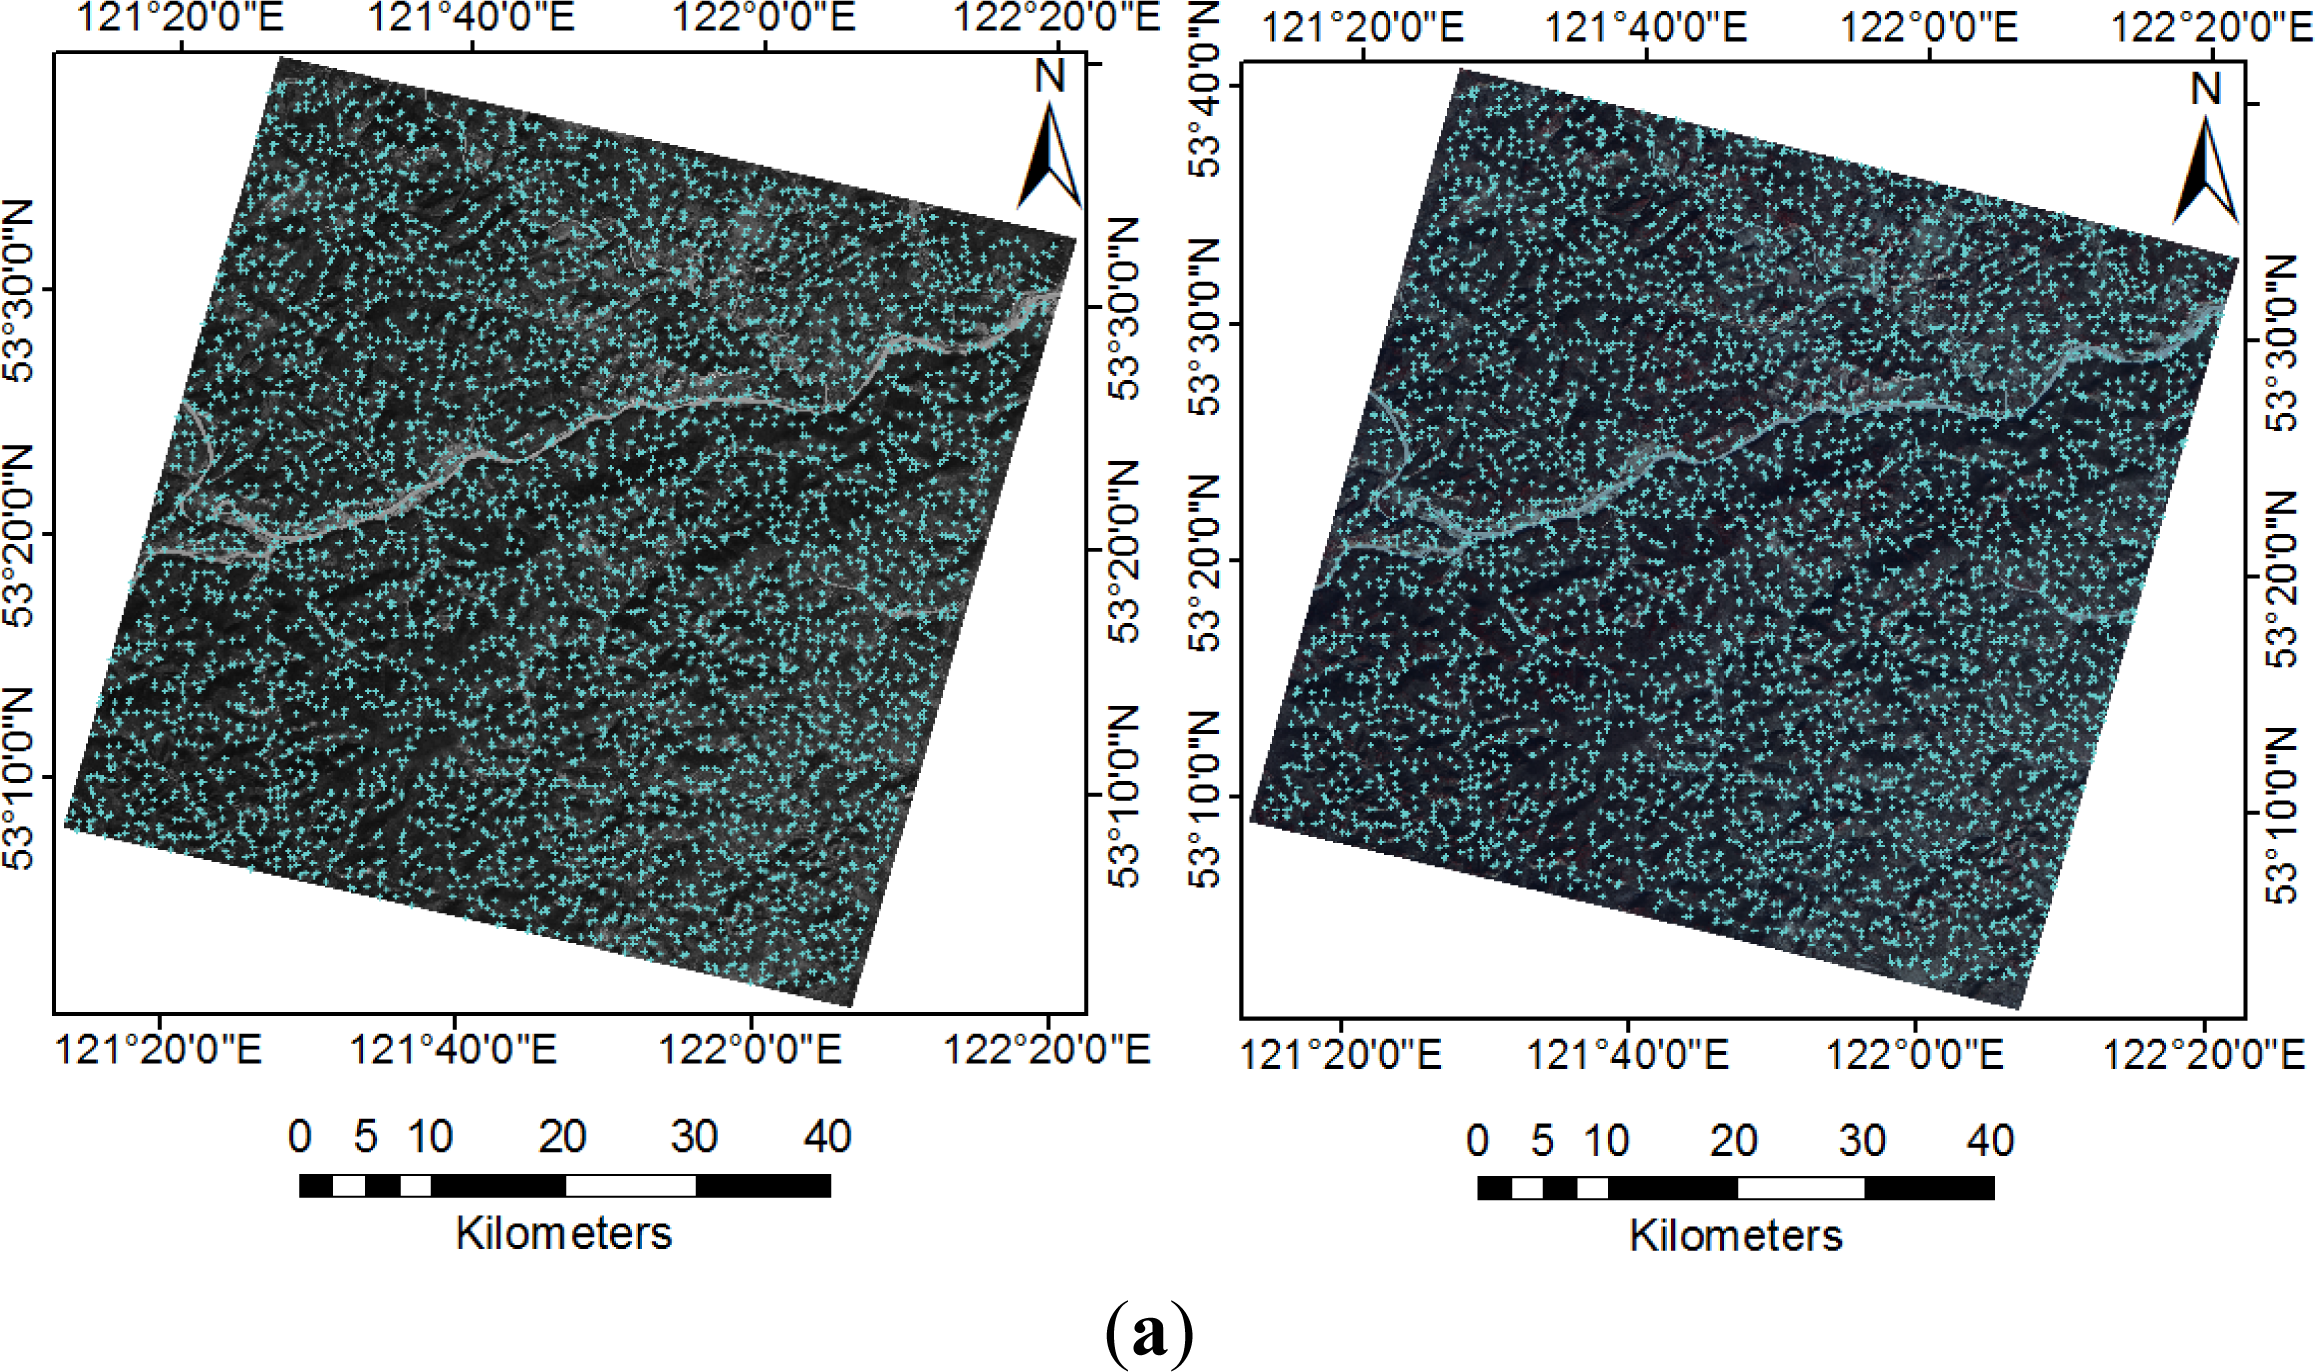
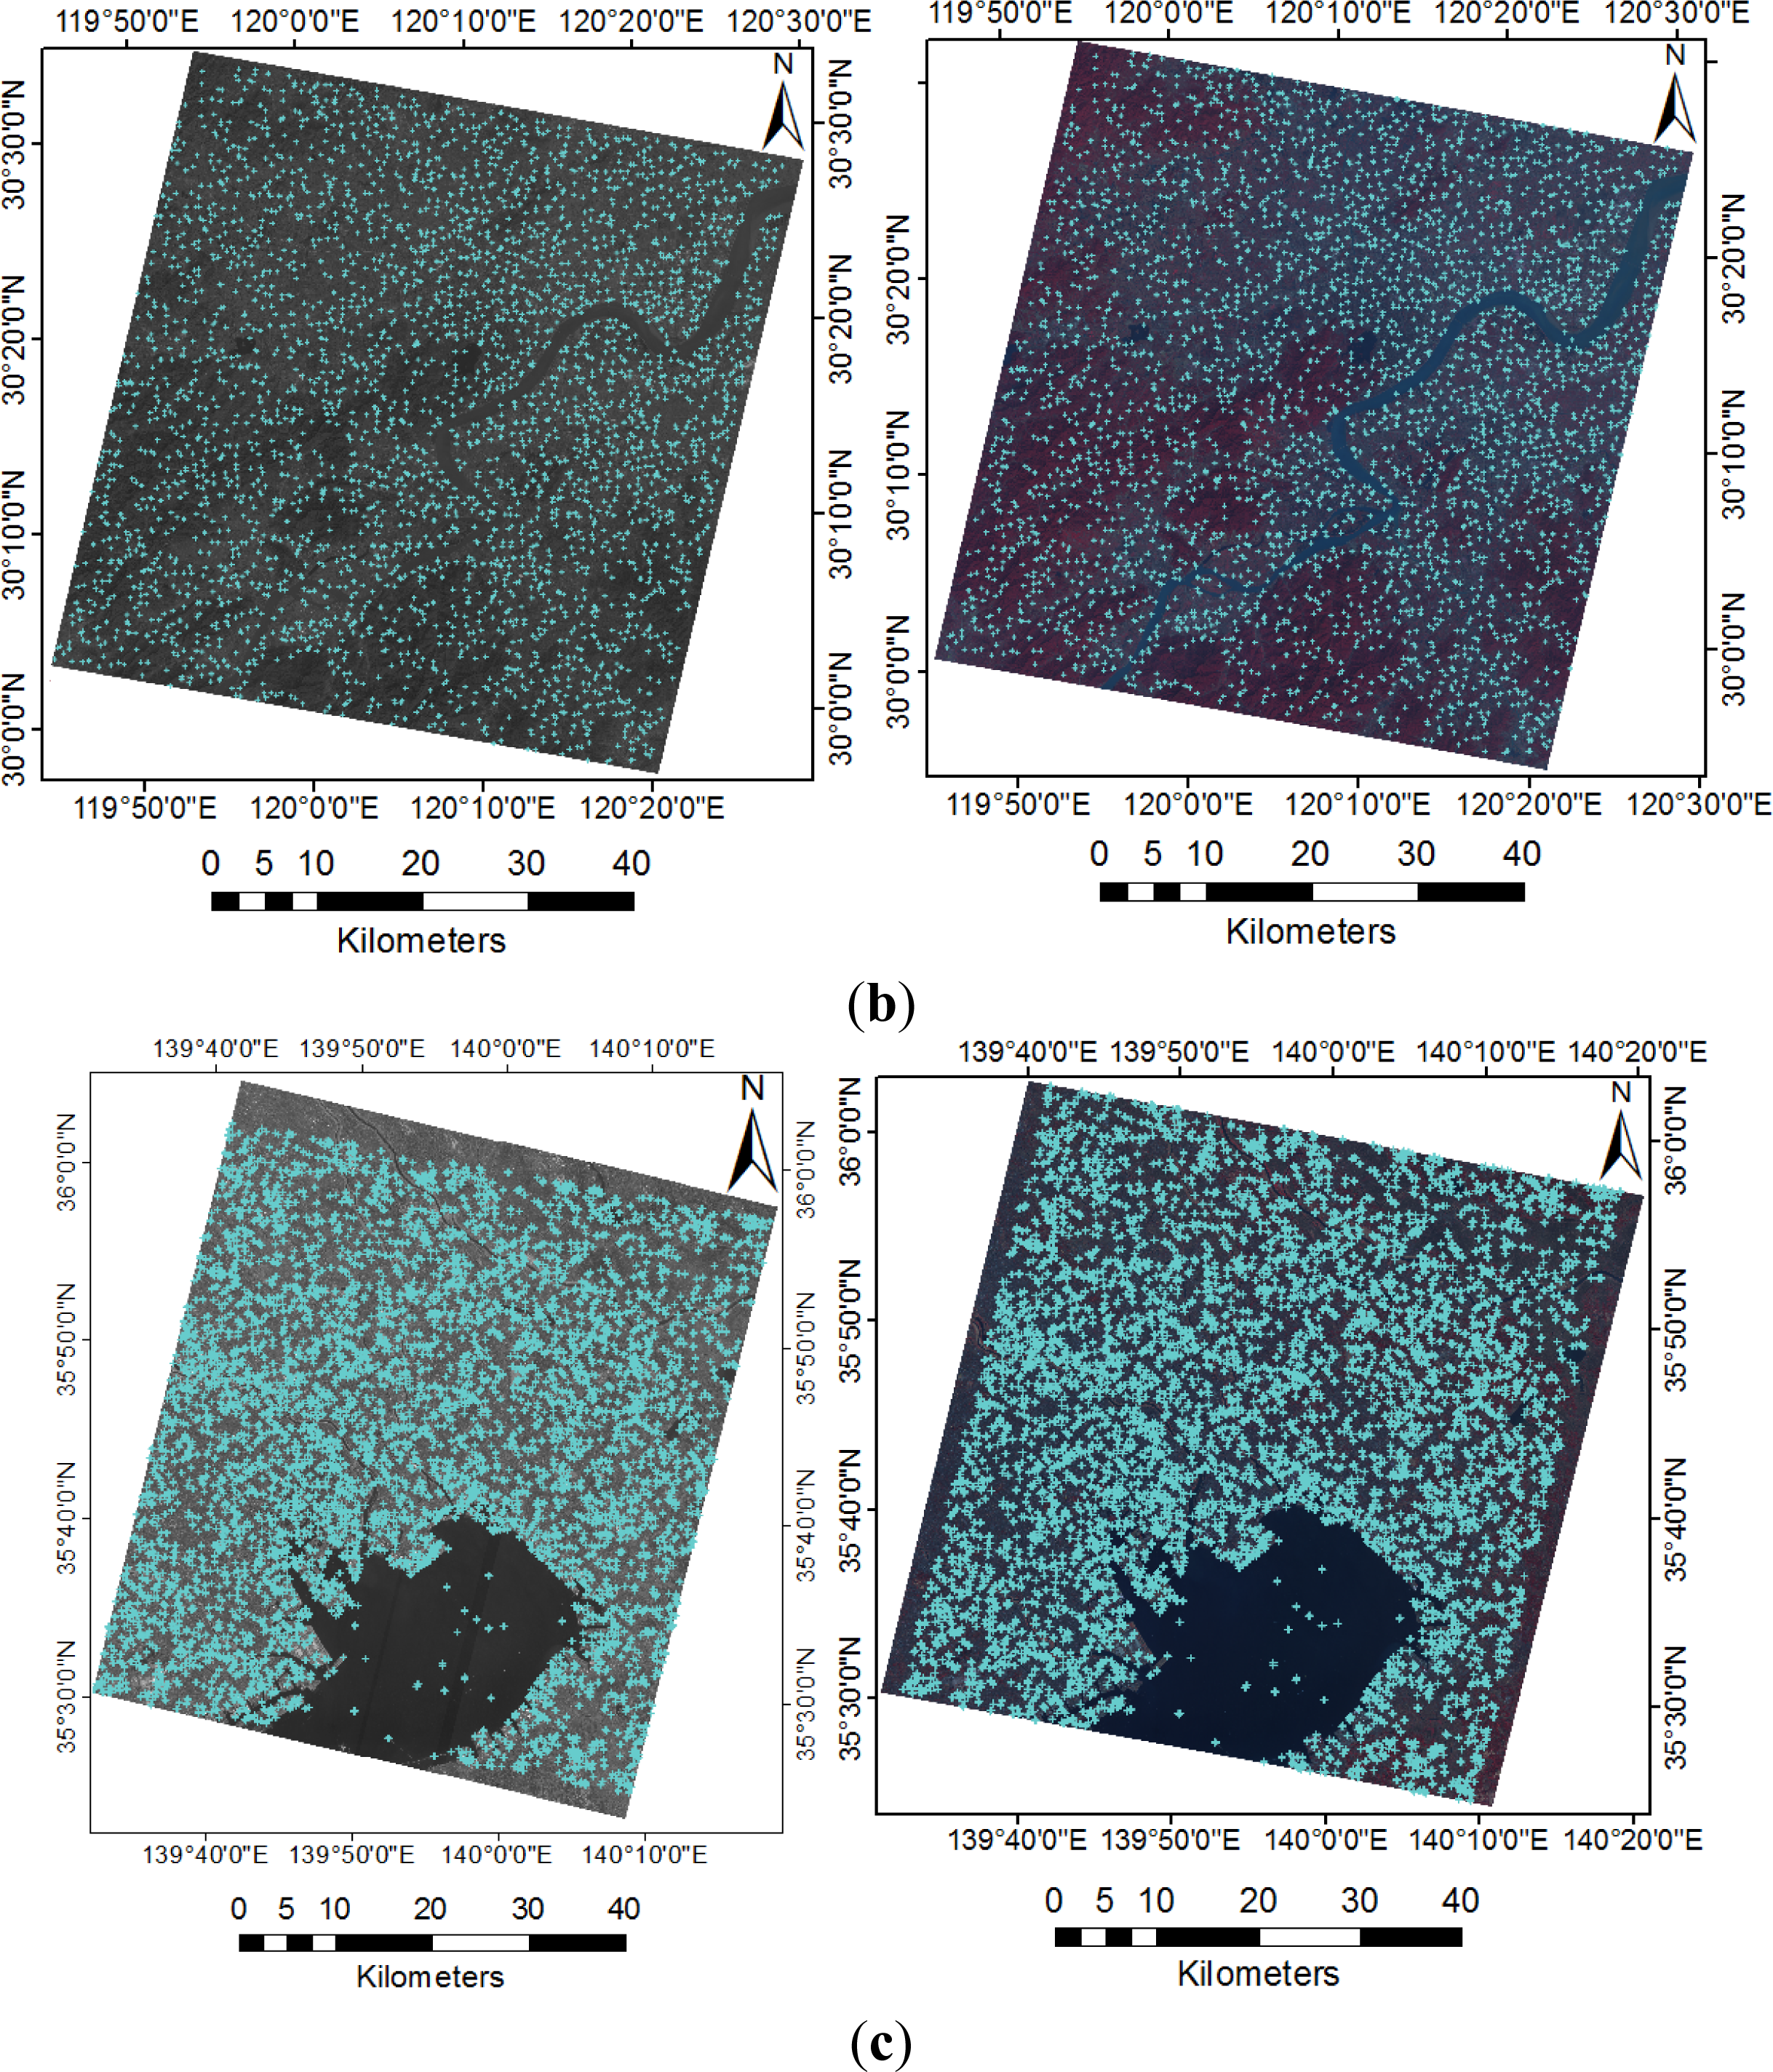
3.3. Acquisition of a Large Number of Evenly Distributed Corresponding Points
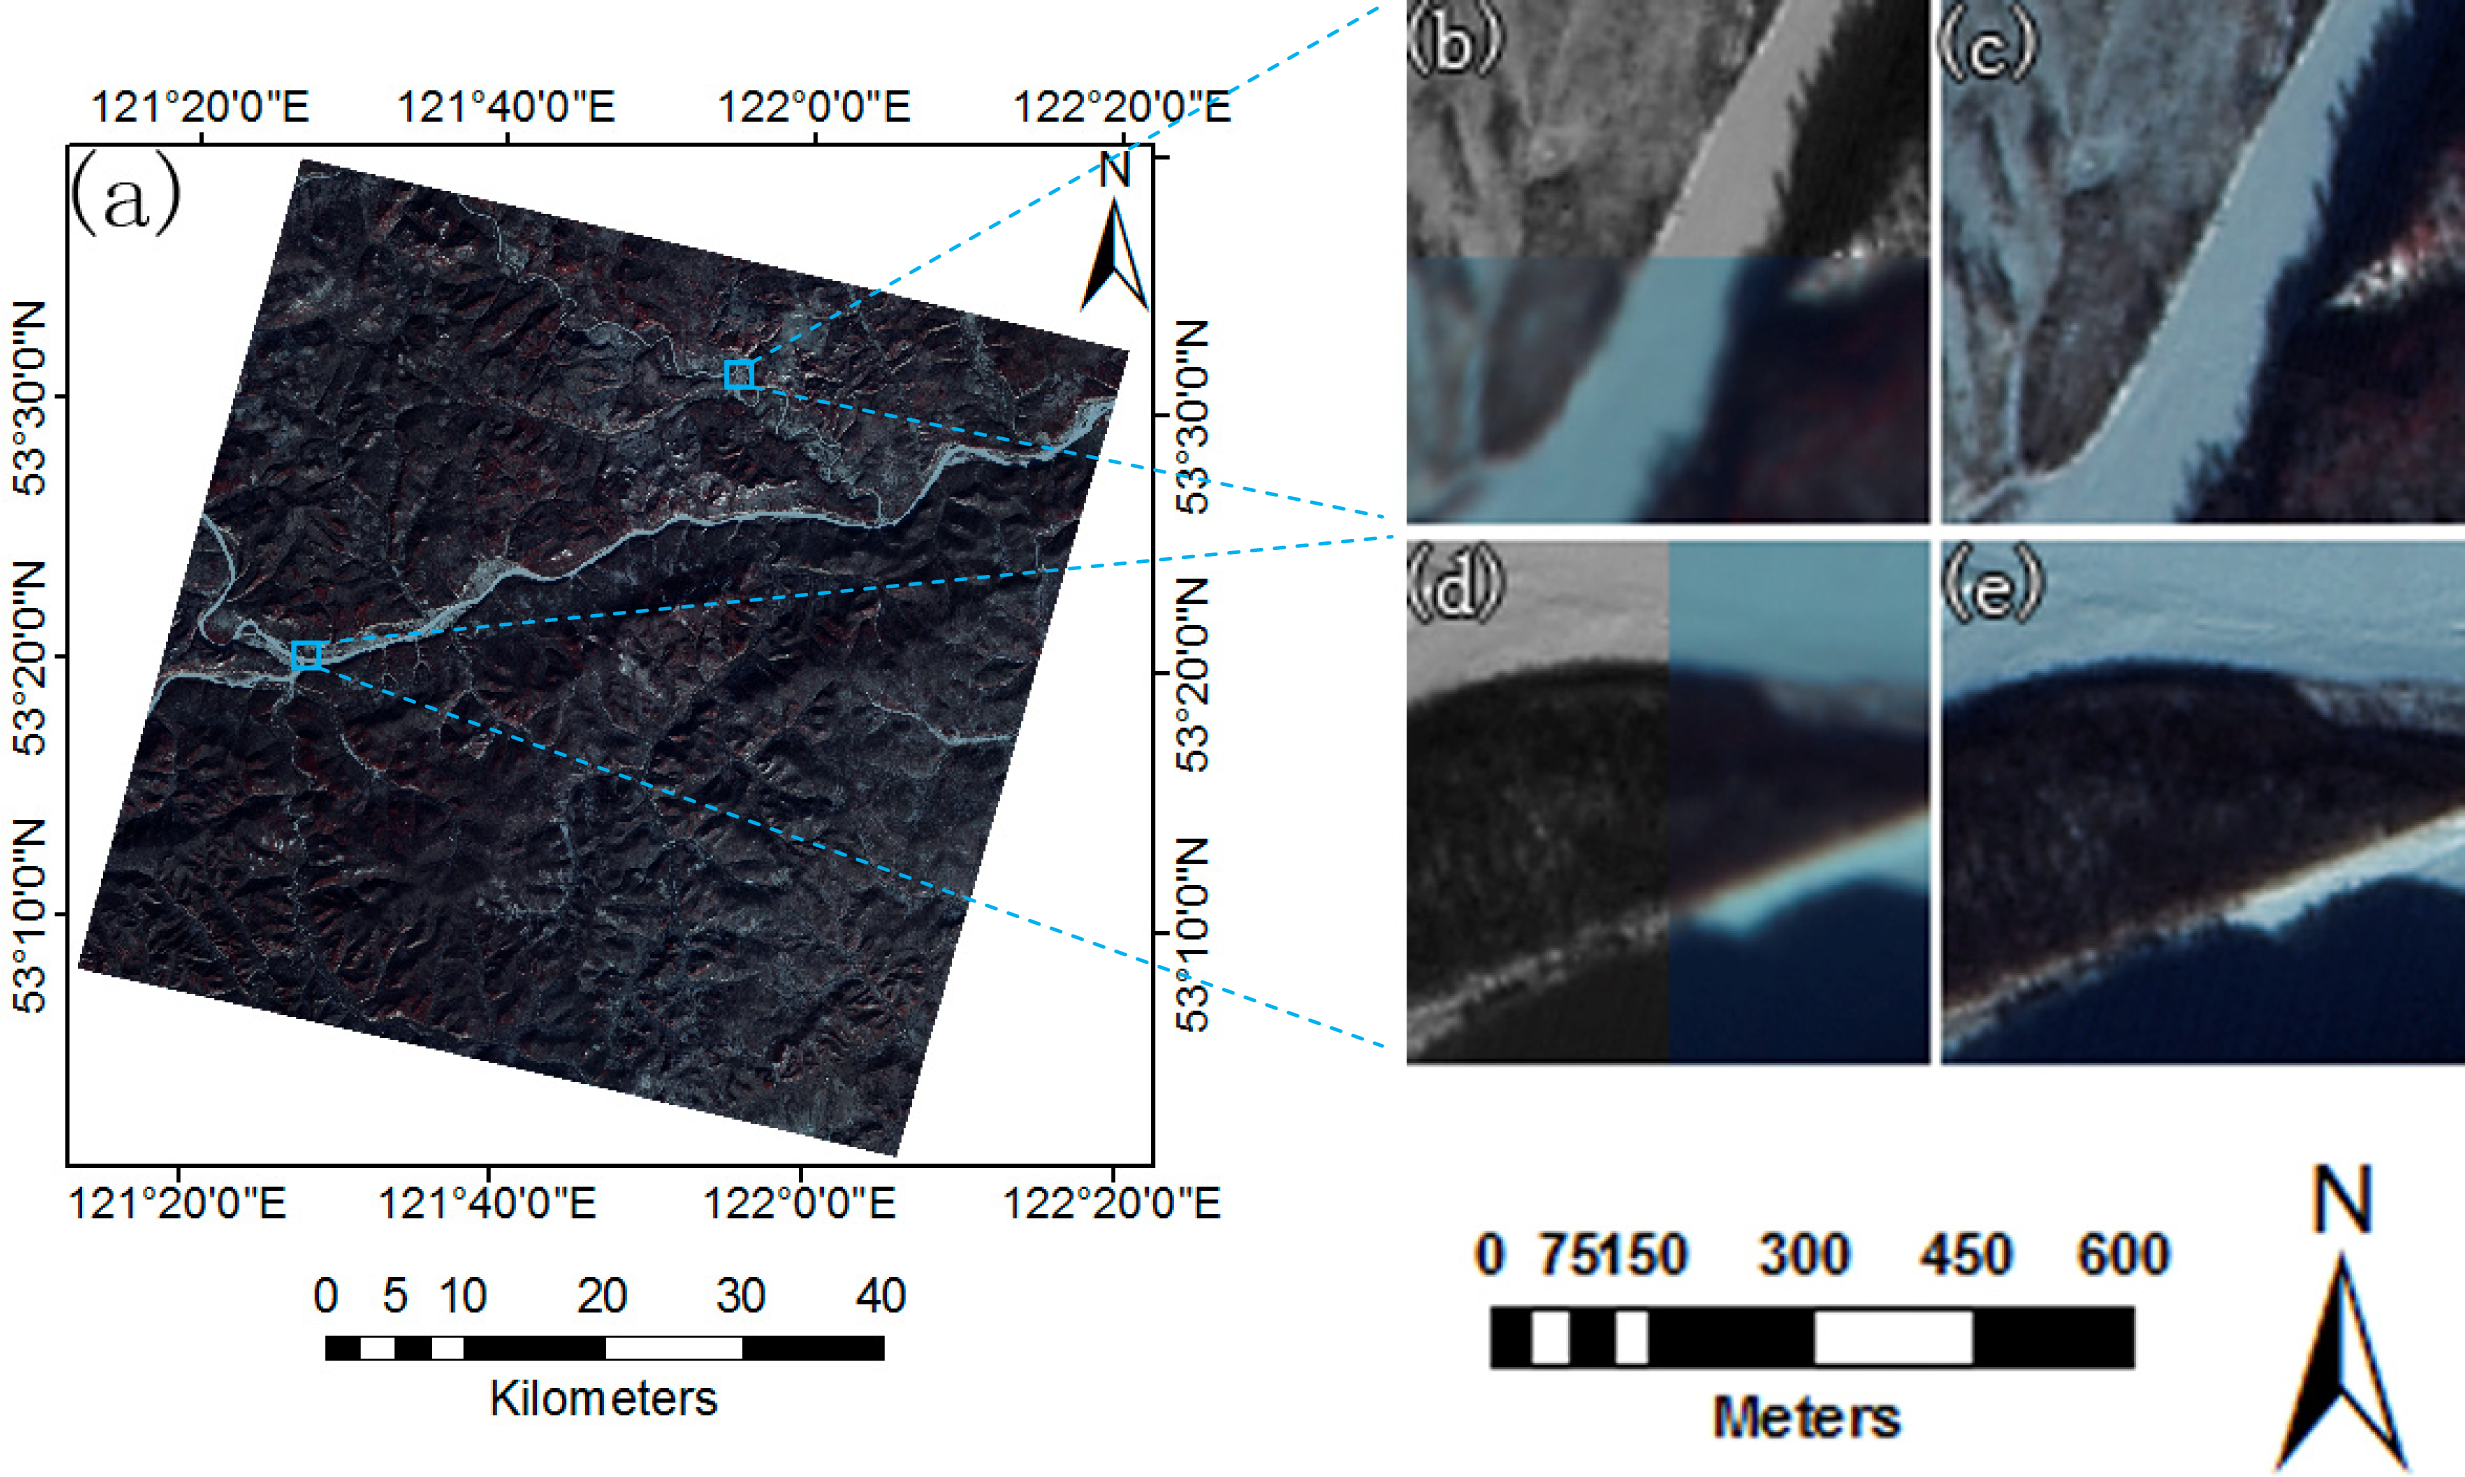
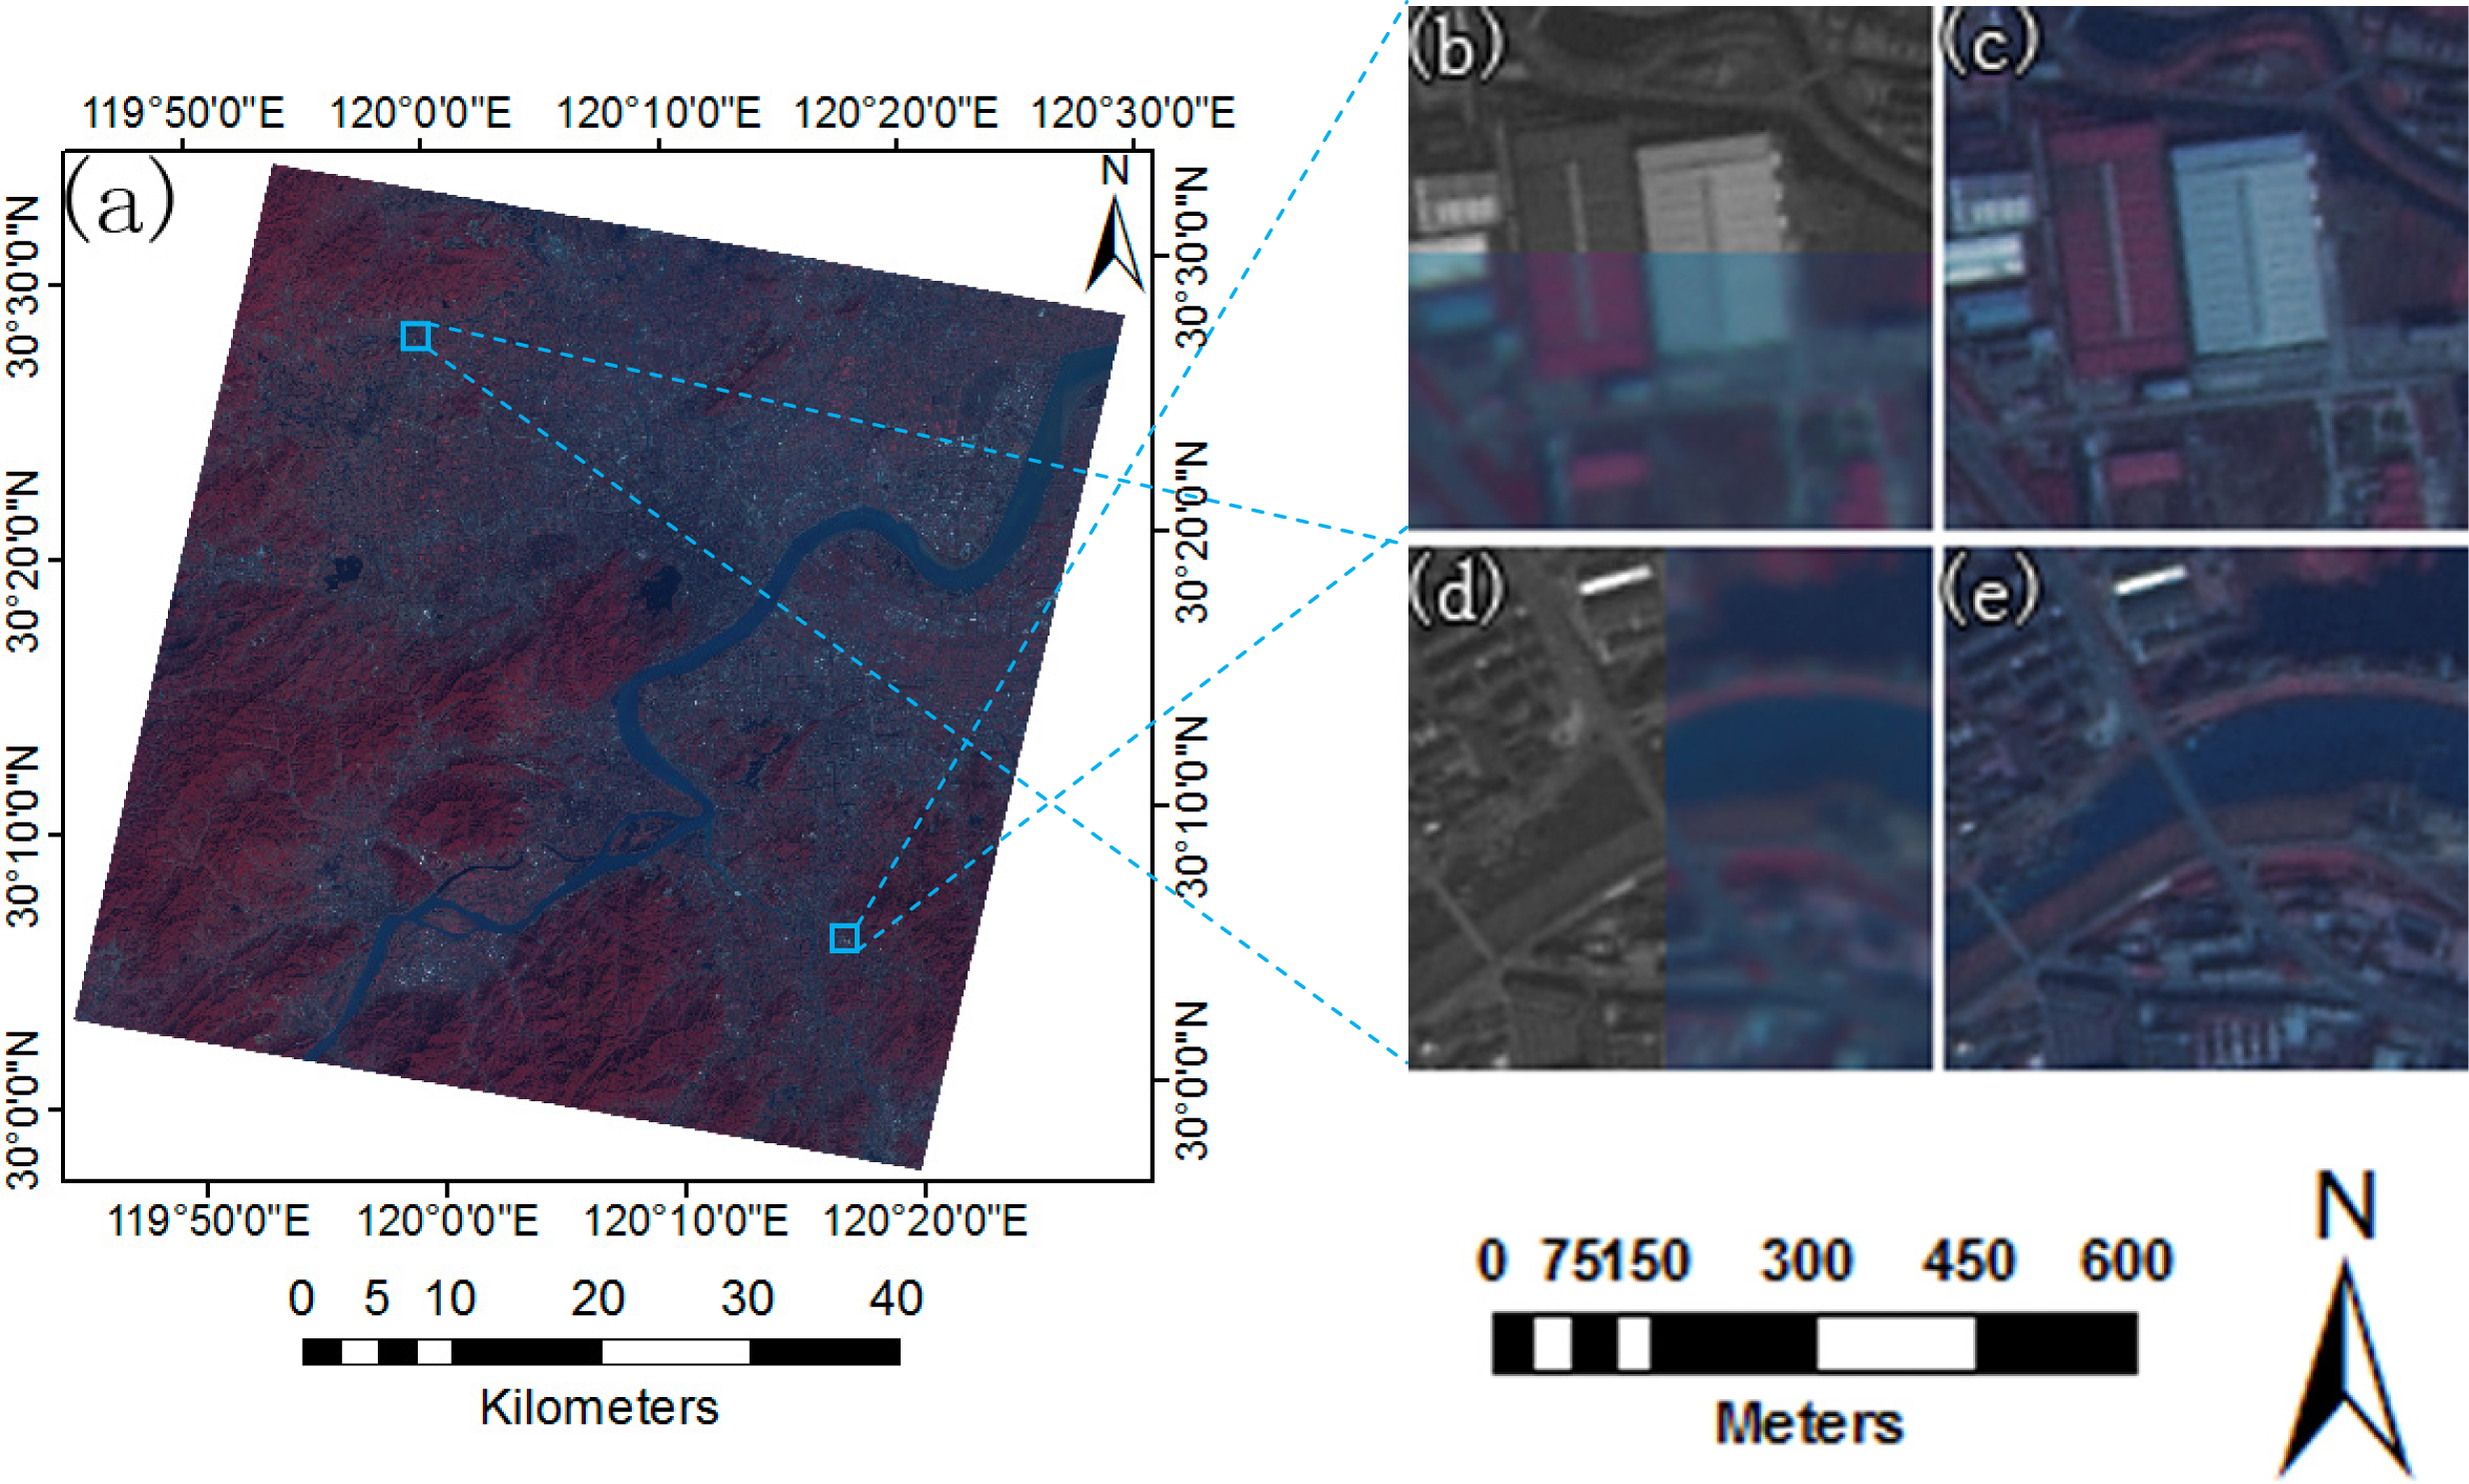
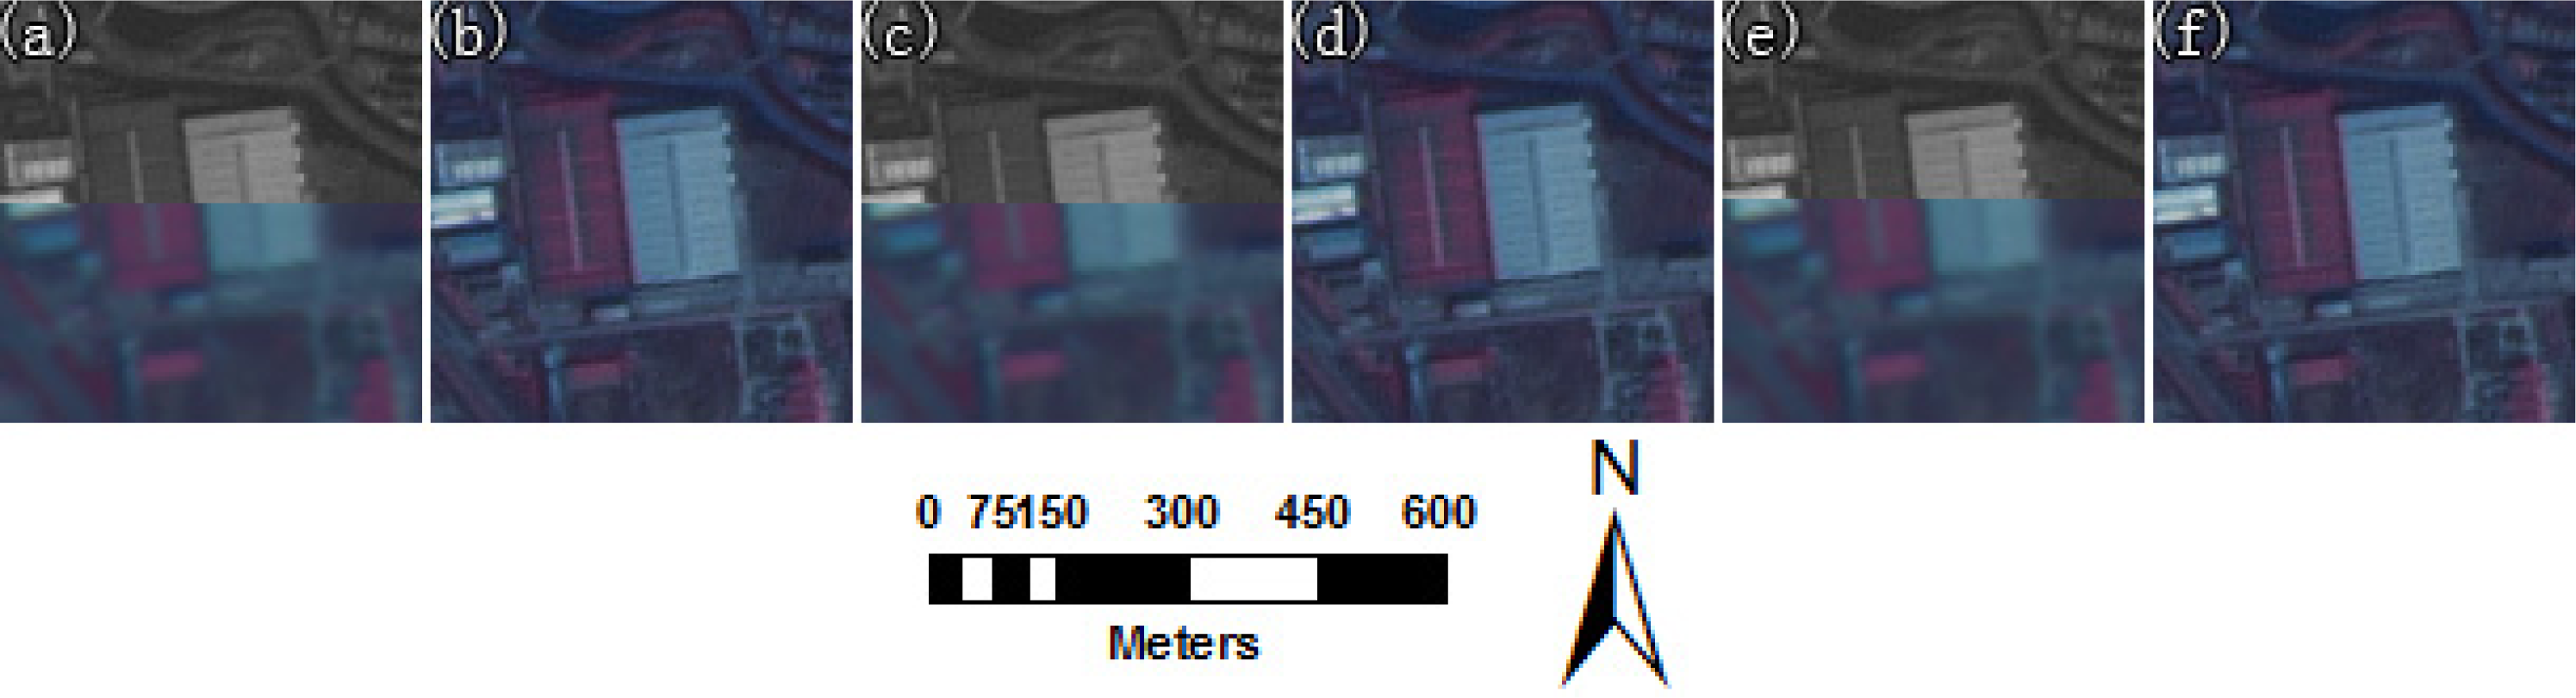
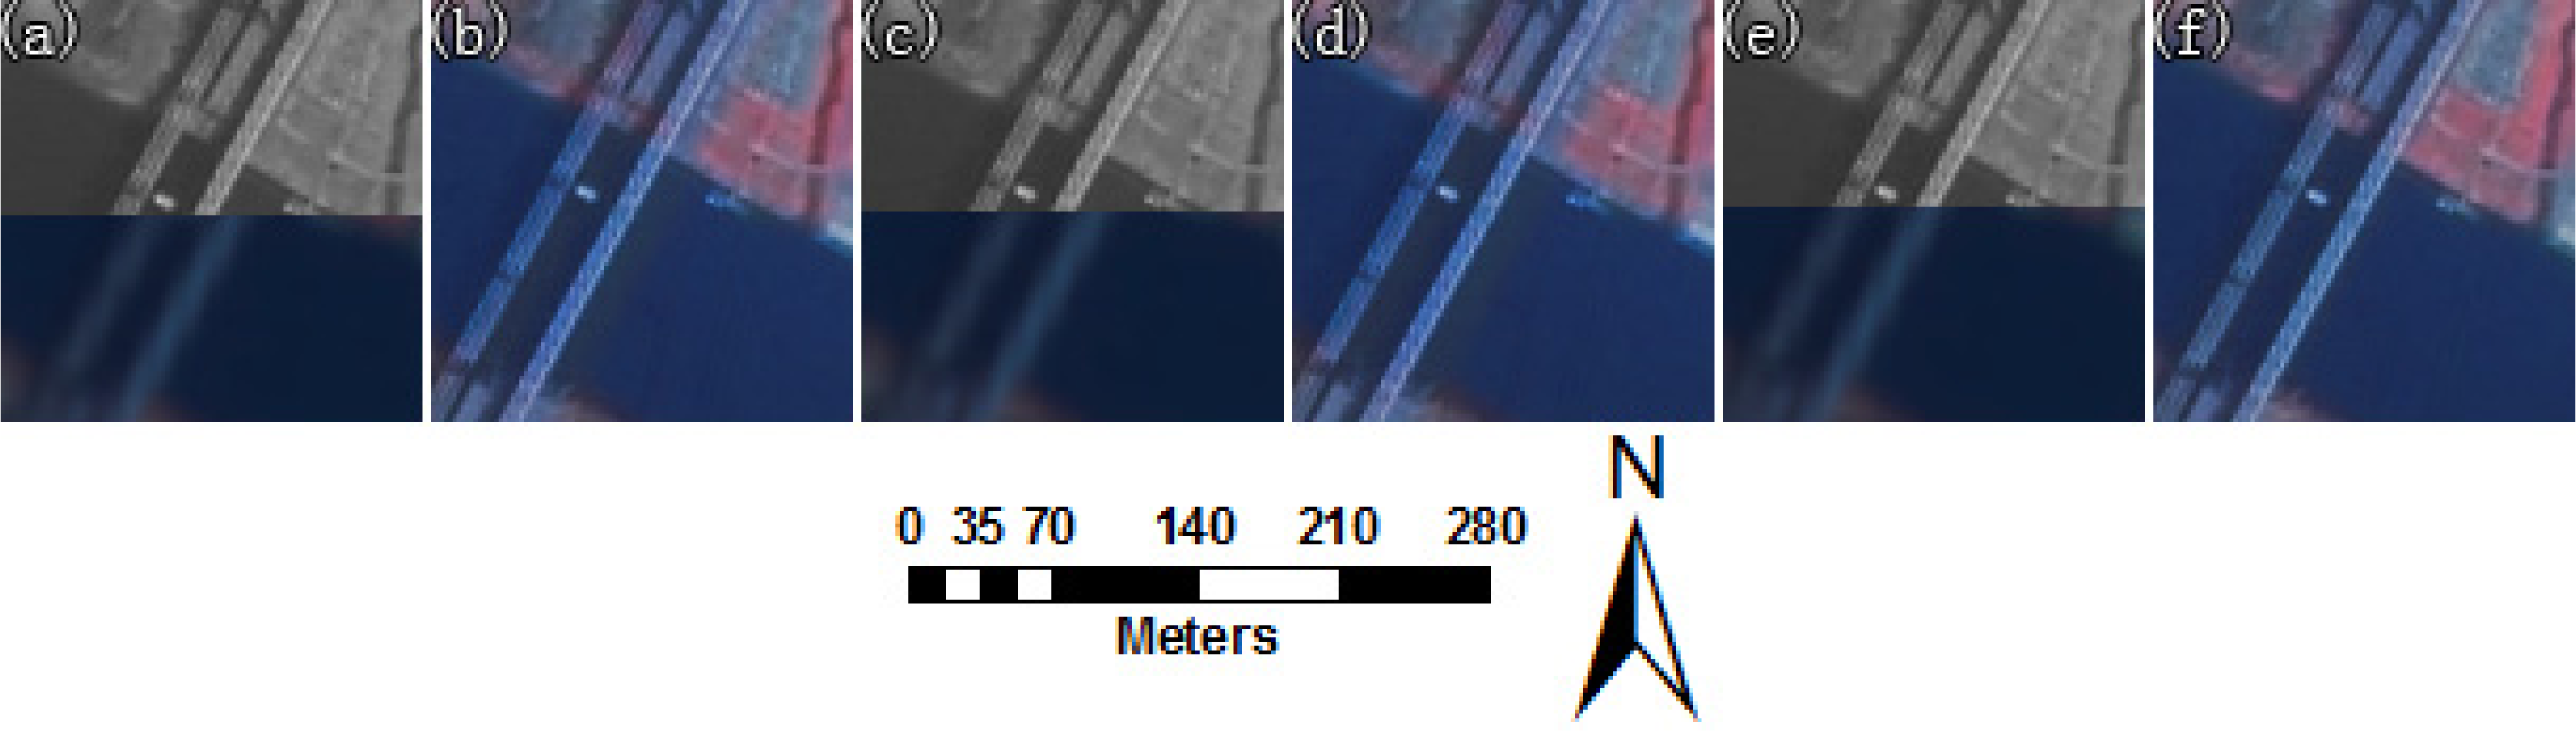
3.4. Results of Image Registration
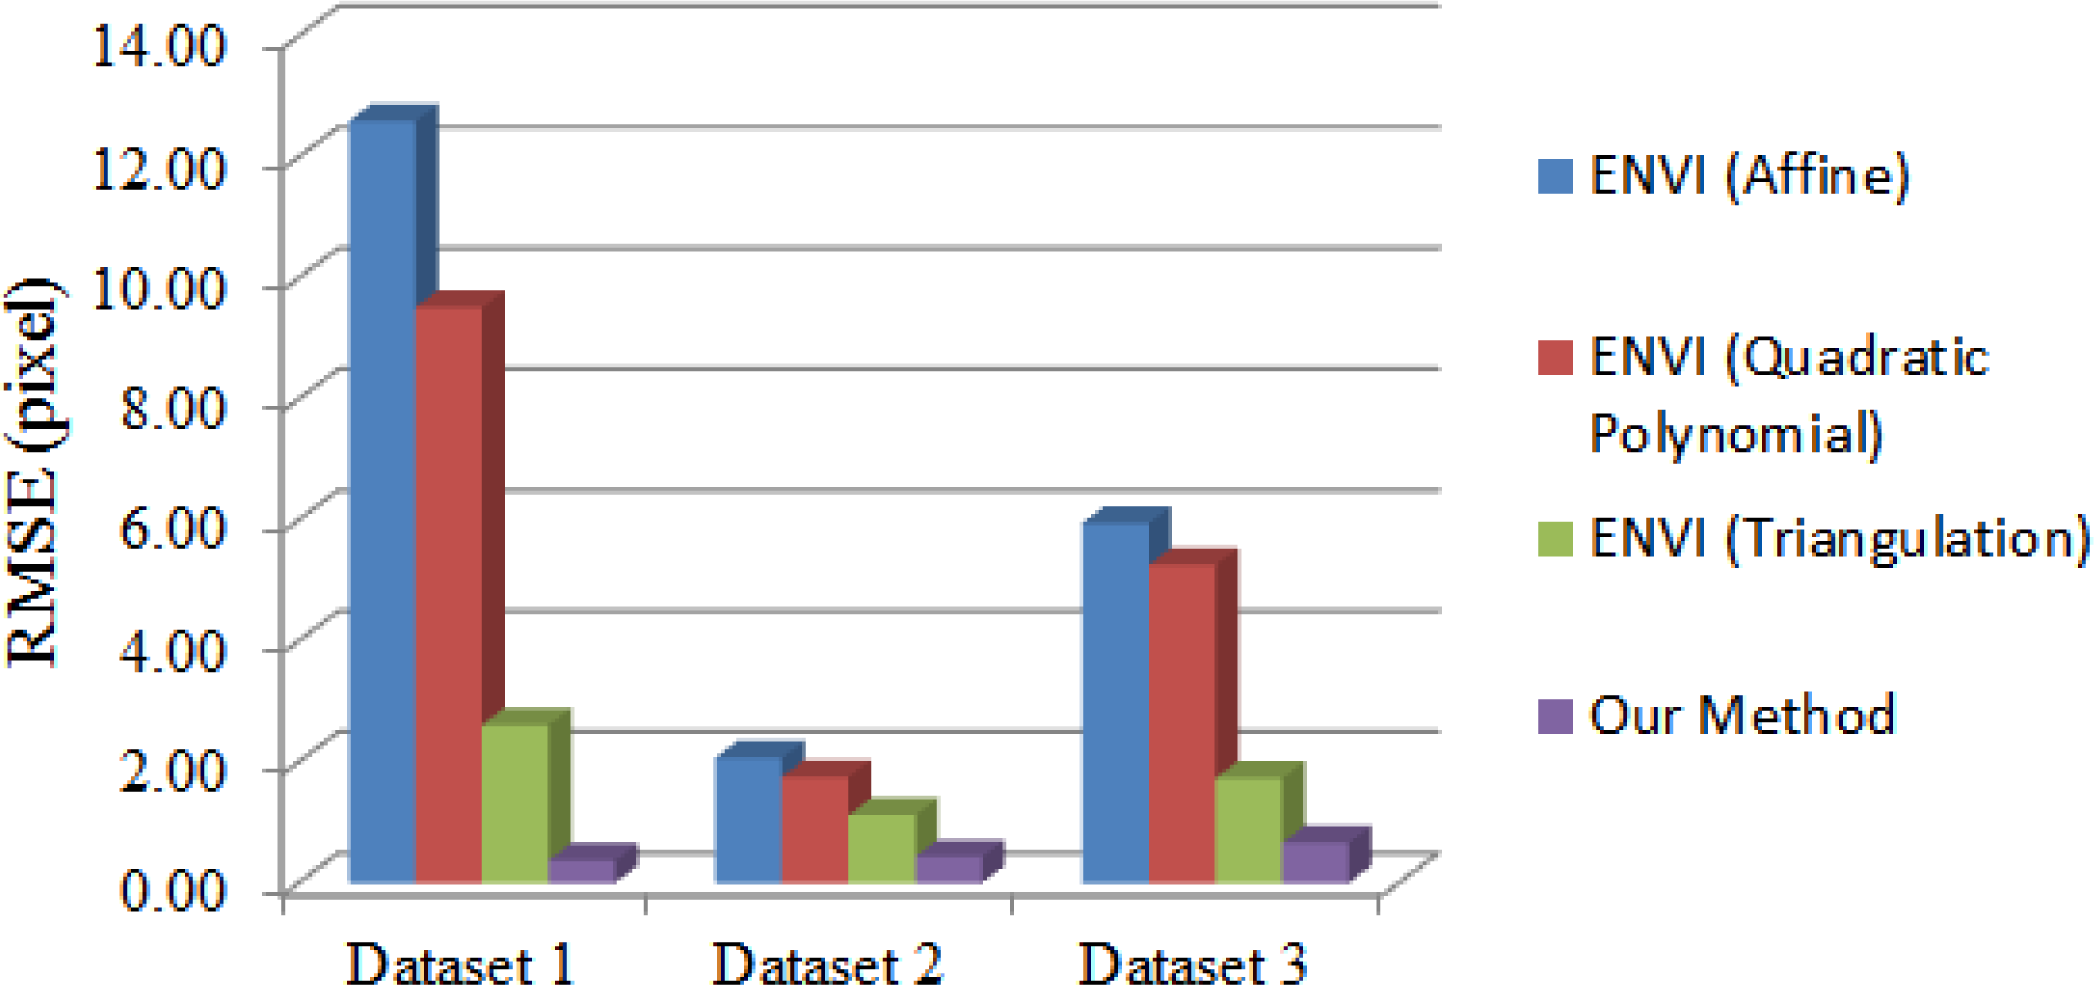
3.5. Efficiency and Accuracy Assessment
4. Discussion
4.1. About the Coarse-to-Fine Registration
4.2. Accuracies, Errors, and Uncertainties
5. Conclusions
Acknowledgments
Conflicts of Interest
References
- Brook, A.; Ben-Dor, E. Automatic registration of airborne and spaceborne images by topology map matching with SURF processor algorithm. Remote Sens 2011, 3, 65–82. [Google Scholar]
- Wang, P.; Qu, Z.; Wang, P.; Ying, H.; Zhen, K. A coarse-to-fine matching algorithm for FLIR and optical satellite image registration. IEEE Geosci. Remote Sens. Lett 2012, 9, 599–603. [Google Scholar]
- Wang, B.; Lu, Q.; Li, Y.; Li, F.; Bai, L.; Lu, G.; Lai, R. Image registration method for multimodal images. Appl. Opt 2011, 21, 1861–1867. [Google Scholar]
- Bunting, P.; Labrosse, F.; Lucas, R. A multi-resolution area-based technique for automatic multi-modal image registration. Image Vis. Comput 2010, 28, 1203–1219. [Google Scholar]
- Hasan, M.; Pickering, M.R.; Jia, X. Modified SIFT for Multi-Modal Remote Sensing Image Registration. Proceedings of the IEEE International Geoscience and Remote Sensing Symposium, Munich, Germany, 22–27 July 2012.
- Song, Z.L.; Zhang, J. Remote sensing image registration based on retrofitted SURF algorithm and trajectories generated from lissajous figures. IEEE Geosci. Remote Sens. Lett 2010, 7, 491–495. [Google Scholar]
- Al-Ruzouq, R.I. Data fusion of multi-source imagery based on linear features registration. Int. J. Remote Sens 2010, 31, 5011–5021. [Google Scholar]
- Yu, L.; Zhang, D.; Holden, E.J. A fast and fully automatic registration approach based on point features for multi-source remote-sensing images. Comput. Geosci 2008, 34, 838–848. [Google Scholar]
- Ma, J.; Chan, J.C.W.; Canters, F. Fully automatic subpixel image registration of multiangle CHRIS/proba data. IEEE Trans. Geosci. Remote Sens 2010, 48, 2829–2839. [Google Scholar]
- Hu, Z.; Gong, W.; Cai, Z. Multi-resolution remote sensing image registration using differential evolution with adaptive strategy selection. Opt. Eng 2012. [Google Scholar] [CrossRef]
- Loeckx, D.; Slagmolen, P.; Maes, F.; Vandermeulen, D.; Suetens, P. Nonrigid image registration using conditional mutual information. IEEE Trans. Med. Imaging 2010, 29, 19–29. [Google Scholar]
- Suri, S.; Reinartz, P. Mutual-information-based registration of terraSAR-X and ikonos imagery in urban areas. IEEE Trans. Geosci. Remote Sens 2010, 48, 939–949. [Google Scholar]
- Wong, A.; Clausi, D.A. ARRSI: Automatic registration of remote-sensing images. IEEE Trans. Geosci. Remote Sens 2007, 45, 1483–1493. [Google Scholar]
- Lemoine, G.; Giovalli, M. Geo-correction of high-resolution imagery using fast template matching on a GPU in emergency mapping contexts. Remote Sens 2013, 5, 4488–4502. [Google Scholar]
- Hong, G.; Zhang, Y. Wavelet-based image registration technique for high-resolution remote sensing images. Comput. Geosci 2008, 34, 1708–1720. [Google Scholar]
- Lee, S.R. A coarse-to-fine approach for remote-sensing image registration based on a local method. Int. J. Smart Sens. Intell. Syst 2010, 3, 690–702. [Google Scholar]
- Lowe, D.G. Distinctive image features from scale-invariant keypoints. Int. J. Comput. Vis 2004, 60, 91–110. [Google Scholar]
- Bay, H.; Ess, A.; Tuytelaars, T.; van Gool, L. Speeded-up robust features (SURF). Comput. Vis. Image Underst 2008, 110, 346–359. [Google Scholar]
- Cao, S.; Jiang, J.; Zhang, G.; Yuan, Y. An edge-based scale- and affine-invariant algorithm for remote sensing image registration. Int. J. Remote Sens 2013, 34, 2301–2326. [Google Scholar]
- Yang, Y.; Gao, X. Remote sensing image registration via active contour model. AEU-Int. J. Electron. Commun 2009, 63, 227–234. [Google Scholar]
- Huang, L.; Li, Z. Feature-based image registration using the shape context. Int. J. Remote Sens 2010, 31, 2169–2177. [Google Scholar]
- Mikolajczyk, K.; Schmid, C. A performance evaluation of local descriptors. IEEE Trans. Pattern Anal. Mach. Intell 2005, 27, 1615–1630. [Google Scholar]
- Zheng, Y.; Cao, Z.; Xiao, Y. Multi-spectral remote image registration based on SIFT. Electron. Lett 2008, 44, 107–108. [Google Scholar]
- Fan, B.; Huo, C.; Pan, C.; Kong, Q. Registration of optical and SAR satellite images by exploring the spatial relationship of the improved SIFT. IEEE Geosci. Remote Sens. Lett 2013, 10, 657–661. [Google Scholar]
- Li, Q.; Wang, G.; Liu, J.; Chen, S. Robust scale-invariant feature matching for remote sensing image registration. IEEE Geosci. Remote Sens. Lett 2009, 6, 287–291. [Google Scholar]
- Sima, A.A.; Buckley, S.J. Optimizing SIFT for matching of short wave infrared and visible wavelength images. Remote Sens 2013, 5, 2037–2056. [Google Scholar]
- Goncalves, H.; Corte-Real, L.; Goncalves, J.A. Automatic image registration through image segmentation and SIFT. IEEE Trans. Geosci. Remote Sens 2011, 49, 2589–2600. [Google Scholar]
- Wang, L.; Niu, Z.; Wu, C.; Xie, R.; Huang, H. A robust multisource image automatic registration system based on the SIFT descriptor. Int. J. Remote Sens 2012, 33, 3850–3869. [Google Scholar]
- Wu, Z.; Goshtasby, A. Adaptive image registration via hierarchical voronoi subdivision. IEEE Trans. Image Process 2012, 21, 2464–2473. [Google Scholar]
- Li, Y.; Davis, C.H. A Combined Global and Local Approach for Automated Registration of High-Resolution Satellite Images Using Optimum Extrema Points. Proceedings of the IEEE International Geoscience and Remote Sensing Symposium, Boston, MA, USA, 7–11 July 2008.
- Arévalo, V.; González, J. An experimental evaluation of non-rigid registration techniques on quickbird satellite imagery. Int. J. Remote Sens 2008, 29, 513–527. [Google Scholar]
- Fischler, M.A.; Bolles, R.C. Random Sample Consensus: A Paradigm for Model Fitting with Application to Image Analysis and Automated Cartography. Proceedings of the Communications of the ACM, New York, NY, USA, June 1981.
- Torr, P.H.S.; Zisserman, A. MLESAC: A new robust estimator with application to estimating image geometry. Comput. Vis. Image Understand 2000, 78, 138–156. [Google Scholar]
- Wong, A.; Clausi, D.A. AISIR: Automated inter-sensor/inter-band satellite image registration using robust complex wavelet feature representations. Pattern Recognit. Lett 2010, 31, 1160–1167. [Google Scholar]
- Gonzalez, R.C.; Woods, R.E. Digital Image Processing, 2nd ed; Prentice Hall Press: Upper Saddle River, NJ, USA, 2002. [Google Scholar]
- Ayoub, F.; Leprince, S.; Binet, R.; Lewis, K.W.; Aharonson, O. Influence of Camera Distortions on Satellite Image Registration and Change Detection Applications. Proceedings of the IEEE Geoscience and Remote Sensing Symposium, Boston, MA, USA, 7–11 July 1981.
- Farr, T.G.; Rosen, P.A.; Caro, E.; Crippen, R.; Duren, R.; Hensley, S.; Kobrick, M.; Paller, M.; Rodriguez, E.; Roth, L.; et al. The shuttle radar topography mission. Rev. Geophys 2007, 45. [Google Scholar] [CrossRef]
- Tao, C.V.; Hu, Y. A comprehensive study of the rational function model for photogrammetric processing. Photogramm. Eng. Remote Sens 2001, 67, 1347–1358. [Google Scholar]
- Hotelling, H. Analysis of a complex of statistical variables into principal components. J. Educ. Psychol 1933, 24, 417–441. [Google Scholar]
- Harris, C.; Stephens, M. A Combined Corner and Edge Detector. Proceedings of the 4th Alvey Vision Conference, Alvey, UK, 31 August–2 September 1988.
- Förstner, W.; Gülch, E. A Fast Operator for Detection and Precise Location of Distinct Points, Corners and Centres of Circular Features. Proceedings of the ISPRS Intercommission Conference on Fast Processing of Photogrammetric Data, Interlaken, Switzerland, 2–4 June 1987.
- Zhang, Y.; Xiong, J.; Hao, L. Photogrammetric processing of low-altitude images acquired by unpiloted aerial vehicles. Photogramm. Rec 2011, 26, 190–211. [Google Scholar]
- Ackermann, F. Digital image correlation: Performance and potential application in photogrammetry. Photogramm. Rec 1984, 11, 429–439. [Google Scholar]
- Zhang, Y.; Wang, B.; Duan, Y. An algorithm of gross error elimination in image matching for large rotation angle images. Geomat. Inf. Sci. Wuhan Univ 2013, 38, 1135–1138. [Google Scholar]
- Kang, Z.; Zlatanova, S. New Point Matching Algorithm for Panoramic Reflectance Images. Proceedings of the International Symposium on Multispectral Image Processing and Pattern Recognition, Wuhan, China, 15 November 2007.
- Kang, Z.; Li, J.; Zhang, L.; Zhao, Q.; Zlatanova, S. Automatic registration of terrestrial laser scanning point clouds using panoramic reflectance images. Sensors 2009, 9, 2621–2646. [Google Scholar]
- Lee, D.T.; Schachter, B.J. Two algorithms for constructing a delaunay triangulation. Int. J. Comput. Inform. Sci 1980, 9, 219–242. [Google Scholar]
- Chavezp, P.; Sides, S.C.; Anderson, J.A. Comparison of three different methods to merge multiresolution and multispectral data: Landsat TM and SPOT panchromatic. Photogramm. Eng. Remote Sens 1991, 57, 295–303. [Google Scholar]
- Gonçalves, H.; Gonçalves, J.A.; Corte-Real, L. Measures for an objective evaluation of the geometric correction process quality. IEEE Geosci. Remote Sens. Lett 2009, 6, 292–296. [Google Scholar]


| Dataset ID | Location | Track Number | Lat/Long | Date | Sensor | Resolution (m) |
|---|---|---|---|---|---|---|
| 1 | Mohe | 000589 | 121.8/53.3 | 1 February 2012 | PAN/MUX | 5.0/10.0 |
| 2 | Hangzhou | 000847 | 120.1/30.3 | 12 February 2012 | PAN/MUX | 5.0/10.0 |
| 3 | Tokyo | 000918 | 139.9/35.7 | 24 February 2012 | HR/MUX | 2.36/10.0 |
| Dataset ID | GSD (m) | Reference Image | Input Image | ||
|---|---|---|---|---|---|
| Sensor | Size | Sensor | Size | ||
| 1 | 5.0 | PAN | 15,119 × 14,318 | MUX | 15,136 × 14,505 |
| 2 | 5.0 | PAN | 14,534 × 13,882 | MUX | 14,528 × 13,926 |
| 3 | 2.5 | HR | 27,466 × 29,645 | MUX | 28,811 × 27,318 |
| Coordinate Difference | Minimum (pixel) | Maximum (pixel) | Mean (pixel) | |
|---|---|---|---|---|
| Dataset 1 | Δxgeo | 195.34 | 255.67 | 226.36 |
| Δygeo | 343.17 | 502.30 | 427.01 | |
| Dataset 2 | Δxgeo | 303.42 | 307.53 | 304.89 |
| Δygeo | 882.04 | 927.03 | 906.54 | |
| Dataset 3 | Δxgeo | 235.05 | 255.15 | 242.09 |
| Δygeo | 115.35 | 167.09 | 137.10 | |
| Coordinate Difference | Minimum (pixel) | Maximum (pixel) | Mean (pixel) | |
|---|---|---|---|---|
| Dataset 1 | Δxaffine | 5.10 | 21.24 | 14.62 |
| Δyaffine | 0.76 | 6.34 | 3.68 | |
| Dataset 2 | Δxaffine | 0.08 | 4.23 | 2.27 |
| Δyaffine | 0.03 | 6.74 | 1.73 | |
| Dataset 3 | Δxaffine | 0.64 | 21.03 | 9.91 |
| Δyaffine | 0.35 | 13.56 | 4.54 | |
| Method | RMSE (pixel) | |||
|---|---|---|---|---|
| Dataset 1 | Dataset 2 | Dataset 3 | ||
| ENVI | Affine | 12.59 | 2.07 | 5.95 |
| Quadratic Polynomial | 9.51 | 1.75 | 5.26 | |
| Triangulation | 2.61 | 1.12 | 1.73 | |
| Our method | 0.37 | 0.43 | 0.66 | |
© 2014 by the authors; licensee MDPI, Basel, Switzerland This article is an open access article distributed under the terms and conditions of the Creative Commons Attribution license ( http://creativecommons.org/licenses/by/3.0/).
Share and Cite
Chen, Q.; Wang, S.; Wang, B.; Sun, M. Automatic Registration Method for Fusion of ZY-1-02C Satellite Images. Remote Sens. 2014, 6, 157-179. https://doi.org/10.3390/rs6010157
Chen Q, Wang S, Wang B, Sun M. Automatic Registration Method for Fusion of ZY-1-02C Satellite Images. Remote Sensing. 2014; 6(1):157-179. https://doi.org/10.3390/rs6010157
Chicago/Turabian StyleChen, Qi, Shugen Wang, Bo Wang, and Mingwei Sun. 2014. "Automatic Registration Method for Fusion of ZY-1-02C Satellite Images" Remote Sensing 6, no. 1: 157-179. https://doi.org/10.3390/rs6010157