Earth Observation-Based Dwelling Detection Approaches in a Highly Complex Refugee Camp Environment — A Comparative Study

 ,
,
Abstract
: For effective management of refugee camps or camps for internally displaced persons (IDPs) relief organizations need up-to-date information on the camp situation. In cases where detailed field assessments are not available, Earth observation (EO) data can provide important information to get a better overview about the general situation on the ground. In this study, different approaches for dwelling detection were tested using the example of a highly complex camp site in Somalia. On the basis of GeoEye-1 imagery, semi-automatic object-based and manual image analysis approaches were applied, compared and evaluated regarding their analysis results (absolute numbers, population estimation, spatial pattern), statistical correlations and production time. Although even the results of the visual image interpretation vary considerably between the interpreters, there is a similar pattern resulting from all methods, which shows same tendencies for dense and sparse populated areas. The statistical analyses revealed that all approaches have problems in the more complex areas, whereas there is a higher variance in manual interpretations with increasing complexity. The application of advanced rule sets in an object-based environment allowed a more consistent feature extraction in the area under investigation that can be obtained at a fraction of the time compared to visual image interpretation if large areas have to be observed.1. Introduction
At the end of 2012, the United Nations High Commissioner for Refugees (UNHCR) [1] estimated about 45.2 million displaced people on a global scale, including 15.4 million refugees, 937,000 asylum seekers and 28.8 million internally displaced persons (IDPs). The IDPs who are not considered as urban IDPs (∼13 million according to the International Federation of Red Cross and Red Crescent Societies (IFRC) [2]) usually gather in camps, because they lost or had to leave their homes due to complex conflict situation, man-made or natural disasters. Living in those camps is often extremely difficult. In many cases, refugees and IDPs are not able to enjoy their human rights and there is typically only limited access to food, water, sanitation and shelter [3].
For the management of refugee or IDP camps, humanitarian relief organizations require up-to-date information about the situation on the ground [4,5]. In this context, both the number of people living in a camp and the population change over time are crucial factors. Thus, the provision of population estimates and the monitoring of population dynamics in a camp support humanitarian aid with respect to better organization, planning and not least conflict preparedness and prevention. Population estimates can be derived in several ways depending upon the security situation and the capacity of involved organizations and authorities. Especially for cases in which field assessments are either unsafe (due to conflict situations) or provide false population estimates (due to stakeholder bias created by inflation in the numbers of refugees, or conversely, political leaders who desire to minimize the numbers of IDPs), Earth observation (EO) data can provide important information which may assist camp planning and monitoring activities [4,6,7]. In some situations, satellite imagery is the only reliable source of information. In the case of population estimation, very high spatial resolution (VHR) optical satellite data can be used to detect dwellings in a camp. An approximate figure of the number of people living in a camp can then be derived either based on estimated occupancy rates usually given by relief organizations or local non-governmental organizations (NGOs) or by area sampling methods. Alternatively and/or complementary to visual image interpretation of VHR data, several studies have demonstrated that automated methods can be successfully used for dwelling detection (e.g., [8–13]). One of the first studies analyzing the population and camp area by VHR data was conducted by Bjørgo [8,9]. He demonstrated that VHR multispectral satellite data can be used to provide geographic information on refugee camps and their environment. Bjørgo [8] showed that an estimation of population based on populated area derived from VHR data is possible, but he also concludes that “a more complicated, but potentially more accurate, method of estimating population via remote sensing is through dwelling unit counts and corresponding in situ information on the number of persons occupying each dwelling unit” ([8] p. 615f., referring to Watkins and Morrow-Jones [14]). To date, several case studies were applied to many different camp sites all over the world. A very detailed research was conducted by Giada et al. [10], who examined the refugee camp Lukole in Tanzania using pan-sharpened IKONOS images with one meter ground sample distance (GSD). Visual image interpretation and four computer-assisted procedures (two pixel-based and two object-based) for shelter counting were compared to each other using accuracy and analysis time as metrics. Further research was done to develop automatic image analysis procedures for the identification of refugee dwellings and their spatial extent. Lang et al. [11] for example tested an object-based application and a mathematical morphology-based algorithm for the refugee camp Goz Amer in Chad with pan-sharpened QuickBird imagery (0.6 m GSD) for counting shelters. Kemper et al. [13] also used mathematical morphology for the detection of dwelling structures in three camps in Darfur based on GeoEye-1 imagery (0.5 m GSD). They demonstrated that the implementation of a robust and consistent method for the estimation of the total number of dwellings in a complex environment is possible. Furthermore, Lang et al. [12] presented methods for rapid population estimation, camp structure analysis and ex post investigations of camp evolution in order to support effective crisis management. In case different analysis approaches are applied for one study site [10,11,15], a comparison can be conducted.
Recently, Checchi et al. [16] examined the validity and feasibility of displaced population estimation based on manual counting of residential structures in a variety of different sites and phases of displacement using VHR imagery. Population estimations in this study were based on publicly available estimates of the mean number of people per structure. Checchi et al. [16] showed that such an approach can achieve reasonable precision in sites where individual structures are distinguishable and no other significant barrier for manual interpretation (e.g., clouds, vegetation) is present. However, very complex sites, characterized by connected buildings, dense complex roof patterns, or temporary shelters sharing the same roof or tarpaulin, revealed the limitations of this approach. In such complex environments, not only the completeness of the dwelling extraction but also the comparison between the manual interpretations differed significantly.
This paper deals with dwelling detection for population estimation in the Afgooye corridor, a hardly accessible and highly complex area, characterized by a dense pattern of dwelling roofs, different material used, mainly small structures (e.g., traditional round huts and tent-like structures) with minimal or no street separation and chaotic layout. Due to lack of access (security issues) and the provision of exaggerated figures, no reliable field information is available for this area [17]. EO-based assessments are the only way to provide objective information on the amount of dwellings for estimating the number of IDPs living in the area. This information is of high interest for humanitarian organizations working in the field. Due to the complexity of the study site and the absence of reliable reference data, three different institutions have been involved in the analyses in order to derive information on the camp situation and to gain insights on the reliability and consistency of the results. The main focus is set on the application and comparison of different analysis approaches for dwelling extraction including visual and semi-automatic methods as well as a combination of both. The analyses results were compared to each other in respect to their absolute numbers, population estimates, spatial patterns, statistical correlations and production time. Thus, this paper examines the applicability of the three different approaches for handling very complex structures.
2. Study Area and Data
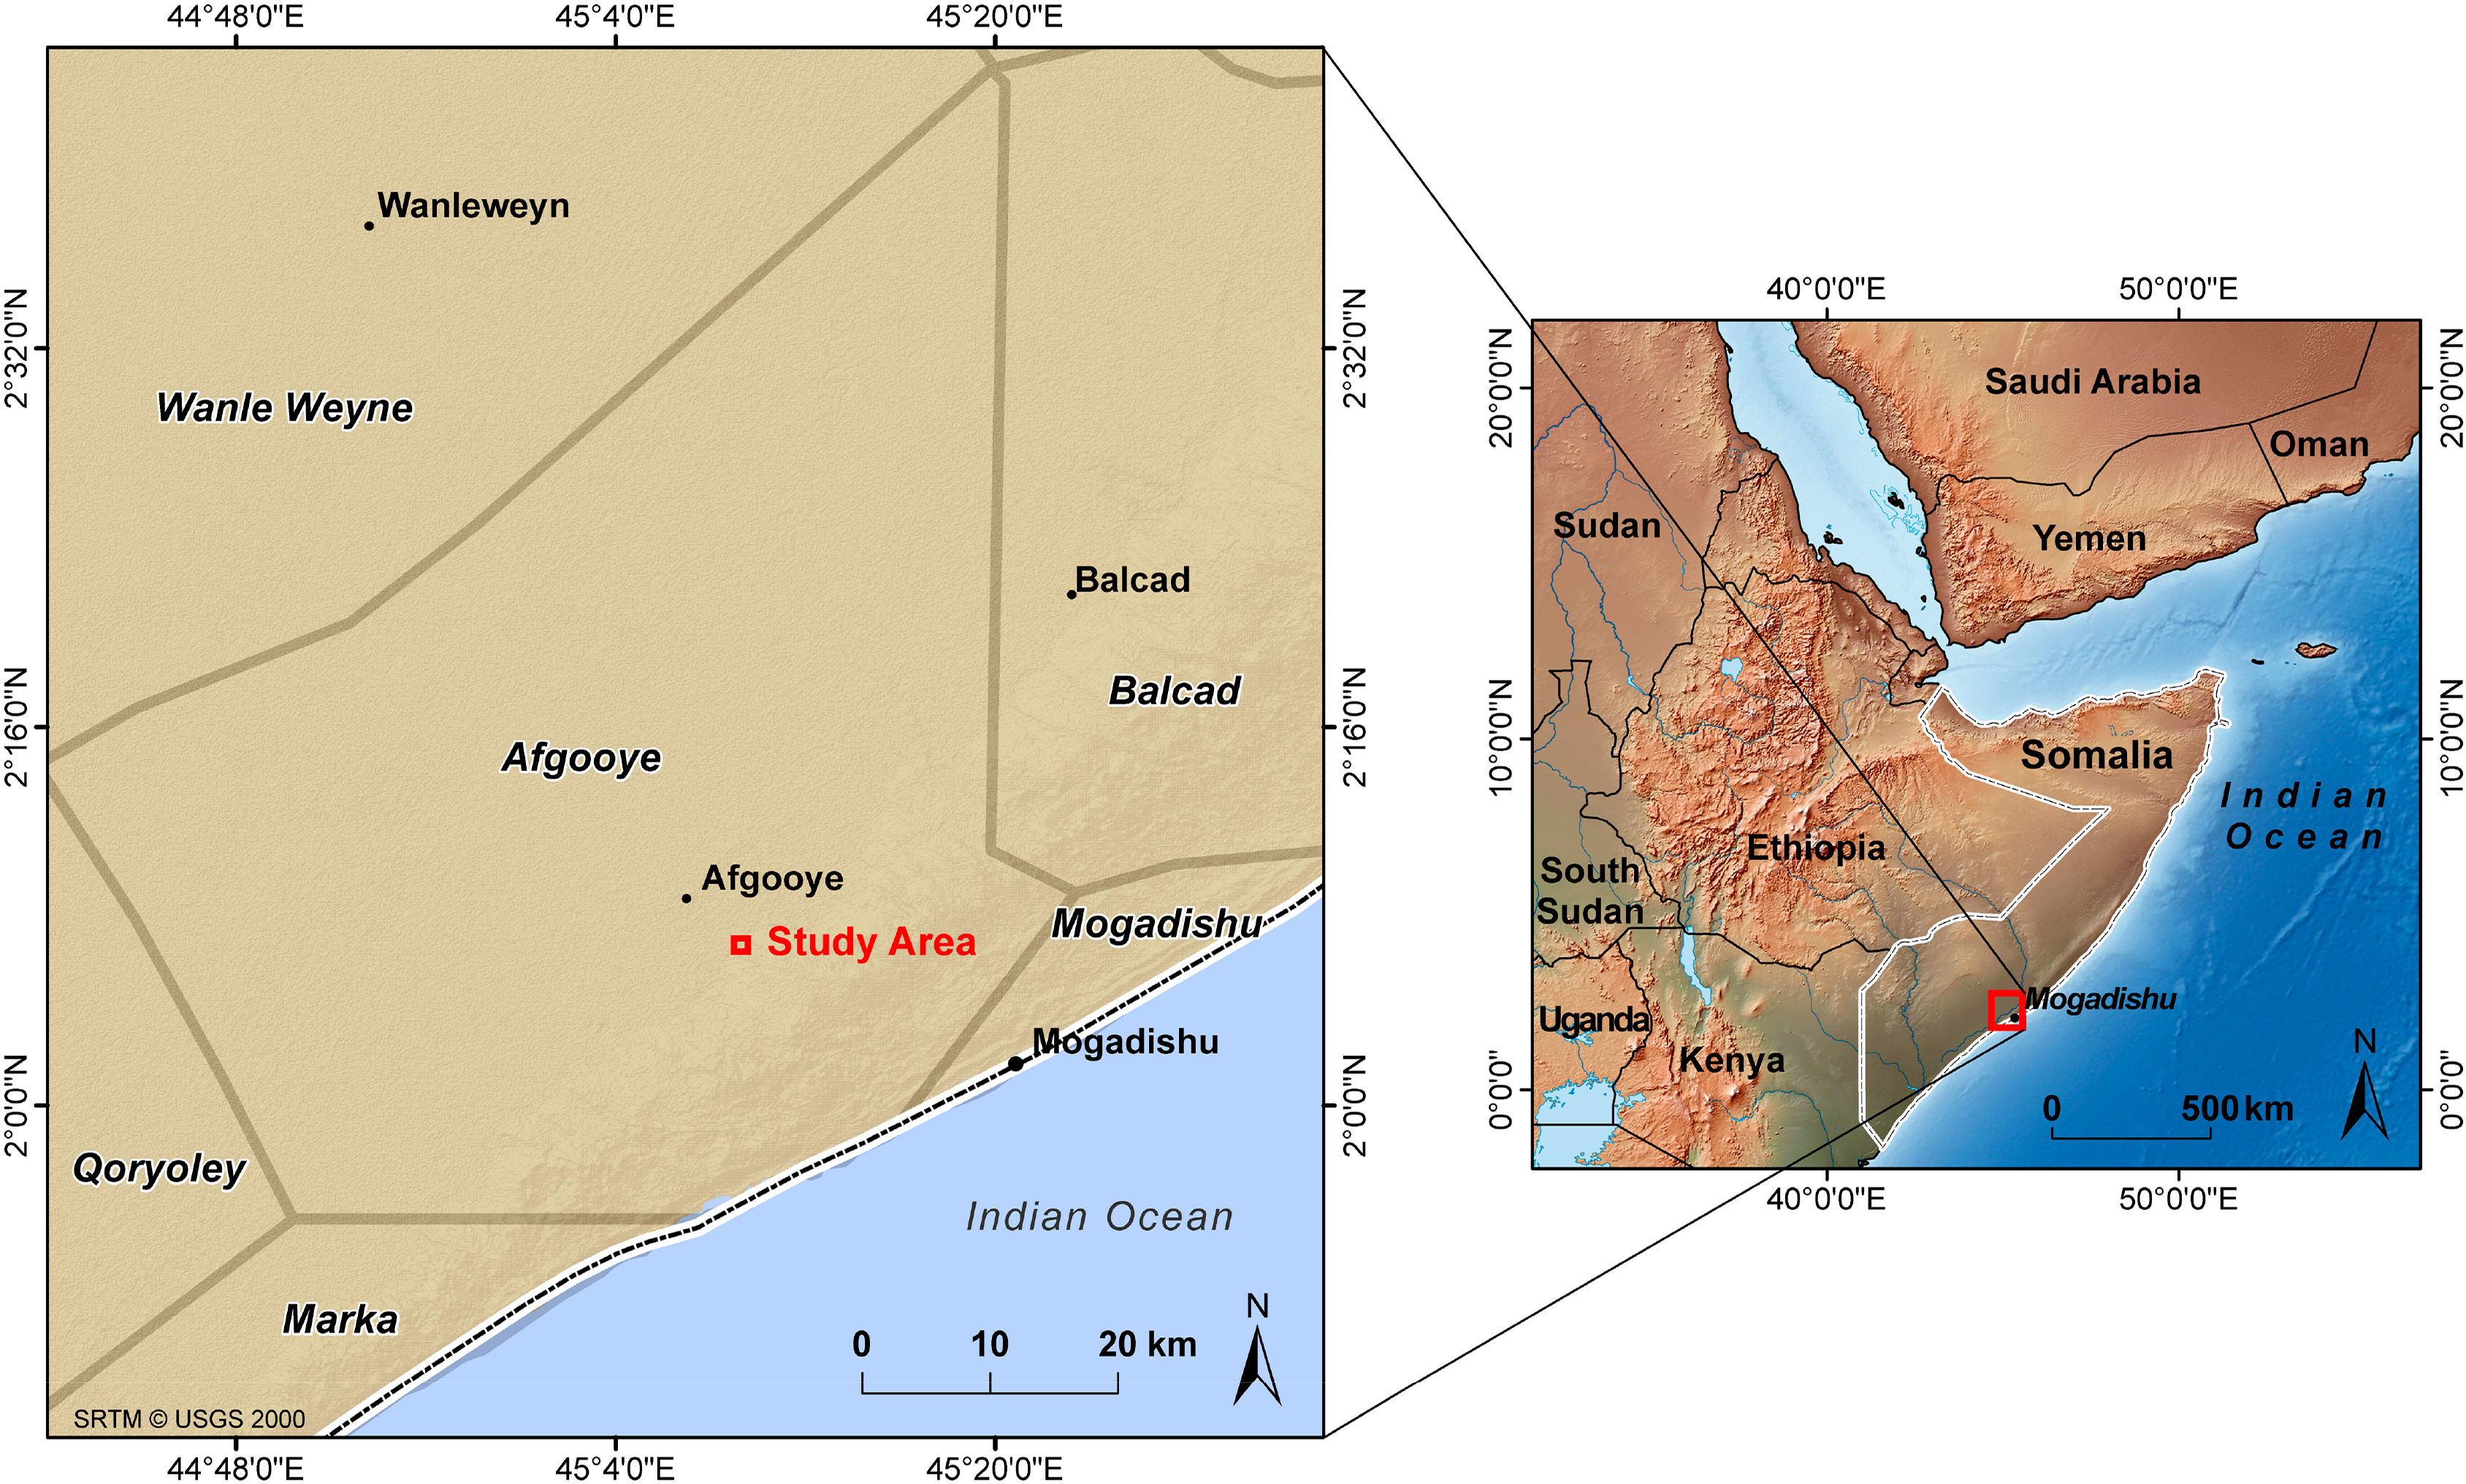
The study area is located in the Afgooye District in the Lower Shabelle region in south-eastern Somalia north-west of Mogadishu (see Figure 1). The test area covers about 1 km × 1 km of an IDP camp situated in the Afgooye corridor between longitudes 45°9.0′E and 45°9.55′E and latitudes 2°6.5′N and 2°7.1′N.
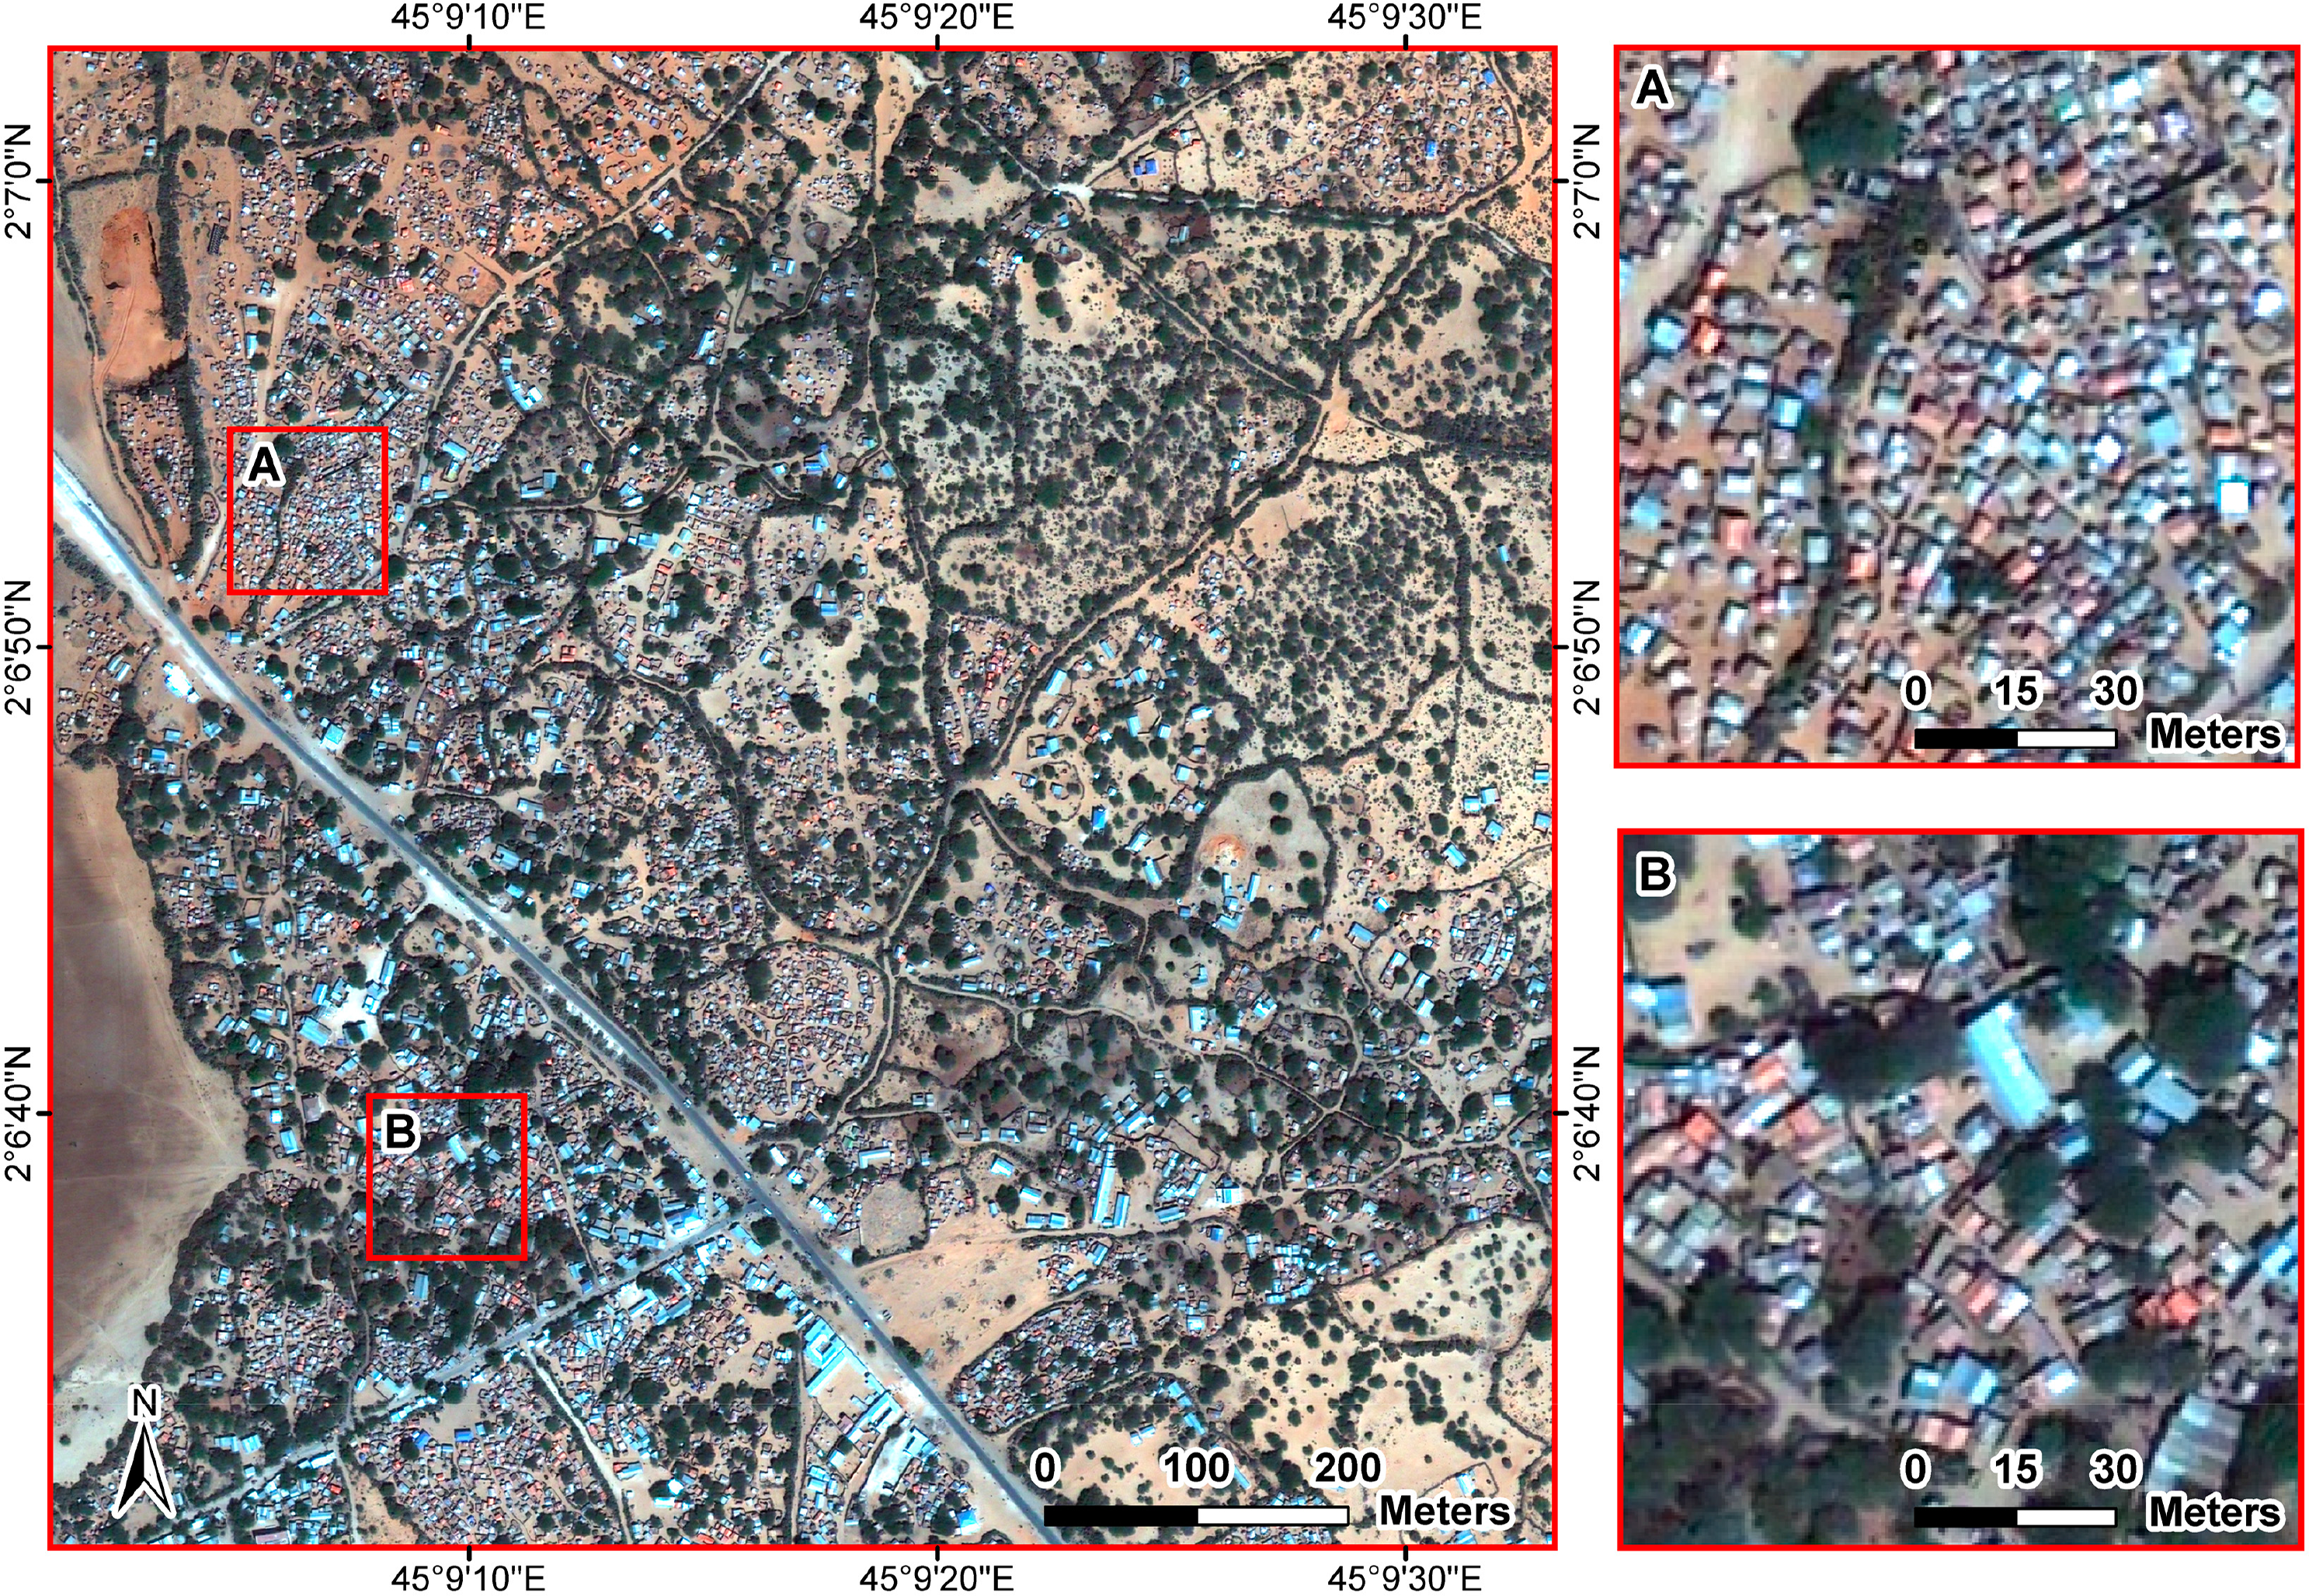
The Afgooye corridor expands about 25 km along the road from Mogadishu to Afgooye town and is characterized by many spontaneous established camps. In consequence of the high influx of people due to the increasingly tense situation in Mogadishu, the Afgooye corridor has become the third largest urban area in Somalia with about 410,000 people [18]. Living conditions in this region are extremely difficult. As the security situation does not allow humanitarian agencies to enter the area, people in need are only assisted by a few local partners but are mostly on their own [18]. The study area is characterized by a complex spatial pattern of settlements (see Figure 2), composed of small rectangular dwellings and tent-like structures, traditional round huts, tents and buildings of variable size and material. Most parts of the camp are characterized by a high dwelling density and in many cases there is no clear demarcation between structures other than different roof materials or variations in building orientation.
The EO data used for the remote sensing analyses comprise VHR GeoEye-1 data acquired on 5 January 2011 (© GeoEye Inc. 2011 © GCME 2011, provided under EC/ESA GSC-DA) (see Figure 2). The dataset includes a four band multispectral image with 2.0 m spatial resolution and a corresponding panchromatic scene with 0.5 m spatial resolution. Pre-processing steps applied to the imagery include orthorectification to UTM Zone 38N (WGS 84) as well as pan-sharpening of the multispectral bands to 0.5 m spatial resolution. Orthorectification was done with the software Keystone using an image from 2008 as reference and SRTM-data as DEM. Pan-sharpening was carried out using a PC-based algorithm implemented in Erdas Imagine.
Furthermore, UNHCR population figures [17] that provide information on the estimated occupancy rate per shelter/building were used to calculate the population living in the test area. In 2010, UNHCR [17] carried out a population assessment in the Mogadishu periphery, including the Afgooye corridor. Since field based assessments were not successful due to exaggerated data collected at the field level, human errors and lack of access, satellite imagery and population figures from two different sources were used for the population estimation. The figures on the average number of people per temporary shelter were obtained by taking an average between SAACID data collected from an assessment in Lafoole, Afgooye corridor, in 2009 and UN-HABITAT data, obtained from an urban assessment (including IDP settlements within the area) of Hargeysa between 2004 and 2008. The UN-HABITAT data was also used in order to establish the average number of people per m2 for buildings. The resulting numbers used for the UNHCR assessment are 3.28 persons per temporary shelter and 0.0744 persons per m2 for semi-permanent/permanent buildings. It has to be noted that these numbers are only assumptions with significant uncertainty, since the numbers of people living in shelters/buildings in Lafoole and especially in Hargeysa could well be different from Afgooye. However, the UNHCR [17] states that “on the basis of the consistency of the data with SAACID, the general context of different IDP settlements within Somalia can be assumed to be of no major variation” (p. 2) and “the margin of error was concluded to be small in comparison to the potential error margin associated with surveying the buildings on the ground, due to inflated gate keeper figures” (p. 2). Considering the UNHCR assumptions and due to the fact that no other data was available, the UNHCR figures were used for this study.
3. Methodology
As illustrated in Figure 3, three different analysis approaches have been applied for dwelling detection comprising (i) visual image interpretation (rapid and precise, three different institutions, six independent interpreters); (ii) semi-automatic image analysis (two different approaches from two institutions, two independent interpreters); (iii) combined approach: semi-automatic image analysis with manual refinement (two different approaches from two institutions, two independent interpreters). Each approach was conducted by different interpreters, according to their expertise. While the visual image interpretation was done by all involved organizations, the semi-automatic analysis was only conducted by Z_GIS and DLR. All interpreters performed the analyses independently. Even within each institution, the visual image interpretation(s) and the semi-automatic analyses were conducted by different persons. In order to obtain comparable results of all interpreters, a specific framework describing rules of actions was set up. Settlement structures have been classified in categories defined as (i) buildings, represented as polygons, objects being greater than 20 m2; (ii) shelters, represented as points, structures smaller than 20 m2, whereas points and polygons must not overlap each other. Since no field information on building type was available, no further distinction (e.g., health facilities, commercial buildings) could be done. There was also no information if a building/shelter is inhabited or not, thus all detected buildings/shelters were assumed to be dwellings. However, very small shelters, which are assumed to more likely be animal shelters or storage sheds, have not been taken into account in the analyses. The persons who conducted the visual image interpretations were not involved in semi-automatic extraction work in order to reduce potential bias.
The analysis results were compared to each other by conducting a detailed evaluation and statistical analyses. For a better spatial comparison of the results, dwelling density maps were calculated additionally by aggregating dwellings to regular grids. Furthermore, the different approaches were compared in respect of their production time.
A detailed description of the methods used is given in the following.
3.1. Visual Image Interpretation
In order to evaluate the analysis results, a precise visual image interpretation with considerable time effort was conducted by two very experienced persons of Metria. Both had already been involved in other analyses of the Afgooye corridor. The interpretation was done by one person and then controlled by the second expert, manually digitizing visible shelters and buildings according to the above mentioned criteria. Furthermore, more rapid visual analyses have been done independently by four other interpreters. The analysis was done using the software ArcGIS (ESRI). For a more systematic procedure the visual image interpretations were assisted by grid overlays separating the whole area of interest in smaller units. The grid cells were then analyzed step by step.
3.2. Semi-Automatic Image Analysis
Besides digitizing features of interest, semi-automatic image analysis was conducted by Z_GIS and DLR applying object-based image analysis approaches (OBIA, cf. [19]) using the software eCognition (Trimble Geospatial). OBIA provides a methodological framework for machine-based interpretation of complex classes defined by spectral, spatial, structural, and hierarchical properties [12].
Both organizations used independently developed expert rule sets for automated information extraction, which need to be coded explicitly. In the eCognition software environment, these rule sets are coded in a specific modular programming language, called CNL (Cognition Network Language). CNL allows (image-) object handling within a vertical and horizontal hierarchy. This means the possibility to address individual objects (e.g., to merge or split individual objects based on spectral or geometrical properties or based on the sub- or super-objects in the multi-scale hierarchy), including the adaptation of segmentation or regionalization routines. The data model behind is an object-oriented, topological enabled model (cf. [20]). Rule-based classifiers are used for knowledge representation, making explicit the required spectral and geometrical properties as well as spatial relationships for advanced class modeling [21]. In general, special focus of rule sets for dwelling extraction is set on robustness and transferability to different camp types, regions and/or satellite sensors. This objective is difficult to achieve since refugee camps adapt to different natural and political conditions and thus differ considerably in structure, materials and building density. Furthermore, variations due to different satellite sensors and data acquisition times have to be considered. Consequently, parameters have to be adapted to some degree to specific camps and datasets. Promising attempts to reduce the effort to adapt parameterization include the use of relative spectral values, form descriptors and the development of easier to parameterize so called master rule sets [22]. Master rule sets are generic rule sets designed for fast adaptation of fixed thresholds, e.g., spectral thresholds, class definitions, are defined as initial variables. This is similar to classical software development and allows the encapsulation of the rule sets in combination with a graphical user interface (GUI) for faster and interactive parameter adaptation (see also [23]).
DLR and Z_GIS have substantial experience in automated dwelling extraction using OBIA techniques (e.g., [12,15,19,22–26]). Although some of the experiences were collected within joint research projects, the rule set development of both institutions was conducted completely independently. Both organizations selected a rule set based approach instead of a sample based supervised classification of objects.
The rule sets used by Z_GIS are described in detail in Tiede et al. [23] and built upon three main components:
(1) The aforementioned definition of master rule sets [22] to reduce the time needed for the adaptation of rule sets if transferred to other camps or other time intervals: The rule sets are designed in that way that thresholds (i.e., thresholds for e.g., spectral values, geometrical values or class definitions) are defined as initial variables. This is similar to classical software development and allows the encapsulation of the rule sets in combination with a graphical user interface (GUI) for parameter adaptation; (2) The use of adapted segmentation techniques (cf. [12,22]) incorporating edge filtering algorithms as additional parameters for class descriptions of anthropogenic elements (cf. [27]); This overcomes the problem that standard segmentation techniques were not sufficient to achieve a satisfactory delineation of dwelling structures (especially in complex areas and focusing on feature extraction instead of wall-to-wall segmentations). Class modelling techniques are applied such as cyclic object combination, building on an initial segmentation, and stepwise classification based on parameterized regionalization techniques for a better delineation of the target structures (here: dwellings); (3) Transferability improvement by reducing absolute thresholds: As much as possible, the rule sets make use of relative differences regarding spectral information as well as spatial characteristics [22]. For example, the identification of bright dwelling structures is defined relative to darker neighbors, or dark object structures (fences, dark huts) can be distinguished through shape descriptors (length/width ratio and similar), leading to a reduction of fixed thresholds in the rule set. Still, some parameters like an NDVI threshold and separation values between the main dwelling structures need to be set.
Similar to the approach of Z_GIS, DLR also applied a previously developed rule set based on variables. The fast adaptation of thresholds guarantees a straightforward transferability to different test sites which is supported by an easy to handle graphical user interface design solution. The combination of different segmentation techniques such as basic chess-board segmentation and multi-parameter driven multi-resolution segmentation allows the analysis of large data sets and reduces the computation time. The feature extraction is based on supervised rule-based classification of the image objects by means of expert knowledge and cyclic optimization. The complex class descriptions are mainly based on spectral and geometrical features as well as ratios. Final class improvement includes advanced reshaping algorithms (e.g., pixel-based object resizing) to derive near real world objects of interest.
3.3. Semi-Automatic Image Analysis with Manual Refinement
Additionally to the above mentioned approaches, the results of the semi-automatic image analysis have been further analyzed by visual image interpretation and refined by manual editing in order to reduce most obvious classification errors.
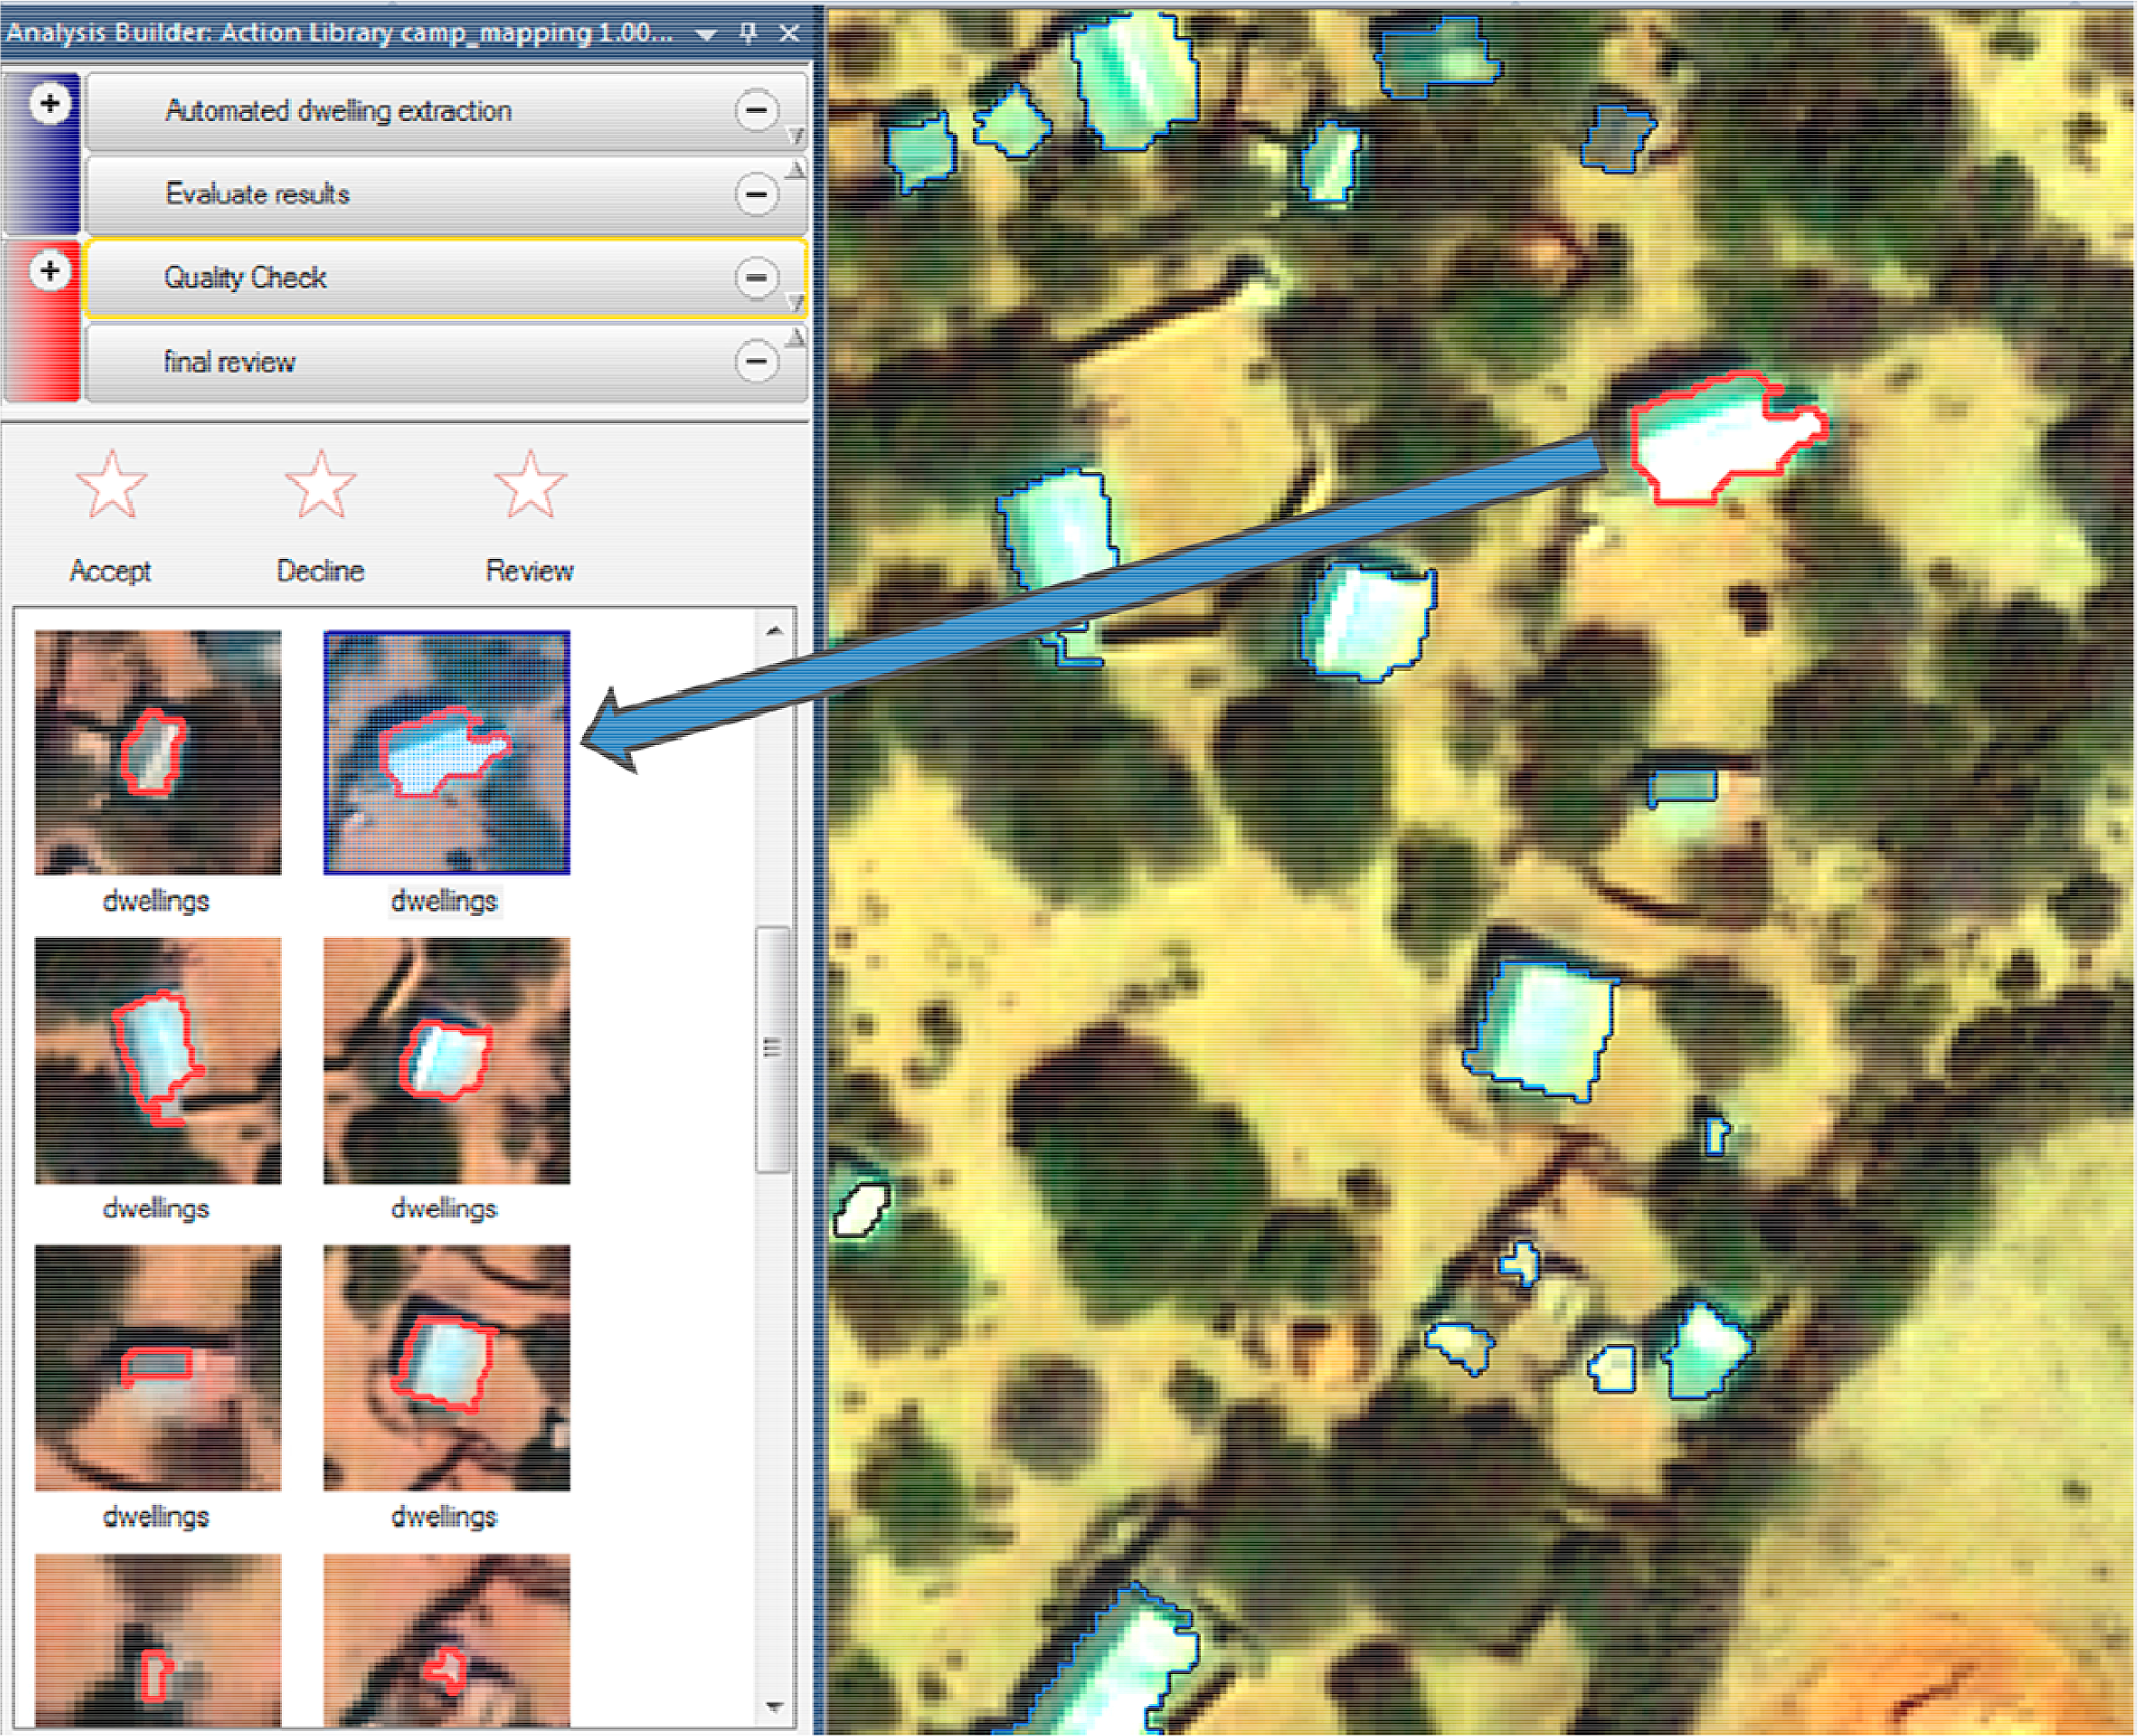
The manual editing of the semi-automatic image analysis results of DLR was performed using the eCognition manual editing tool with focus on adding/deleting misclassified objects more than on improving the form of the objects. For their visual refinement, Z_GIS set up a semi-automatic application using an easy to use GUI (graphical user interface) programmed as eCognition Architect solution (see Figure 4) to allow a fast one-click refinement of the extracted/not-extracted objects and more convenient validation possibilities. No digitizing of objects was necessary since pre-segmented objects were provided by the automated algorithms. Post-processing was done by an additional automated rule set (merge and export the final results, including a new separation between large and small dwellings).
3.4. Population Estimation
The estimation of the number of people living in the study area was calculated by multiplying the number of shelters/buildings with estimated occupancy rates given by the UNHCR [17], i.e., 3.28 persons per shelter and 0.0744 persons per m2 for buildings.
3.5. Evaluation of Approaches
In order to evaluate the quality of a classification, the results should be compared to geographical data that is assumed to be true (reference data). Usually, this data is derived from the field. Since no reference data was available for the study area, a very precise visual image interpretation of the study site was performed (see Section 3.1). The resulting numbers which are assumed to be most accurate are used as a benchmark for the evaluation of analysis results. Nevertheless with regard to several sources of error such as subjectivity in visual image interpretation, difficulties due to bad image quality or high complexity of the study site, such comparisons always have to be treated with caution. Particularly regarding the wide range of visual image interpretation results, it is obvious that no real reference could be created. However, these results can be used as a benchmark.
For a better spatial comparison of the results, the extracted features have been aggregated to 100 m × 100 m grid cells showing the density/pattern of shelters in a natural breaks classification. The aggregation is based on points (in the case of shelters) or the centroid of a polygon (in the case of buildings). If a dwelling is located on the boundary of different grid cells, it is randomly distributed to one of the grids. Furthermore, statistical analyses have been conducted in order to assess the correlation between the most precise interpretation (benchmark) and the other visual and semi-automatic results.
For evaluating the performance of the different feature extraction methods, the analysis results have been compared in respect of their production time (composed of the time for the parameter adaptation of the initial rule sets and the computation time). Furthermore, the change in production time with regard to a potential increase of the study area has been estimated. Thereby, it is assumed that for the visual method the change in production time is linearly dependent on the change in area, while the production time for the semi-automatic interpretation and the combined approach has been estimated by assuming that the automatic part of the time is constant (for the similar area and similar imagery) whereas the editing part (manual refinement) scales linearly.
4. Results
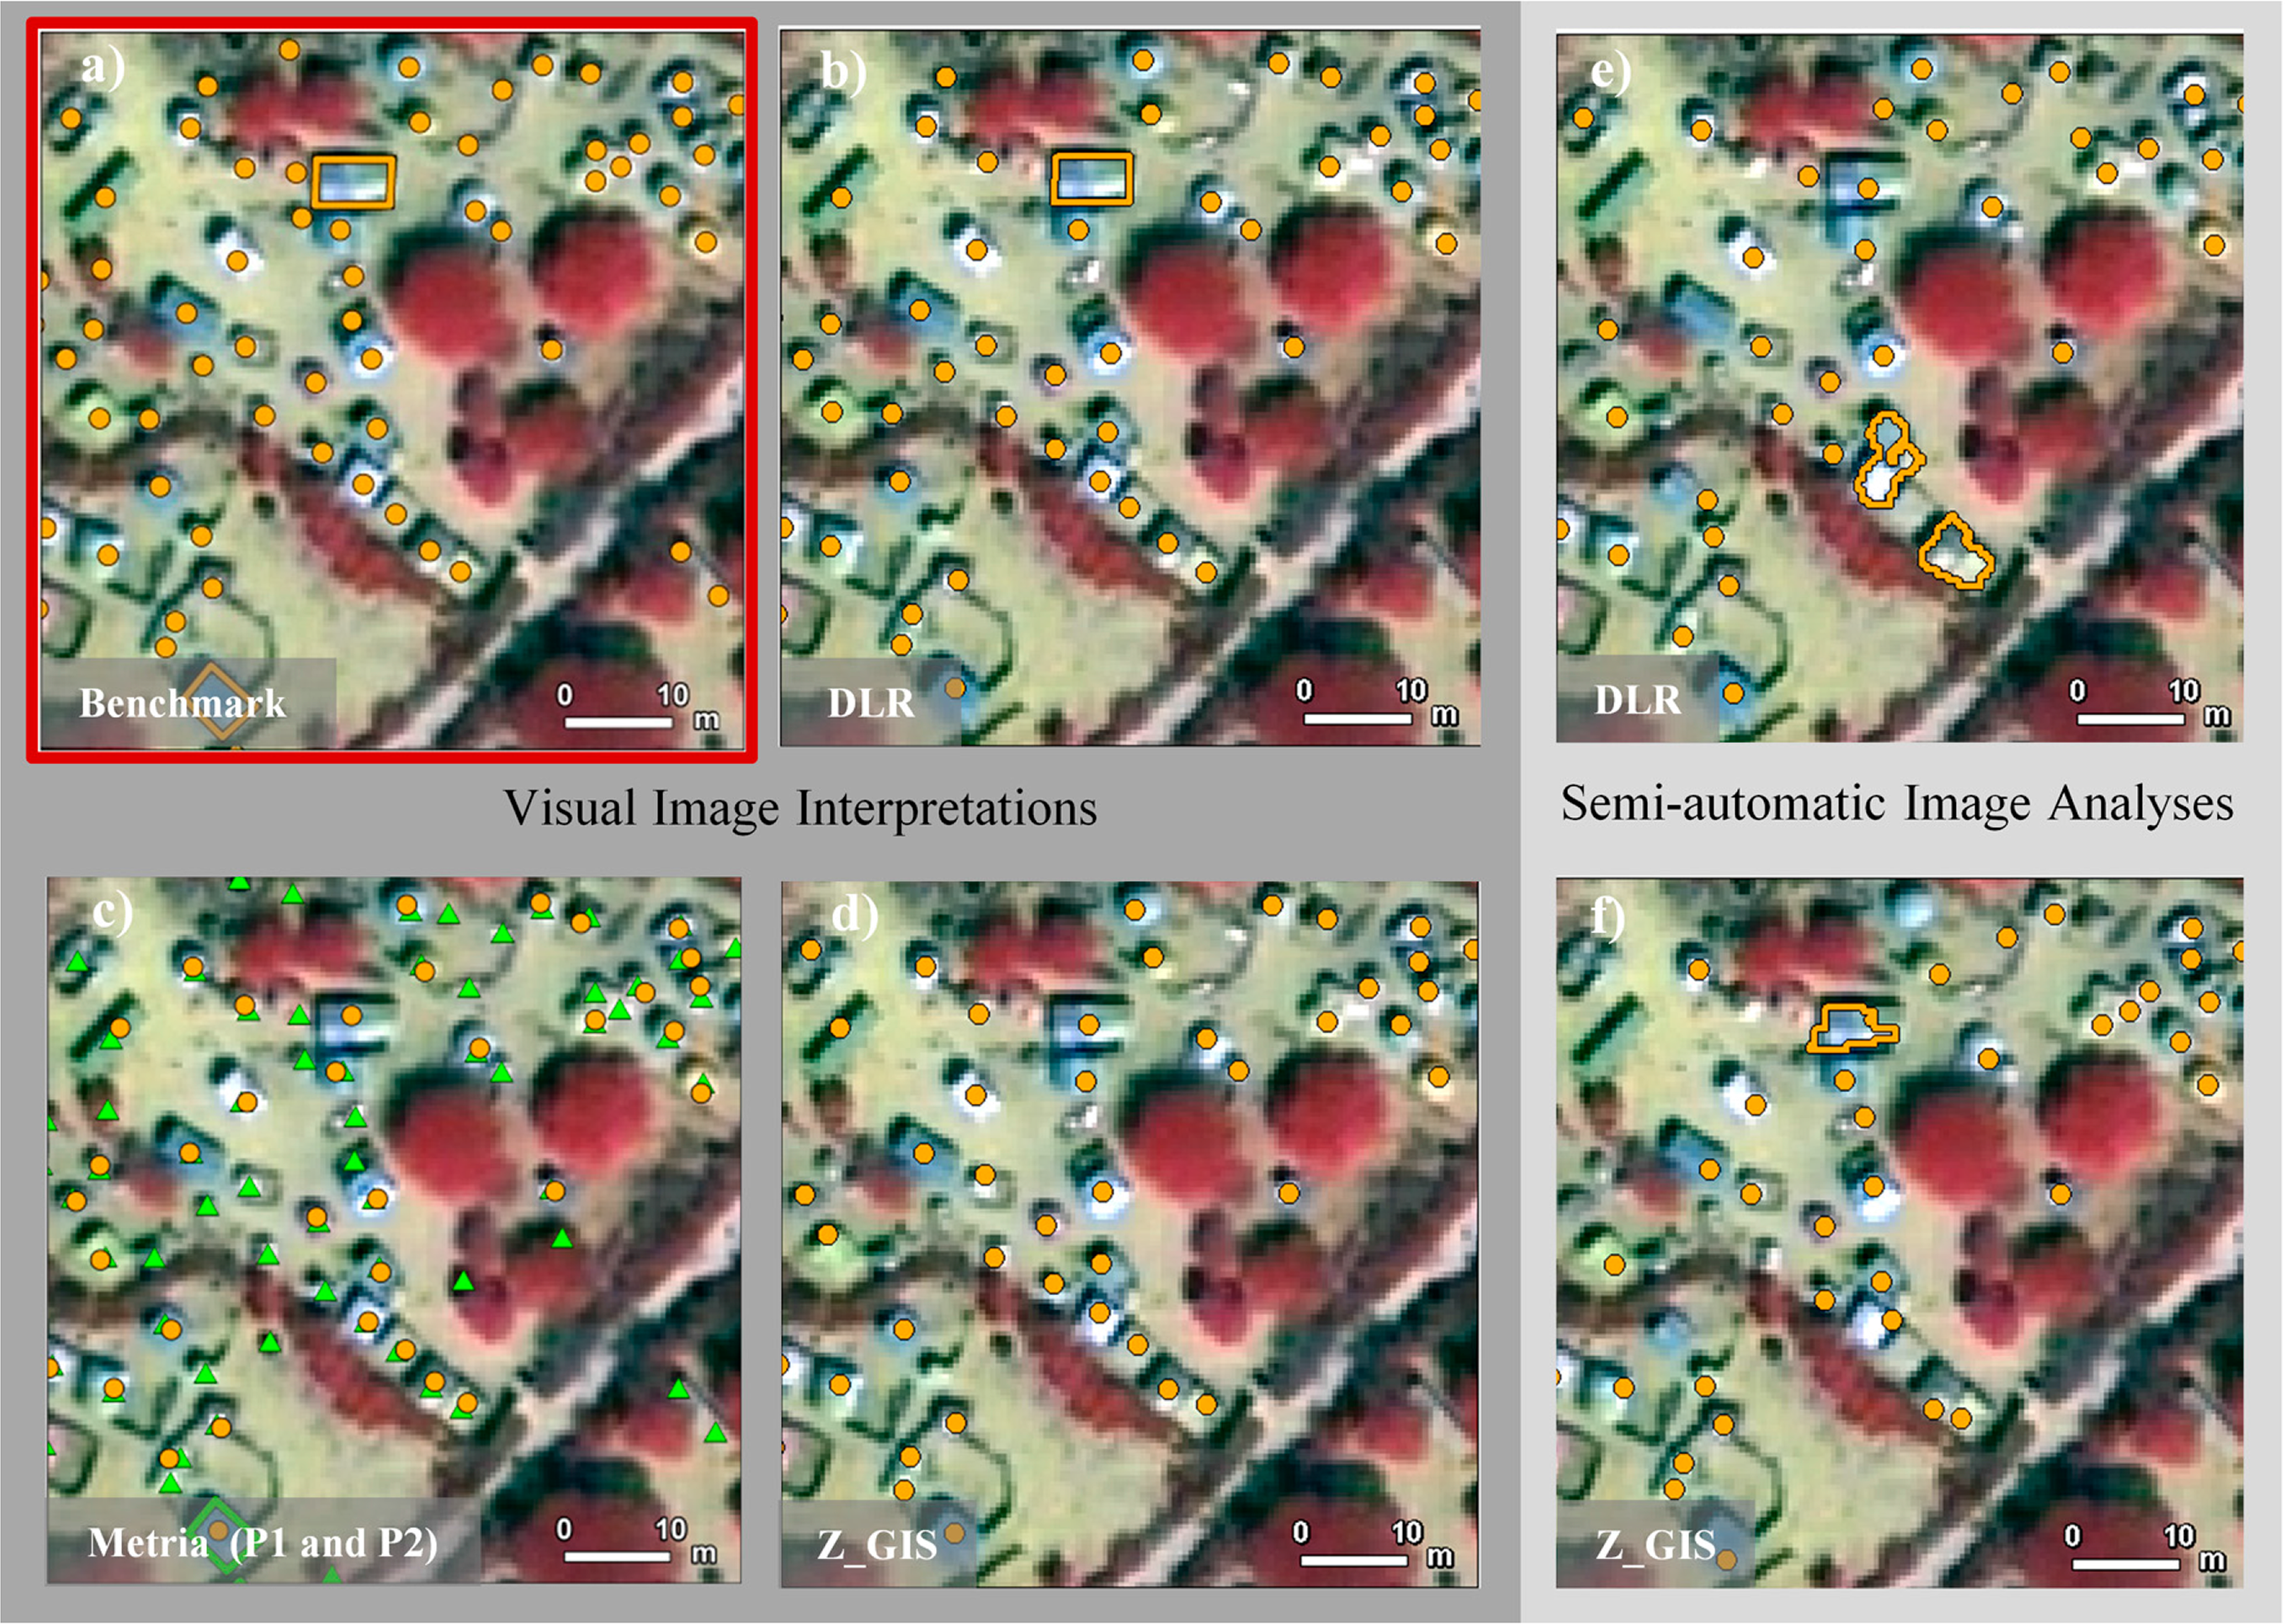
The analysis results of the different dwelling detection approaches are shown in Table 1. For a better visual comparison, a subset of the analyzed satellite scene is illustrated in Figure 5 and an aggregation of the dwellings to grid cells is shown in Figure 6.
4.1. Visual Image Interpretation
The results of the visual image interpretation show a wide range. This corresponds with the findings of Checci et al. [16] for complex environments with dense patterns of dwelling roofs. Despite the specification of interpretation rules, there is a high level of subjectivity influencing the interpretation. Regarding the absolute numbers of detected dwellings, especially the high number of shelters detected by Metria’s Person 1 and the low number of Metria’s Person 2 deviate significantly from the benchmark. The variations can partly be explained by the interpretation time ranging between 8 h (Z_GIS) and 20 h (Metria Person 1, DLR), which is likely related to the interpreter’s perception of the level of details to map but also to the skills of the interpreter. As illustrated in Figure 5, there are some falsely detected shelters within the visual image interpretation of Metria’s Person 1 (light green triangles, bottom left). In many cases trees, shadows or fences have been detected as shelters. Furthermore, this interpreter also detected very small dwellings that are most probably not inhabited.
The most difficult areas to interpret were in the more complex parts of the camp where dwellings were clumped very close together and even precise visual image interpretation does not allow the identification of single dwellings. In general, buildings could be easier identified, due to the bigger size, angular structure and the metal roof, which covers most of the buildings and allows a better separation from the ground. However, even the number of detected buildings differs between the interpreters. This variation can probably be attributed to the fact that, in cases of rapid analyses, the size of buildings may sometimes be estimated only and not measured precisely. Thus, a building which is slightly bigger than the defined 20 m2 may still be classified as shelter. Furthermore, if dwellings are standing very close together and the roofs consist of the same material, some interpreters may identify several shelters, others a single, large building.
Depending on the individual performing of the visual image interpretation, the estimated population varies between 16,746 (Metria Person 2) and 28,568 (Metria Person 1) persons, with a mean of 21,460 persons (including all visual image interpretations except the benchmark). Relative to the benchmark (≙ 100%), the visual image interpretation results vary between 1.1% (DLR) and 27.4% (Metria Person 1). Nevertheless, it should be noted that, despite all variations, the mean of all interpretations is quite close to the benchmark of 22,432 persons.
4.2. Semi-Automatic Image Analysis
With respect to the results of the visual image interpretation, the non-uniform results of the semi-automatic methods are not surprising. For the semi-automatic image analysis without editing, the results of the estimated population range between 14,993 (Z_GIS) and 18,886 (DLR) persons and a production time of 8 h (DLR) up to 13 h (Z_GIS). In comparison with the benchmark (≙ 100%), there is a deviation of results between 15.8% (DLR) and 33.2% (Z_GIS). The variation in the number of detected shelters and buildings can mainly be attributed to the complexity of the camp site. Misclassifications can predominantly be observed again in complex high density areas with smaller structures or parts where the contrast is low due to similar spectral reflectance of shelters and neighboring ground surface. In general, just as for the visual image interpretation, buildings can be easier identified by the algorithms than shelters, due to their larger size and material (mostly corrugated iron roof). However, especially in such a complex study site, the detection and, above all, the separation of buildings are challenging. Misclassifications for this class may be caused by several factors. In some parts of the camp, shelters with similar spectral characteristics are clumped together. Thus, they may have been classified as one single object and subsequently identified as a building due to its size. Furthermore, single roofs of buildings of the same material (and thus reflectance) that are standing close together are indistinguishable. Consequently, multiple buildings might be classified as one. However, this misclassification does not influence the population estimation since the population is not calculated by persons per building, but by persons per m2.
4.3. Semi-Automatic Image Analysis with Manual Refinement
As is evident in Table 1, the amount of manual editing and its effect on interpretation results become obvious. With estimates between 14,780 (Z_GIS) and 19,323 (DLR) persons, the results of the semi-automatic analysis after manual corrections still differ widely. The additional production time required for the manual refinement ranges from 1.5 (Z_GIS) to 8 (DLR) hours. During the editing step, the population estimates only changed by 2.3% for the results of DLR and 1.4% for Z_GIS.
4.4. Evaluation of Approaches
For a better spatial comparison of the results, the density/pattern of shelters in a natural breaks classification was calculated. As highlighted in Figure 6, despite the diverse results in the number of detected dwellings, there is a similar pattern resulting from all methods, which shows the same tendencies for densely and sparsely occupied areas.
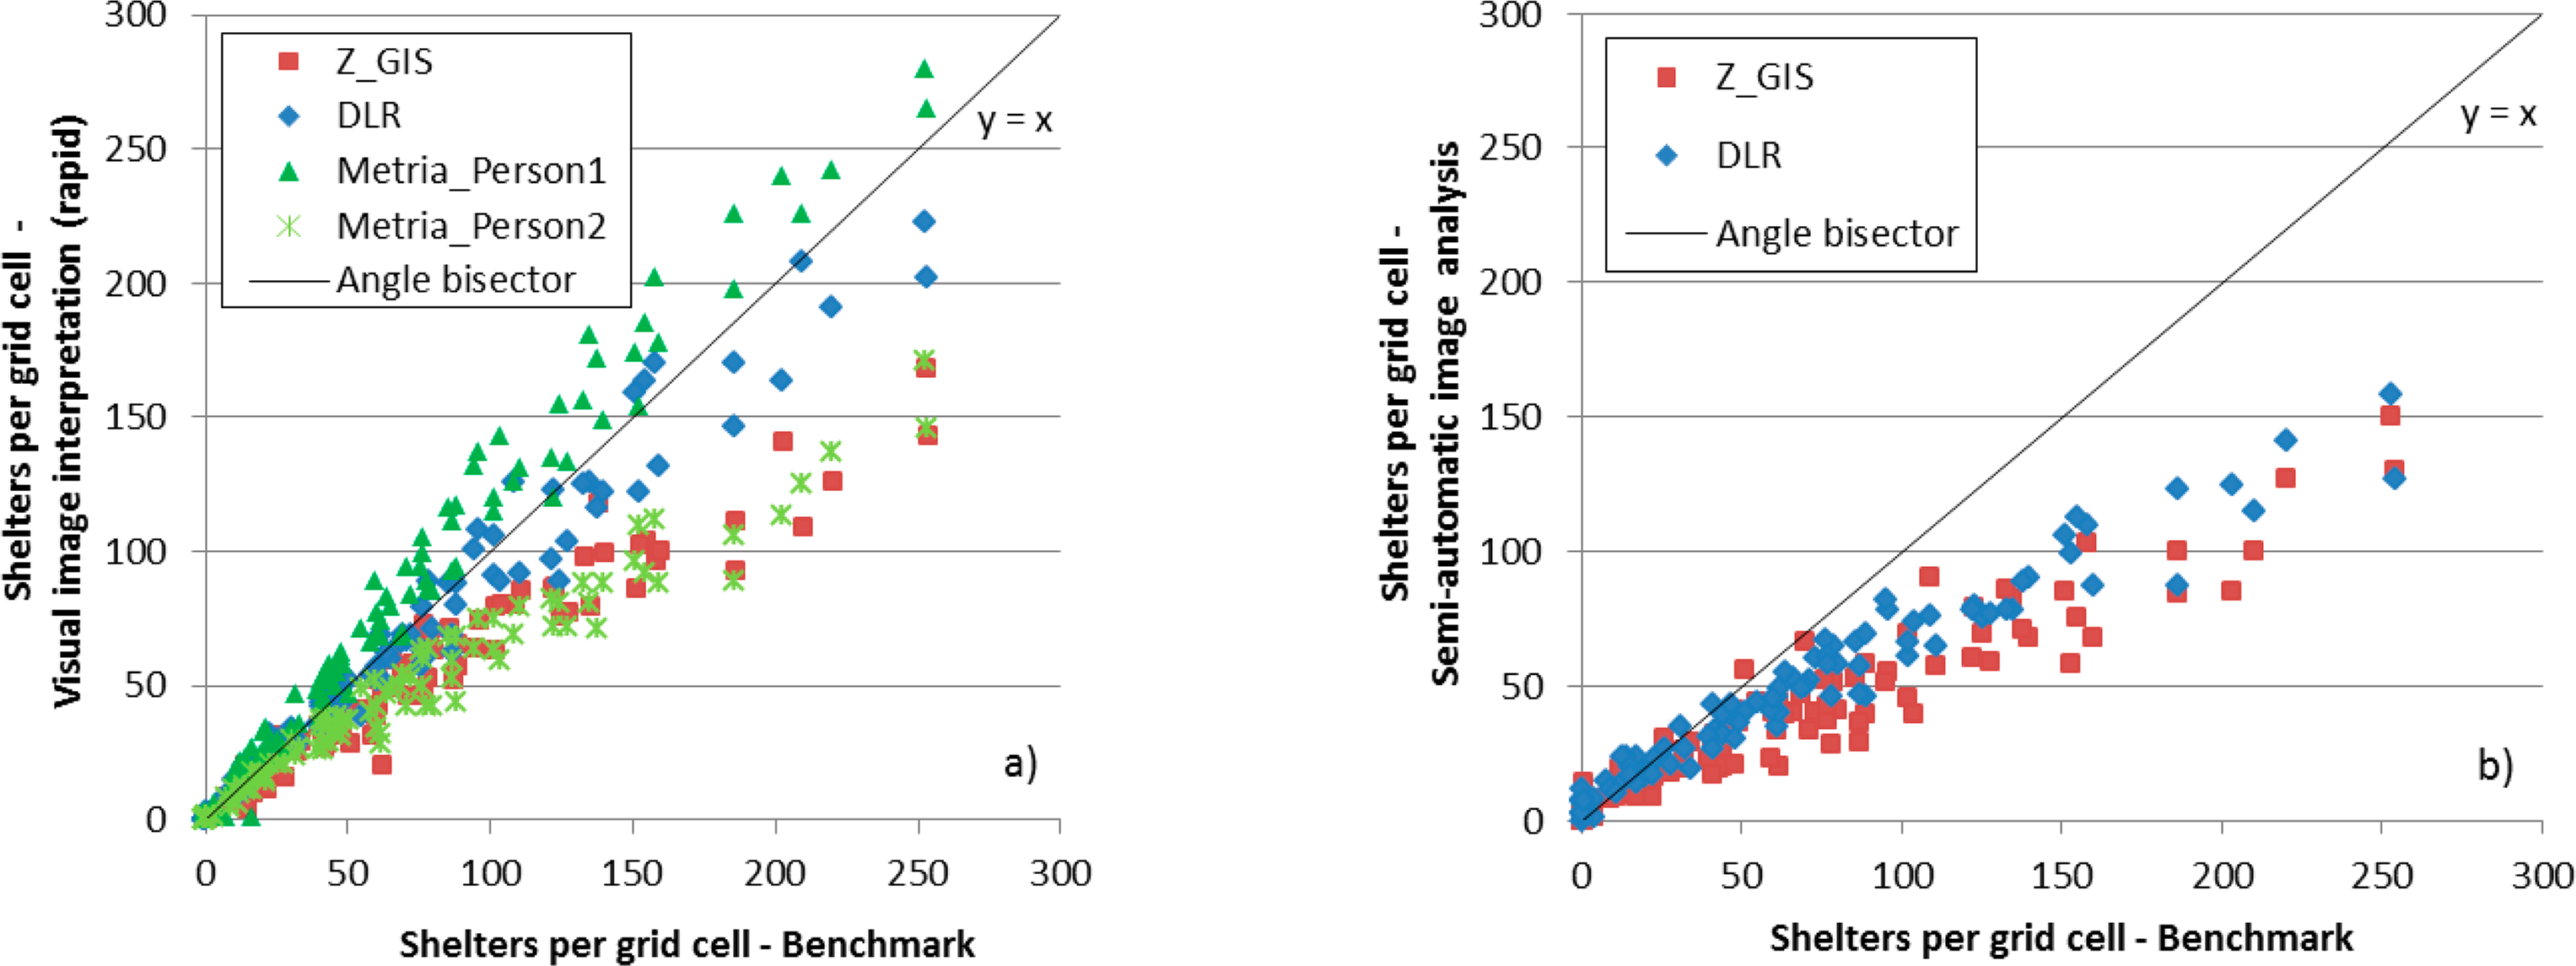
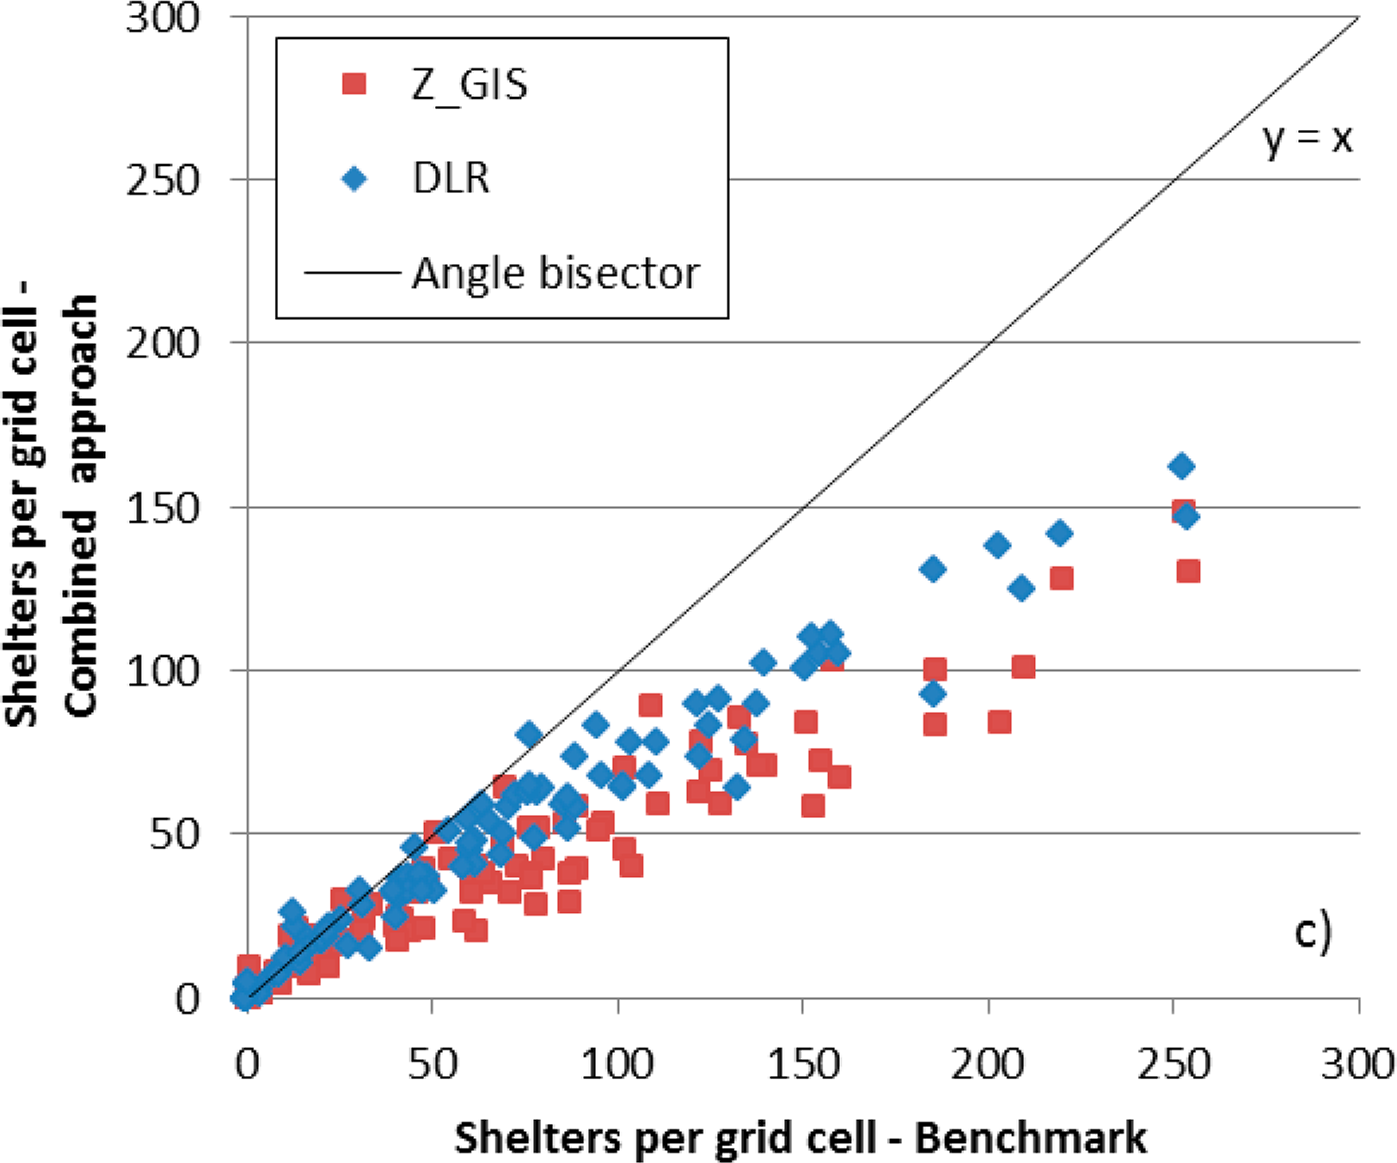
For the statistical analysis, the correlation between the benchmark and the number of shelters (detected per grid cell) of (a) the visual image interpretations; (b) the automated approaches; and (c) the combined approaches has been examined. The results are illustrated in scatter plots (see Figure 7). In addition, the angle bisector (y = x) is added.
Figure 7 clearly illustrates, that all analyses—(a); (b); and (c)—show a positive linear correlation. However, the more complex the area (i.e., many shelters in a grid cell), the higher the deviation from the benchmark. While there is a strong linear correlation among the results of (b) the semi-automatic analyses, there is a high scattering among (a) the different visual image interpretations with increasing complexity of the study site. In general, for all approaches (except Metria’s Person 1), a clear tendency of underestimation in the more complex areas can be observed, especially for the algorithm results. However, it is noticeable, that the semi-automatic analyses show results that are almost entirely in the range of the visual image interpretation.
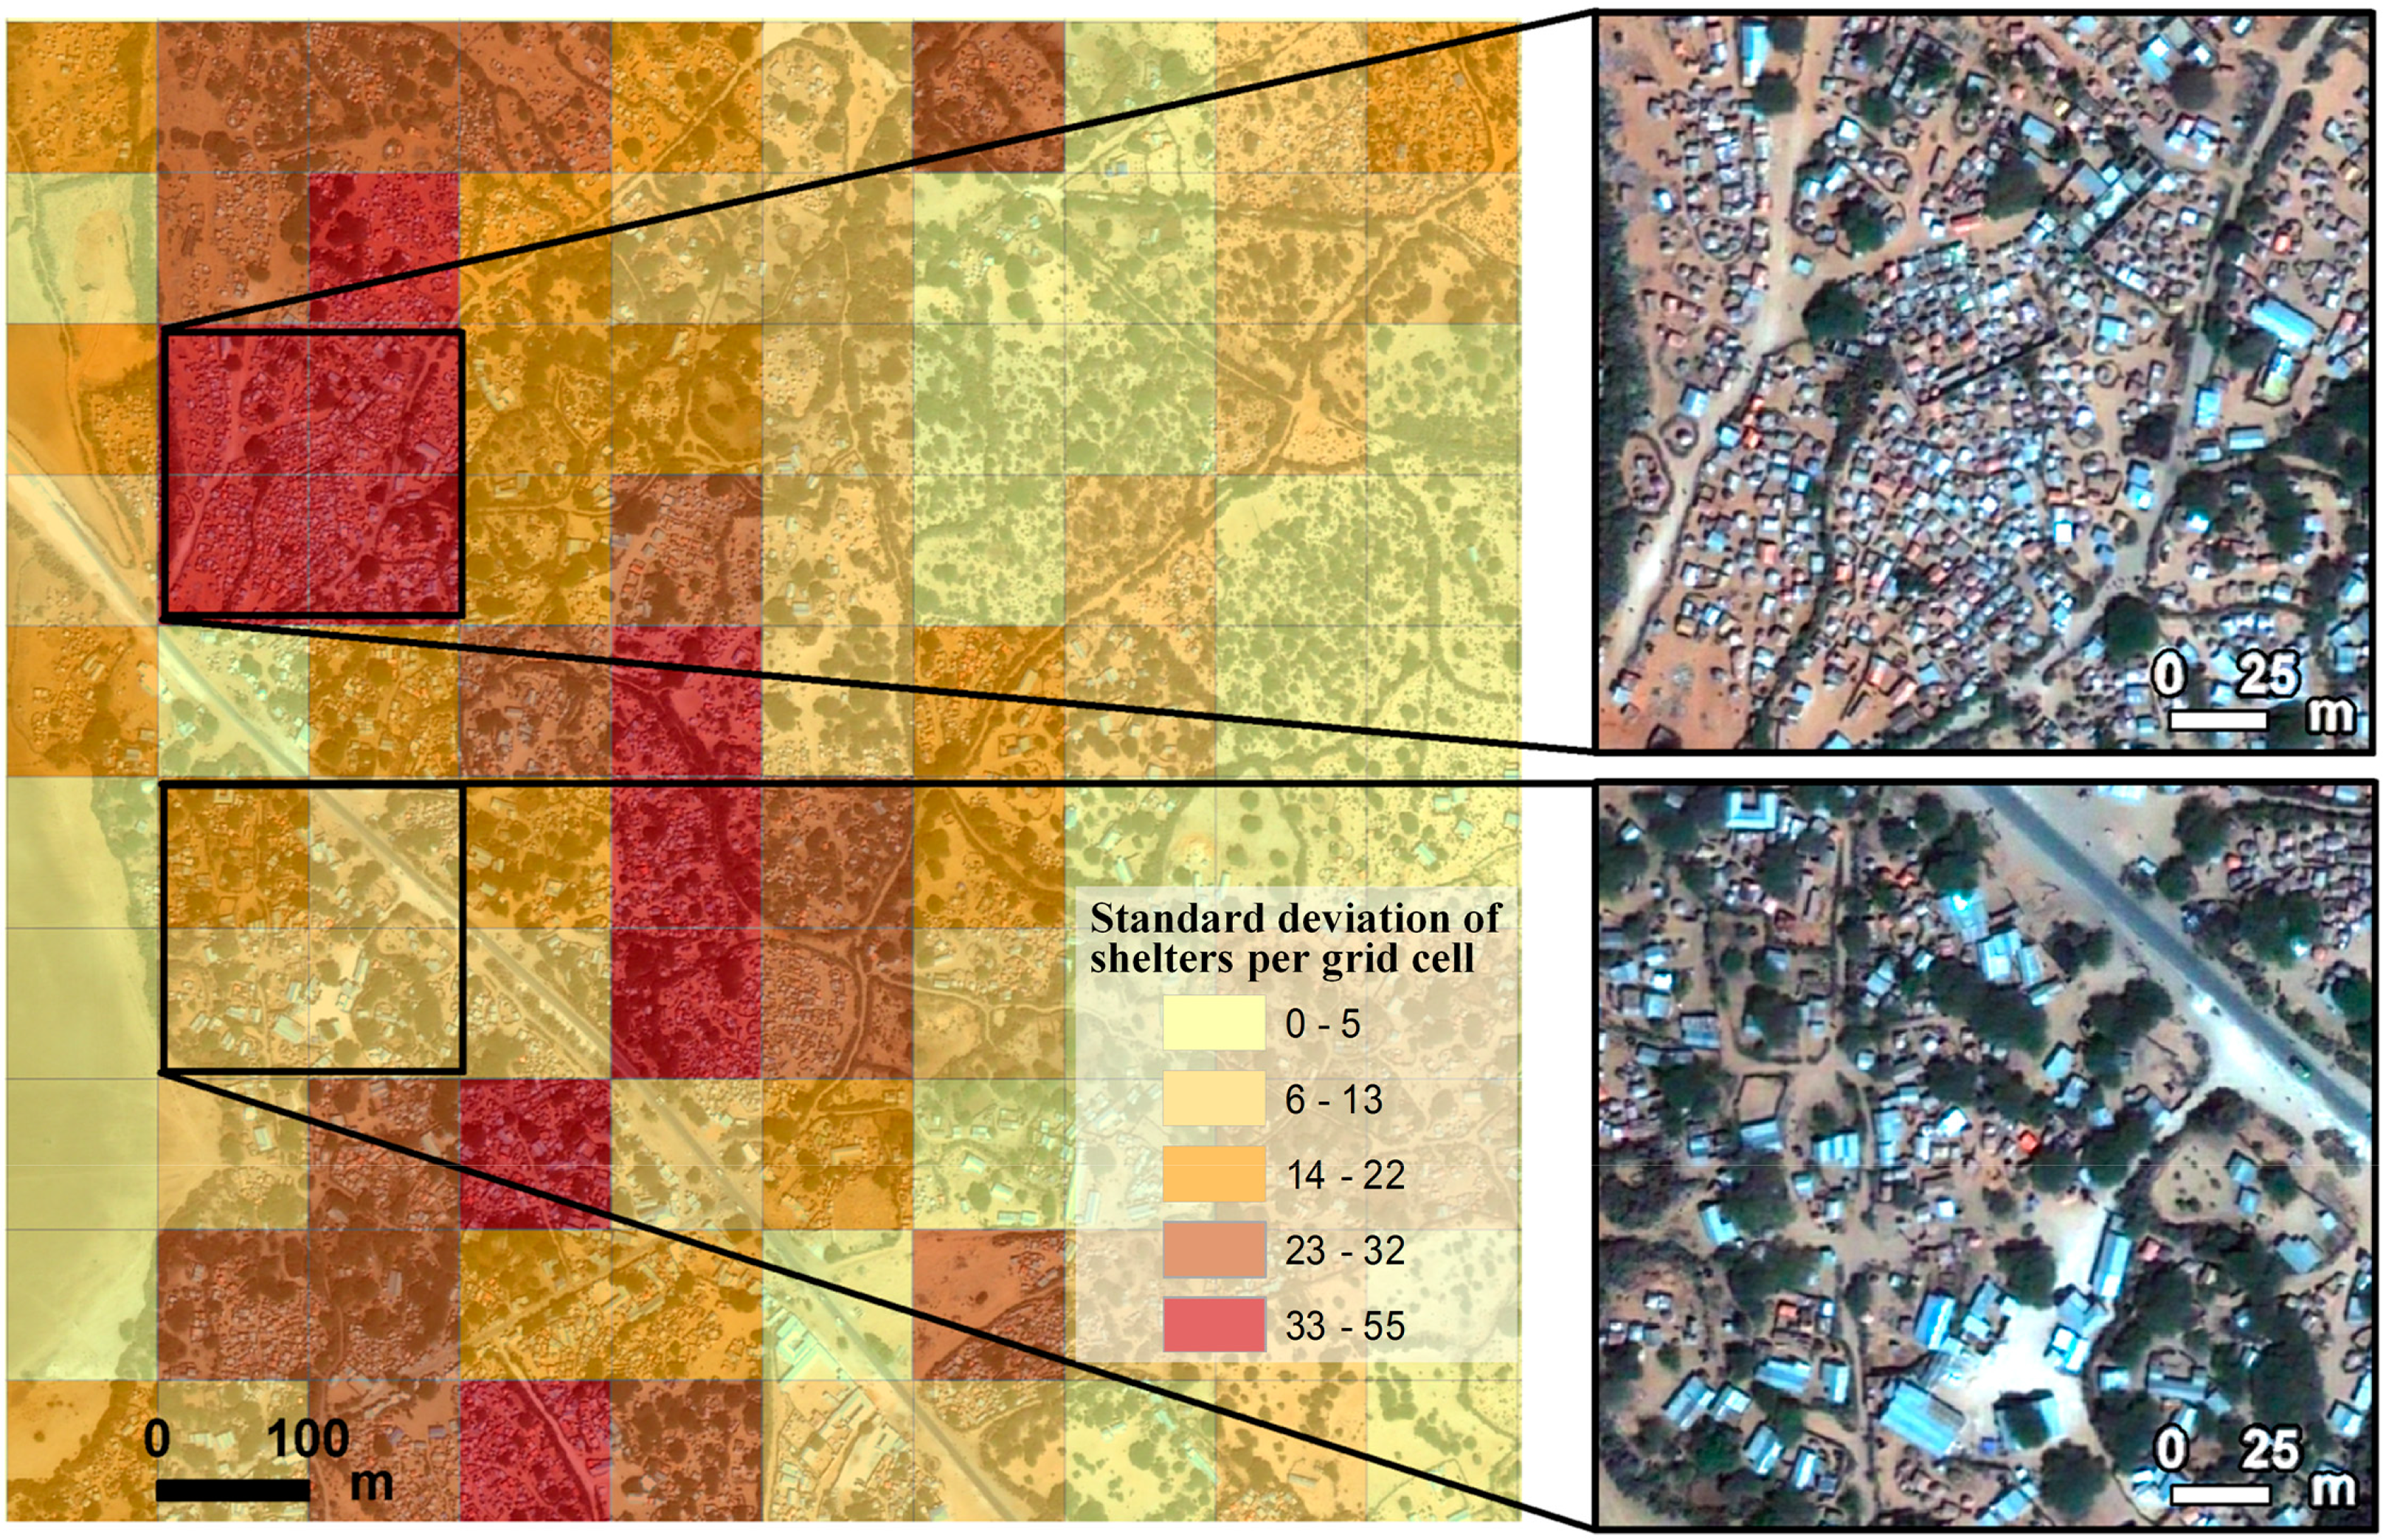
In order to further analyze the prevailing settlement structures, the standard deviation for each grid cell was calculated based on the number of detected shelters (all analyses are included). The result is shown in Figure 8, indicating grid cells with a higher standard deviation in darker tones and those with a lower standard deviation in brighter colors. The zoom boxes on the right highlight the camp structures for areas with high and low standard deviation. As expected, areas that reveal a high standard deviation are dominated by more complex structures, i.e., small shelters, traditional round huts and tent like structures, which are mostly clumped together, whereas in areas with a low standard deviation predominantly less complex structures such as larger rectangular shelters with corrugated iron roofs and tents can be observed.
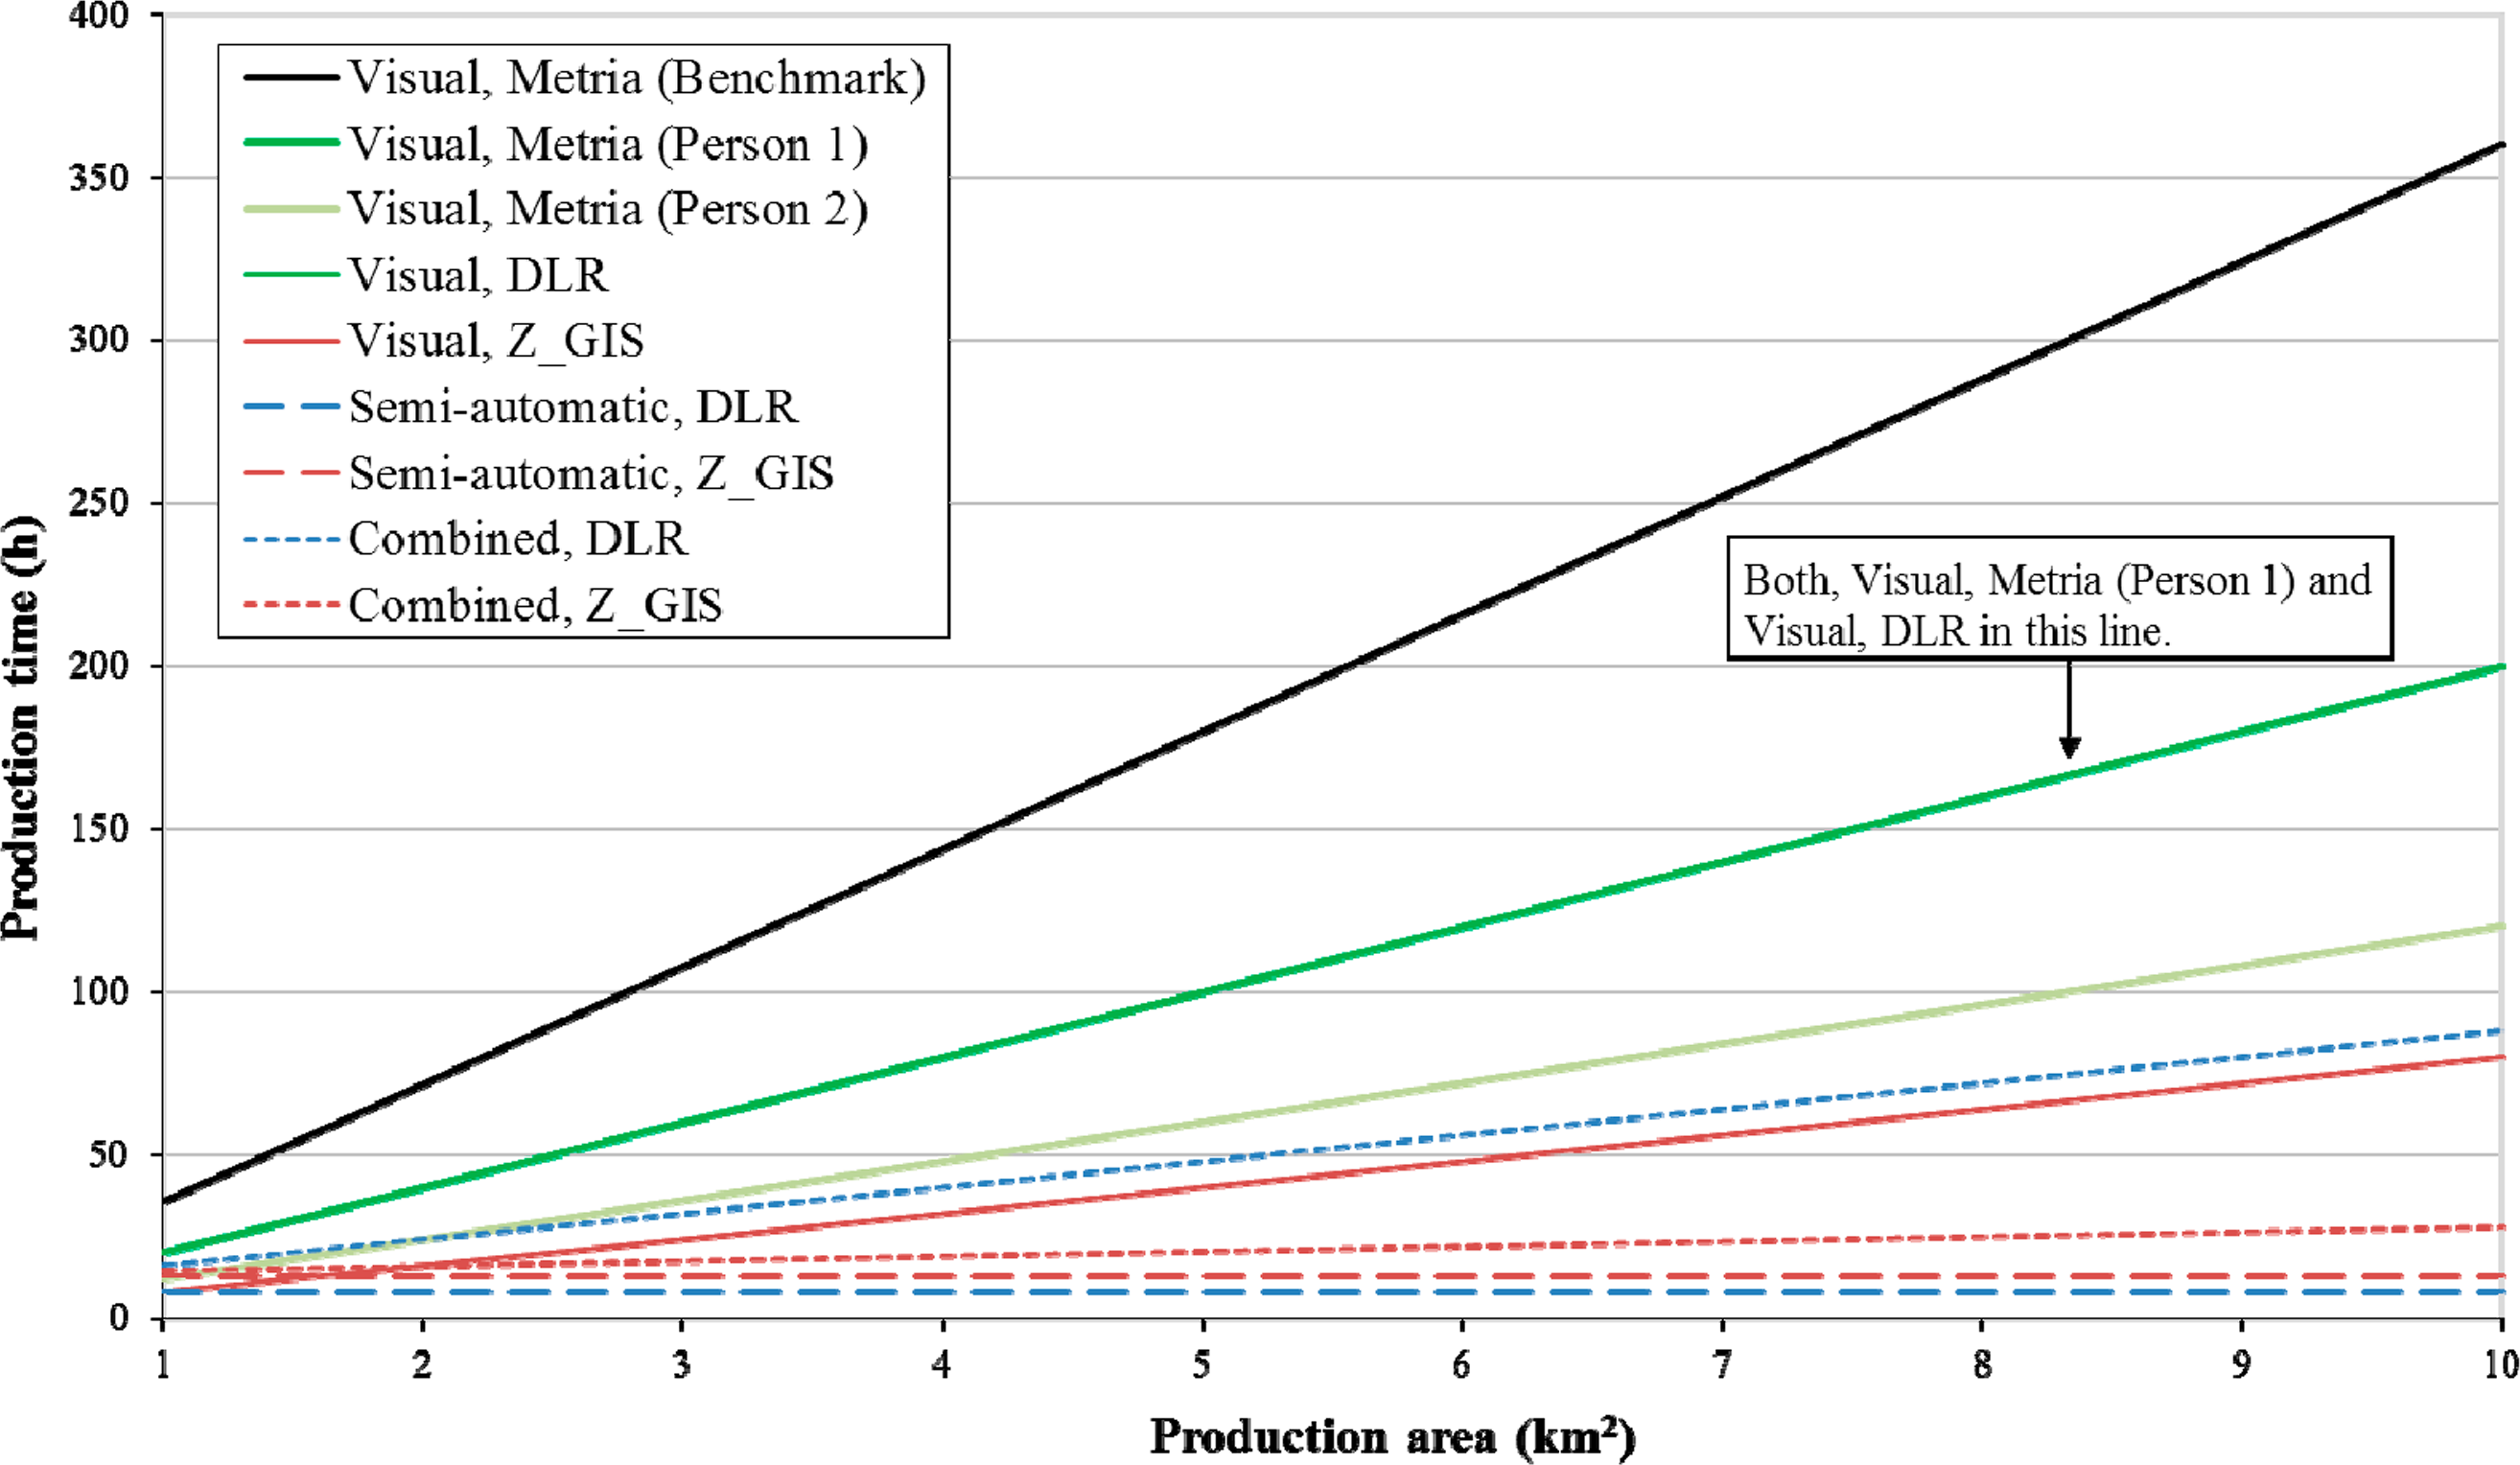
Figure 9 shows a comparison of the different approaches regarding production time and area. Assuming that the time for semi-automatic methods is constant regardless of the size of the area, whereas the time for visual image interpretation scales linearly with area, it can be concluded that semi-automatic methods are much faster than a manual approach if larger areas have to be analyzed (see Figure 9). It has to be noted that this assumption is limited by the size of a whole satellite scene. If the area is comprised of different satellite scenes, additional time for the adaptation of the rule sets has to be taken into account.
As can be seen in Table 1, the editing of the semi-automatic results takes additional time and does not significantly change the initial results. Thus, it has to be considered if a combination of automation and manual post processing will save production time compared to a pure visual image interpretation. Although the approach of DLR was straightforward due to given object boundaries and the possibility of multiple selections and assignment to the correct class in one single step, the time effort for this step was considerably high. The use of computer aided solutions as applied by Z_GIS can decrease the time required significantly (e.g., pre-segmentations, class probability calculation, tools supporting the delineation/digitizing process). Additionally, the focus of the manual refinement could be set on a fast, rough editing, in which only the most obvious misclassifications are removed and most apparent missing shelters added.
5. Discussion
In the absence of reliable reference data, visual image interpretation is supposed to be the closest to the “truth”. Therefore, the results of the methods may in the first place be compared to those derived by manual extraction and evaluated accordingly. However, due to the diverging numbers of the visual image interpretation it is obvious that these results contain quite a lot of uncertainty as well. This corresponds with the findings of Checci et al. [16] for complex environments with dense patterns of dwelling roofs. The variation of interpretation results may be caused by a different level of expertise, a subjective perception of each interpreter and a lack of consistent extraction rules in order to minimize the sources of error. Furthermore the image interpretation is influenced by the nature of the study area (e.g., complex structures) and the quality of the satellite data. Nevertheless the variation in manual interpretation could be further minimized by using strict interpretation guidelines, which determine the scale of image interpretation, define a certain minimum size for shelters and clearly specify the different dwelling types (e.g., size, geometry, material). However, even if this can overcome interpretation uncertainty, no real reference data can be constructed with a purely manual approach as it is not possible to map dwellings completely covered by trees or to determine if a building or shelter is actually inhabited or not. However, even data from the field has to be regarded critically concerning its reliability—especially in conflict regions. According to the experiences of the UNHCR during a field based survey in the Afgooye corridor in 2009, also data collection in the field may be defective [17]. Due to inflated figures provided by persons who focused on humanitarian assistance, the number of people living in the Afgooye corridor was estimated at more than two million, instead of the 366,000 estimated in January 2010 [27,28]. This clearly shows that data collected in the field may also be fraught with uncertainty and propagate distortions even more than an analysis of satellite data. This highlights the benefit of satellite data that provides objective information about a given area. If person-per-household numbers are provided, the use of satellite data and remote sensing techniques can be used to verify field-based population estimates.
For a comparison of automated methods and manual interpretations in the future, we propose to extend the test sites to different camp situations. The observed test site was provided within a project framework representing rather complex structures. Thus, automated methods are even more challenging to apply within a short time frame. We also recommend that less complex test sites should be studied or much larger ones, where the benefit of automated methods may be much more obvious compared to manual interpretations. This is especially important concerning scalability issues, addressing the fact, that the automated solutions (once adapted) can be scaled to a larger scene (only the computation time is increasing), whereas the manual interpretation usually doubles the time needed by doubling the area. Also, different sensors with additional spectral bands (e.g., WorldView-2 with eight bands) could facilitate automated extraction, especially to differentiate dwellings with little contrast (e.g., similar to bare ground) and improve the extraction of additional roofing materials. Automated methods have particular advantages when large camp areas or different time periods (camp development) are analyzed. If more test sites were analyzed, the comparisons could be more differentiated (to decide in which cases to choose an automated or a manual solution). An alternative approach for larger productions aiming at population estimates could be to first run an automatic method then choose a number of smaller sub-regions to evaluate the automatic results with manually detected results derived by visual image interpretation. If the deviation is large, the evaluation can then be used to improve the estimate by multiplying it with the quote between visual and automatic results. In cases where a population estimate is needed and the actual shelter placement does not matter, one solution might be to base the estimation on the size of the populated area (blocks) and an estimation of the average number of persons per square meter. This would minimize the error caused by incorrectly merging or separating distinct dwellings.
6. Conclusion and Outlook
The results of this study show that visual image interpretation of satellite imagery for dwelling detection varies between different (experienced) interpreters and thus cannot be regarded as real reference data. In general, a field measurement at the same time as the satellite data acquisition time is the best way to obtain reliable reference information. However, this is typically not possible due to safety reasons. If field data collection can be carried out, we recommend covering either an entire camp or selecting several parts depending on the structure types and density. This is the best approach to calibrate the semi-automatic methods and to get in general a better picture of multiple structure types. In any event, field data should not always be considered completely reliable and representative of the real world (cf. [17]).
In the absence of reliable reference data, it is not possible to assess the absolute quality of the analysis results. However, the statistical analyses of the different results revealed that all analysis approaches (visual image interpretation, semi-automatic image analysis and the combined approach) face difficulties in the more complex areas, whereas there is a higher variance in manual interpretations with increasing complexity. The automated methods are more consistent showing a lower variation between the two approaches. This can be an indicator of different reliability of the methods and should be taken into account for combined approaches. Thus, in case of a manual refinement of automated results, a reliability check of the manual counting should be performed. In summary, the algorithms perform well, showing results in the range of the manual interpretation and a similar spatial pattern. However, in very complex areas they are not very accurate regarding the absolute numbers. Thus, for such areas, population estimations should be handled with care and products should focus on relative values (dwelling density, heat maps, etc.) or with clear indications about the reliability.
The estimation of the production time for different approaches and increasing areas has shown that semi-automatic methods for population estimation through dwelling detection can be obtained at a fraction of the time compared to visual image interpretation if large areas are to be observed. The time saving aspect is important not only for resource saving but can also be beneficial if an estimate is needed fast. The manual refinement of the semi-automatic results led to an additional processing time with only minor changes of the initial results. Even if a more similar result to the visual one may be achieved, it remains questionable if production time can be saved compared to a purely manual interpretation. However, it could be shown that hybrid solutions—supporting the manual interpretation with computer aided solutions—can significantly reduce the time for the analysis.
Regardless of the shelter extraction methods, one important aspect to consider is the figures used for the transformation between number of shelters/area of buildings and population estimate. An estimate of for example 3.28 or 3.48 persons in each shelter may have large effects on the total population estimate of a camp. A compromise could be the provision of different scenarios (ranges) based on different figures (e.g., Min, Max, and Mean) [12,15]. In addition, it is obvious that the automated algorithms are underestimating the extracted dwellings (see Figure 7b). If this is found to be systematic, an offset factor can be calculated in order to derive a better estimation of population. This study was not qualified to estimate such a factor, since the real population values on the ground were not known and the occupancy rates of dwellings are based on estimates only.
One of the findings of the above outlined approaches was the difficulty in handling complex camp structures for both visual and semi-automatic approaches. Thus, further research activities should focus on generating better and more robust approaches for these settlement structures as well as improving protocols for different conditions including recommendations to decide case-by-case if automated solutions could help in the dwelling extraction process or not.
Acknowledgments
This work was supported with funding from the European Community’s Seventh Framework Programme ([FP7/2007-2013]) in the framework of the project SAFER (Grant agreement NO. 218802) and the project GARNET-E (Grant agreement NO. 242385). We kindly acknowledge the fruitful discussions with Eva Ahlkrona and Olaf Kranz.
Author Contributions
The original concept for the methods comparison was conceived by Anna Svanberg and Torbjörn Rost within the SAFER project context (Grant agreement NO. 218802). The methodological approach was further developed and refined by Kristin Spröhnle, Dirk Tiede and Petra Füreder. Kristin Spröhnle drafted the manuscript. She made substantial contributions to the conception and design of the study, was involved in the image analysis and carried out the evaluation of results. Dirk Tiede extensively supported the manuscript preparation and gave conceptual advice. Elisabeth Schoepfer and Petra Füreder commented on the manuscript at all stages. All authors contributed to the image analysis, and read, revised and approved the final manuscript.
Conflicts of Interest
The authors declare no conflict of interest.
References
- United Nations High Commissioner for Refugees. UNHCR Global Trends 2012. Displacement. The New 21st Century Challenge; UNHCR: Geneva, Switzerland, June 2013. Available online: http://www.unhcr.org/51bacb0f9.html (accessed on 13 December 2013).
- International Federation of Red Cross and Red Crescent Societies. World Disasters Report 2012: Focus on Forced Migration and Displacement; IFRC: Geneva, Switzerland, 2012. Available online: http://www.ifrcmedia.org./pages/wdr2012/resources/1216800-WDR-2012-EN-FULL.pdf (accessed on 15 June 2014).
- United Nations High Commissioner for Refugees. The State of the World’s Refugees. In Search of Solidarity; UNHCR: Geneva, Switzerland, 2012. Available online: http://www.unhcr.org/4fc5ceca9.html (accessed on 14 March 2013).
- United Nations High Commissioner for Refugees, Key Principles for Decision-Making. Refugee Operations and Environmental Management; Engineering and Environmental Service Section, UNHCR: Geneva, Switzerland; June; 2000; Available online: http://www.unhcr.org/3b03b24d4.html (accessed on 12 March 2013).
- United Nations High Commissioner for Refugees. Environmental Guidelines; UNHCR: Geneva, Switzerland, August 2005. Available online: http://www.unhcr.org/3b03b2a04.html (accessed on 20 March 2013).
- Bouchardy, J.-Y. Development of a GIS System in UNHCR for Environmental, Emergency, Logistic, and Planning Purposes; Program Report; DPOS UNHCR: Geneva, Switzerland; January; 1995; Available online: http://repository.forcedmigration.org/show_metadata.jsp?pid=fmo:3246 (accessed on 20 March 2013). [Google Scholar]
- Bjørgo, E. Very high resolution satellites: A new source of information in humanitarian relief operations. Bull. Am. Soc. Inf. Sci 1999, 26, 22–24. [Google Scholar]
- Bjørgo, E. Using very high spatial resolution satellite sensor imagery to monitor refugee camps. Int. J. Remote Sens 2000, 21, 611–616. [Google Scholar]
- Bjørgo, E. Refugee camp mapping using very high spatial resolution satellite sensor images. Geocarto Int 2000, 15, 79–88. [Google Scholar]
- Giada, S.; de Groeve, T.; Ehrlich, D.; Soille, P. Information extraction from very high resolution satellite imagery over Lukole refugee camp, Tanzania. Int. J. Remote Sens 2003, 24, 4251–4266. [Google Scholar]
- Lang, S.; Tiede, D.; Hofer, F. Modeling ephemeral settlements using VHSR image data and 3D visualisation—The example of Goz Amer refugee camp in Chad. Photogramm. Fernerkund. Geoinf 2006, 4, 327–338. [Google Scholar]
- Lang, S.; Tiede, D.; Hölbling, D.; Füreder, P.; Zeil, P. EO-Based ex-post assessment of IDP camp evolution and population dynamics in Zam Zam, Darfur. Int. J. Remote Sens 2010, 31, 5709–5731. [Google Scholar]
- Kemper, T.; Jenerowicz, M.; Soille, P.; Pesaresi, M. Enumeration of dwellings in Darfur Camps from GeoEye-1 satellite images using mathematical morphology. IEEE J. Sel. Top. Appl. Earth Observ. Remote Sens 2011, 4, 8–15. [Google Scholar]
- Watkins, J.F.; Morrow-Jones, H.A. Small area population estimates using aerial photography. Photogramm. Eng. Remote Sens 1985, 51, 1933–1935. [Google Scholar]
- Kranz, O.; Lang, S.; Tiede, D.; Zeug, G.; Kemper, T.h.; Caspard, M.; Clandillon, S. GMES services for conflict prevention and mitigation: Support the DG RELEX in mission planning. In Geographic Information and Cartography for Risk and Crises Management: Towards Better Solutions; Konecny, M., Zlatanova, S., Bandrova, T.L., Eds.; Springer: Berlin, Germany, 2010; pp. 171–188. [Google Scholar]
- Checchi, F.; Stewart, B.T.; Palmer, J.J.; Grundy, C. Validity and feasibility of a satellite imagery-based method for rapid estimation of displaced populations. Int. J. Health Geogr 2013, 12. [Google Scholar] [CrossRef]
- United Nations High Commissioner for Refugees and OCHA Somalia, IDP Population Assessment of the Mogadishu Periphery—September 2010; UNHCR, OCHA: Somalia; September; 2010; Available online: http://reliefweb.int/sites/reliefweb.int/files/resources/8F01F567968C90C6492577F10025166B-Full_Report.pdf (accessed on 16 January 2013).
- United Nations High Commissioner for Refugees. Afgooye Corridor Fast Becoming the Capital of Somalia’s Displaced; UNHCR Briefing Notes, October 2010. Available online: http://www.unhcr.org/4ca5d91f9.html (accessed on 16 January 2013).
- Blaschke, T. Object based image analysis for remote sensing. ISPRS J. Photogramm. Remote Sens 2010, 65, 2–16. [Google Scholar]
- Tiede, D. A new geospatial overlay method for the analysis and visualization of spatial change patterns using object-oriented data modeling concepts. Cartogr. Geogr. Inf. Sci 2014, 41, 227–234. [Google Scholar]
- Tiede, D.; Lang, S.; Albrecht, F.; Hölbling, D. Object-based class modeling for cadastre-constrained delineation of geo-objects. Photogramm. Eng. Remote Sens 2010, 76, 193–202. [Google Scholar]
- Tiede, D.; Lang, S.; Hölbling, D.; Füreder, P. Transferability of OBIA rulesets for IDP camp analysis in Darfur. Proceedings of the GEOBIA 2010—Geographic Object-Based Image Analysis, Ghent, Belgium, 29 June–2 July 2010.
- Tiede, D.; Füreder, P.; Lang, S.; Hölbling, D.; Zeil, P. Automated Analysis of satellite imagery to provide information products for humanitarian relief operations in refugee camps—From scientific development towards operational services. PFG Photogramm. Fernerkund. Geoinf 2013, 2013, 185–195. [Google Scholar]
- Tiede, D.; Lang, S. Distributed computing for accelerated dwelling extraction in refugee camps using VHSR satellite imagery. In Proceedings of the GI_Forum, Salzburg, Austria, 1–4 July 2008; pp. 256–261.
- Tiede, D.; Lang, S. IDP camp evolvement analysis in Darfur using VHSR optical satellite image time series and scientific visualization on virtual globes. Proc SPIE 2009, 7840. [Google Scholar] [CrossRef]
- Kranz, O.; Gstaiger, V.; Lang, S.; Tiede, D.; Zeug, G.; Kemper, T.h.; vega Ezquieta, P.; Clandillon, S. Different approaches for IDP camp analyses in West Darfur (Sudan)—A status report. In Proceedings of the 6th Geomatics for Crisis Management Conference (Gi4DM), Torino, Italy, 2–4 February 2010.
- De Kok, R.; Wezyk, P. Principles of full autonomy in image interpretation. The basic architectural design for a sequential process with image objects. In Object-Based Image Analysis—Spatial Concepts for Knowledge-Driven Remote Sensing Applications; Blaschke, T., Lang, S., Hay, G., Eds.; Springer: Berlin, Germany, 2008; pp. 697–710. [Google Scholar]
- United Nations High Commissioner for Refugees and OCHA Somalia. Mogadishu Periphery. IDP Population Assessment; UNHCR, OCHA: Somalia, September 2010. Available online: http://parkdatabase.org/files/documents/2010_Somalia_Presentation-on-Mogadishu-Periphery-Rapid-IDP-Population-Assessment_UNHCR_OCHA.pdf (accessed on 16 January 2013).


| Visual Image Interpretation | Semi-Automatic Image Analysis | Semi-Automatic Image Analysis with Manual Refinement | |||||||
|---|---|---|---|---|---|---|---|---|---|
| Production Time * | Number of Dwellings | Estimated Population ∆ | Production Time *1 | Number of Dwellings | Estimated Population ∆ | Production Time * | Number of Dwellings | Estimated Population ∆ | |
| Metria (Benchmark) | 36 h | S: 6839 B: 649 T: 7488 | 22,432 | --- | --- | --- | --- | --- | --- |
| Metria (Person 1) | 20 h | S: 8001 B: 648 T: 8649 | 28,568 | --- | --- | --- | --- | --- | --- |
| Metria (Person 2) | 12 h | S: 4491 B: 454 T: 4945 | 16,746 | --- | --- | --- | --- | --- | --- |
| DLR | 20 h | S: 6345 B: 574 T: 6919 | 22,673 | 8 h | S: 4845 B: 713 T: 5558 | 18,886 | 8 h + 8 h | S: 4909 B: 788 T: 5697 | 19,323 |
| Z_GIS | 8 h | S: 4762 B: 614 T: 5376 | 17,854 | 13 h | S: 3937 B: 531 T: 4468 | 14,993 | 13 h + 1.5 h | S: 3868 B: 515 T: 4383 | 14,780 |
*The production times were rounded up to the nearest hour;*1The production time is composed of the time for the parameter adaptation of the existing rule sets and the computation time;∆The population estimate is based on the UNHCR [17] estimate: 3.28 persons per shelter and 0.0744 persons per m2 for buildings; S = Shelter (<20 m2), B = Building (>20 m2), T = Total.
© 2014 by the authors; licensee MDPI, Basel, Switzerland This article is an open access article distributed under the terms and conditions of the Creative Commons Attribution license (http://creativecommons.org/licenses/by/4.0/).
Share and Cite
Spröhnle, K.; Tiede, D.; Schoepfer, E.; Füreder, P.; Svanberg, A.; Rost, T. Earth Observation-Based Dwelling Detection Approaches in a Highly Complex Refugee Camp Environment — A Comparative Study. Remote Sens. 2014, 6, 9277-9297. https://doi.org/10.3390/rs6109277
Spröhnle K, Tiede D, Schoepfer E, Füreder P, Svanberg A, Rost T. Earth Observation-Based Dwelling Detection Approaches in a Highly Complex Refugee Camp Environment — A Comparative Study. Remote Sensing. 2014; 6(10):9277-9297. https://doi.org/10.3390/rs6109277
Chicago/Turabian StyleSpröhnle, Kristin, Dirk Tiede, Elisabeth Schoepfer, Petra Füreder, Anna Svanberg, and Torbjörn Rost. 2014. "Earth Observation-Based Dwelling Detection Approaches in a Highly Complex Refugee Camp Environment — A Comparative Study" Remote Sensing 6, no. 10: 9277-9297. https://doi.org/10.3390/rs6109277