Article

Validation of the Two Standard MODIS Satellite Burned-Area Products and an Empirically-Derived Merged Product in South Africa

1
Department of Geography, Geoinformatics and Meteorology, University of Pretoria, Pretoria 0002, South Africa
2
Remote Sensing Research Unit, CSIR Meraka Institute, P.O. Box 395, Pretoria 0001, South Africa
3
Ecosystems, Processes and Dynamics, CSIR Natural Resources and the Environment, P.O. Box 395, Pretoria 0001, South Africa
4
School of Animal, Plant and Environmental Sciences, University of the Witwatersrand, Private Bag 3, WITS, Johannesburg 2050, South Africa
*
Author to whom correspondence should be addressed.
Remote Sens. 2014, 6(2), 1275-1293; https://doi.org/10.3390/rs6021275
Submission received: 20 October 2013 / Revised: 18 November 2013 / Accepted: 30 December 2013 / Published: 4 February 2014
(This article belongs to the Special Issue Analysis of Remote Sensing Image Data)

Abstract

:
The 500-m Moderate Resolution Imaging Spectroradiometer (MODIS) burned area products, MCD45A1, MCD64A1, and a merged product were validated across six study sites in South Africa using independently-derived Landsat burned-area reference data during the fire season of 2007. The objectives of this study were to: (i) investigate the likelihood of the improved detection of small burns through an empirically-derived merged product; (ii) quantify the probability of detection by each product using sub-pixel burned area measures; and, (iii) compare the mean percent concurrence of burned pixels between the standard products over a ten-year time series in each site. Results show that MCD45A1 presented higher detection probabilities (i.e., 3.0%–37.9%) for small fractions ≤50%, whereas MCD64A1 appeared more reliable (i.e., 12.0%–89.2%) in detecting large fractions >50% of a burned MODIS pixel, respectively. Overall, the merged product demonstrated improved detection of the burned area in all fractions. This paper also demonstrates that, on average, >50% of MODIS burned pixels temporally concur between the MCD45A1 and MCD64A1 products in each site. These findings have significant implications for fire monitoring in southern Africa and contribute toward the understanding of the range and of the sources of errors present in the MODIS burned area products.

1. Introduction

Fire is a major cause of land surface changes with impacts on the climate system, vegetation composition and the chemical composition of the atmosphere [13]. The frequency of the occurrence, distribution and severity of biomass burning are fundamental drivers of global climate, ecosystem dynamics and land cover change. Global satellite observations of biomass burning reveal that Africa has by far the highest occurrence of vegetation fires [4,5], and this is believed to constitute approximately 40% of annual carbon emissions globally [6,7]. Most of the global satellite observations are converted to fire detection proxies by use of specific algorithms. Two distinct satellite-based detection methods have been developed, namely, active fire [8] and burned area mapping [3,9]. Only a fraction of the actively burning fires during satellite overpass is detected [10], and thus, this methodology is limited in its ability to estimate the actual extent of burning. On the other hand, burned area mapping provides a more direct estimate of the impacts of fires, required to address various environmental questions and management decisions.
In the last few years, several global burned-area thematic products derived from low- to moderate-resolution satellite data based on various algorithms have become publicly available [1,5,1114]. Due to the differences in the data and algorithms, the derived products exhibit inherent systematic biases, which would therefore require their validation. Numerous validation studies of the burned area products have been reported in the literature [2,1521]. Overall, the validation studies focused on three major inter-related aspects: (a) quantitative analyses of the relationship between the spectral reflectance of the burned areas and product mapping accuracy; (b) quantification of burned area detection by the product; and (c) analysis of the influence of the sub-pixel burned area on the detection accuracy of the product. This paper addresses the last two aspects. A key feature of accuracy assessment was in the use of a limited selection of reference data and time periods that would not sufficiently characterize the errors accompanying a particular product [13], and this called for the need for rigorous regional validation, particularly those defined using dissimilar algorithms [19]. In this regard, product accuracy information could be more useful if product discrepancies are described in association to biome type and fire season [22]. This would aid in the selection and interpretation of the most suitable product for a particular region.
Studies validating the Moderate Resolution Imaging Spectroradiometer (MODIS) burned area product (MCD45A1) and the MODIS direct broadcast (DB) burned area product (MCD64A1) in South Africa were limited to independently-derived reference datasets located in the savanna and fynbos biomes [9,19,21]. The present study expands the validation of both standard MODIS products (i.e., MCD45A1 and MCD64A1) across six sites, encompassing not only savanna and fynbos, but also grassland and exotic pine forest plantations in South Africa during the fire season of 2007; by applying the traditional thematic accuracy reporting method, i.e., error matrix [9,19] and MODIS sub-pixel burned area analysis. Furthermore, this study introduces and validates a 500-m merged MODIS burned area product, which was recently derived by temporally aggregating the existing MCD45A1 and MCD64A1 products. The objectives of this study were to: (i) investigate the likelihood of improved detection (i.e., lower omission error) of a small burned area through an empirically-derived merged product; (ii) quantify the probability of detection by each of the three products using sub-pixel burned area measures; and (iii) compare the mean percent concurrence of burned pixels between the standard products over a ten-year time series in each site. These findings have significant implications for fire monitoring in southern Africa and contribute toward the understanding of a range and sources of errors present in the MODIS burned area products.

2. Study Area and Datasets

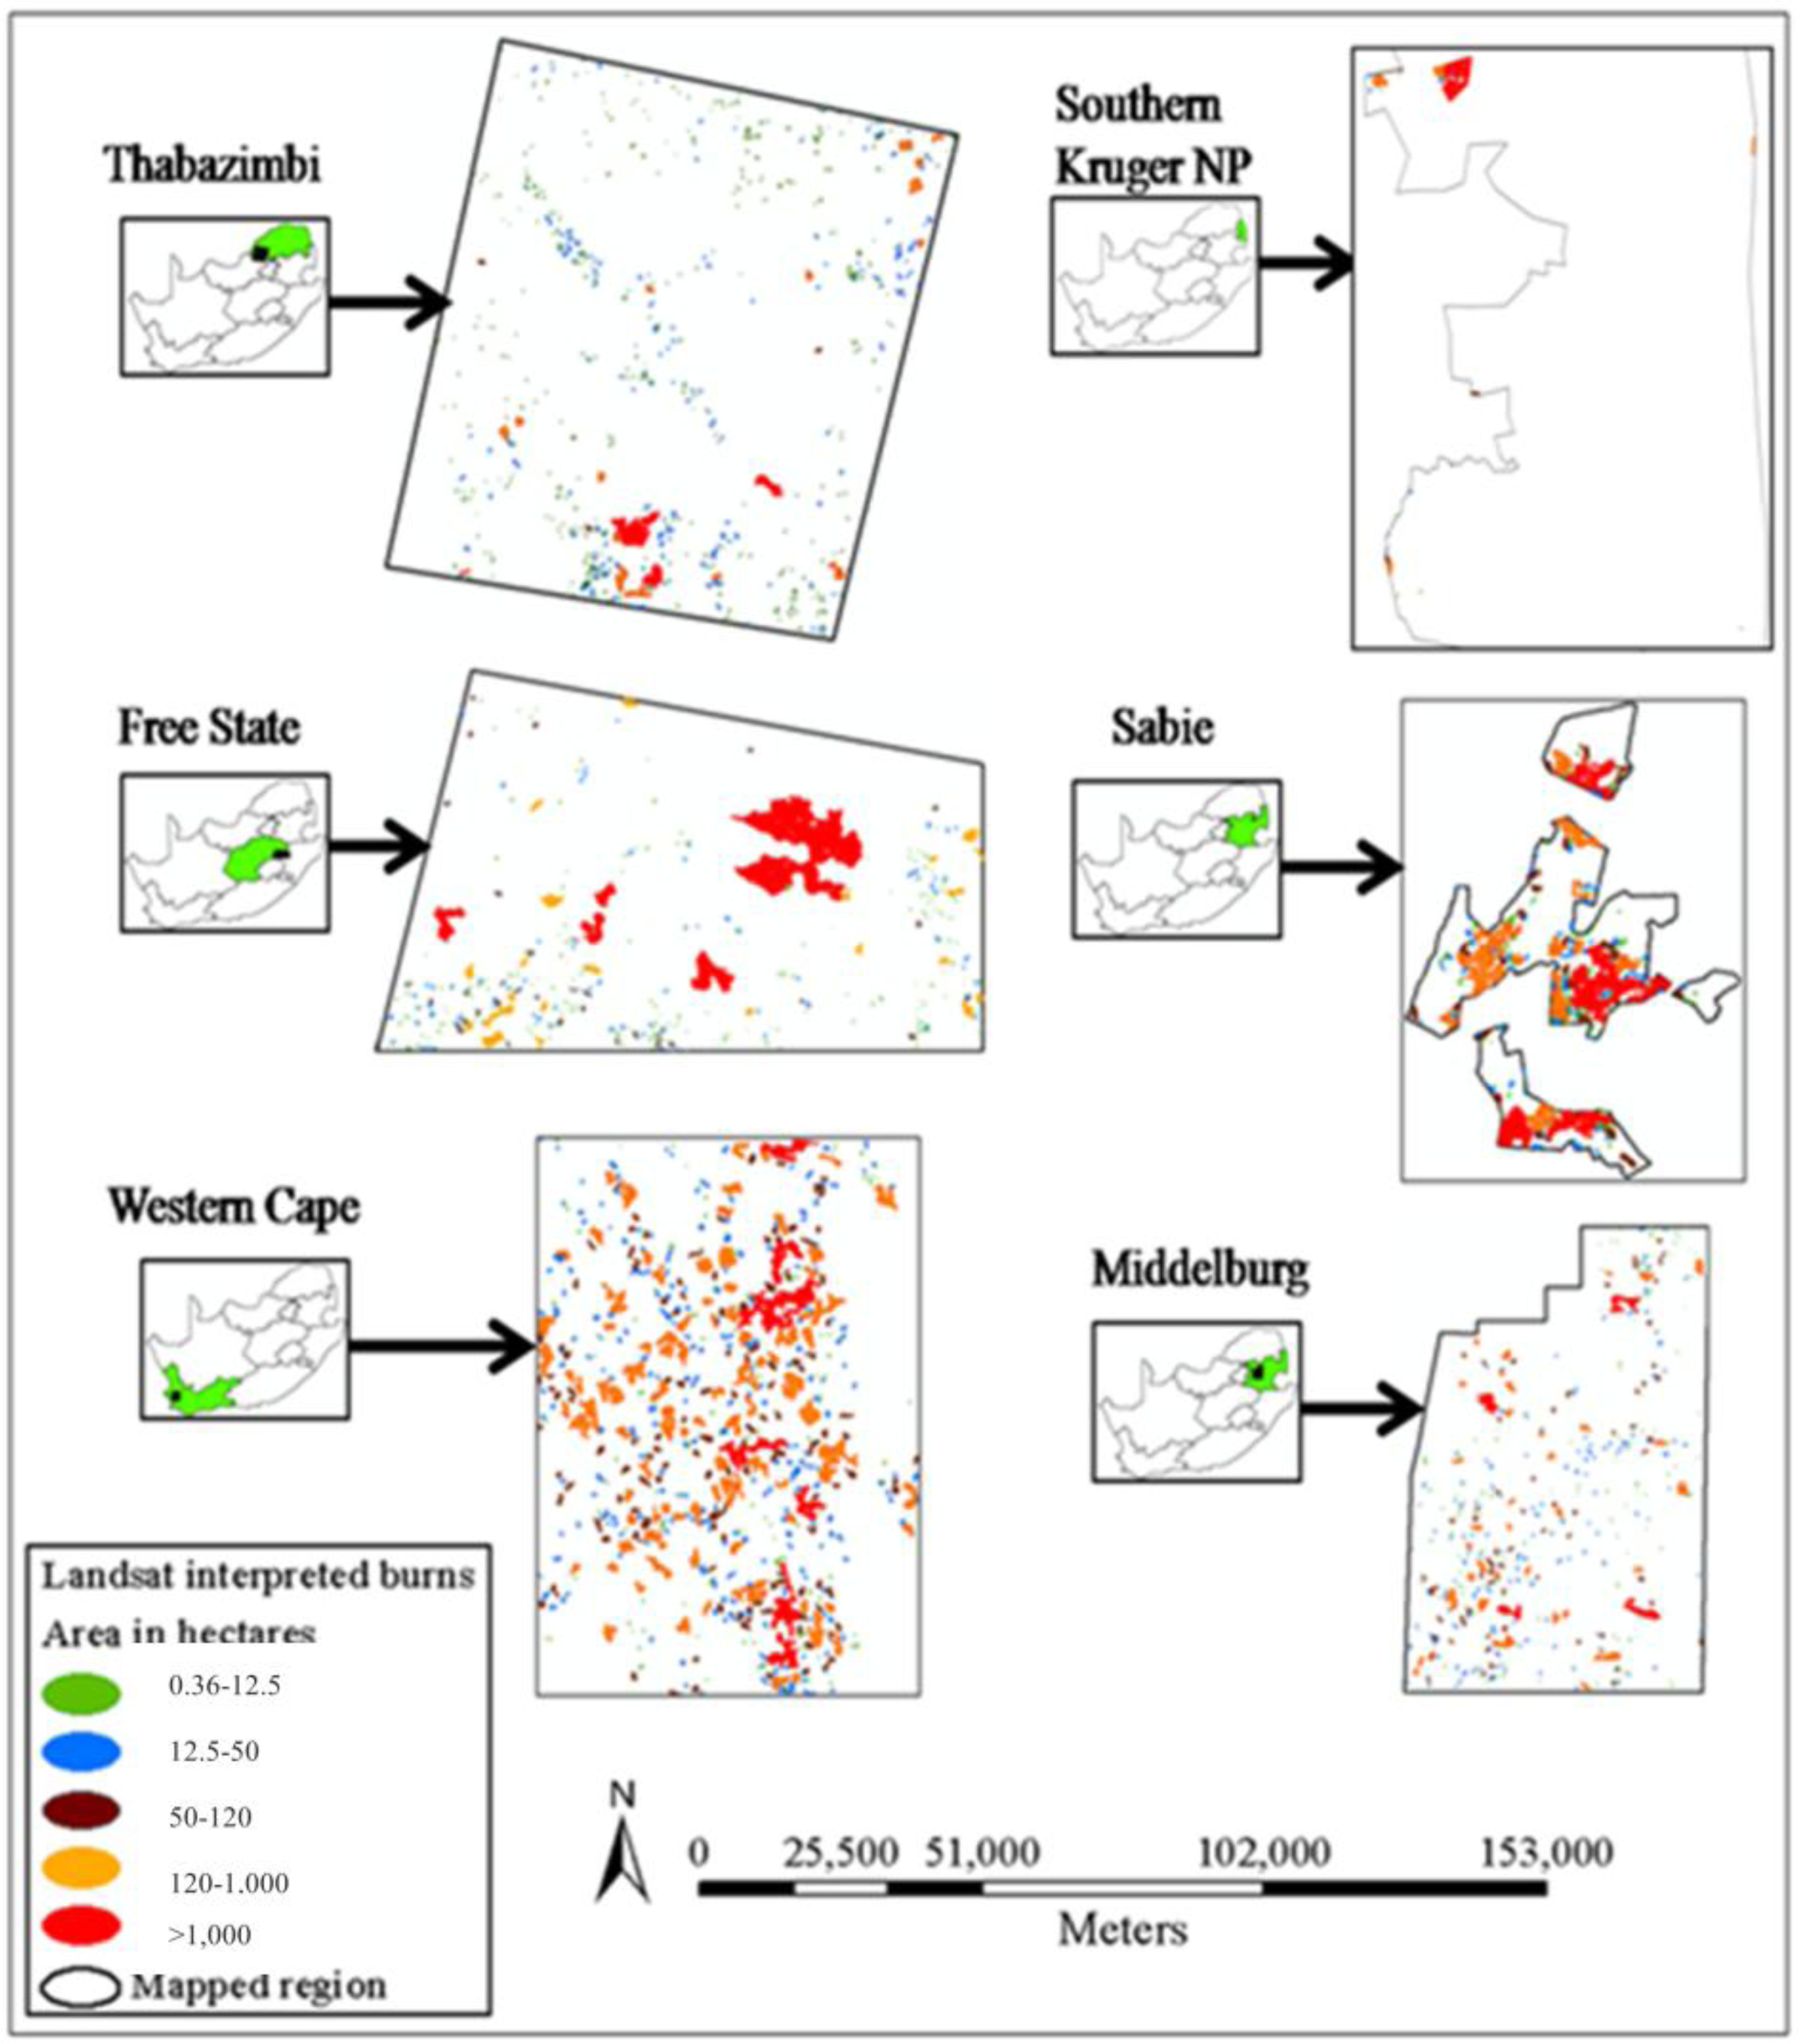
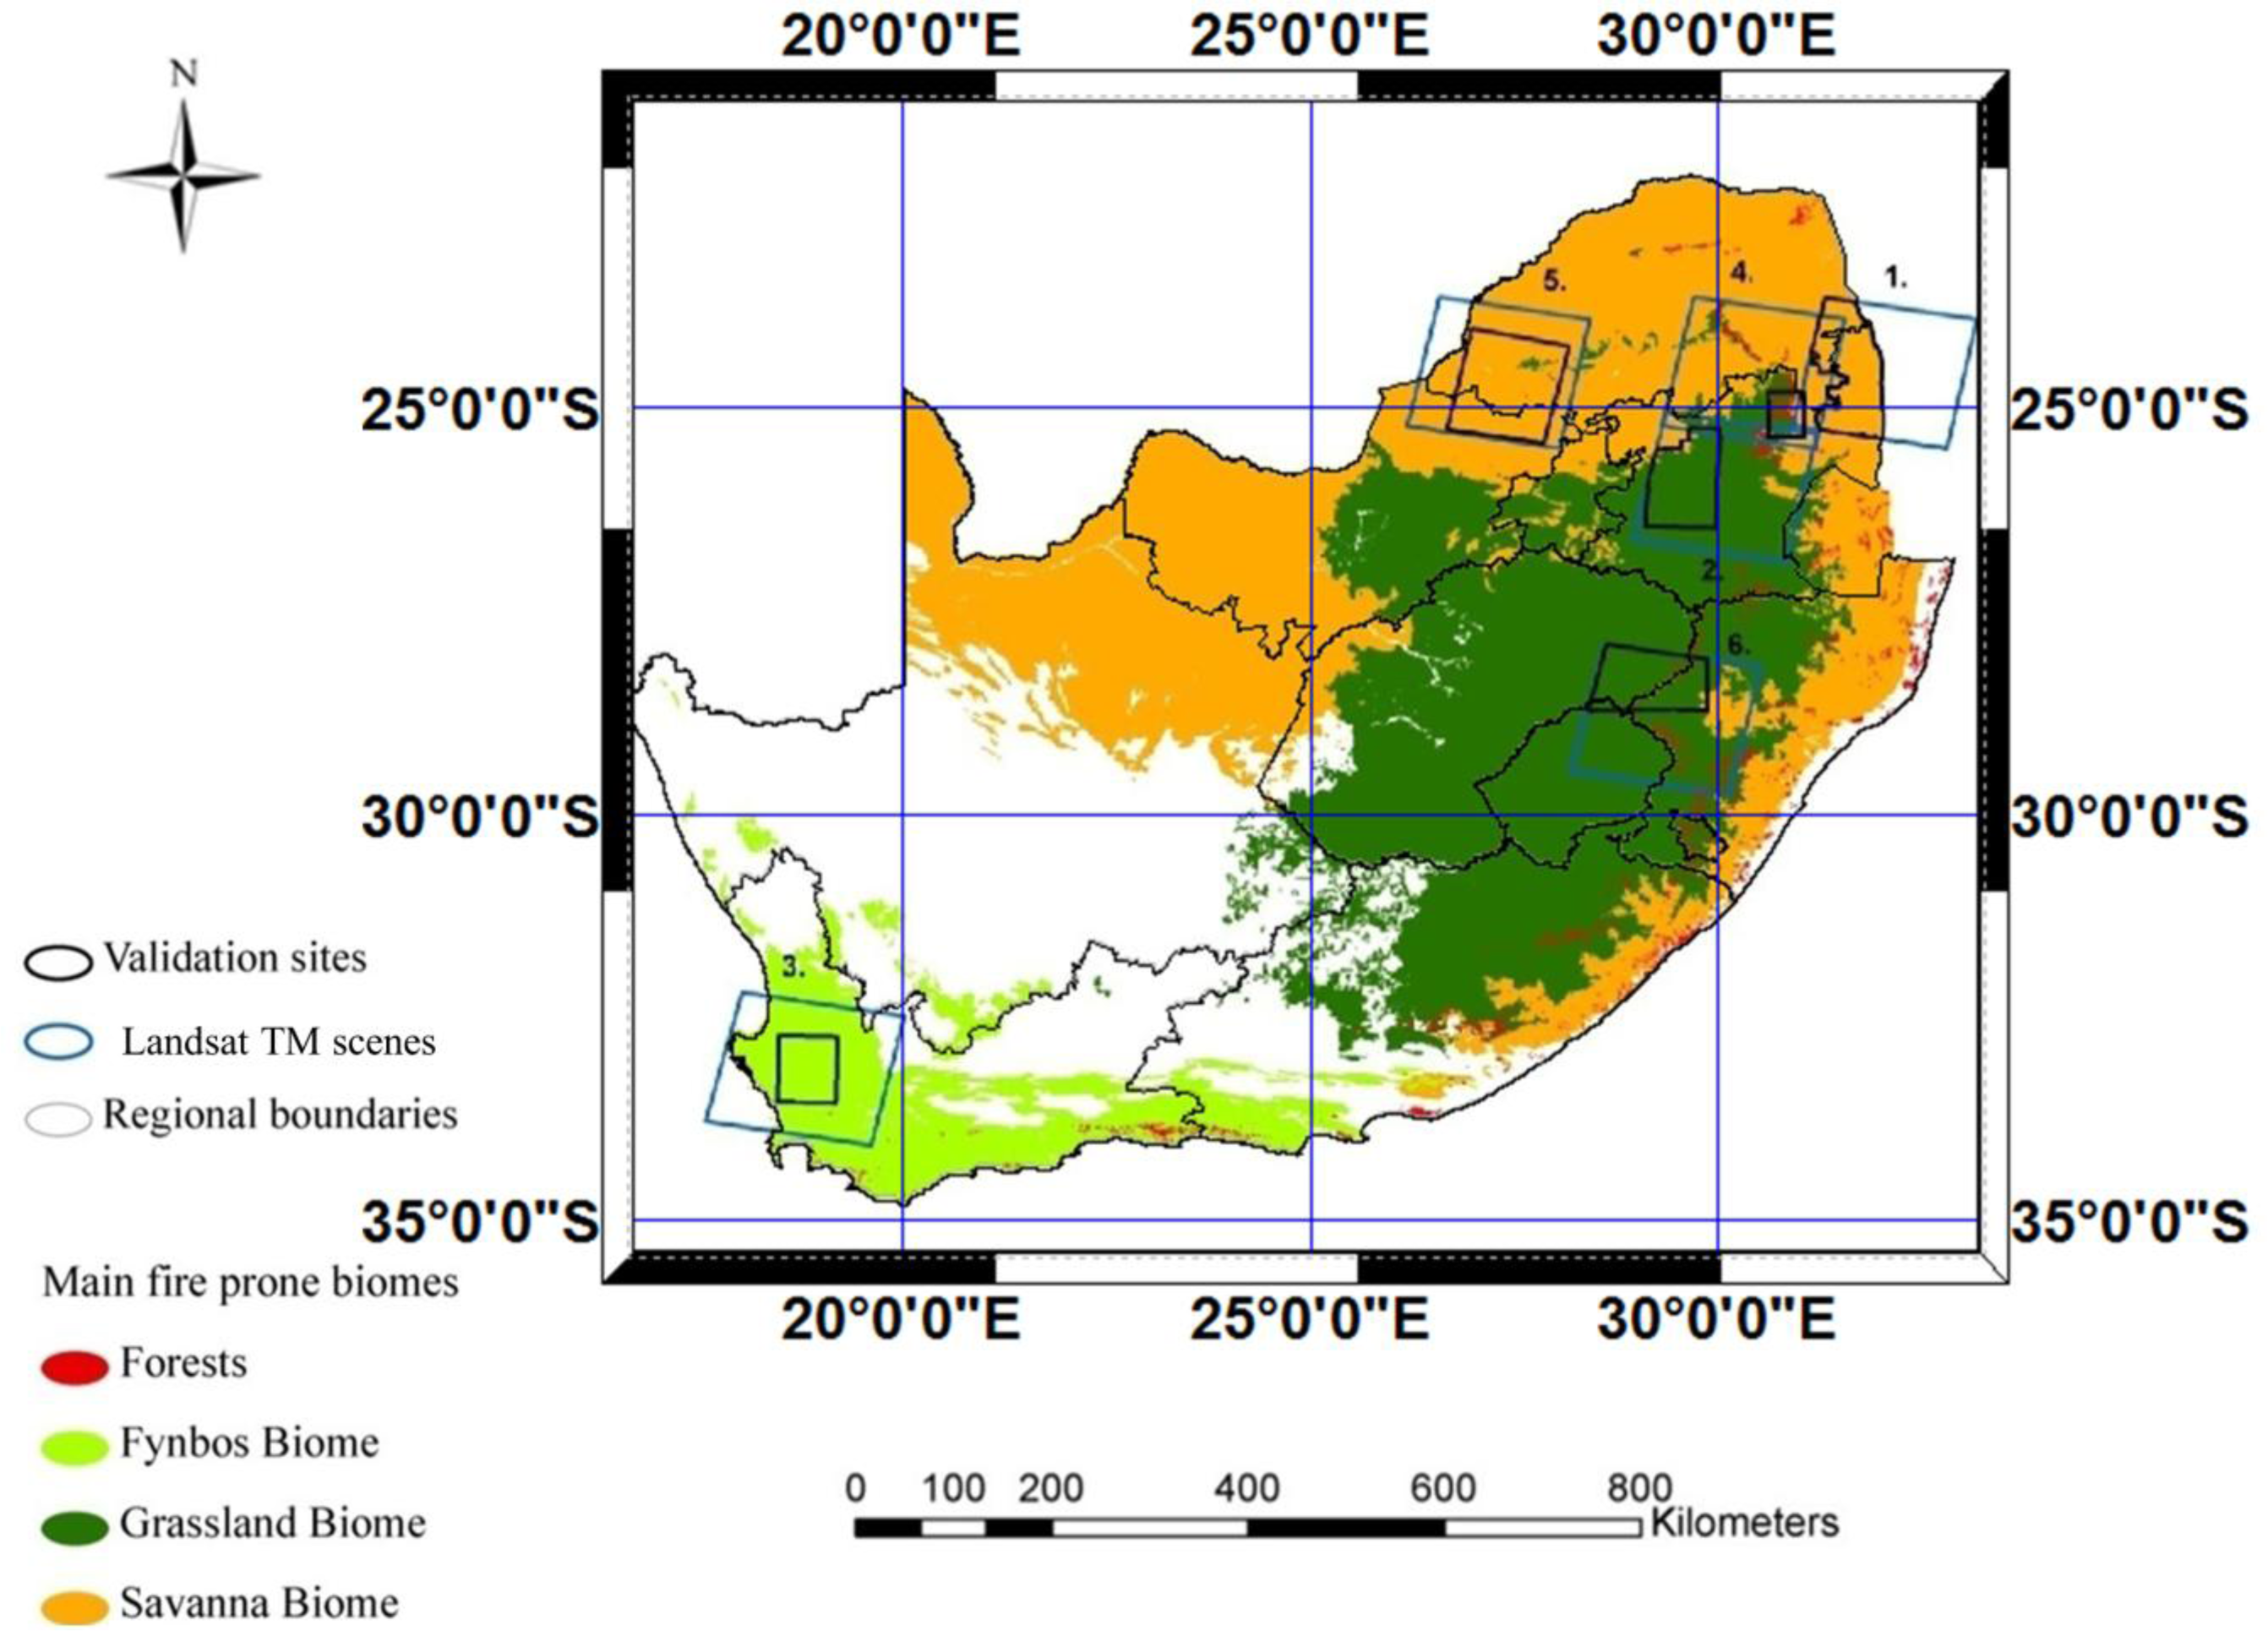
2.1. Description of Study Area

The January–April and June–September fire seasons of 2007 were considered in the analysis for various study sites (Figure 1), while the active fire data [23] and expert knowledge of the geographic regions susceptible to biomass burning were applied in the selection of six validation sites (Figure 1) in the savanna, grassland, fynbos biomes [24], as well as the exotic pine forest plantations [25,26]. Mean annual rainfall [27,28] in the study areas ranges from approximately 260–975 mm per annum (Table 1).
These sites encompass the main fire-prone biomes that typically burn almost every year, partly as a result of their dominant grassy layer, climate and topography [29,30].

2.2. Ancillary Datasets Used

In the current study, the national vegetation map [24] and the national land cover (NLC 2000) product [25,26] were used as ancillary datasets to provide the spatial detail of the region’s biome types. Furthermore, the 30-m Landsat 5 Thematic Mapper (TM) images (Table 1) were provided by the South African National Space Agency (SANSA) in tiff format processed to Level 1T (terrain and precision corrected). The temporal differences of the before and after fire images had different time intervals ranging from 16 to 64 days. At least 16 ground control points (GCPs) were selected uniformly throughout both TM images of each scene (with a total root mean square (RMS) error threshold of <0.5 pixel) and used to re-register the TM pairs precisely. Consequently, burned area reference datasets were independently derived from multi-date TM pairs (Figure 2) following the validation protocol described in [31] to validate the MODIS burned area products.

2.3. MODIS Burned Area Products

The MCD45A1 product is generated from 500-m MODIS cloud-free surface reflectance time series data using a predictive bidirectional reflectance modeling approach [3]. On the other hand, the MCD64A1 product uses the “active-fire based burned area mapping algorithm” developed by [9] applied on the 500-m MODIS cloud-free surface reflectance imagery [32]. It is important to note that active fire (training) data used in the latter algorithm may not fully represent regions dominated by small and fragmented burned areas, and therefore, such regions would generally result in large omission errors according to MCD64A1 [9]. Unlike MCD64A1, the approach used to generate the MCD45A1 product makes no use of training samples, but rather, relies heavily on change in surface reflectance and a static wavelength threshold [3,5,13]. Both MCD45A1 and MCD64A1 are released by the University of Maryland as monthly products that depict the location and approximate ordinal day (1–366) of burned areas at 500 m × 500 m spatial resolution [9,13]. For the purpose of comparison, these products were re-projected to correspond with the Landsat Universal Transverse Mercator (UTM) projection of each scene while retaining their output pixel-dimension at 500-m spatial resolution [19].
Unlike the MCD45A1 and MCD64A1 products, the 500-m empirically-derived MODIS merged burned-area product was produced in this study by temporally aggregating the monthly MCD45A1 and MCD64A1 products. Only the burn dates falling within each month were selected, and the dates outside of that particular month were discarded, as this data overlapped between consecutive months [3]. Further, the individual pixel burn dates of both the MCD45A1 and MCD64A1 products were analyzed for temporal proximity (Table 2).
Table 2 reveals that both products contained a significant number of pixels with burn dates that were too close together (i.e., eight or less days apart) to be two independent fire events. A temporal separation of zero means that both products had detected burned area for the same pixel on the same day. Nearly all the other burn dates with n > 0 occurred towards the end of one month and the beginning of the next month (Table 2). Therefore, if two burn dates for a particular pixel were within eight days of each other and spanned a month boundary, then they were treated as a single fire event, and the earlier of the two dates was chosen as definitive for the event.

3. Methodology

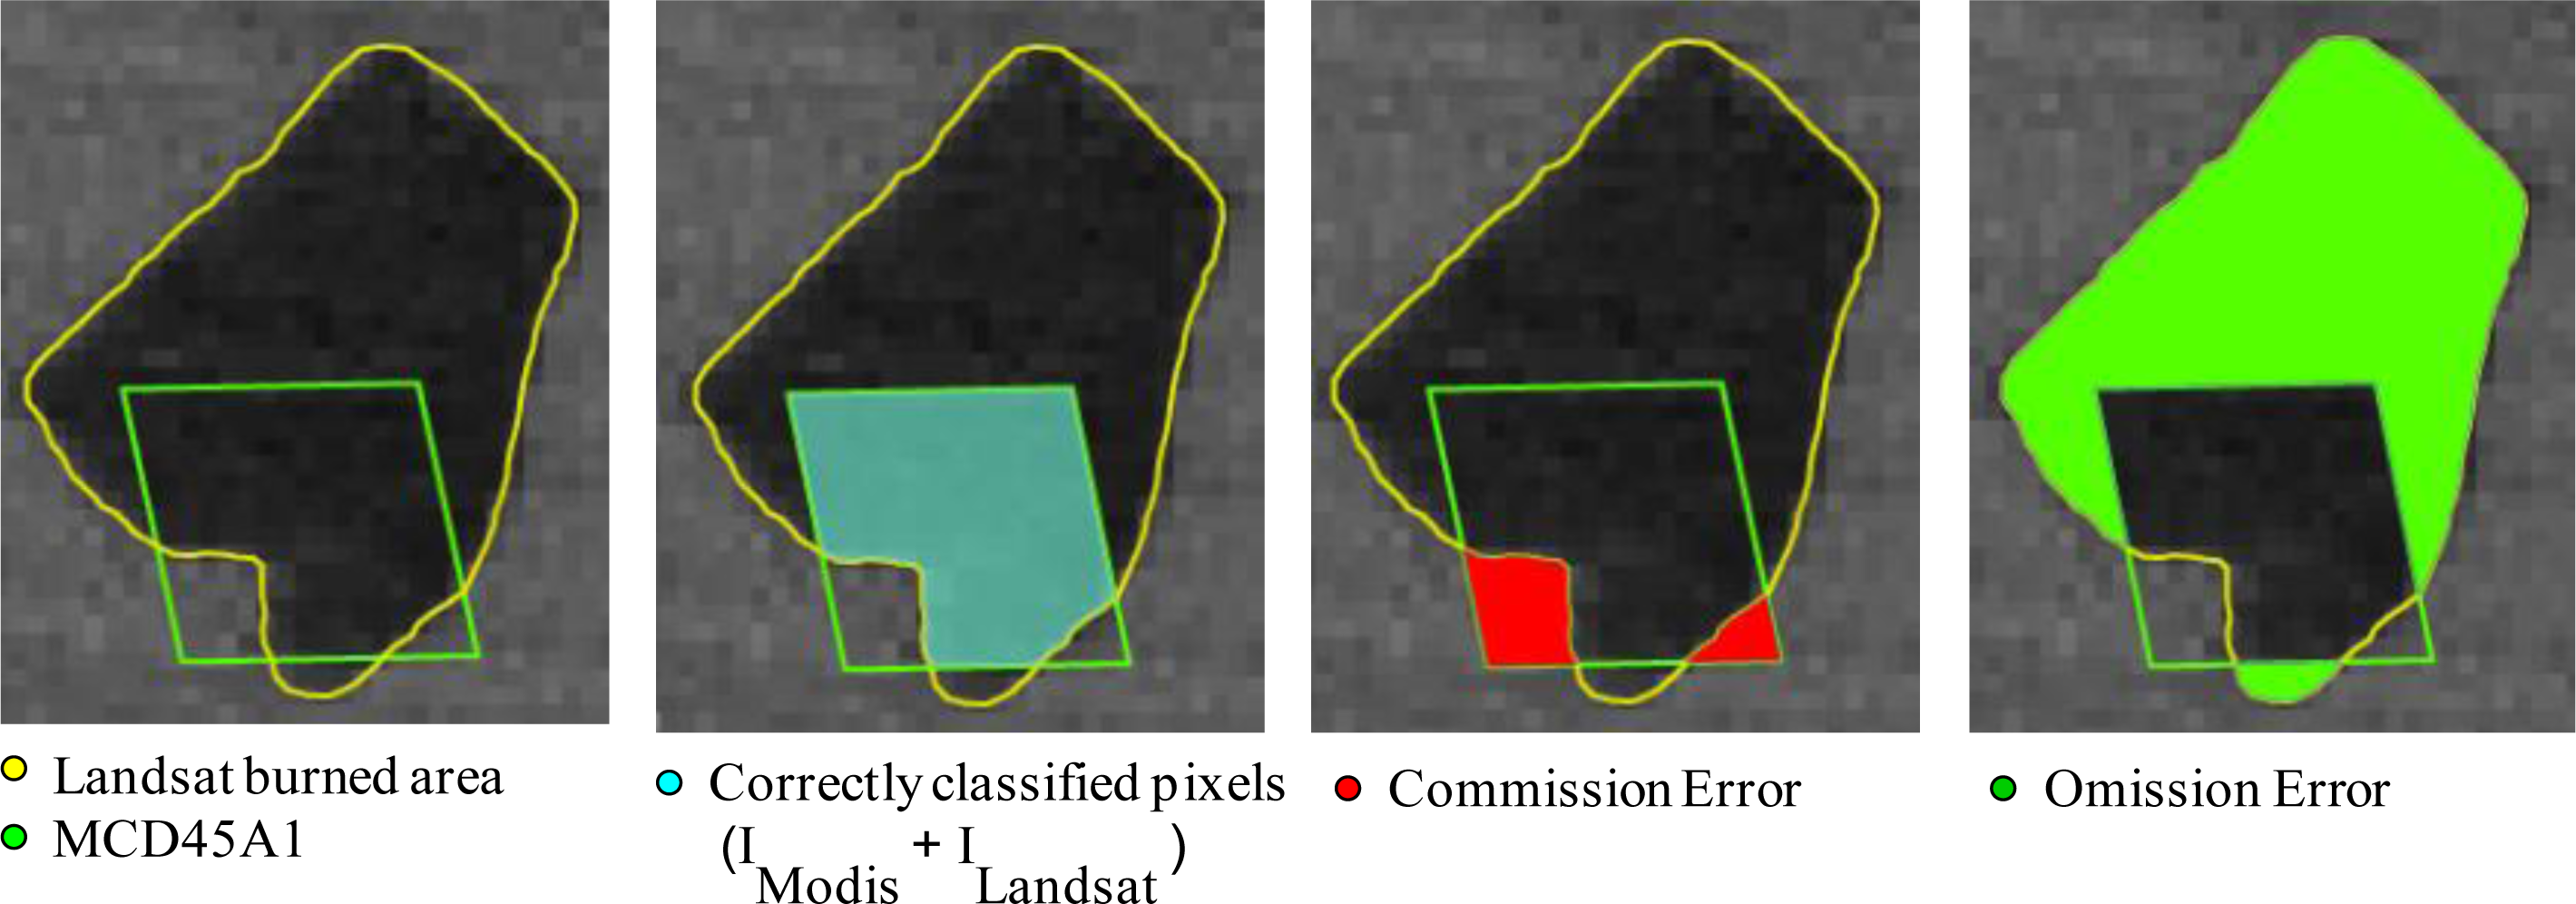
3.1. Assessing the Error of MCD45A1 and MCD64A1 Products

A classification error assessment was conducted by using an error matrix [33] to compute the commission and omission errors (hereafter, Ce and Oe, respectively) present in the MODIS satellite-derived burned area products. In particular, Ce and Oe were derived for each study site by comparing the 500-m MODIS burned area products with the 30-m Landsat reference data using Equation (1),
1 C e = I Modis + I Landsat I All _ Modis 1 O e = I Modis + I Landsat I All _ Landsat
where IModis + ILandsat represents the intersection of the MODIS and Landsat burned area at 30-m resolution, IAll_Modis are the pixels at 30-m resolution of the resampled MODIS burned area and IAll_Landsat are the pixels at 30-m resolution of the Landsat burned area.
An example of classification accuracy assessment using Equation (1) based on the MCD45A1 product is illustrated in Figure 3. It is evident that according to the error matrix, when the burned area product does not map the same extent of area burned as the reference data (Landsat interpreted burned area), a Ce and/or Oe is introduced in the product being evaluated [34]. As a result, this method does not take into account the fractional burned area and is therefore susceptible to inherent classification biases.

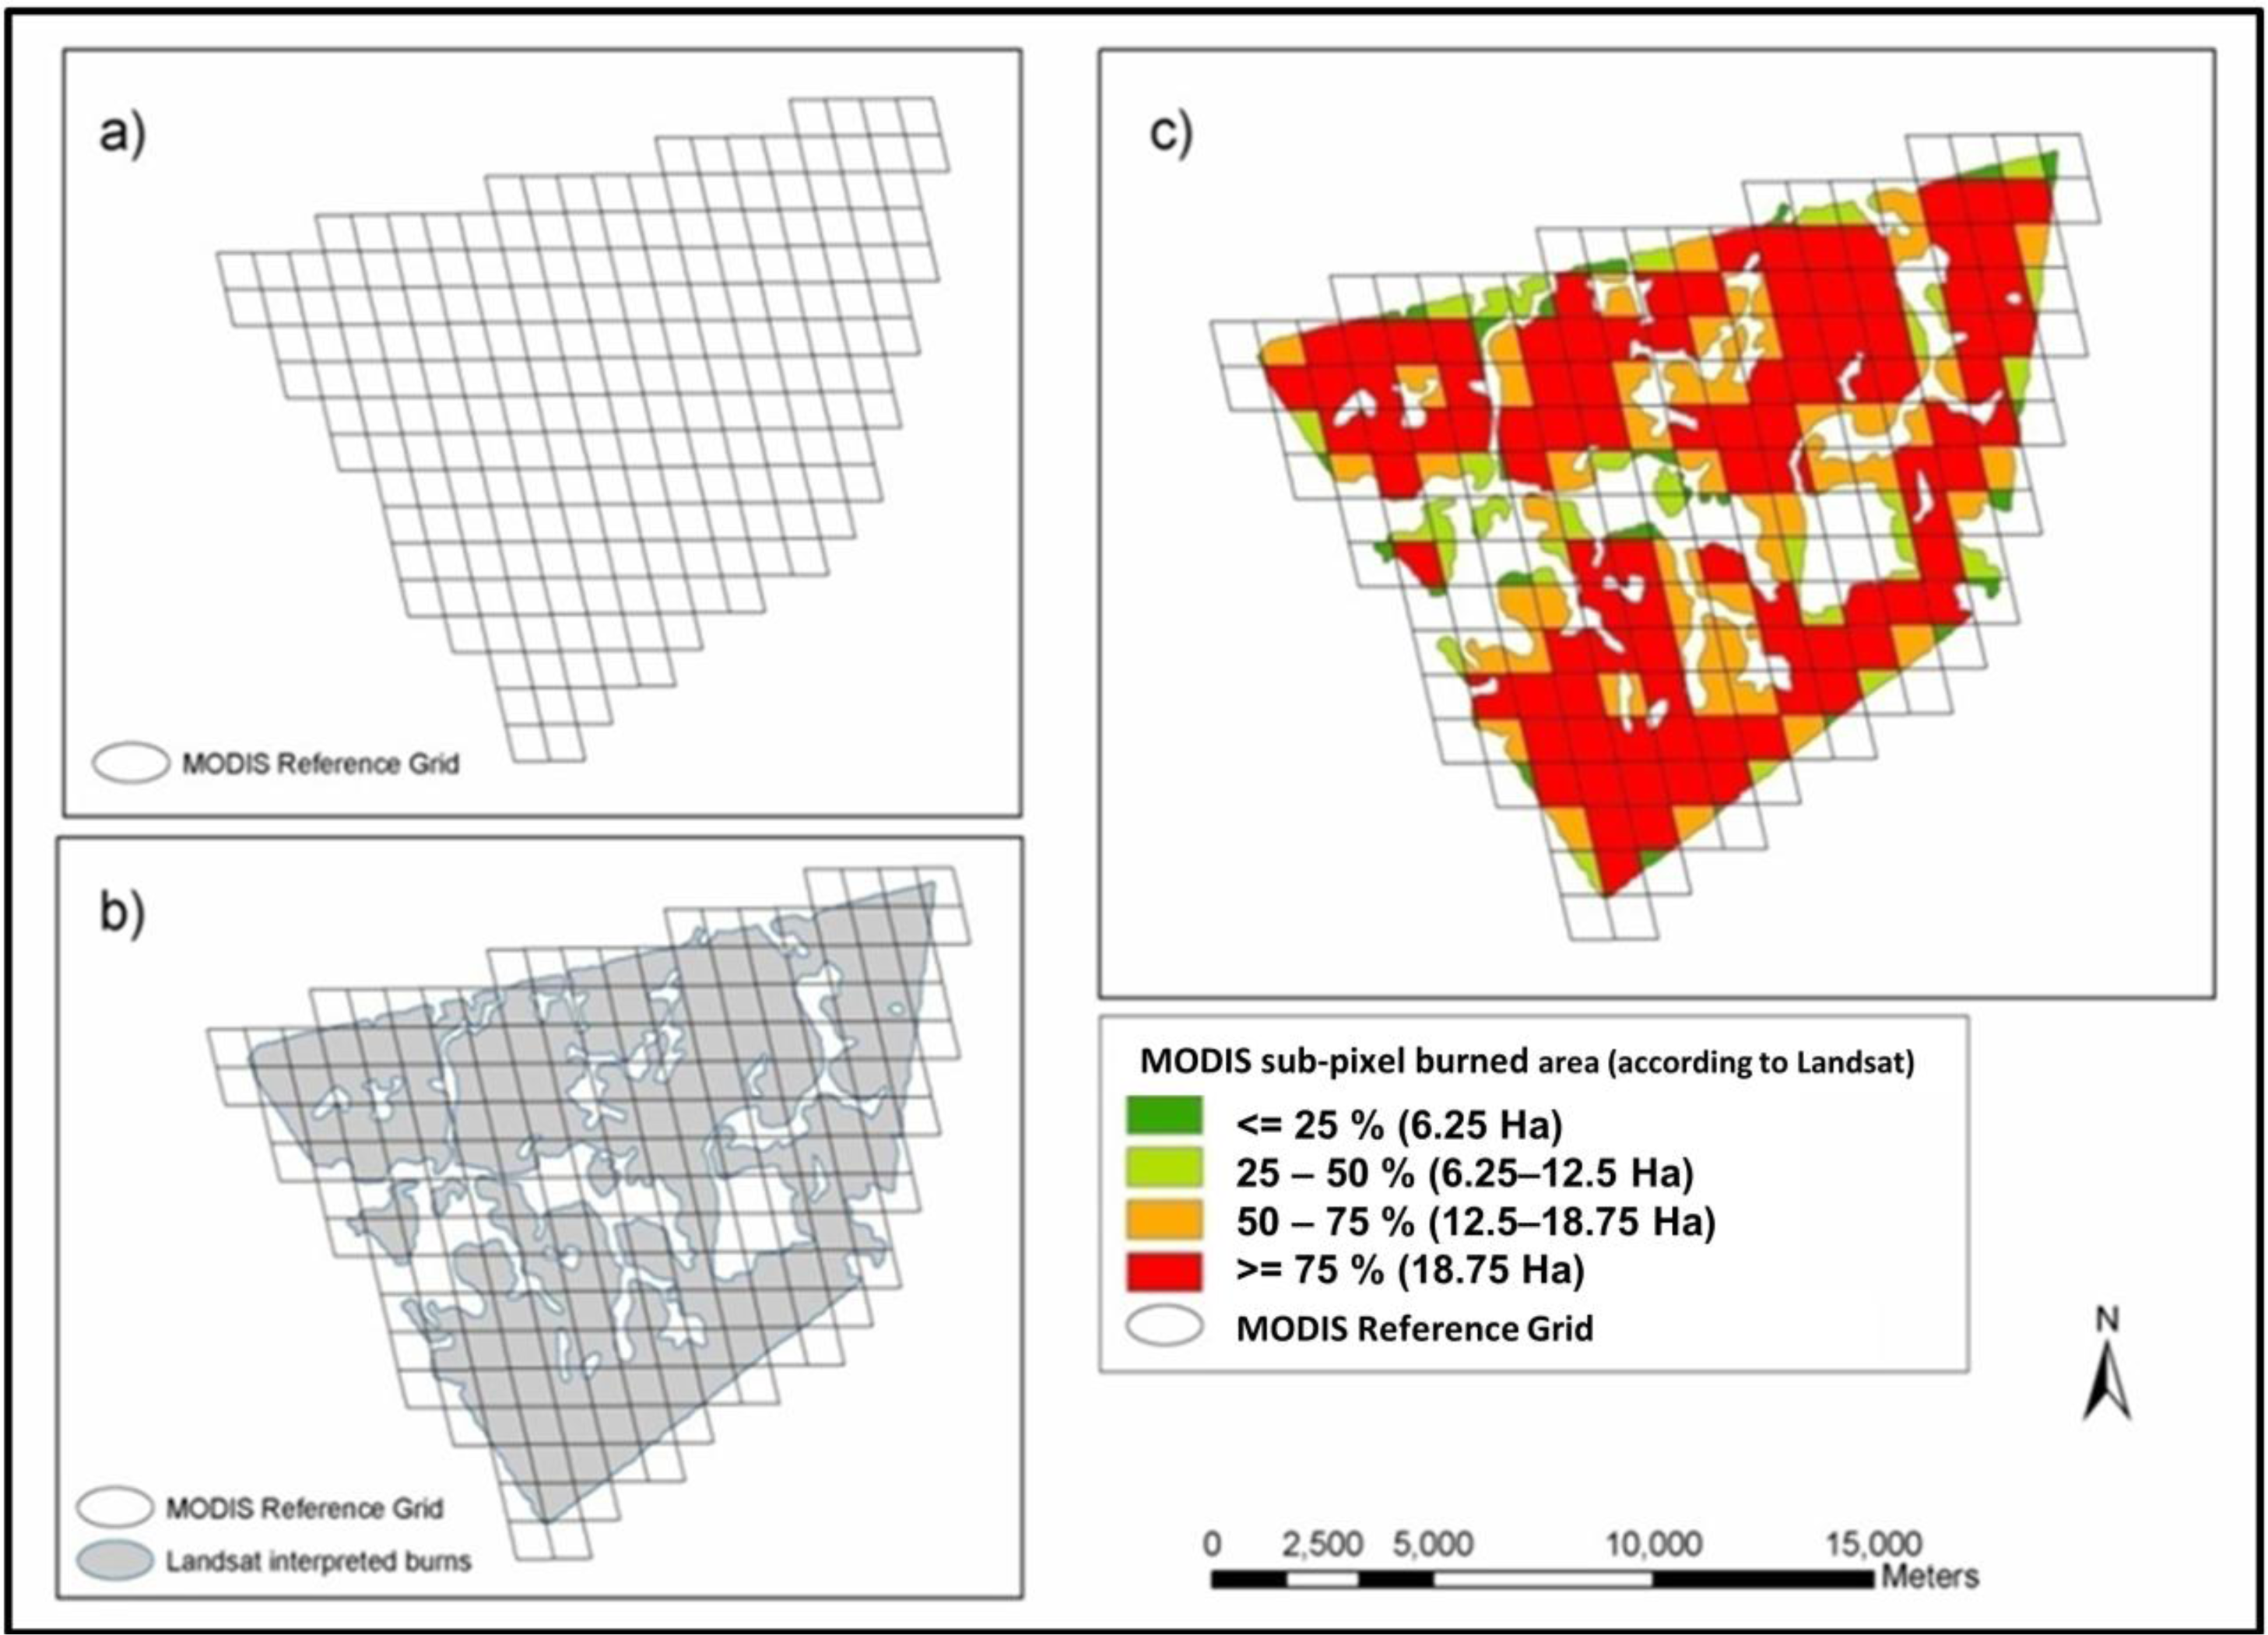
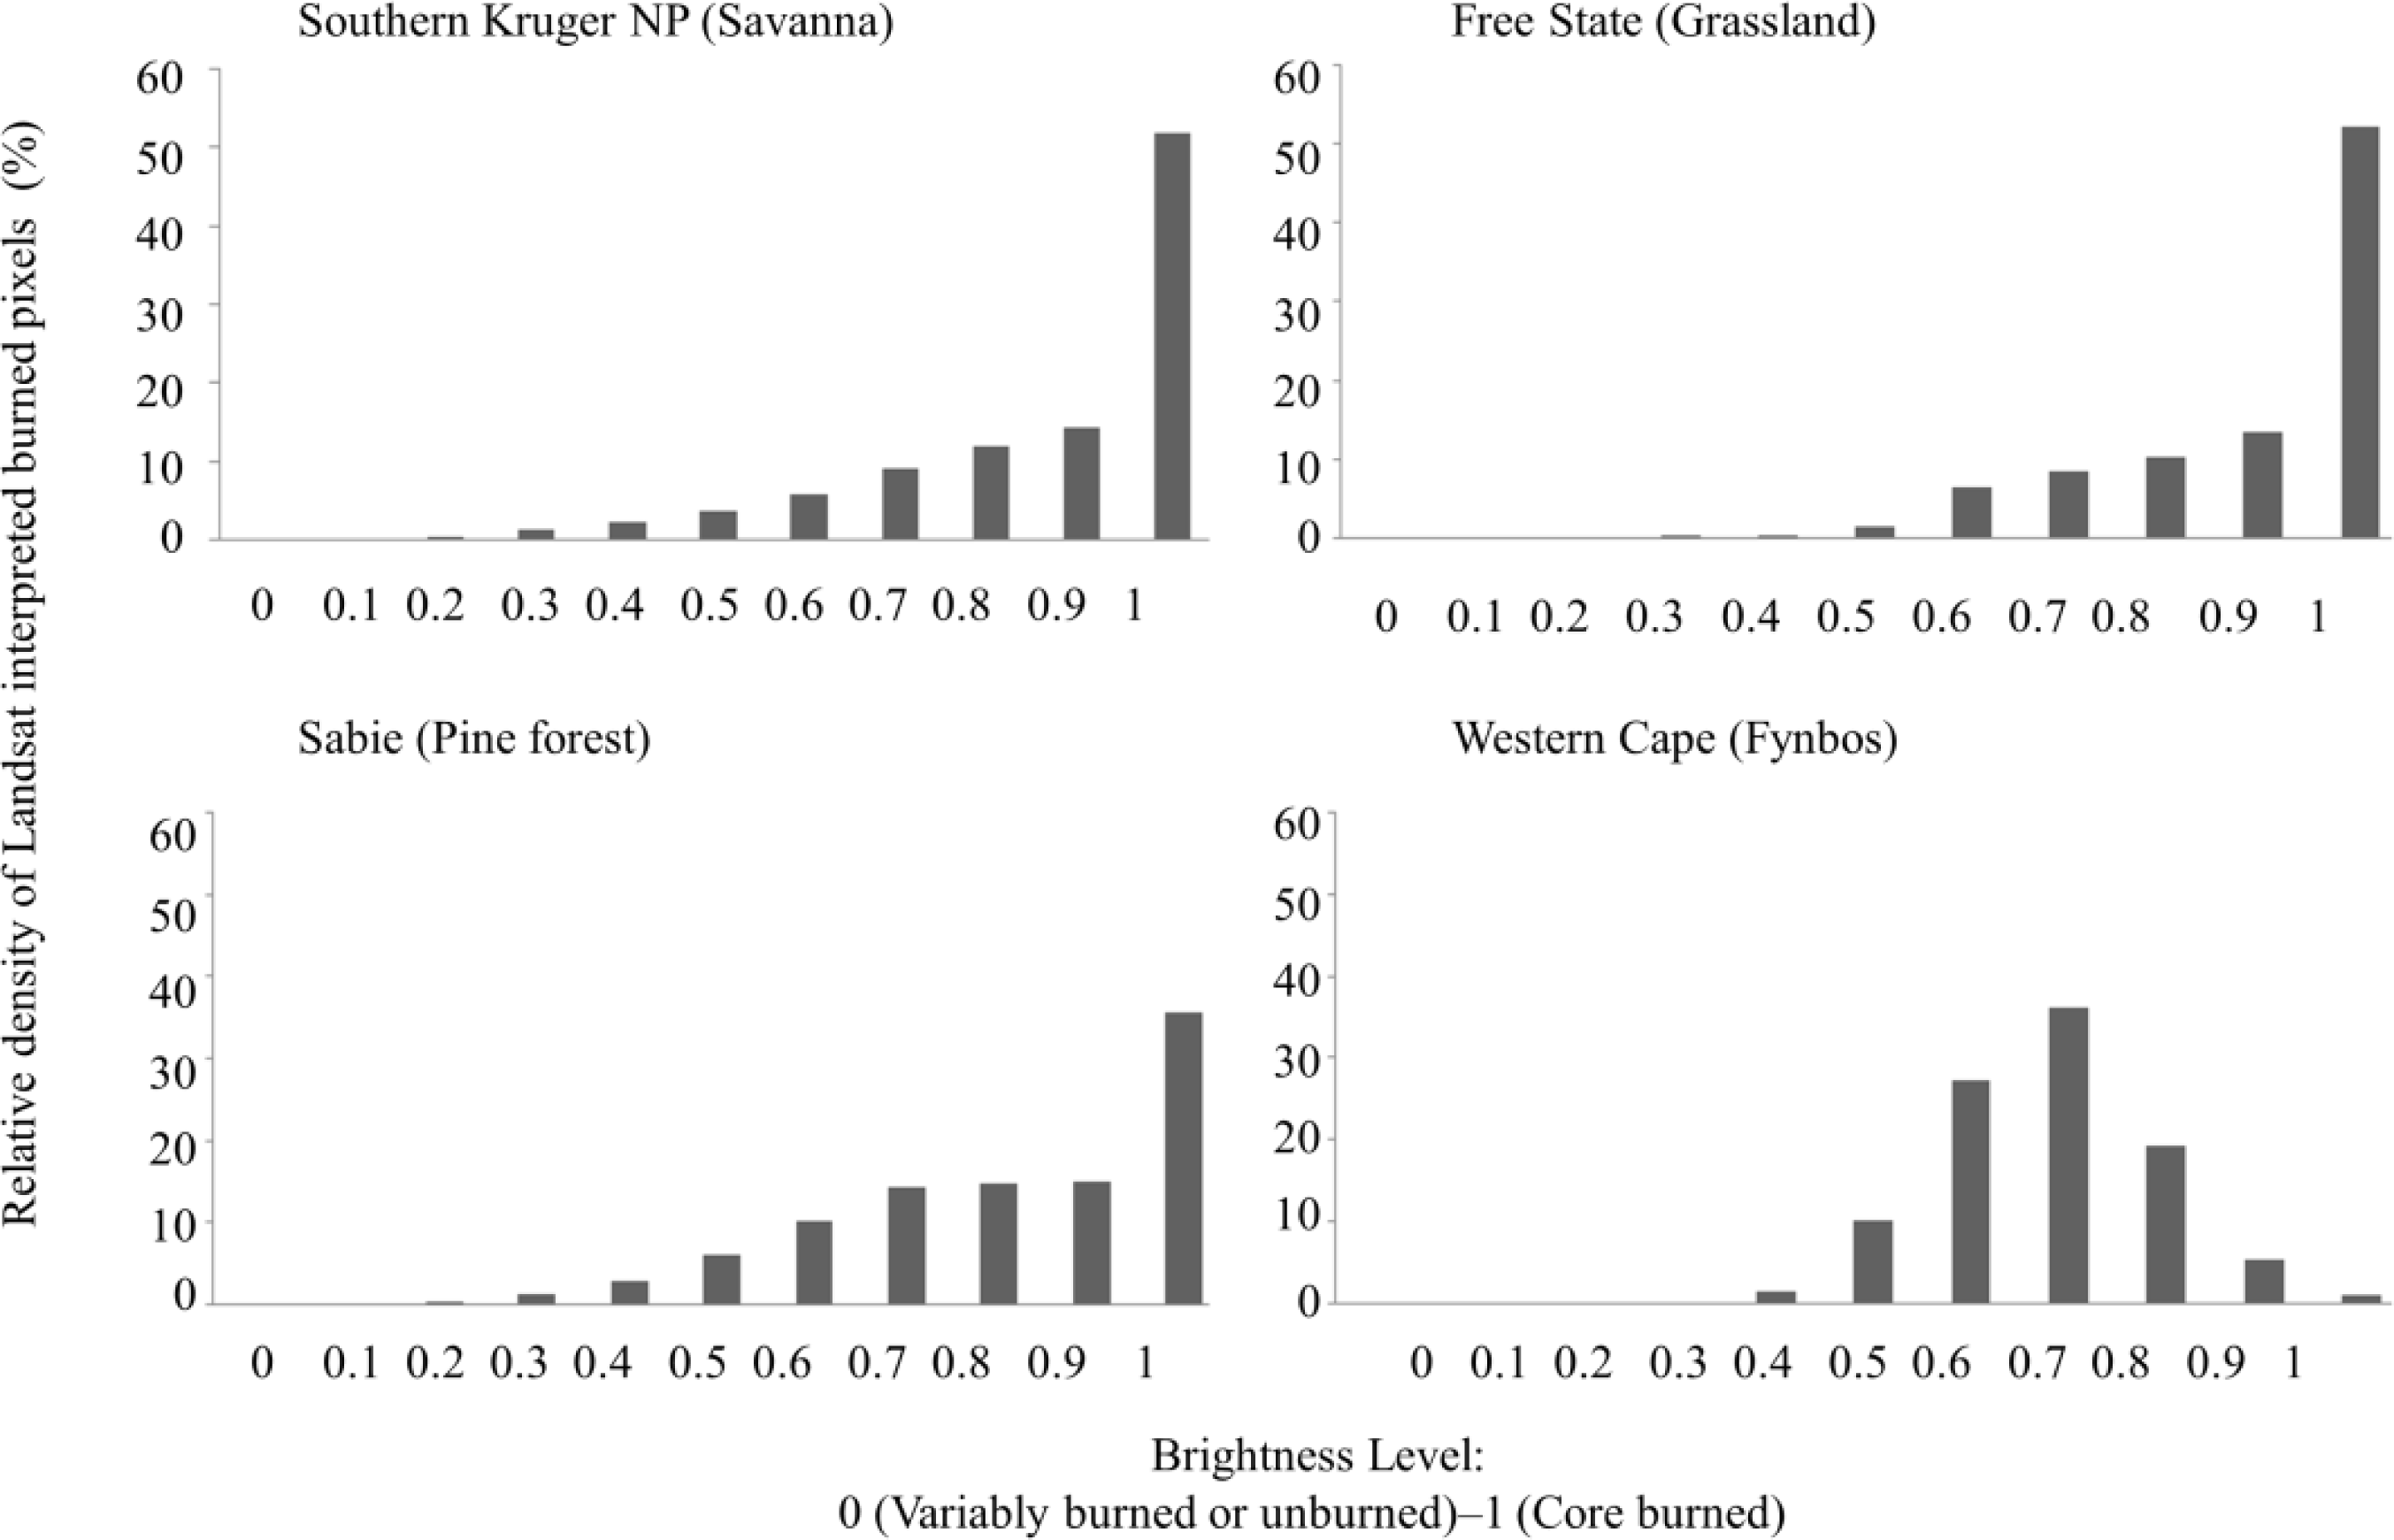
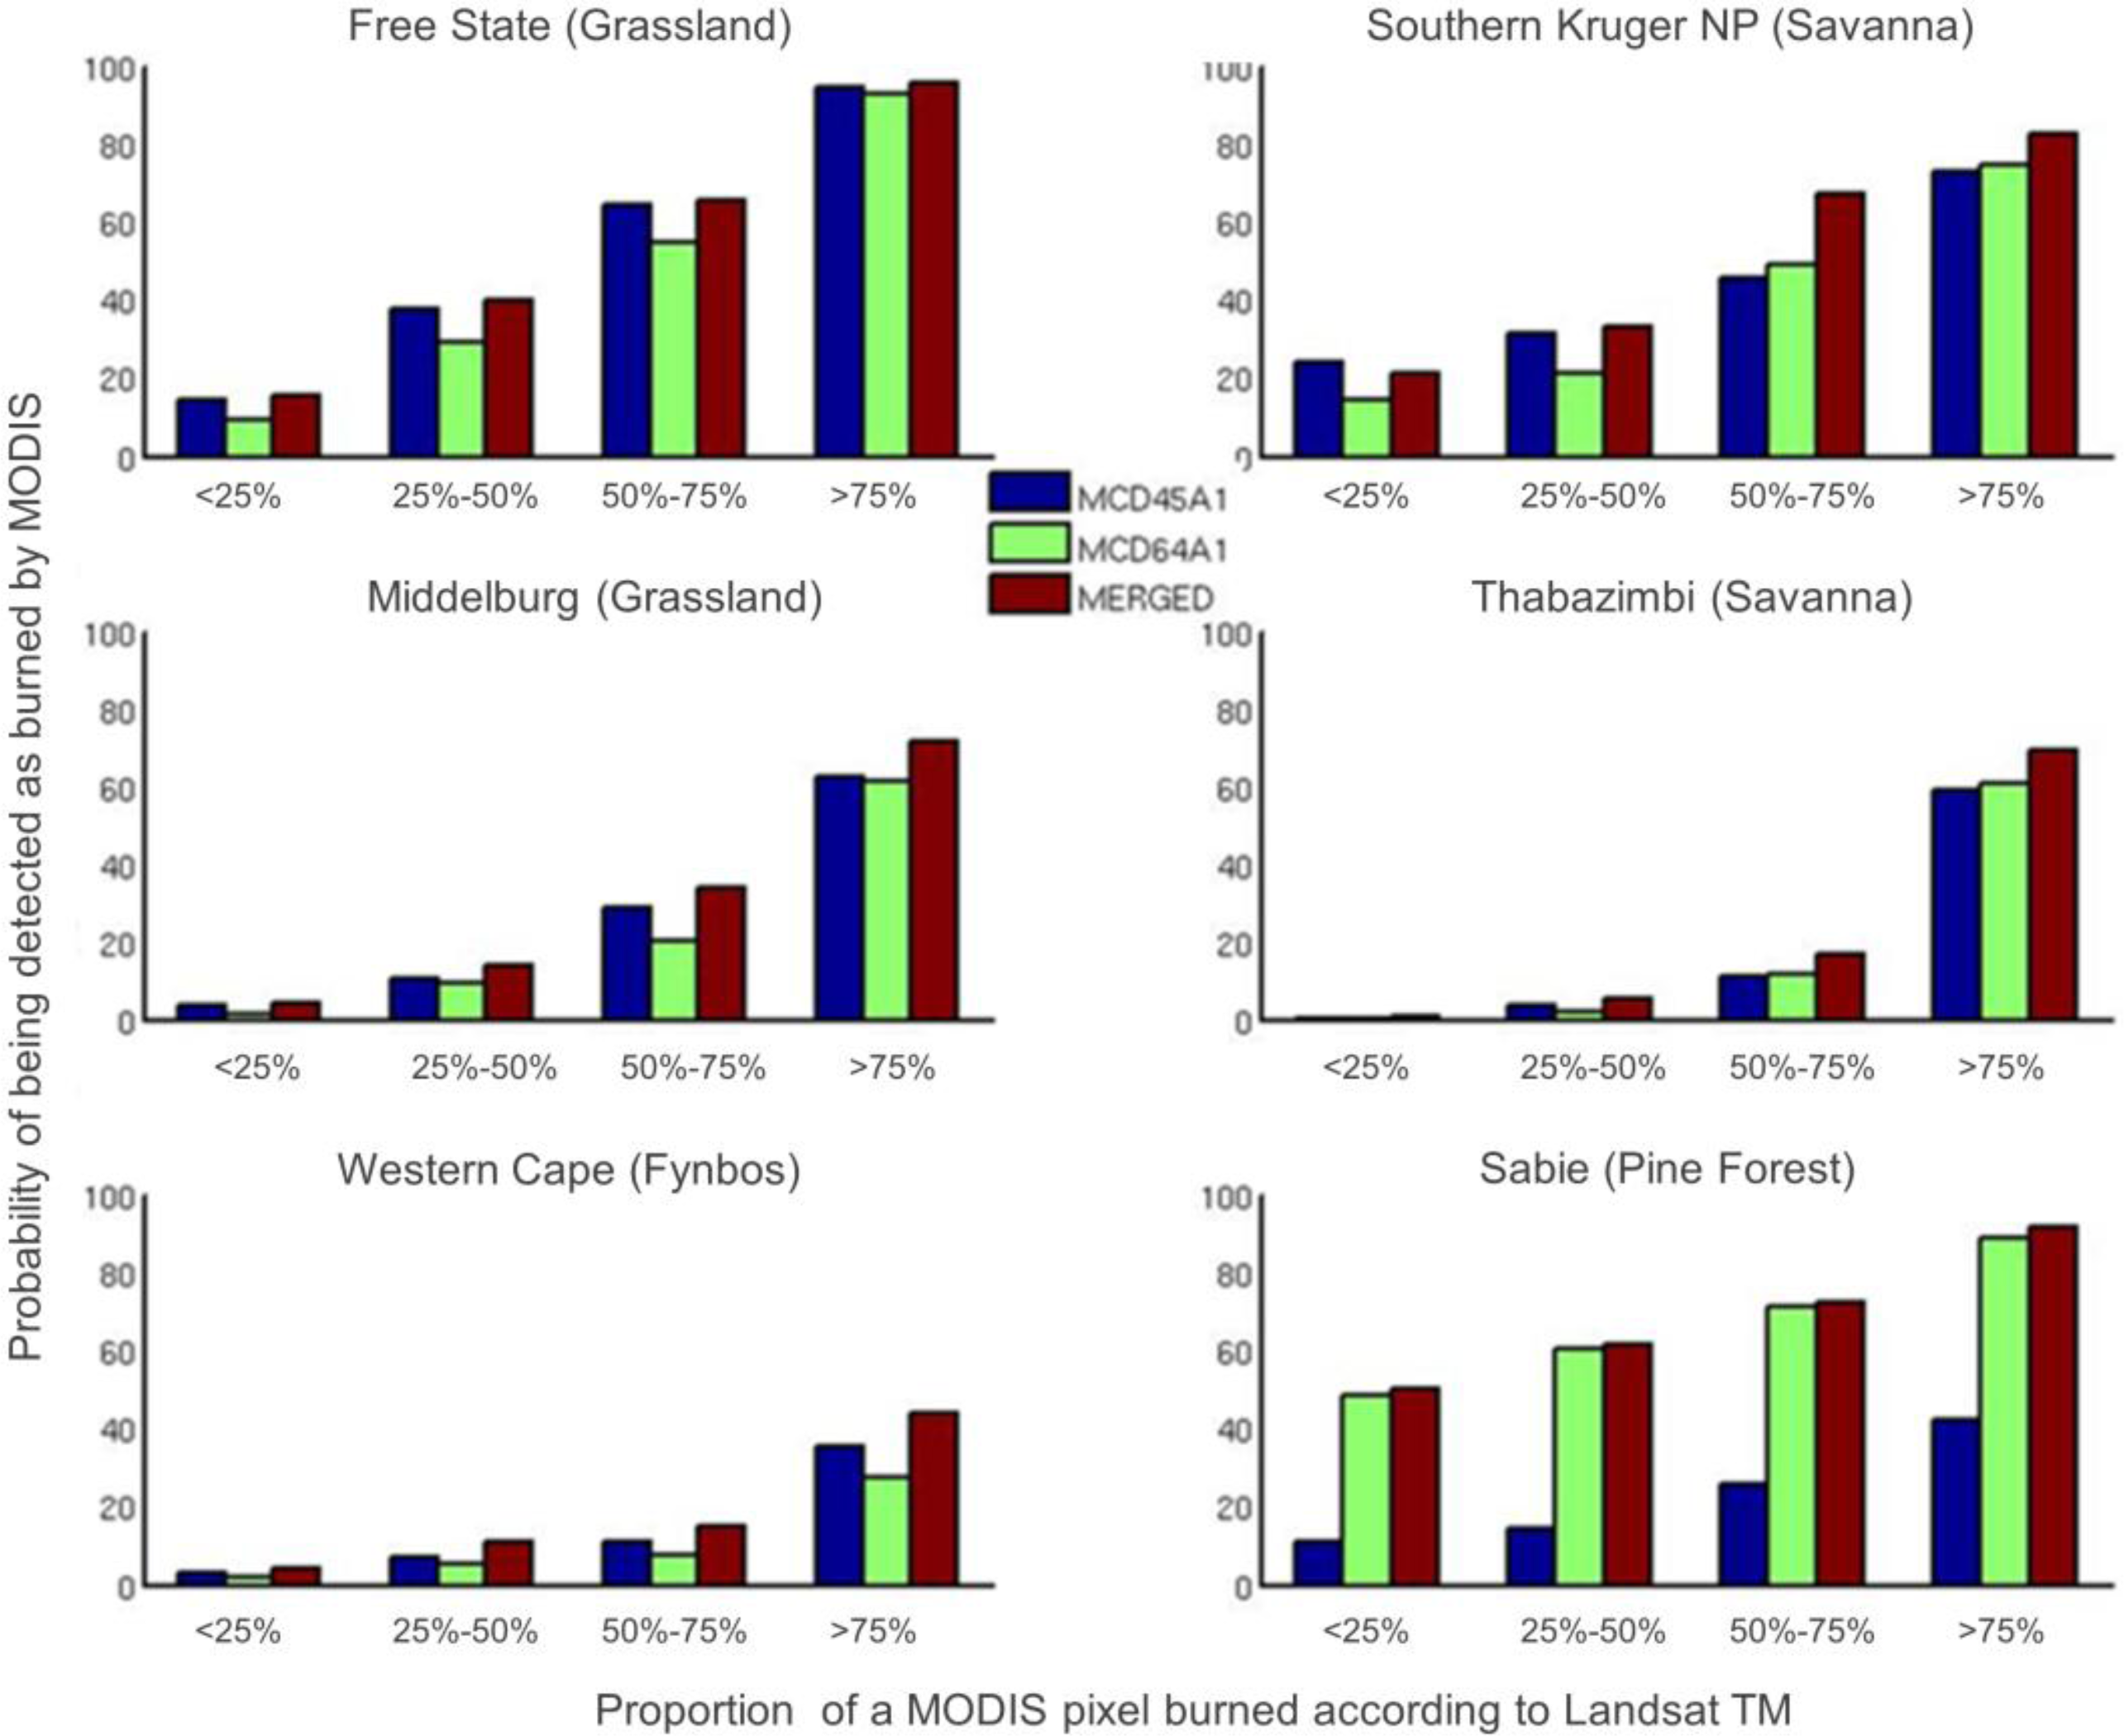
3.2. Classification Error Assessment of the MCD45A1, MCD64A1 and Merged Products in Relation to the Fractional Sub-Pixel Burned Area

The classification error assessment [19] (Figure 3) considered the entire 500-m MODIS pixel as either burned or unburned and assessed the 500-m pixel in relation to all the 30-m Landsat reference pixels it contained. As a result, the fractional sub-pixel burned area within a 500-m pixel was not considered, and an overestimation of error during the assessment of the moderate-resolution burned-area products could be inherent [34]. In the polygon-based analysis procedure considered here, a fixed 500-m reference grid was generated from the MODIS imagery and overlaid onto the Landsat interpreted burned areas (Figure 4). These grids were then utilized to compute proportions (fractional sub-pixel) of the burned area within each 500-m MODIS grid cell according to the Landsat data.
The computed proportions were subsequently categorized into four classes of ≤25% (6.25 ha), 25%–50% (6.25–12.5 ha), 50%–75% (12.5–18.75 ha) and ≥75% (18.75 ha) of a MODIS pixel burned according to the Landsat TM data. The burned area products were analyzed and compared across each class in order to determine their probability of detection, derived as 100%; Oe for the different sizes of burned area fractions across the sites. Further, in order to account for the inherent error in burned areas due to the difference in resolution (30-m vs. 500-m pixels), a classification accuracy assessment of the MCD45A1, MCD64A1 and merged product based on 500-m MODIS pixels that are ≥50% burned according to the Landsat reference data was carried out based on indices derived from Equations (2) and (3) as follows:
O e 50 % = MODIS ba 50 % ( flagged _ as _ 0 ) MODIS ref 50 % ( according _ to _ Landsat )
C e 50 % = MODIS ba < 50 % ( flagged _ as _ 1 ) MODIS ref < 50 % ( according _ to _ Landsat )
where ba denotes the 500-m MODIS burned pixel and ref denotes the 500-m MODIS pixel burned to a specified fraction according to the Landsat data. These two equations were also applied to 500-m MODIS pixels that are ≥75% burned according to the Landsat reference data. The analysis method presented in Equations (2) and (3) addresses the concerns raised [9] about the reliability of detecting burned areas that correspond to at least 50% (∼13 ha) of a 500-m MODIS pixel.

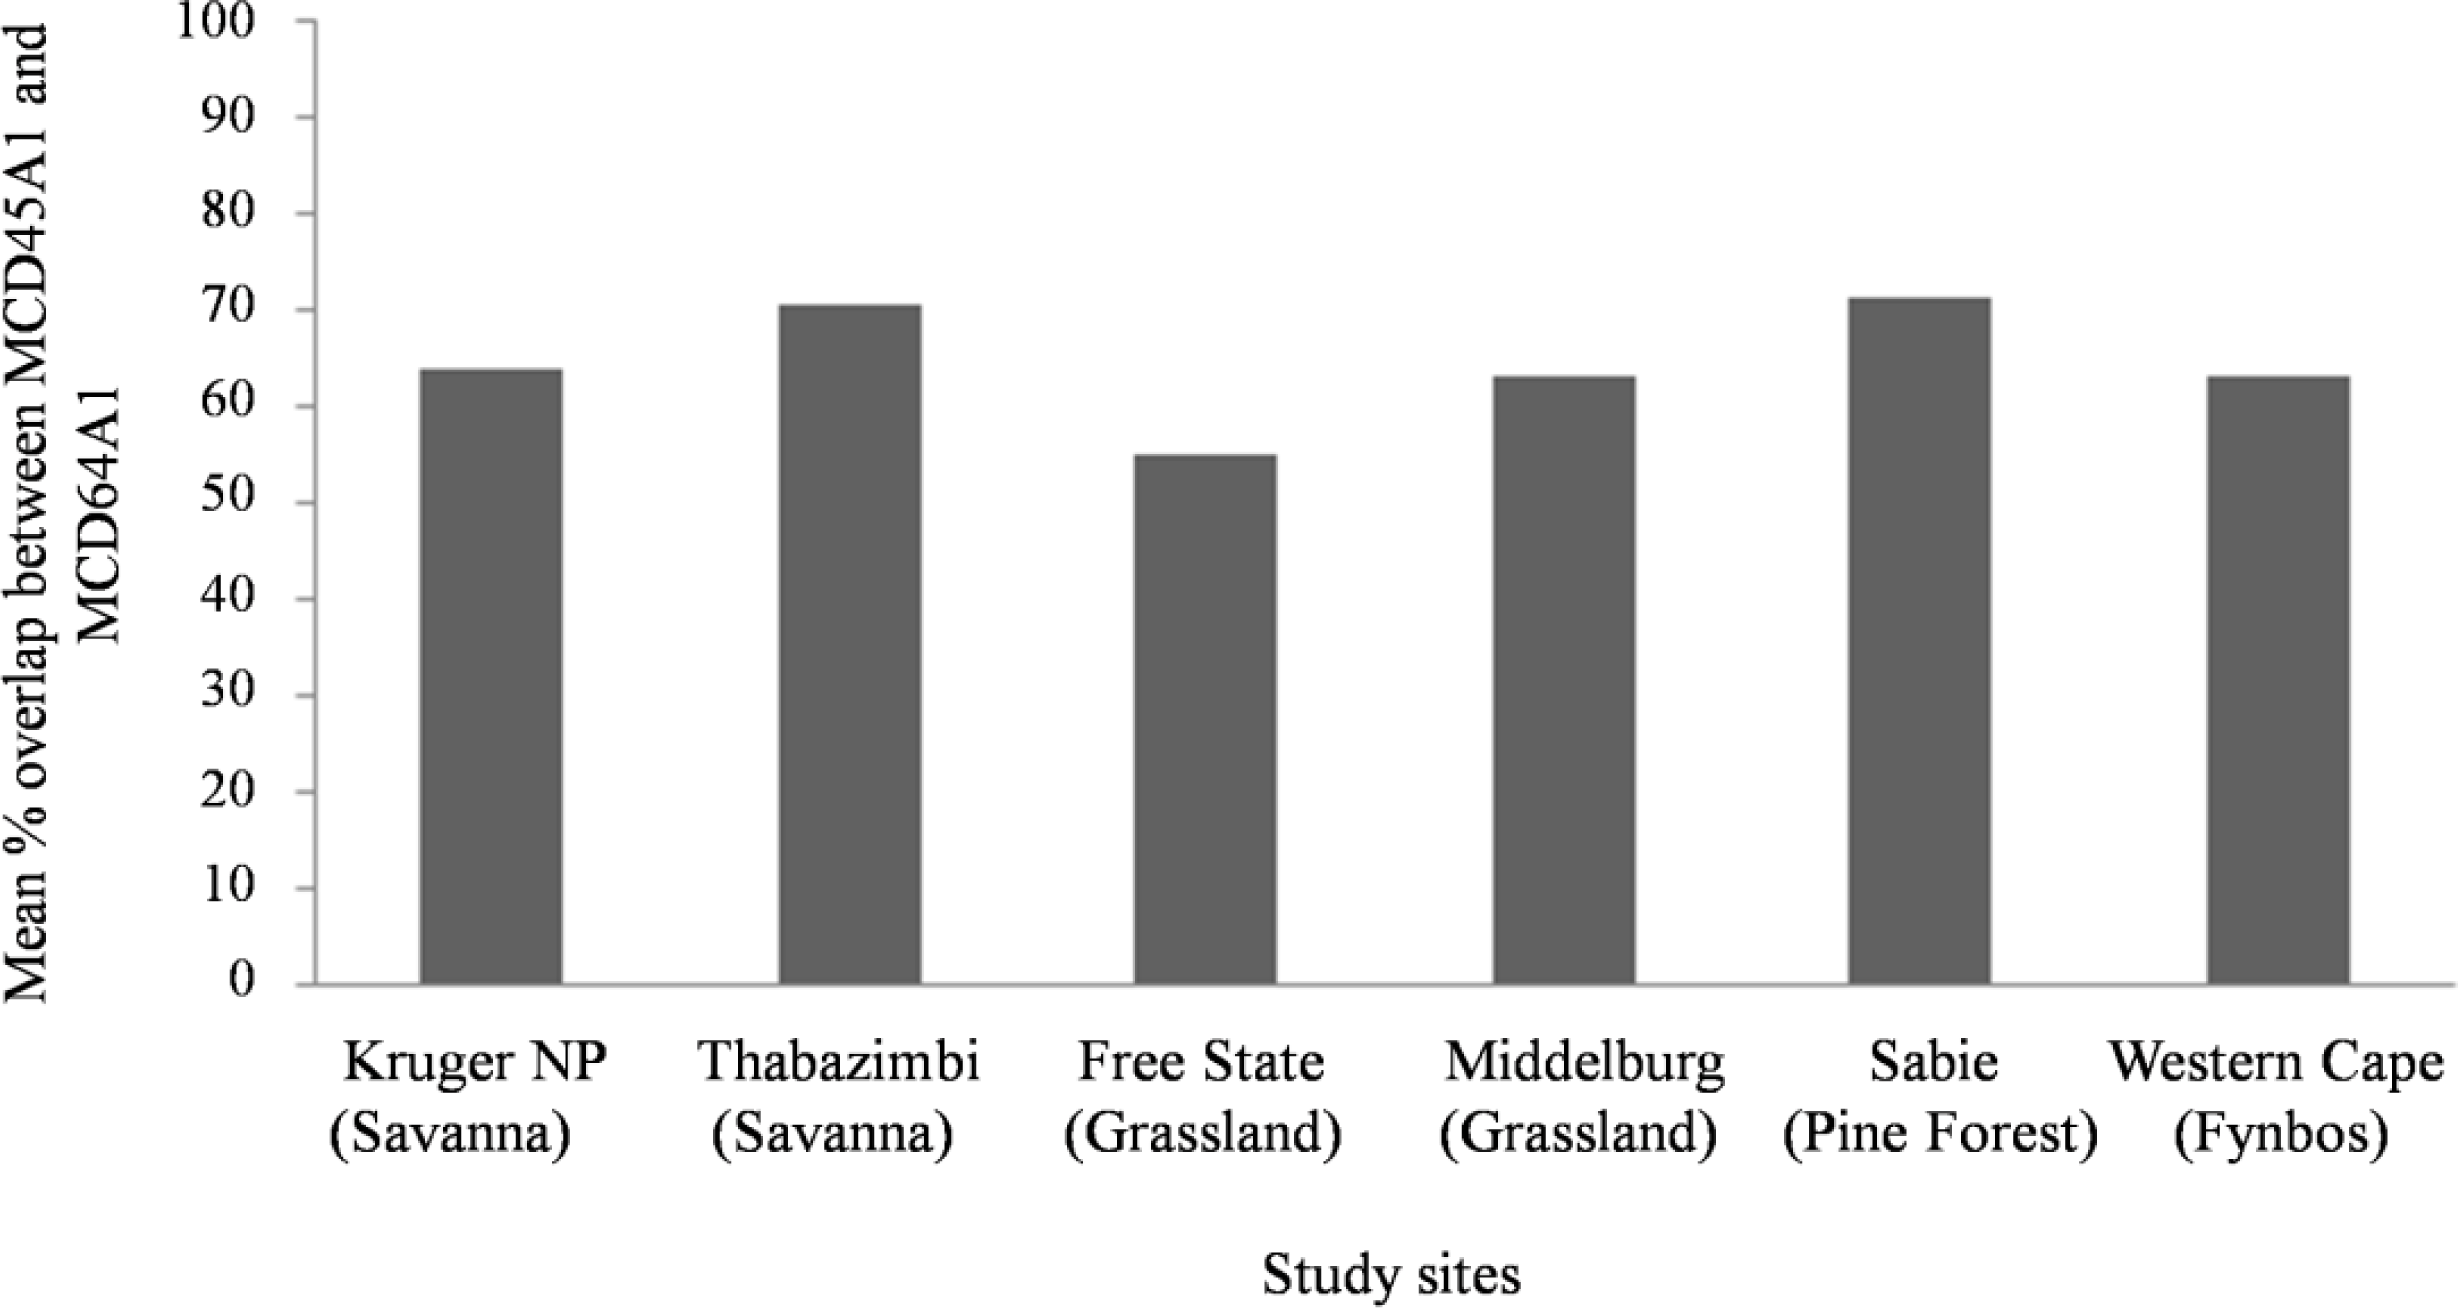
3.3. Analysis of Mean Percent Concurrence of Burned Pixels between MCD45A1 and MCD64A1 Products

The concurrence between the two MODIS burned area products was analyzed per pixel through time (January 2002 to December 2011) in each of the sites. For each pixel, the burned area dates of the two products were compared as follows: If the pixel was detected as burned by both products within n ≤ 8 days of each other, it was treated as a concurrence (i.e., an agreement). The concurrence could be expressed as the binary, AND, of the two products, while the merged product could be expressed as the binary, OR, of the two products (Table 3). The merged product was used to determine the total number of burns per pixel.
Further, the percentage concurrence per pixel was therefore computed as the total count of concurrences in proportion to the total number of times a pixel burned. Hereafter, the mean percent concurrence of burned area pixels between the MCD45A1 and MCD64A1 products was derived in each of the sites.

4. Results

4.1. Assessing the Error of MCD45A1 and MCD64A1 Products

Table 4 presents the accuracy assessment of the MCD45A1 and MCD64A1 products per 30-m pixel through the derived Oe and Ce, respectively. In addition, the percentage of individual burns in different size classes (i.e., <50 ha, 50–100 ha, >100–500 ha and >500 ha, according to the Landsat reference data) intersecting with 500-m MODIS pixels of each burned area product is also presented. This percentage was computed as the count of individual burns per class intersecting (fully or partially) with the MODIS pixels of each product, relative to the total count of individual burns in that particular class.

4.2. Classification Error Assessment of the MCD45A1, MCD64A1 and Merged Products in Relation to the Fractional Sub-Pixel Burned Area

Table 5 presents the Oe and Ce of the MCD45A1, MCD64A1 and merged burned area products for 500-m MODIS pixels that were ≥50% and ≥75% burned according to the Landsat reference data. On average, when considering only the MODIS pixels ≥50% (13 ha) burned across all sites (Table 5), the Ce reduces by 7.82% and 15.24% (in absolute terms) for the MCD64A1 and MCD45A1 products, respectively, in comparison to the results in Table 4, where all fractional burned pixels were considered. However, the Oe was less affected than Ce (Table 5), and with increasing fractional cover (i.e., MODIS pixels ≥75% burned) the Oe reduces, while Ce increases [34]. Overall, the reductions in Oe and Ce suggest improvement in the detection of burned areas corresponding to ≥50% of a MODIS pixel [9,34,35].
The Oe of the merged product (Table 5) based on MODIS pixels ≥50% burned had an improved detection of burned area across all study sites with an average reduction in Oe of 34.17% in contrast with 48.67% (MCD45A1) and 42.49% (MCD64A1). This suggests that the merged product appears to capture more burns, but at the cost of higher Ce (18.91%) than the individual MCD45A1 (Ce = 11.35%) and MCD64A1 (Ce = 14.83%) averaged across all sites. Overall, increasing the fraction burned in the MODIS pixels to ≥50% and ≥75% burned causes a drop in Oe coupled with an increase in Ce.
Figure 5 clearly illustrates how the probability of burned area identification increases with a proportion of the 500-m MODIS pixel burned (i.e., <25%, 25%–50%, 50%–75% and ≥75%). The MCD45A1 product showed higher detection probabilities, compared to MCD64A1, across all burned area proportions in the Western Cape (3.0%–35.4%), Middelburg (3.8%–62.3%) and Free State (14.6%–94.8%). On the other hand, the MCD64A1 product showed higher (i.e., 48.7%–89.2%) probabilities of detection over all burned area proportions relative to the MCD45A1 product (i.e., 10.9%–42.1%) in the forestry plantations of Sabie. Further, the MCD64A1 product presented higher detection probabilities for burned area fractions >50% of a MODIS pixel in the Southern Kruger (49.2%–74.8%) and Thabazimbi (12.0%–61.0%) sites characterized by the savanna biome. Conversely, the MCD45A1 product appeared more reliable than MCD64A1 in detecting burned area fractions <50% of a MODIS pixel with probabilities in the range 24.2%–31.8% and 0.3%–3.9%, corresponding to the aforementioned sites. The merged product had slightly higher probabilities of detection than the highest one of the individual MCD45A1 and MCD64A1 products, in all six validation sites (Figure 5). In particular, the merged product indicated detection probabilities for MODIS sub-pixel burns >50% in the range 15.3%–44.3%, 39.9%–71.5%, 65.7%–95.9%, 72.4%–92.0%, 16.2%–69.9% and 67.2%–82.9% in the Western Cape, Middelburg, Free State, Sabie, Thabazimbi and Southern Kruger NP sites, respectively.

4.3. Analysis of Mean Percent Concurrence of Burned Pixels between MCD45A1 and MCD64A1 Products

Figure 6 illustrates the mean percent concurrence of burned pixels between the MCD45A1 and MCD64A1 products across the individual study sites during the period 2002–2011. Overall, more than 50% of the burned pixels concur between the MCD45A1 and MCD64A1 products in all the sites. In decreasing order, the products revealed the mean percentage concurrences of 71.13% (Sabie), 70.65% (Thabazimbi) 63.99% (Southern Kruger NP) 63.17% (Middelburg) 62.89% (Western Cape) and 54.92% (Free Sate). Further investigation is needed on the non-overlapping burned pixels.

5. Discussion

In the forestry plantations of Sabie (Figure 2), approximately 85% of the burned areas are small (<50 ha), and only a few spatially extensive burned areas (120–1,000 ha; >1,000 ha) were present. The MCD45A1 product did not show reliable detection of the burned areas over the pine forest plantations (Oe of 80.50%; Table 4). The variable post-fire reflectance changes on account of the (partially burned and/or unburned) high tree canopy may have compromised the detection accuracy of the MCD45A1 product in the forest plantations. This finding agrees with results of the comparisons with 1-km active-fire data across low and high forest cover in South America [3]. Their study reported higher burned area detection accuracies by the MCD45A1 product over low forest cover, as opposed to the high forest cover results, where most of the area burned was detected by the active-fire data and not MCD45A1. Furthermore, part of the algorithm used to define the MCD45A1 product assumes that post-fire reflectance of MODIS band 6 (1.640 μm) will drop following a forest fire [3], which may not be the case across all forest regions [3]. Conversely, the MCD64A1 product detected most of the burned forest plantations in the Sabie site with a lower Oe of 38.50% (see Table 4), and that could be due to the exploitation of active-fire data in its approach to calibrate the search for burned areas [9]. The spatial complexity of the burned area shapes in Sabie (Figure 2) resulted in unburned fractions within the MODIS pixels labeled as burned by the MCD64A1 product and, consequently, could have inflated Ce in this product. Additionally, the Oe of MCD64A1 reduces further to 18.02% (Table 5) over MODIS pixels with fractional burns ≥50% and, thus, showed an adequate probability of burned area detection (Figure 5). Despite the difference in the burned area performance of MCD45A1 and MCD64A1 in Sabie, the overlapping MODIS burned pixels of the two products were high over a ten year period in the Sabie site (Figure 6).
In the Western Cape site (Figure 2), the majority of burned area sizes were in the range of 0.36–1,000 ha, as well as a few exceptional burns greater than 1,000 ha, which were characterized by simple homogeneous shapes. This site encompass the fynbos biome that includes a mixture of fine-leaved low shrubs coupled with a sparse grass layer and is marked by winter rainfall and a summer season of burning, generally between December and April [30]. The derived Oe for both products suggests that a significant portion of the burned area in the fynbos biome remained undetected (Table 4). This could be because spectral changes pre- to post-fire are not very large in this vegetation. For example, Figure 7 depicts a quantitative measure of the brightness level for the reference burned pixels over four selected sites, where core burned pixels have high values of the brightness level (close to one). The Western Cape site, above all, suggests a rather variable contrast from burns showing uni-modal distribution of values centered on 0.7 (Figure 7). In particular, the validation results (Table 5) based on MODIS pixels with fractional burns ≥50% show that the MCD45A1 and MCD64A1 product detected a burned area with low Ce of 4.08% and 3.12%, respectively. This outcome indicated a minor difference of about 4% and 12% compared to the derived Ce [21], corresponding to the MCD45A1 and MCD64A1 products during the 2007 fire season. Similarly, our validation results (Table 5) indicated that MCD45A1 detected more (i.e., lower Oe) of the burned fynbos than MCD64A1, which is also depicted in the detection rates across the individual burned areas below 500 ha (Table 4) and the probability of detection for MODIS pixel burned area proportions of 25%, 50% and 75% (Figure 5). Furthermore, similar detection rates (Table 4) are observed for both products over burned area sizes greater than 500 ha (and since only seven out of 668 individual burns in the Western Cape site were greater than 1,000 ha, with 4,105 ha being the largest burn), and this implies that we could expect the Oe for the MCD64A1 product to improve over larger burned area sizes in the fynbos biome [21].
The burned areas in the grassland biome appeared (Figure 2) to be widely spaced with large burns of sizes 120–1,000 ha and >1,000 ha, constituting most of the total burned surface. It is evident that both MODIS products detected all burned areas larger than 500 ha over the grassland biome with variable detection rates of 43%–89% for burned area sizes between 100 and 500 ha (Table 4). The MCD45A1 product detected the area burned with fewer omissions (Tables 4 and 5) over the grassland biome than the MCD64A1 product; though a significant fraction dominated by small burned area sizes below 100 ha (i.e., the detection rates in Table 4) remained undetected by both products. In addition, the MCD45A1 product demonstrated the highest detection probabilities across all MODIS pixel burned area proportions (Figure 5) and, thus, provides adequate burned area mapping for both small and large burns in the respective grassland sites. In the Middelburg and Free State sites, the MCD64A1 product had a lower Ce of 25.14% and 20.85% (Table 4), which decreases further to 3.53% and 14%, respectively, over MODIS pixels ≥50% burned (Table 5) compared to MCD45A1. Given the burned area spatial characteristics (Figure 2) and sufficient brightness level (e.g., more than 50% available core burned pixels (Figure 7)) in the grassland sites, there were 45.08% and 36.83% (Figure 6) non-concurring burned pixels between the products in the Free State and Middelburg sites, respectively. As a result, the two MODIS products perform very differently in the grassland sites, regardless of the presence of numerous large burned areas.
The MODIS burned area products indicated variable detection rates (Table 4) for burned areas below 100 ha in the Southern Kruger NP and Thabazimbi sites. Generally, both products clearly missed all the burned areas between 50 and 100 ha in Thabazimbi compared to Southern Kruger NP (i.e., 66.67% detection rate). This observation, especially in Southern Kruger, demonstrates that depending on the degree of brightness, even small burned areas could reasonably be detected at lower resolution [36] (e.g., 500-m MODIS pixel). Nonetheless, in the savanna biome, the detection rate of the MCD45A1 and MCD64A1 products gradually increases with a burn size between 100 and 500 ha; and further, reaches a 100% detection rate for all burned areas greater than 500 ha, with the exception of only one burned area, which was missed by the MCD64A1 product in Thabazimbi (Table 4). The Southern Kruger NP site had few (i.e., 25) individual burned areas (in the reference data), which revealed complex shapes [18] and, thus, contributed toward the Oe (Table 4) of the products. Furthermore, the high Oe (∼89%) for both products in Thabazimbi is mainly the consequence of about 868 individual burned areas that were not detected. In the aforementioned site, when considering 50% of fractional burned areas (Table 5), the Oe of the MCD45A1 and MCD64A1 products is significantly decreased by 34% and 35%, respectively. In addition, the Ce decreased by 12% for both preceding products. A similar trend is observed in the Southern Kruger NP (Table 5). These findings therefore suggest that MCD64A1 provides superior detection of area burned, especially with increasing fractional cover ≥50% (Figure 5) than the MCD45A1 product in the savanna biome.
A quantitative analysis of the influence of MODIS sub-pixel burned area on the probability of detection by the MCD45A1, MCD64A1 and merged products was also performed. It is evident from Figure 5 that both burned area products display a positive linear trend between the proportion of a burned MODIS pixel and the probability of being detected by MODIS across all validation sites. There are also large differences in the size of fires that are detected between sites (Table 4). These results suggest that a burned area has to be at least 13 ha in size (≥50% of a 500-m MODIS pixel) for the products to detect it with a probability of approximately 31%, 36% and 46% (for MCD45A1, MCD64A1 and merged, respectively) averaged over all six validation sites. These findings corroborate previous conclusions that a burned area proportion of ∼50% can be considered an appropriate threshold for medium resolution burned area detection [9,18,34,37,38]. The adopted minimum mapping unit of four pixels at Landsat 30-m resolution corresponding to 240 m or less during the production of burned area reference maps, reduced the inflation of Oe to some extent (Table 4). The differences in Oe and Ce (Tables 4 and 5) show that the sensitivity of the MODIS products becomes much higher over burned areas corresponding to ≥75% of a MODIS burned pixel.

6. Conclusions

This paper presented validation results for three MODIS satellite burned area products (including the merged product) across the four fire-prone biomes (encompassing savanna, grassland, fynbos and exotic pine forest plantations) in South Africa. The accuracy assessment methods were based on the error matrix and MODIS sub-pixel analysis, to compare the 500-m burned area products with the independently-derived reference data from multi-temporal Landsat TM imagery distributed over six validation sites. In particular, the classification procedures of the MCD45A1 and MCD64A1 products have important differences, which might contribute to differences in their performances across the sites. These differences could be caused by the following: (i) the MCD45A1 product approach does not exploit any active fire information, whereas MCD64A1 makes use of active fire data to enhance the search for probable burned pixels in its approach; and (ii) the MCD45A1 product primarily relies on a bi-directional reflectance change detection approach, whereas the MCD64A1 product approach hinges on a burn-sensitive vegetation index (VI) as a primary indicator to discover the burned areas [3,5,9,39].
Overall, this study has demonstrated that merging the two approaches [3,9] into a single product holds the potential for the improved detection of burned area, particularly for small burns. Efforts are currently underway to include a merged product into the official MODIS products in collection 6 [40], and the method for merging the two presented in this paper could be adopted. Small errors in the MODIS burned area product collection 5 data used here will also be fixed in collection 6. Studies that employed locally-adapted MODIS burned area algorithms instead of the global algorithms tested here achieved a very high accuracy level [4143]. This suggest that there is merit in designing algorithms that may allow local experts to set specific parameters in the algorithm to better account for local vegetation properties and the spatial and spectral properties of local burned area. Efforts are also underway to develop automated burned area algorithms that operate on high-resolution imagery, such as Satellite Pour l’Observation de la Terre (SPOT)-4 and Landsat-7 Enhanced Thematic Mapper plus (ETM+), have been successfully demonstrated on a regional scale [4447]. Developing operational automated burned area products based on Sentinel-2 and Landsat-8 could alleviate issues related to the detection of small and spatially fragmented burns with coarser resolution satellite data.

Acknowledgments

We would like to thank David Roy for providing us with valuable information on the burned area satellite validation protocol.

Author Contributions

Konrad Wessels, Karen Steenkamp and Philip Frost conceived the research topic. Philemon Tsela conducted the data acquisition, analysis, literature review, tables, figures and preparation of manuscript. Joel Botai assisted with data analysis. Konrad Wessels, Joel Botai, Sally Archibald and Derick Swanepoel provided background methodology and performed editing.

Conflicts of Interest

The authors declare no conflict of interest.

References

  1. Tansey, K.; Grégoire, J.; Stroppiana, D.; Sousa, A.; Silva, J.; Pereira, J.M.C.; Boschetti, L.; Maggi, M.; Brivio, P.A.; Fraser, R.; et al. Vegetation burning in the year 2000: Global burned area estimates from SPOT VEGETATION data. J. Geophys. Res 2004, 109, D14S03. [Google Scholar] [CrossRef]
  2. Loboda, T.V.; Csiszar, I.A. Estimating Burned Area from AVHRR and MODIS: Validation Results and Sources of Error. Proceedings of the 2nd Open All-Russia Conference: Current Aspects of Remote Sensing of Earth from Space, Moscow, Russia, 16–18 November 2004; pp. 415–421.
  3. Roy, D.P.; Jin, Y.; Lewis, P.E.; Justice, C.O. Prototyping a global algorithm for systematic fire-affected area mapping using MODIS time series data. Remote Sens. Environ 2005, 97, 137–162. [Google Scholar]
  4. Andreae, M.O. Biomass Burning: Its History, Use and Distribution and Its Impact on the Environmental Quality and Global Climate. In Global Biomass Burning; Levine, J.S., Ed.; MIT Press: Cambridge, MA, USA, 1991; pp. 3–21. [Google Scholar]
  5. Giglio, L.; Randerson, J.T.; van der Werf, G.R.; Kasibhatla, P.S.; Collatz, G.J.; Morton, D.C.; DeFries, R.S. Assessing variability and long-term trends in burned area by merging multiple satellite fire products. Biogeosciences 2010, 7, 1171–1186. [Google Scholar]
  6. Andreae, M.O.; Merlet, P. Emission of trace gases and aerosols from biomass burning. Glob. Biogeochem. Cy 2001, 15, 955–966. [Google Scholar]
  7. Van der Werf, G.R.; Randerson, J.T.; Giglio, L.; Collatz, G.J.; Mu, M.; Kasibhatla, P.S.; Morton, D.C.; DeFries, R.S.; Jin, Y.; van Leeuwen, T.T. Global fire emissions and the contribution of deforestation, savanna, forest, agricultural, and peat fires (1997–2009). Atmos. Chem. Phys. Discuss 2010, 10, 16153–16230. [Google Scholar]
  8. Giglio, L.; Justice, C.O. Effect of wavelength selection on characterization of fire size and temperature. Int. J. Remote Sens 2003, 24, 3515–3520. [Google Scholar]
  9. Giglio, L.; Loboda, T.; Roy, D.P.; Quayle, B.; Justice, C.O. An active-fire based burned area mapping algorithm for the MODIS sensor. Remote Sens. Environ 2009, 113, 408–420. [Google Scholar]
  10. Eva, H.; Lambin, E.F. Fires and land-cover change in the tropics: A remote sensing analysis at the landscape scale. J. Biogeogr 2000, 27, 765–776. [Google Scholar]
  11. Plummer, S.; Arino, O.; Simon, M.; Steffen, W. Establishing an earth observation product service for the terrestrial carbon community: The globcarbon initiative. Mitig. Adapt. Strateg. Glob. Chang 2006, 11, 97–111. [Google Scholar]
  12. Tansey, K.; Grégoire, J.-M.; Defourny, P.; Leigh, R.; Pekel, J.-F.; van Bogaert, E.; Bartholomé, E. A new, global, multi-annual (2000–2007) burnt area product at 1 km resolution. Geophys. Res. Lett 2008, 35. [Google Scholar] [CrossRef]
  13. Roy, D.P.; Boschetti, L.; Justice, C.O.; Ju, J. The collection 5 MODIS burned area product—Global evaluation by comparison with the MODIS active fire product. Remote Sens. Environ 2008, 112, 3690–3707. [Google Scholar]
  14. Oliva, P.; Martín, P.; Chuvieco, E. Burned area mapping with MERIS post-fire image. Int. J. Remote Sens 2011, 32, 4175–4201. [Google Scholar]
  15. Chuvieco, E.; Martín, M.P.; Palacios, A. Assessment of different spectral indices in the red-near-infrared spectral domain for burned land discrimination. Int. J. Remote Sens 2002, 23, 5103–5110. [Google Scholar]
  16. Silva, J.M.N.; Sá, A.C.L.; Pereira, J.M.C. Comparison of burned area estimates derived from SPOT-VEGETATION and Landsat ETM+ data in Africa: Influence of spatial pattern and vegetation type. Remote Sens. Environ 2005, 96, 188–201. [Google Scholar]
  17. Boschetti, L.; Brivio, P.A.; Eva, H.D.; Gallego, J.; Baraldi, A.; Grégoire, J.-M. A sampling method for the retrospective validation of global burned area products. IEEE Trans. Geosci. Remote Sens 2006, 44, 1765–1772. [Google Scholar]
  18. Sá, A.C.L.; Pereira, J.M.C.; Gardner, R.H. Analysis of the relationship between spatial pattern and spectral detectability of areas burned in Southern Africa using satellite data. Int. J. Remote Sens 2007, 28, 3583–3601. [Google Scholar]
  19. Roy, D.P.; Boschetti, L. Southern Africa validation of the MODIS, L3JRC, and GlobCarbon burned-area products. IEEE Trans. Geosci. Remote Sens 2009, 47, 1032–1044. [Google Scholar]
  20. Tsela, P.L.; van Helden, P.; Frost, P.; Wessels, K.; Archibald, S. Validation of the MODIS Burned-Area Products Across Different Biomes in South Africa. Proceedings of the IEEE International Geoscience and Remote Sensing Symposium (IGARSS), Honolulu, HI, USA, 25–30 July 2010; pp. 3652–3655.
  21. De Klerk, H.M.; Wilson, A.M.; Steenkamp, K. Evaluation of satellite-derived burned area products for the fynbos, a Mediterranean shrubland. Int. J. Wildland Fire 2012, 21, 36–47. [Google Scholar]
  22. Roy, D.P.; Trigg, S.N.; Bhima, R.; Brockett, B.H.; Dube, O.P.; Frost, P.; Govender, N.; Landmann, T.; Le Roux, J.; Lepono, T.; et al. The utility of satellite fire product accuracy information-perspectives and recommendations from the Southern Africa fire network. IEEE Trans. Geosci. Remote Sens 2006, 44, 1928–1930. [Google Scholar]
  23. University of Maryland. MODIS Collection 5 Active Fire Product User’s Guide; 2010. Available online: http://modisfire.umd.edu/documents/MODIS_Fire_Users_Guide_2.4.pdf (accessed on 10 March 2012).
  24. Mucina, L.; Rutherford, M.C. The Vegetation of South Africa, Lesotho and Swaziland; South African National Biodiversity Institute: Pretoria, South Africa, 2006. [Google Scholar]
  25. Thompson, M. A standard land-cover classification scheme for remote-sensing applications in South Africa. S. Afr. J. Sci 1996, 92, 34–42. [Google Scholar]
  26. Fairbanks, D.H.K.; Thompson, M.W.; Vink, D.E.; Newby, T.S.; van den Berg, H.M.; Everard, D.A. The South African land-cover characteristics database: A synopsis of the landscape. S. Afr. J. Sci 2000, 96, 69–80. [Google Scholar]
  27. Huffman, G.J.; Adler, R.F.; Rudolf, B.; Schneider, U.; Keehn, P.R. Global precipitation estimates based on a technique for combining satellite-based estimates, rain gauge analysis, and NWP model precipitation information. J. Clim 1995, 8, 1284–1295. [Google Scholar]
  28. Huffman, G.J.; Adler, R.F.; Bolvin, D.T.; Gu, G.; Nelkin, E.J.; Bowman, K.P.; Gu, G.; Hong, Y.; Bowman, K.P.; Stocker, E.F. The TRMM Multisatellite Precipitation Analysis (TMPA): Quasi-global, multiyear, combined-sensor precipitation estimates at fine scales. J. Hydrometeorol 2007, 8, 38–55. [Google Scholar]
  29. Wessels, K.; Steenkamp, K.; von Maltitz, G.; Archibald, S. Remotely sensed vegetation phenology for describing and predicting the biomes of South Africa. Appl. Veg. Sci 2011, 14, 49–66. [Google Scholar]
  30. Kraaij, T. Changing the fire management regime in the renosterveld and lowland fynbos of the Bontebok National Park. S. Afr. J. Bot 2010, 76, 550–557. [Google Scholar]
  31. Roy, D.P.; Frost, P.G.H.; Justice, C.O.; Landmann, T.; Le Roux, J.L.; Gumbo, K.; Makungwa, S.; Dunham, K.; Du Toit, R.; Mhwandagara, K.; et al. The Southern Africa Fire Network (SAFNet) regional burned-area product-validation protocol. Int. J. Remote Sens 2005, 26, 4265–4292. [Google Scholar]
  32. Vermote, E.F.; El Saleous, N.Z.; Justice, C.O. Operational atmospheric correction of the MODIS data in the visible to middle infrared: First results. Remote Sens. Environ 2002, 83, 97–111. [Google Scholar]
  33. Congalton, R.G. A review of assessing the accuracy of classifications of remotely sensed data. Remote Sens. Environ 1991, 37, 35–46. [Google Scholar]
  34. Boschetti, L.; Flasse, S.P.; Brivio, P.A. Analysis of the conflict between omission and commission in low spatial resolution dichotomic thematic products: The Pareto Boundary. Remote Sens. Environ 2004, 91, 280–292. [Google Scholar]
  35. Foody, G. Harshness in image classification accuracy assessment. Int. J. Remote Sens 2008, 29, 3137–3158. [Google Scholar]
  36. Eva, H.; Lambin, E.F. Burnt area mapping in Central Africa using ATSR data. Int. J. Remote Sens 1998, 19, 3473–3497. [Google Scholar]
  37. Eva, H.; Lambin, E.F. Remote sensing of biomass burning in tropical regions: Sampling issues and multisensor approach. Remote Sens. Environ 1998, 64, 292–315. [Google Scholar]
  38. Miettinen, J. Burnt Area Mapping in Insular Southeast Asia Using Medium Resolution Satellite Imagery. University of Helsinki, Helsinki, Finland, 2007. [Google Scholar]
  39. Roy, D.P.; Lewis, P.E.; Justice, C.O. Burned area mapping using multi-temporal moderate spatial resolution data—A bi-directional reflectance model-based expectation approach. Remote Sens. Environ 2002, 83, 263–286. [Google Scholar]
  40. Roy, D.P. Geographic Information Science Center of Excellence; South Dakota State University: Brookings, SD, USA, Oral Communication,; 18 July 2012. [Google Scholar]
  41. Dempewolf, J.; Trigg, S.; DeFries, R.S.; Eby, S. Burned-area mapping of the Serengeti-Mara region using MODIS reflectance data. IEEE Geosci. Remote Sens. Lett 2007, 4, 312–316. [Google Scholar]
  42. Bastarrika, A.; Chuvieco, E.; Martin, M.P. Automatic burned land mapping from MODIS time series images: Assessment in Mediterranean ecosystems. IEEE Trans. Geosci. Remote Sens 2011, 49, 3401–3413. [Google Scholar]
  43. Levin, N.; Heimowitz, A. Mapping spatial and temporal patterns of Mediterranean wildfires from MODIS. Remote Sens. Environ 2012, 126, 12–26. [Google Scholar]
  44. Bastarrika, A.; Chuvieco, E.; Martín, M.P. Mapping burned areas from Landsat TM/ETM+ data with a two-phase algorithm: Balancing omission and commission errors. Remote Sens. Environ 2011, 115, 1003–1012. [Google Scholar]
  45. Polychronaki, A.; Gitas, I.Z. Burned area mapping in Greece using SPOT-4 HRVIR images and object-based image analysis. Remote Sens 2012, 4, 424–438. [Google Scholar]
  46. Stroppiana, D.; Bordogna, G.; Carrara, P.; Boschetti, M.; Boschetti, L.; Brivio, P.A. A method for extracting burned areas from Landsat TM/ETM+ images by soft aggregation of multiple Spectral Indices and a region growing algorithm. ISPRS J. Photogramm. Remote Sens 2012, 69, 88–102. [Google Scholar]
  47. Koutsias, N.; Pleniou, M.; Mallinis, G.; Nioti, F.; Sifakis, N.I. A rule-based semi-automatic method to map burned areas: Exploring the USGS historical archives to reconstruct recent fire history. Int. J. Remote Sens 2013, 34, 7049–7068. [Google Scholar]
Figure 1. The biome map showing the location of the validation sites and multi-temporal Landsat 5 Thematic Mapper (TM) acquisitions distributed across the four fire-prone biomes in South Africa.
Remotesensing 06 01275f1
Figure 2. Spatial analysis of the burned areas interpreted and produced from multi-temporal Landsat TM data over the six validation sites. The burned area patterns show a diversity of burned shapes, from narrow and/or fragmented (0.36, 12.5, 50 ha) to large and compact (>1,000 ha).
Remotesensing 06 01275f2
Figure 3. Comparison of Landsat (interpreted) burned-area reference data and the MCD45A1 product to derive the Ce and Oe by use of a confusion matrix.
Remotesensing 06 01275f3
Figure 4. The 500-m MODIS reference grids used to compute the fractional sub-pixel burned areas corresponding to the Landsat TM interpreted burns.
Remotesensing 06 01275f4
Figure 5. Histograms of MODIS sub-pixel burned area analysis used to depict the relationship between burned area proportions according to Landsat TM and the probability of detection by the three MODIS products over the six validation sites.
Remotesensing 06 01275f5
Figure 6. Mean percent concurrence of burned pixels between the MCD45A1 and MCD64A1 products based on a ten-year time series, January 2002 to December 2011, across the six study sites.
Remotesensing 06 01275f6
Figure 7. Histograms of the brightness levels for Landsat reference pixels interpreted as burned from the TM temporal-difference between vegetation index (VI)date2 and VIdate1 across the selected sites.
Remotesensing 06 01275f7
Table 1. Landsat 5 TM scene pairs used to produce high-resolution burned-area reference datasets and the corresponding biome characteristics per site.
#BiomeSite, Landsat Path/RowTM Dates 2007Mean Annual Rainfall (mm)Selected Biome Characteristics [29]
1.SavannaSouthern Kruger National Park (NP)
168/077
11 August
27 August
610–859Mostly arid woodland characterized by Combretum spp./Terminalia sericea; open tree savanna (Sclerocarya birrea) and thickets associated with high intensity fires
2.GrasslandMiddelburg
169/078
18 August
3 September
609–812Predominated by a single layer of grasses (i.e., sour grasses); associated with frequent and extreme fires; sparse trees/woody plants
3.FynbosWestern Cape
175/083
17 February
6 April
260–504Generally comprised of fine-leaved low shrubs; mostly mountainous and highly flammable
4.Pine forestSabie
169/077
15 June
18 August
569–810Characterized by forest mountain ranges and expansive valleys; located in the areas of extreme vegetation fire risk and wind driven flames
5.SavannaThabazimbi
171/077
15 July
16 August
458–624Generally occupied by moist woodland savanna; distributed tall grasses and trees; extremely high-intensity fires
6.GrasslandFree State
169/080
18 August
3 September
814–975Covered by a dense layer of grassland (i.e., sweet grassland); high rainfall; rapid fuel biomass accumulation; high-intensity fires
Table 2. Analysis of the temporal proximity of the burned pixel dates of the MCD45A1 and MCD64A1 products within monthly eight-day intervals for the period April 2000–April 2012, over southern Africa encompassing four Moderate Resolution Imaging Spectroradiometer (MODIS) tiles.
MODIS Tilesh20v11h20v12h19v11h19v12

Temporal Separation of Burn Dates in Days (n)No. of Pixels%No. of Pixels%No. of Pixels%No. of Pixels%
0601,03827.0166,65324.7867,10129.975,41218.36
1835,73237.5688,70732.9894,87442.389,65132.74
2390,39017.5548,00517.8539,02717.435,86519.9
3187,1058.4126,6549.9113,9576.233,63412.33
490,8554.0815,0555.65,2452.342,2347.58
550,1902.269,5793.561,9990.891,2734.32
627,6741.245,4962.048630.397112.41
716,8820.763,1911.194950.224461.51
810,0900.451,9430.723000.132500.85
Table 3. An example of the agreement and the result of a merge between the MCD45A1 and MCD64A1 products for a particular pixel.
MCD45A1MCD64A1Concurrence (Binary AND)Merge (Binary OR)
1001
1111
0101
0000

Total13
Table 4. Accuracy assessment of the official MODIS burned area product (MCD45A1) and the MODIS direct broadcast (DB) burned area product (MCD64A1) against the Landsat TM burned area reference data at 30-m resolution for individual validation sites. The percentage of individual burns in different size classes detected by the MODIS burned area product.
Site, Landsat Path/RowLandsat DatesProductPercentage of Landsat Burns of Different Sizes Detected by MODIS Burned Area ProductsOe (%)Ce (%)
<50 ha50–100 ha>100–500 ha>500 ha
Southern Kruger NP (savanna)
168/077
8/11/2007
8/27/2007
MCD45A117.6566.6775.00100.0056.4734.42
MCD64A15.8866.6775.00100.0060.7020.41
Thabazimbi (savanna)
171/077
7/15/2007
8/16/2007
MCD45A10.000.0031.25100.0089.5812.68
MCD64A10.120.0031.2587.5089.4511.53
Free State (grassland)
169/080
8/18/2007
9/3/2007
MCD45A13.3637.0489.29100.0043.8127.02
MCD64A11.683.7057.14100.0048.3020.85
Middelburg (grassland)
169/078
8/18/2007
9/3/2007
MCD45A11.3916.6767.57100.0081.3035.97
MCD64A10.280.0043.24100.0083.8225.14
Western Cape (fynbos)
175/083
2/17/2007
4/6/2007
MCD45A11.929.5731.8669.5787.5223.36
MCD64A10.726.9629.2069.5790.4817.64
Sabie (pine forest)
169/077
6/15/2007
8/18/2007
MCD45A116.3430.0046.67100.0080.5026.09
MCD64A166.5460.00100.00100.0038.5040.35
Table 5. Accuracy assessment of the official MODIS burned area product (MCD45A1), MODIS direct broadcast (DB) burned area product (MCD64A1) and merged MODIS burned area product based on the 500-m MODIS pixels that are ≥50% and ≥75% burned according to Landsat.
Site, Landsat Path/RowLandsat DatesProductMODIS Pixels ≥50% BurnedMODIS Pixels ≥75% Burned

Oe (%)Ce (%)Oe (%)Ce (%)
Southern Kruger NP (savanna)
168/077
8/11/2007
8/27/2007
MCD45A136.2226.2726.8330.47
MCD64A134.0516.5925.2023.66
Merged22.7024.8817.0734.05
Thabazimbi (savanna)
171/077
7/15/2007
8/16/2007
MCD45A155.620.8841.031.65
MCD64A154.110.6239.201.47
Merged46.471.3330.402.52
Free State (grassland)
169/080
8/18/2007
9/3/2007
MCD45A111.0819.895.2327.56
MCD64A114.3314.006.9921.03
Merged9.8921.384.0529.01
Middelburg (grassland)
169/078
8/18/2007
9/3/2007
MCD45A150.745.5437.678.93
MCD64A154.473.5338.446.01
Merged43.117.1028.4811.02
Western Cape (fynbos)
175/083
2/17/2007
4/6/2007
MCD45A173.774.0864.605.41
MCD64A179.983.1272.283.92
Merged66.726.2155.737.91
Sabie (pine forest)
169/077
6/15/2007
8/18/2007
MCD45A164.5811.4658.6014.10
MCD64A118.0251.1411.0454.72
Merged16.1552.538.4956.03

