1. Introduction
Synthetic aperture radar (SAR) is a coherent imaging method by active microwave with a long aperture [
1]. In other words, SAR is a modification of a basic imaging radar system that creates an artificially long antenna synthetically from a small moving antenna to improve spatial resolution in the azimuth (along-track) direction. Interferometric SAR (InSAR) measures the phase differences between two SAR images, which are primarily related to the surface topographic components and deformation. Differential interferometric synthetic aperture radar (DInSAR) is a technique based on InSAR. It removes the topographic phase with an external digital elevation model (DEM) or another interferogram, which leaves the phase component related to the land motion between the two images. DInSAR is an appropriate method for fast and large deformations [
2]. In addition, in order to detect slow deformation over a long time span, some other InSAR techniques have been developed. The first type of method, which we will refer to here as Persistent Scatterers Interferometry (PSI), performs an analysis of ‘persistent scatterer’ pixels on a succession of time-ordered images. Another approach, the SBAS (Small BAseline Subset) method, forms many interferograms with short baselines and derives movements with time [
3,
4].
The advantage of the use of InSAR techniques, such as DInSAR or PSI/SBAS methods, is that the deformation of many thousands of points over a scene can be determined very quickly and at very low cost when compared to the effort needed to perform a ground survey of points at the same density. Fruitful results with regard to wide applications have been reported by InSAR researchers in the past 15 years [
5–
7]. However, in this study, both DInSAR and PSI/SBAS methods revealed their limitations when applied to a mountainous mining area with fast earth surface movements [
6–
8]. Based on the requirements from mining engineering and the different features of various InSAR techniques, a combined technique SBAS-DInSAR is applied to this mountainous area that is severely affected by mining activities.
2. Application to Coal Mining
The extraction of underground coal deposits through mining always results in damages to geological structures. Mountainous areas are susceptible to not only surface subsidence, but, also, landslides and mud-rock flow. From a safety point-of-view, it is therefore necessary to monitor surface movements during and after the coal mining activities, in order to detect and warn of potential and actual geological hazards.
Normally, subsidence at coal mines occur at large scales, on the order of tens of square kilometers [
8]. Therefore, InSAR techniques are appropriate for the monitoring of the surface effects of coal mining. Some excellent results from the application of InSAR for operating coal mines have been shown [
9]. In [
9], 20 Japanese Earth Resources Satellite (JERS) SAR scenes and 37 Environmental Satellite Advanced Synthetic Aperture Radar (ENVISAT ASAR) scenes covered Fengfeng area were analyzed, which is 560 square kilometers in size and has 14 coal mines. DInSAR results were shown to be comparable to leveling and historical coal mining data. On the other hand, one test of monitoring abandoned mines using PSI was carried out in Nottingham [
10]. In that research, the Nottinghamshire Corner Reflector Array (NCRA) was established. Data processing showed the rates for both PSI and Global Positioning System (GPS) derived results are comparable in all cases. In addition, the results showed that a corner reflector network may provide some possibilities for calibration and improvements to a PSI approach to subsidence monitoring.
4. SAR Data and Software Packages
The Japan Aerospace Exploration Agency (JAXA) launched the Advanced Land Observing Satellite (ALOS) satellite in 2006 which contained a Phased-Array L-band SAR (PALSAR). The characteristics of Fine Beam Single Polarisation (FBS) mode of PALSAR are summarized in
Table 1, as FBS is the most common for interferometric applications. Four Level 1.1 Single Look Complex (SLC) ALOS images, provided in CEOS data format were collected from 2008 to 2010. Data specifications are shown in
Table 1.
The baseline characteristics of the four images are shown in
Table 2, the spatial baseline being the distance between the satellite and master positions and the temporal baseline being the time separation between the two.
Unlike other sensors, ALOS L1.1 products are not zero-Doppler. The consequence is that the geometric model used during the processing is slightly different and varies from product-to-product. Although the variation can be negligible [
12], in general this is not the case and, thus, a slightly modified processing chain has to be applied. An improved algorithm in software, PUNNET, was developed to cope with this [
12].
In addition, eight ENVISAT ASAR scenes were collected, as listed in
Tables 3 and
4. The baselines are controlled so that only pairs with short baselines will be processed.
Germany launched the high resolution SAR satellite TerraSAR-X on 15 June 2007, and TanDEM-X on 21 June 2010. As for this study, 21 high-resolution TerraSAR-X scenes in strip map mode with the time span of 4 April 2012, to 21 November 2012, were programmed. Steep incidence angles were used so as to avoid strong shadow effects in this mountainous area (
Table 5).
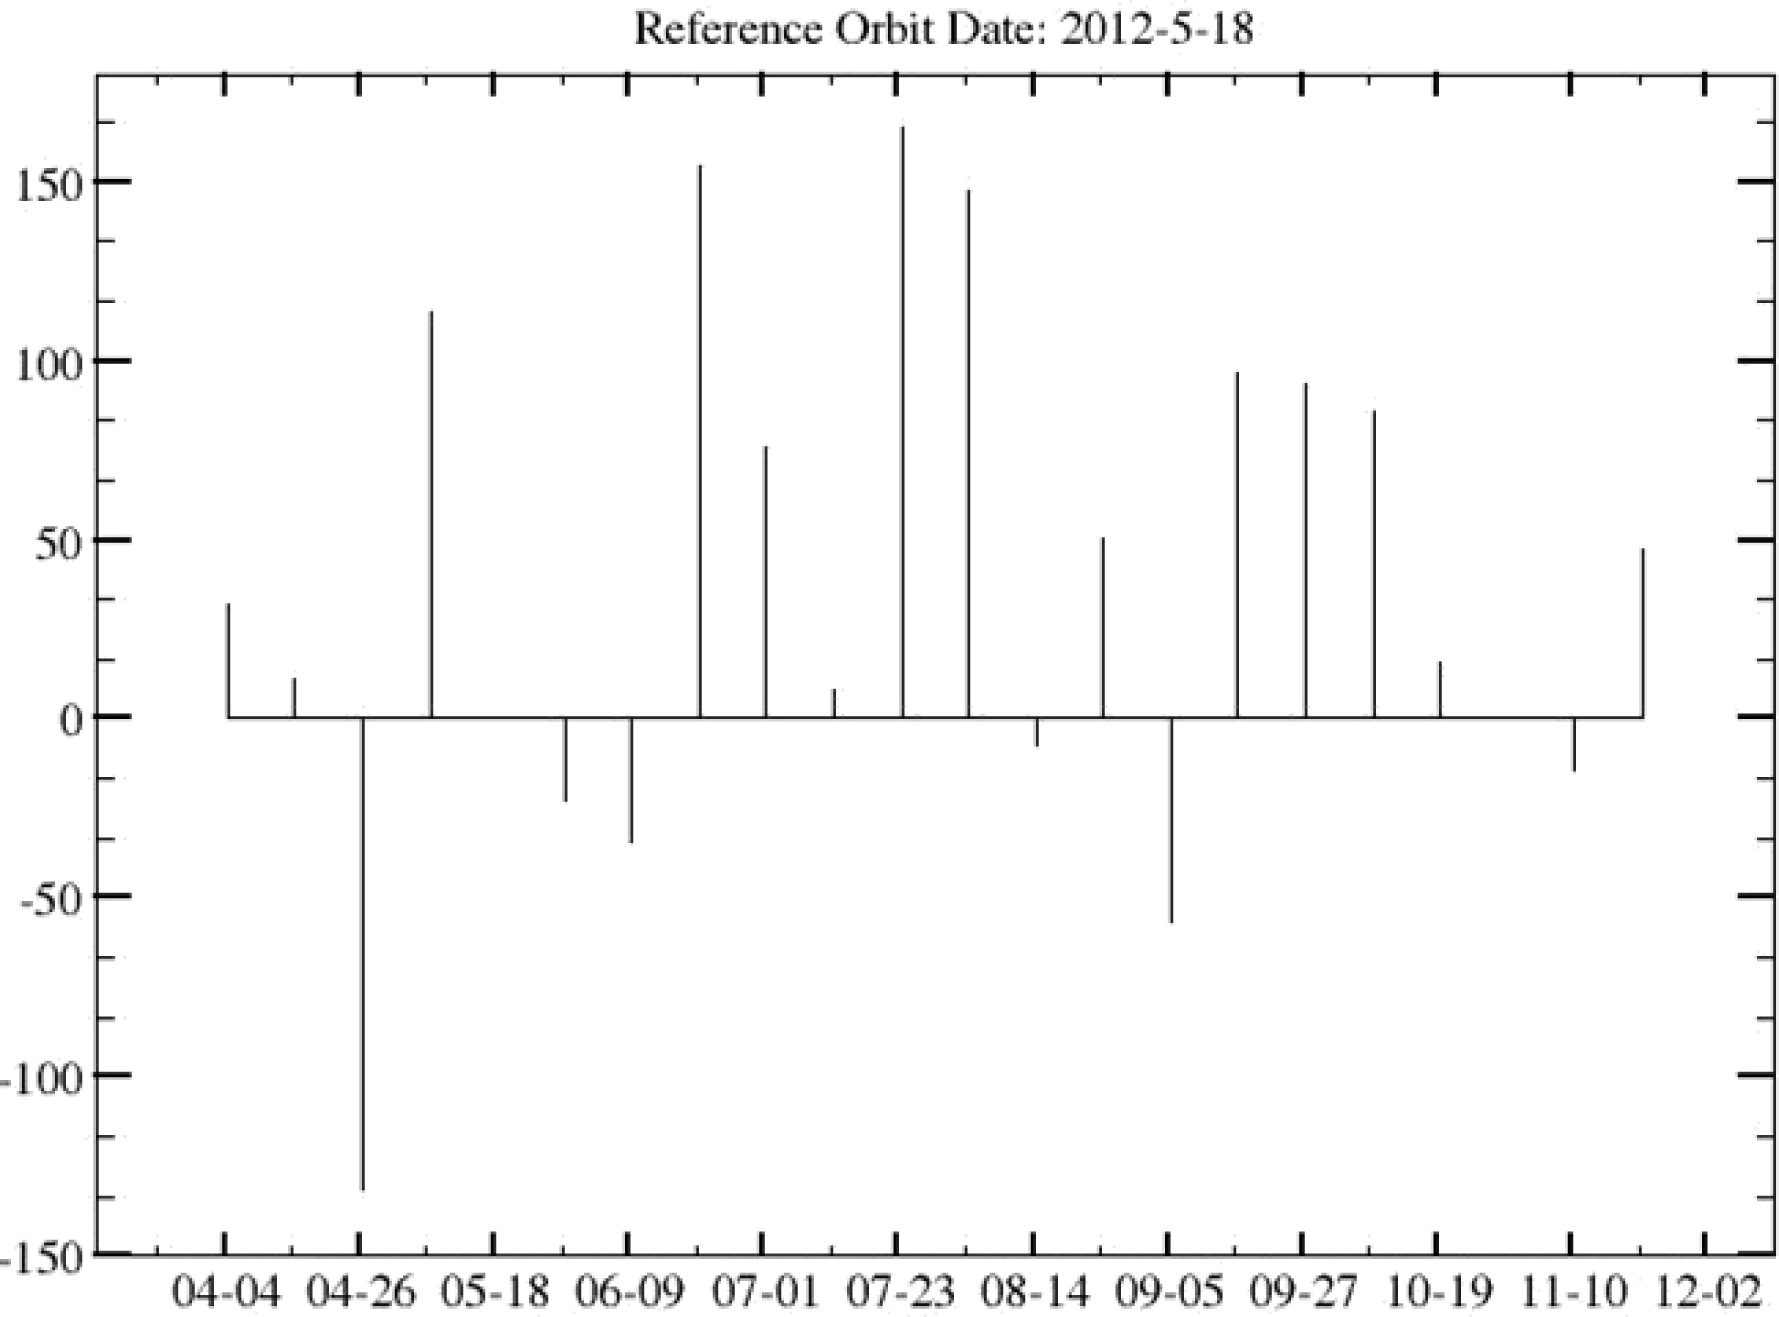
Figure 3 indicates the baseline information of 21 TerraSAR-X images used in this study. We select the image acquired on 18 May 2012, as the master image, and calculate baselines of other 20 scenes related to the master image. According to the estimation, most perpendicular baselines were controlled between −100 m to 150 m, which are obviously advantageous for deformation monitoring.
Apart from the modified method SBAS-DInSAR, we also applied conventional DInSAR and PSI/SBAS techniques by using various software packages for the data processing in this paper:
5. Analysis of Interferometric Results
5.1. Analysis of ENVISAT and ALOS Archive Data
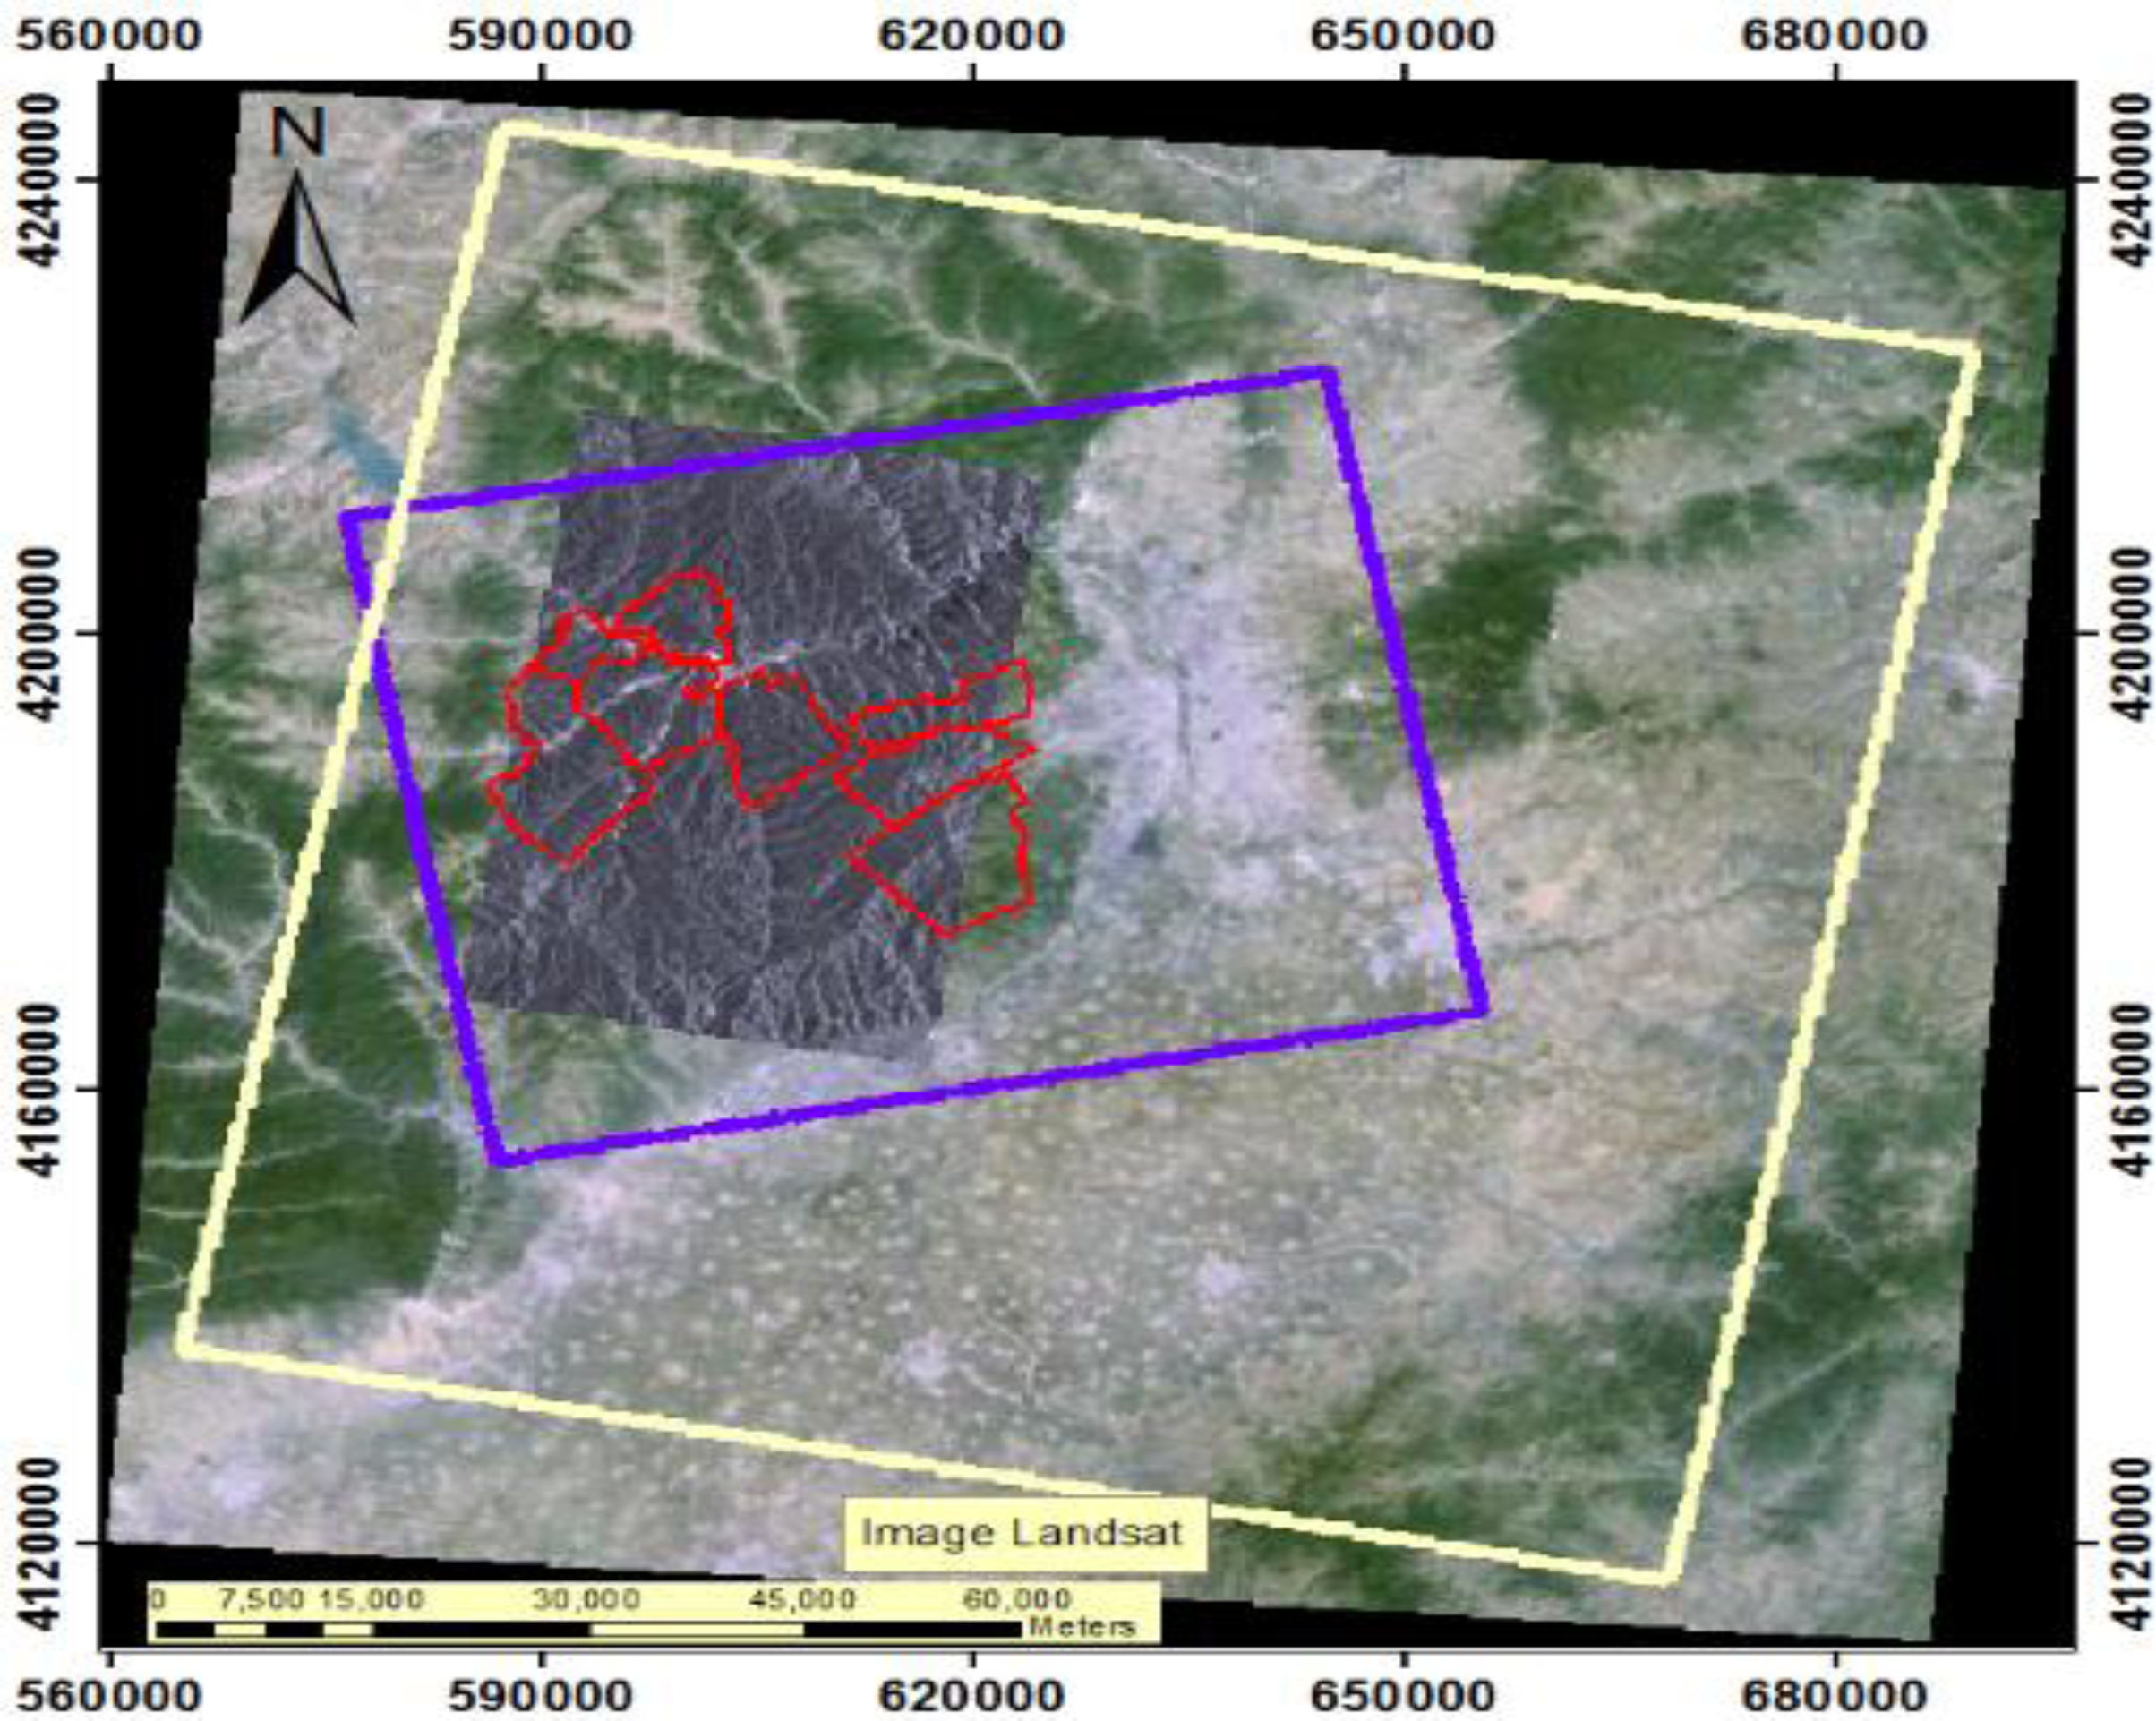
In the following
Figure 4, DInSAR analysis is applied to archive data, which includes ENVISAT and ALOS scenes. We processed all possible pairs and then abandoned inteferograms with low quality due to temporal and/or spatial decorrelations, or with large baseline errors. The analysis of individual interferograms illustrated the influence of topography on the interferometric phase. Large scale relief maps were collected and used to generate high resolution digital elevation model (DEM), which was then used during DInSAR processing to compensate topography phase, and aid the interpretation and unwrapping of the differential interferograms [
16]. An adaptive filtering technique was applied to differential interferograms to clarify the fringes and to reduce noise [
17]. However, filters must always be used with care and we should keep in mind that filtering can remove more subtle effects. For phase unwrapping, the Statistical-cost, Network-flow Algorithm for PHase Unwrapping (SNAPHU) approach was applied [
18].
Considering similar time spans, subsidence information derived from ALOS data using pair 25 December 2009–9 February 2010 and from ENVISAT data using pair 4 October 2009–21 February 2010, could be compared. In this study, the ALOS data are ascending, while ENVISAT are descending. Therefore, in spite of detecting the same displacement, view angles are different from two images. However, L band detected decimeter-level but ENVISAT showed only centimeter-level movements. The reason might be the large phase gradients induced by strong mining activities at this area, when the maximum detectable displacement in radian is π between two pixels. One solution to such problem may be increasing the wavelength and/or reducing the revisit time. The other solution could be using higher resolution SAR data where smaller pixels are available.
5.2. Analysis of TerraSAR-X Data
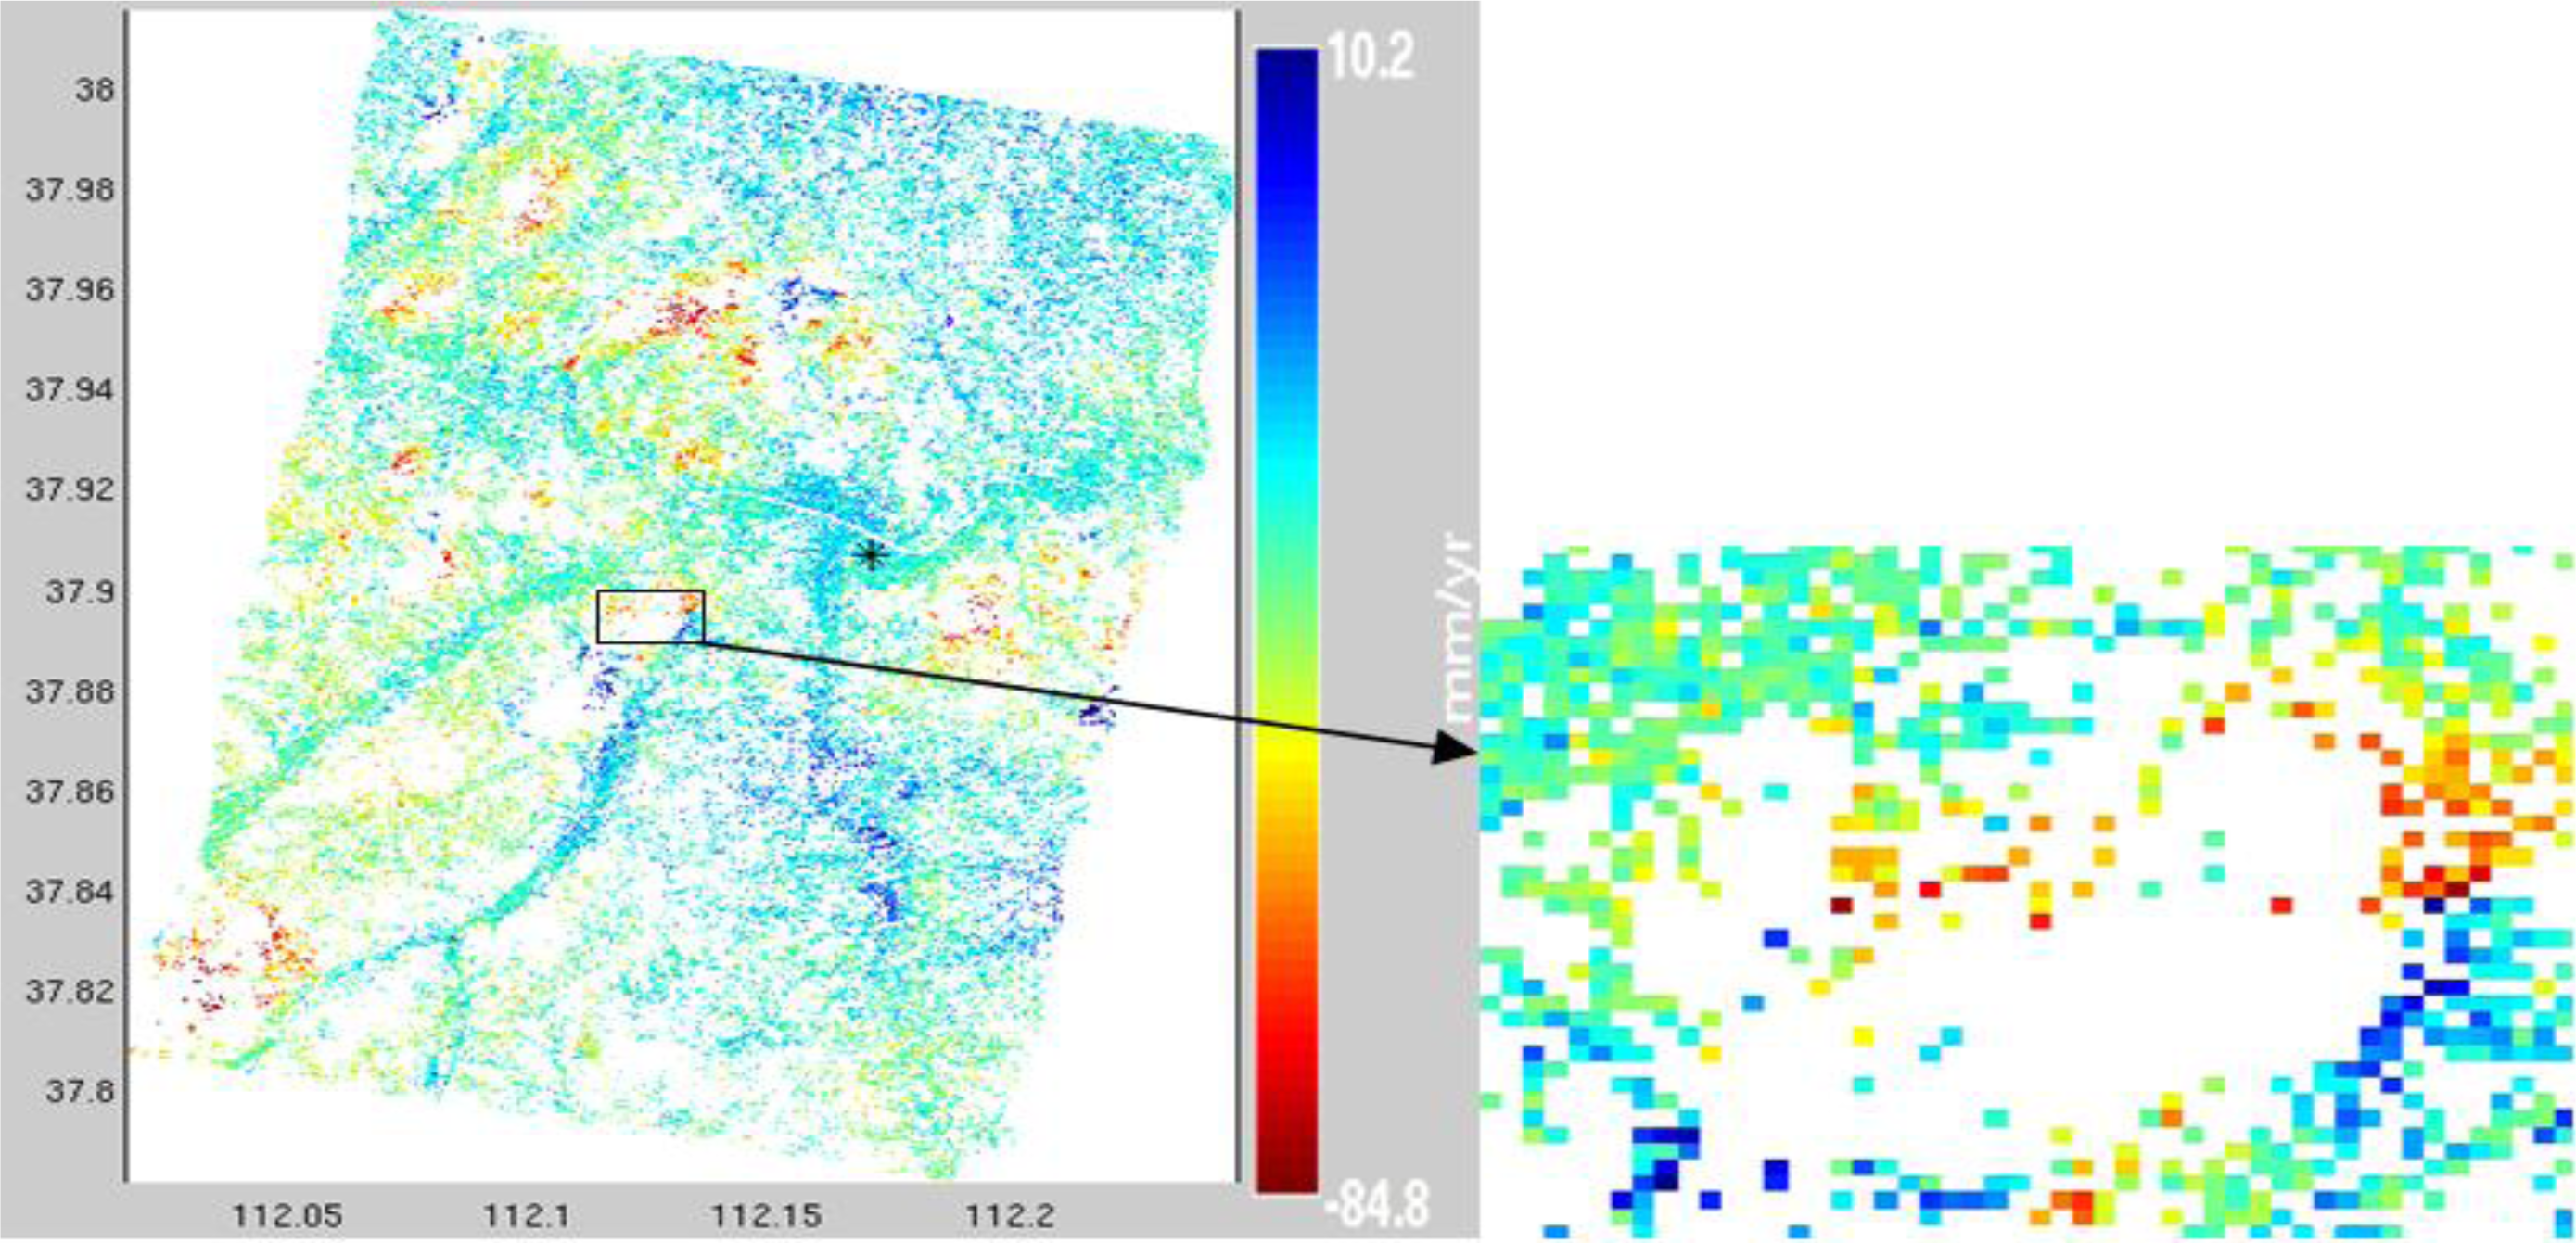
In the archive data analysis, we have obtained a general impression of the rapid and large deformation in Xishan. Due to the large phase gradients, deformation signals could not be derived correctly by phase unwrapping. According to the PSI results in
Figure 5 produced by StaMPS, persistent scatterers candidates are absent in many regions. It is easily explicable that many blank areas (without PS point) appeared in
Figure 5, as such areas were suffering strong subsidence, and the ground surface changes severely so that no phase-stable point is selectable. In these bland areas, no information can be obtained though we know such areas may coincide with the mining activities.
In this study, we combined DInSAR and time series analysis using SBAS method,
i.e., SBAS-DInSAR, to 21 scenes time-ordered images (
Table 6). In such SBAS-DInSAR processing, we calculated time series based on a stack of DInSAR images, which were strictly selected according to their high qualities. Unlike normal SBAS method will do, we do not select ‘good points’ by amplitude and/or phase evaluation but only work with ‘surface’ here, as with conventional DInSAR processing. The main aim is to find out the precise locations of deformation areas, which is an essential parameter for mining engineering. The basis flow of data analysis here includes combination of interferometric pairs, interferogram generation and time series analysis. Time series analysis was carried out when 22 scenes of interferogram were ready. The first acquisition, 4 April 2012, was used as the reference (the start point of time series analysis). Therefore, the deformation phases on all other dates are related to that on 4 April 2012. A sequence of cumulative subsidence were estimated and then covered with the mining map (Section 5.3).
A control point which locates in the subsidence area was chosen for this comparative analysis. According to GPS data processing by Precise Point Positioning (PPP) approach [
19], the control point moved −0.36 m in vertical direction from 4 April 2012 to 21 November 2012 (see
Figure 6). The InSAR derived time series has the quite similar trend though the maximum subsidence is −0.16 m, which is smaller than GPS observed. The reason could be the maximum Detectable Deformation Gradient (DDG), while the maximum detectable displacement in radian is π between two pixels as discussed before. In other words, the phase cannot be unwrapped correctly if the actual relative displacement between two pixels is more than π. During the repeated mining progress, the ground surface was suffering from strong subsidence with large gradient. Therefore, the deformation gradient is far beyond the frontiers of InSAR’s maximum DDG.
Although the maximum subsidence is hard to derive here, the area with displacement could be detected by InSAR. That means some other important parameters in mining engineering are still able to be estimated using InSAR technique. An apparent advantage is InSAR’s object is ‘surface’ rather than discrete ‘point’ in GPS or other techniques, which is extremely necessary in this study (in Section 5.3).
5.3. Correlation Analysis of InSAR Results with Mining Data
Concurrent with underground mining activities, subsidence usually occurs synchronously due to cavities created by underground mining. The extraction of coal seam removes support from the overlying rock strata and, therefore, makes them collapse into the void space that is created by the excavation. Surface deformation varies with the type of mine, the geometry of the mine, and manner of excavations. After excavation, subsidence may continue for some time in a gradual manner. In some cases, subsidence would even stop for a period, to be followed by sudden or steady deformation at some later date.
One product, Subsidence Hazard Boundary (SHB) or subsidence hazard map, provided by geodesy engineer is requisite for mining production. Subsidence hazard boundary indicates areas where the ground surface suffered from subsidence related to underground mining activities. Two terms have to be discussed when talking about SHB: Advanced influence angle—The ground surface starts to move (10 mm as defined) before the underground working face arrives. In the sagittal plane, the angle between the horizontal line and the line connecting the working face and the ground starting moving point on the coal pillar side is, so-called, the advanced influence angle; and advanced influence distance—The horizontal distance between this starting moving point and the working face is a advanced influence distance.
As mentioned, the underground mining will result in a large subsidence area at the ground surface and then comes into being a trough. In
Figure 7 (Adapted, [
20]), a trough W
1 will appear when the working face arrives at point 1. Along the working face carries on, the trough will expand to be W
2 with a larger depth. The maximum value of subsidence will not increase any more when the working face reaches to point 3, as this is then critical extraction. Following, W
4 is wider than W
3 but its depth will keep the same as that of W
3. In order to obtain SHB and relevant parameters, we carried out correlation analysis of mining and InSAR measurements at a working face 18207, where the mining schedule is available.
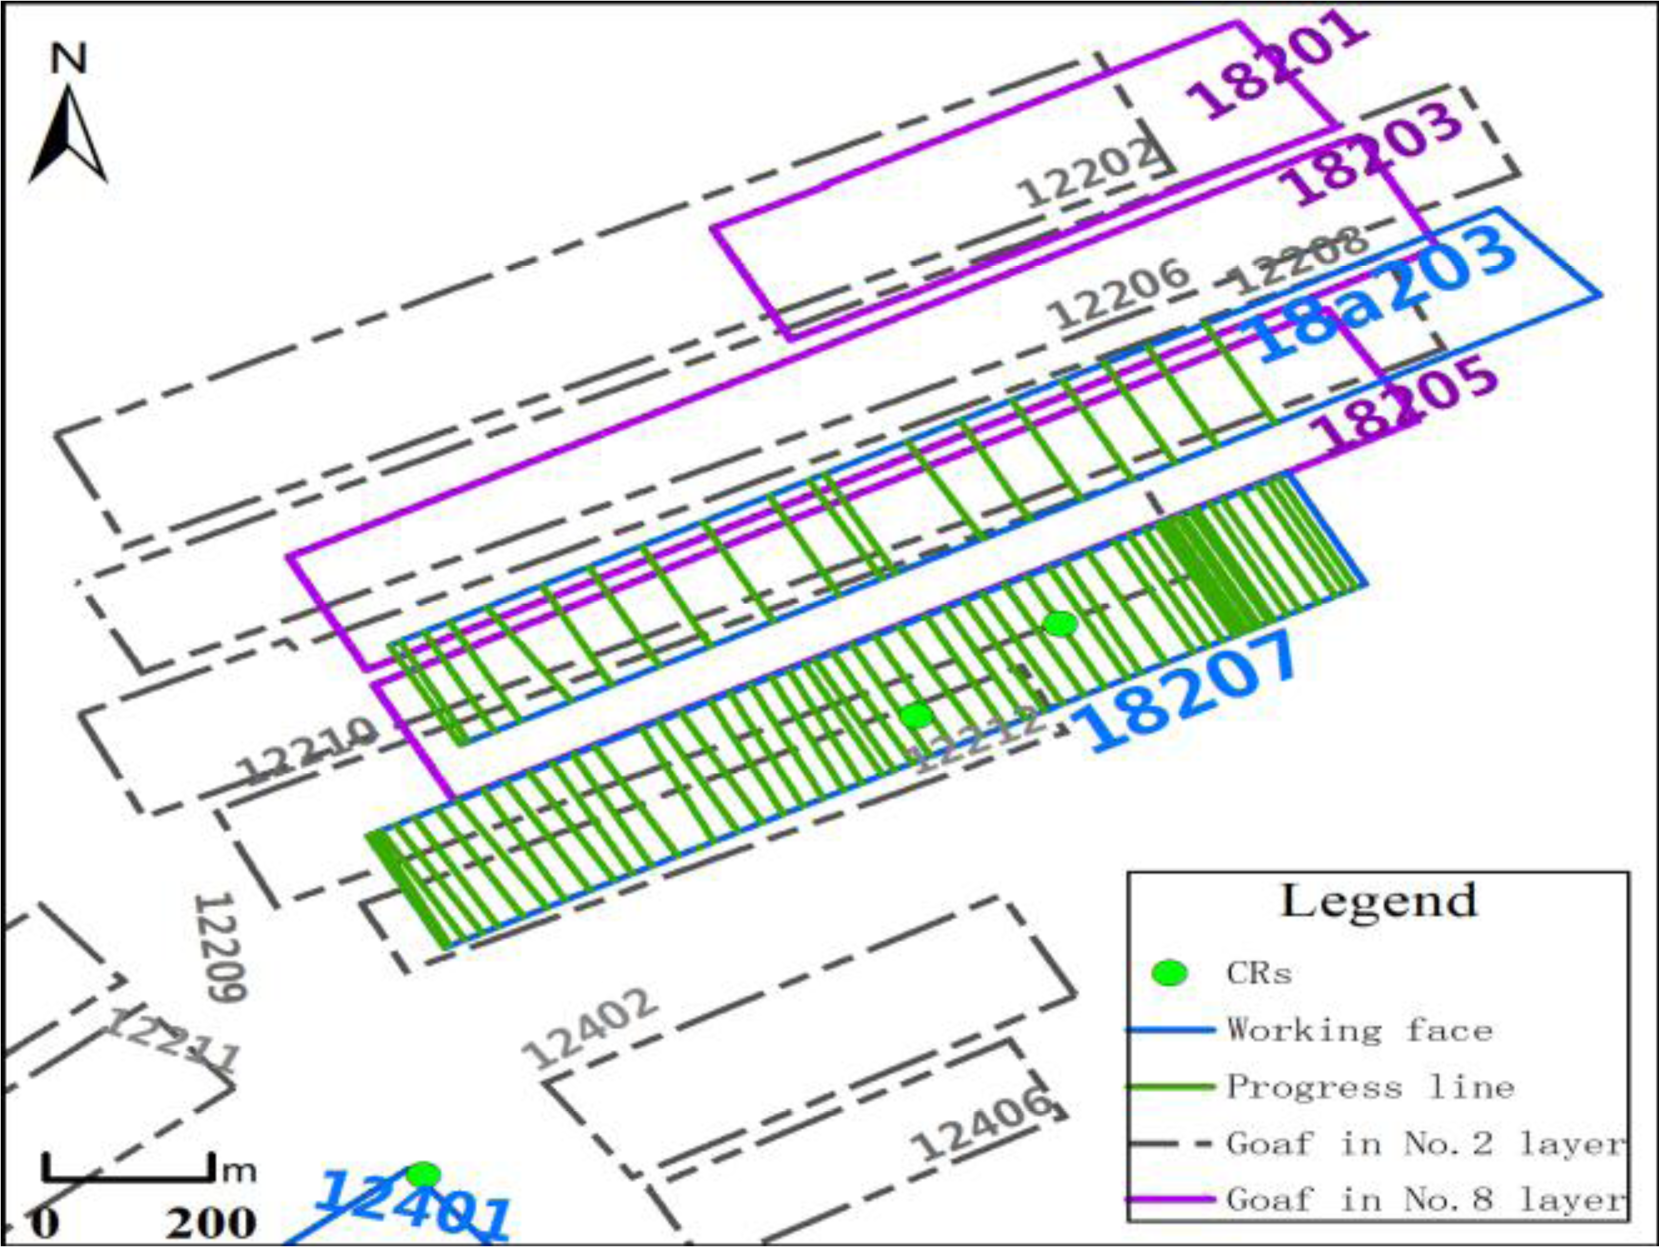
In
Figure 8, there are several goafs, which are marked as 12212, 12208, 12206, and 12202 in one layer. In another layer, 18205 and 18203 are goafs. Working face 18a203 started to mining in the latter half of the excavation of working face 18207. Apparently, surrounding ground will be affected by repeated mining influence.
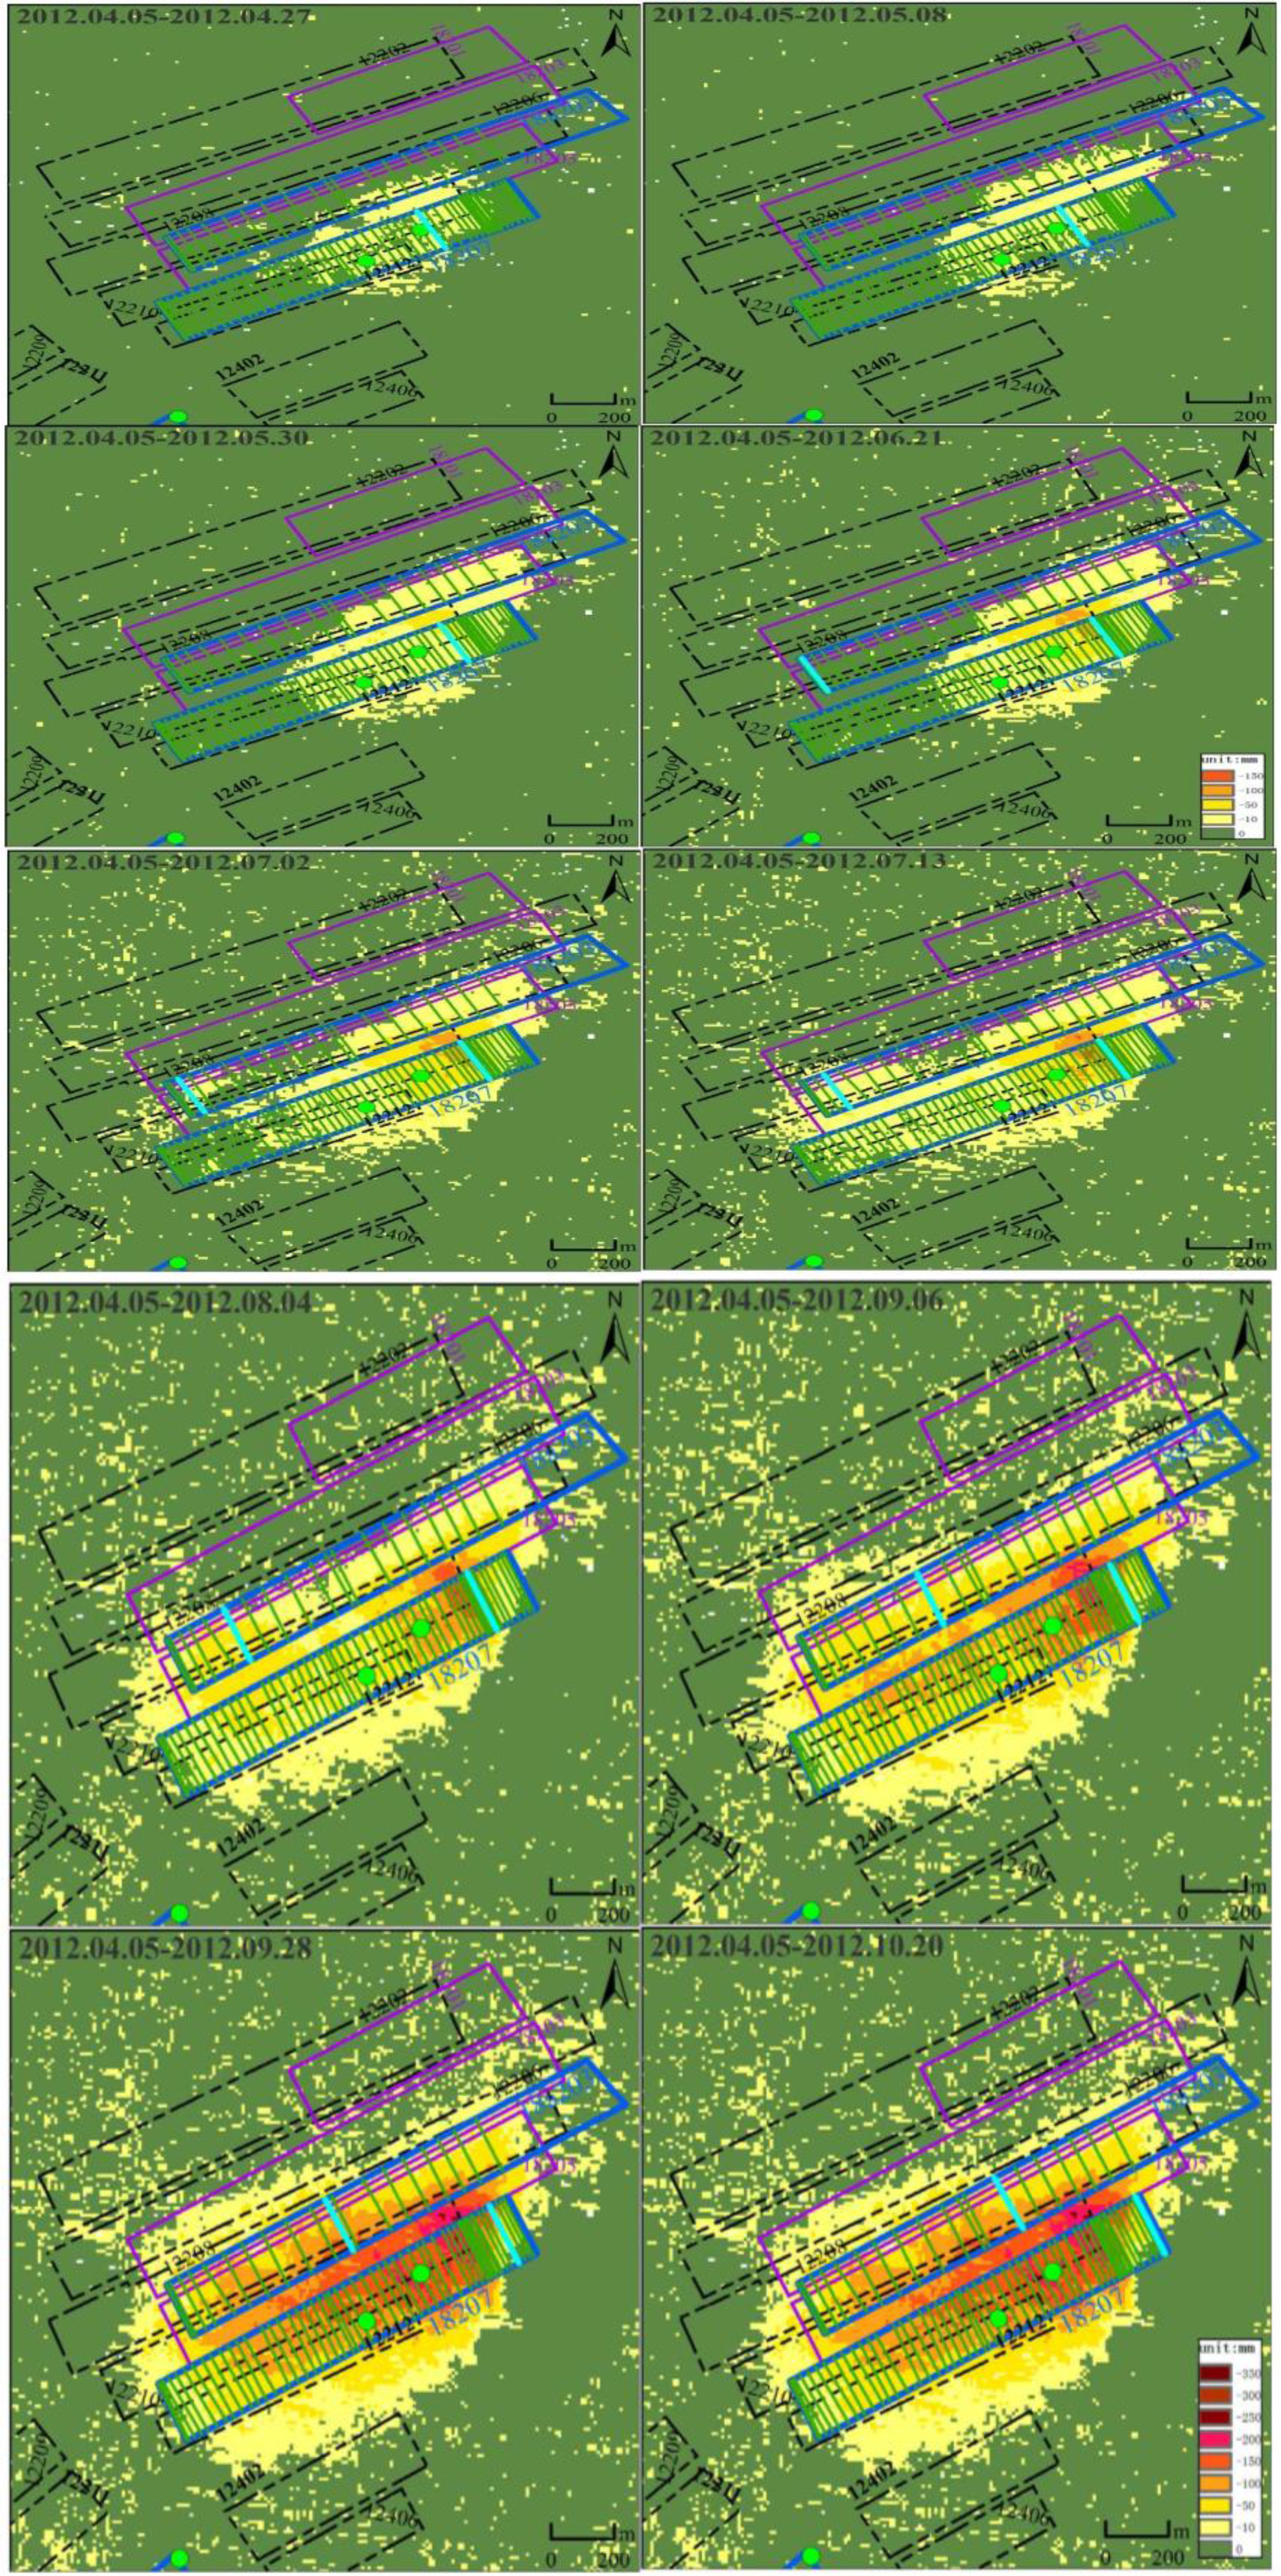
The extraction of coal in working face 18207 began in May 2011, and was completed in October 2012. The distance of cumulative tunneling is 870 m until 5 April 2012. During the period with SAR data acquisitions (from 5 April 2012 to 22 November 2012), the distance of cumulative tunneling is 370 m. Time ordered InSAR results are then overlaid by mining maps in ArcGIS [
11] with the aim of parameter extraction (
Figure 9).
In the displacement map 5 April 2012–2 July 2012, another trough appeared on the eastern side of the trough caused by the working face 18207. This is due to the started mining in the 18a203 working face. As time went on, these two subsidence troughs expanded wider and wider, and then merged with each other. If viewed from the vertical direction, 18207 and 18a203 working faces have different depths. The interconnecting area between these two troughs was suffering from combined subsidence induced by the falling and collapsing in two working faces underground. According to the mining record and the subsidence maps we derived already, advanced influence angles and distances in working face 18207 during the observation time were estimated and shown in
Figure 10.
From 8 May 2012 to 28 September 2012, the advanced influence angle mainly varies from 43° to 46° when 41° on 4 August 2012 dispersed around 2° (see
Figure 10). After 28 September 2012, no clear expansion of subsidence boundary was detected, although the maximum displacement increased. According to the displacement map based on pair 2012.04.05 and 2012.11.22, the final subsidence hazard boundary around this working face was shown in
Figure 11.
The accuracy of SHB estimation is mainly subject on the accuracy of geocoding. In order to assess the accuracy of the geocoding, the displacement maps with the corner reflectors were transformed to the World Geodetic System 1984 (WGS84) in UTM. Moreover, GPS processed results of the corner reflectors were used to compare with and evaluate the coordinates of corner reflectors in the displacement maps. The comparison demonstrated that the average error vector was 4 m.
Comparing to subsidence maps generated by archive ENVISAT and ALOS images, TerraSAR data sets provided approximate 40 cm subsidence in half-a-year even though its wavelength is much shorter. This mainly benefits from TerraSAR-X’s short revisit cycle and the reduced pixel size by studying of DDG.
6. Monitoring by 4-D TomoSAR
Tomography SAR (TomoSAR) has been applied in urban area or construction monitoring successfully [
21–
24]. In this mountainous mining area with both complex terrain and buildings, we wonder the performance of this new technique, and how TomoSAR can deal with, for instance, layover phenomenon.
Traditional SAR imaging process projects a three-dimensional scene into two-dimensional plane (azimuth-range plane). Due to the particular imaging geometry of SAR, the target with shorter slant range is imaged nearer the sensor than the target with longer slant range. Especially, two targets will be imaged at the same range cell when the slant ranges of the two targets are the same. This character causes the top and bottom inverted phenomenon and layover phenomenon. The phase discontinuity at the top and bottom inverted area causes the unwrapping phase process to fail, which is an important step in traditional InSAR technologies and decides the precision of the result. Furthermore, the traditional InSAR technologies are completely ineffective at the layover area, as all traditional InSAR technologies are based on the assumption that there is only one scatter in each cell. Two targets at the same cell maybe deform at different velocity, which causes the DInSAR technology out of work [
21]. The top and bottom inverted phenomenon and layover phenomenon are extremely common in the urban area, as there are many high buildings [
22]. The slant range of the target at the roof of the high building is shorter or equivalent to the range of the target at the floor around that building. However, the urban area is much more important in the environmental risk monitoring field.
TomoSAR is an effective method, which restrains the top and bottom inverted SAR phenomenon or the layover phenomenon without phase unwrapping process, by using the synthetic aperture along elevation direction, as shown in
Figure 12 [
21–
25]. Given a definite radar range r(0) for the master SAR image, one can find a virtual point P
ref on the ellipsoidal reference surface for the real point P [
25]. The slant range of the point P
ref is the same as the slant range of the point P and |R
0| = r(0). For point P, the direction from the sensor to the virtual point P
ref is normally defined as the range direction, when the direction perpendicular to the range direction is set to be the elevation direction, shown as r and s in
Figure 12, respectively. B
v and B
h are the baselines, perpendicular and parallel to the reference radar look vector R
0, respectively.
The repeat-pass mode can obtain a series of SAR images of the same scene with a temporal baseline. 4-D and extended 4-D TomoSAR can estimate the subsidence and the thermal dilation. As the samplings along the elevation direction are very few and the targets in the echo cell are sparse, the Compressive Sensing (CS) method is more attractive than Backprojection, Singular value decomposition, and Wiener Regularization methods, as the CS method can get a higher resolution with a lower sample ratio. The traditional signals reconstructing approach follows the Shannon sampling theorem, which requires that the sampling rate be twice the highest frequency of the signals. The CS method provides an approach of data reconstruction which overcomes this theorem [
25]. Comparing with the 4-D TomoSAR approach using CS method in [
25], the proposed algorithm has one modification that the deformation velocity difference of two targets at the same cell is limited in dealing with large subsidence and serious layover phenomenon area. In this study, we chose two test sites in this mining area to see if there is any subsidence. There is no ground monitoring carried out, such as by leveling or GPS along with the mining activities.
Figure 13 shows the 4-D TomoSAR results at AOI NO.1, a small town named Malan, where the layover phenomenon is not serious. There are many signal parameter scatters can be used to estimate the subsidence.
Figure 13a,b show the area we analyzed. The analyzed area shown in the red rectangular is near a mine.
Figure 13a is the layover map, which shows the layover effects in this area.
Figure 13c,e are the height estimation results, while
Figure 13d,f present the subsidence estimation results. The estimated results show that the subsidence is about 6.5 cm/year.
Figure 14 shows the 4-D TomoSAR results in AOI NO.2, the city of Gujiao, at where the layover phenomenon is serious. Both a playground and a business quarter are used to analyze the subsidence, as shown in
Figure 14b.
Figure 14c shows the subsidence of signal scatter and
Figure 14d and
Figure 14e show the subsidence of double scatters of the playground.
Figure 14f plots the subsidence of signal scatter and
Figure 14g and
Figure 14h plot the subsidence of double scatters of the business quarter. The average deformation velocity is 8 cm/year.
Due to the serious layover phenomenon, the assumption that there is only one scatter in each cell is not met, which brings signification estimation error, the height estimation result, and deformation estimation result. However, the TomoSAR, including 3-D, 4-D, and extend 4-D TomoSAR, is not based on that assumption, and profiles the scattering distribution along the elevation direction and estimates the height and subsidence of the each scatter in one cell. Hence, layover phenomenon affects TomoSAR a little. With the subsidence analysis of Gujiao city, using 4-D TomoSAR technology, the estimated average subsidence was 7 cm/year.
7. Conclusions
Multiple platform SAR datasets were processed with DInSAR, PSI and SBAS-DInSAR techniques. The results showed the advantages of InSAR technique for large scale monitoring. However, applications to mountainous areas lead to more challenges than in other cases, which require us to consider not only spatial or/and temporal de-correlation, due to mountains terrain and baselines (spatial and temporal), but also topographic effects. In this study of Xishan coal mine monitoring, InSAR fulfils the aim of SHB derivation. Moreover, TerraSAR-X provides a new possibility for InSAR application in mountainous mining area, due to its high resolution and short revisit cycle. In addition, we also employed the extension of conventional InSAR, i.e., an extended 4-D TomoSAR, to measure the structure movements and indicated promising results.


