Long-Term Land Subsidence Monitoring of Beijing (China) Using the Small Baseline Subset (SBAS) Technique


Abstract
: Advanced techniques of multi-temporal InSAR (MT-InSAR) represent a valuable tool in ground subsidence studies allowing remote investigation of the behavior of mass movements in long time intervals by using large datasets of SAR images covering the same area and acquired at different epochs. The settlement in Beijing is very serious, producing adverse environmental impacts. Excessive groundwater withdrawal is the most direct cause of land subsidence.In this paper, a spatial-temporal analysis of the land subsidence in Beijing was performed using one of the MT-InSAR techniques, referred to as Small Baseline Subset (SBAS). This technique allows monitoring the temporal evolution of a deformation phenomenon, via the generation of mean deformation velocity maps and displacement time series from a data set of acquired SAR images. 52 C-band ENVISAT ASAR images acquired from June 2003 to August 2010 were used to produce a linear deformation rate map and to derive time series of ground deformation. The results show that there are three large subsidence funnels within this study area, which separately located in Balizhuang-Dajiaoting in Chaoyang district, Wangjing-Laiguangying Chaoyang district, Gaoliying Shunyi district. The maximum settlement center is Wangsiying-Tongzhou along the Beijing express; the subsidence velocity exceeds 110 mm/y in the LOS direction. In particular, we compared the achieved results with leveling measurements that are assumed as reference. The estimated long-term subsidence results obtained by SBAS approach agree well with the development of the over-exploitation of ground water, indicating that SBAS techniques is adequate for the retrieval of land subsidence in Beijing from multi-temporal SAR data.1. Introduction
Interferometric Synthetic Aperture Radar (InSAR) is a valuable technique for measuring surface deformation with high spatial resolution and high accuracy. It has been successfully applied to the monitoring of landslides, earthquake deformations, volcanic activities and urban subsidence as well as anthropogenic deformation caused by mining, oil, gas and groundwater extraction [1–4]. However, problems due to changes in scattering properties of the Earth’s surface with time and look direction limit the applicability of InSAR [5]. To overcome these difficulties and retrieve long time series of ground deformation, multi-temporal InSAR (MT-InSAR) techniques have been presented in recent years. One of MT-InSAR techniques, referred to as SBAS, was applied to measure the time series surface displacement by using the redundant observation to reduce the effects of interferometric decorrelation and atmosphere artifacts. SBAS technique selects interferograms with small spatial and temporal baselines that are substantially coherent. Such interferograms are easy to unwrap, and it is possible to perform time series analysis for pixels that are coherent above a selected threshold on all interferograms [6–8]. Interferograms form a redundant network linking between images in the temporal and spatial baseline space. Interferograms are then spatially unwrapped and the inversion of the whole set of interferograms by Singular Value Decomposition (SVD) provides phase delay time series. The advantages of the SBAS methodology increase the spatial coverage especially outside urban areas, by taking the speckle properties of most targets in SAR images into account. Nowadays, the efficiency of the SBAS approach has been proven in numerous applications [9].
Urban Ground subsidence is the most commonly geologic hazard in many countries. For example, more than 44,200 km2 in 45 states in the US and over 70,000 km2 in 17 provinces in China have been directly affected by subsidence [10]. Subsidence has been an issue for a long time and leads to damage of urban infrastructure including buildings, railways, highways, subways and underground facilities (water supply pipes, gas, electricity installations, etc.). Beijing, the capital of China, with a population of 22,000,000 people and an area of 16,808 km2 is the largest city in China. As reported by the China Geological Survey, the groundwater level has dropped in Beijing since the 1970s due to the demands of rapid urban development [11,12].Two-thirds of domestic water is supplied by groundwater in Beijing. In 1999, the area of accumulated land subsidence over 200 mm was found to be about 350 km2. With the increasing demand of water resources, five emergency groundwater resource regions have been built since 2001 with pronounced accumulative settlements of up to 1163 mm in 2009 [13,14]. Local differential subsidence gradients threaten the integrity of the structure and infrastructure, whereas global subsidence produces tilts in the drainage network and in water reservoirs, and changes the flood patterns during the rainy season. Furthermore, the rapid development, urbanization and industrialization in the past decades have accelerated the land subsidence, due to the increasing demand for groundwater from industry and large populations, as well as other anthropogenic factors, such as skyscraper and highway construction, and subway and tunnel excavation. Therefore, accurate mapping and time-series analysis of subsidence in a wide area of Beijing, together with the analysis of its driving force are critically needed for early hazard warnings and sustainable urbanization.
Some researchers have investigated Beijing land subsidence by different measurement methods and techniques. Although Beijing’s in-situ subsidence monitoring system, composed of leveling, GPS, boreholes and drilled ground water wells, is reliable, its lower spatial and temporal resolution and high cost are limitations which keeps us from having a comprehensive understanding of the whole deformation field [14]. Zhao retrieved the land subsidence of the eastern Beijing based on 20 ENVISAT ASAR images acquired between June 2003 and March 2007 using an interferometric point target analysis (IPTA) technique. His research results show that the linear subsidence velocity of the most urbanized area was about −10 cm/yr during the time [15]. Alex investigated the long term ground deformation in Beijing based on 41 ENVISAT ASAR images acquired from June 2003 to March 2009 using persistent scatterer interferometry (PSI) technique. The results show that the majority of the vertical displacement rates were in the range of −115 mm/yr to 6 mm/yr [12]. In order to more fully investigate the status of Beijing land subsidence in recent years, this study uses more SAR data and longer time span SAR data compared to previous studies, based on the Small Baseline Subset (SBAS) technique. This technique monitors the temporal evolution of Beijing land deformation, via the generation of mean deformation velocity maps and displacement time series from 52 C-band ENVISAT ASAR images acquired from June 2003 to August 2010. The average subsidence velocity in my study is approximately in the range of −111 mm/yr to 4 mm/yr. Generally, the results are consistent with those reported in the paper [12,14,16]. So, the aim of this paper is to (1) comprehensively investigate the status of ground subsidence in Beijing using a large amount of SAR data over a long time span; (2) perform time series analysis in various areas, for the purpose of detailed risk assessment and driving force analysis; (3) explore specific subsidence areas and help improve the strategy of regional land subsidence and groundwater resource management to guarantee the safety of groundwater exploitation.
2. Study Area
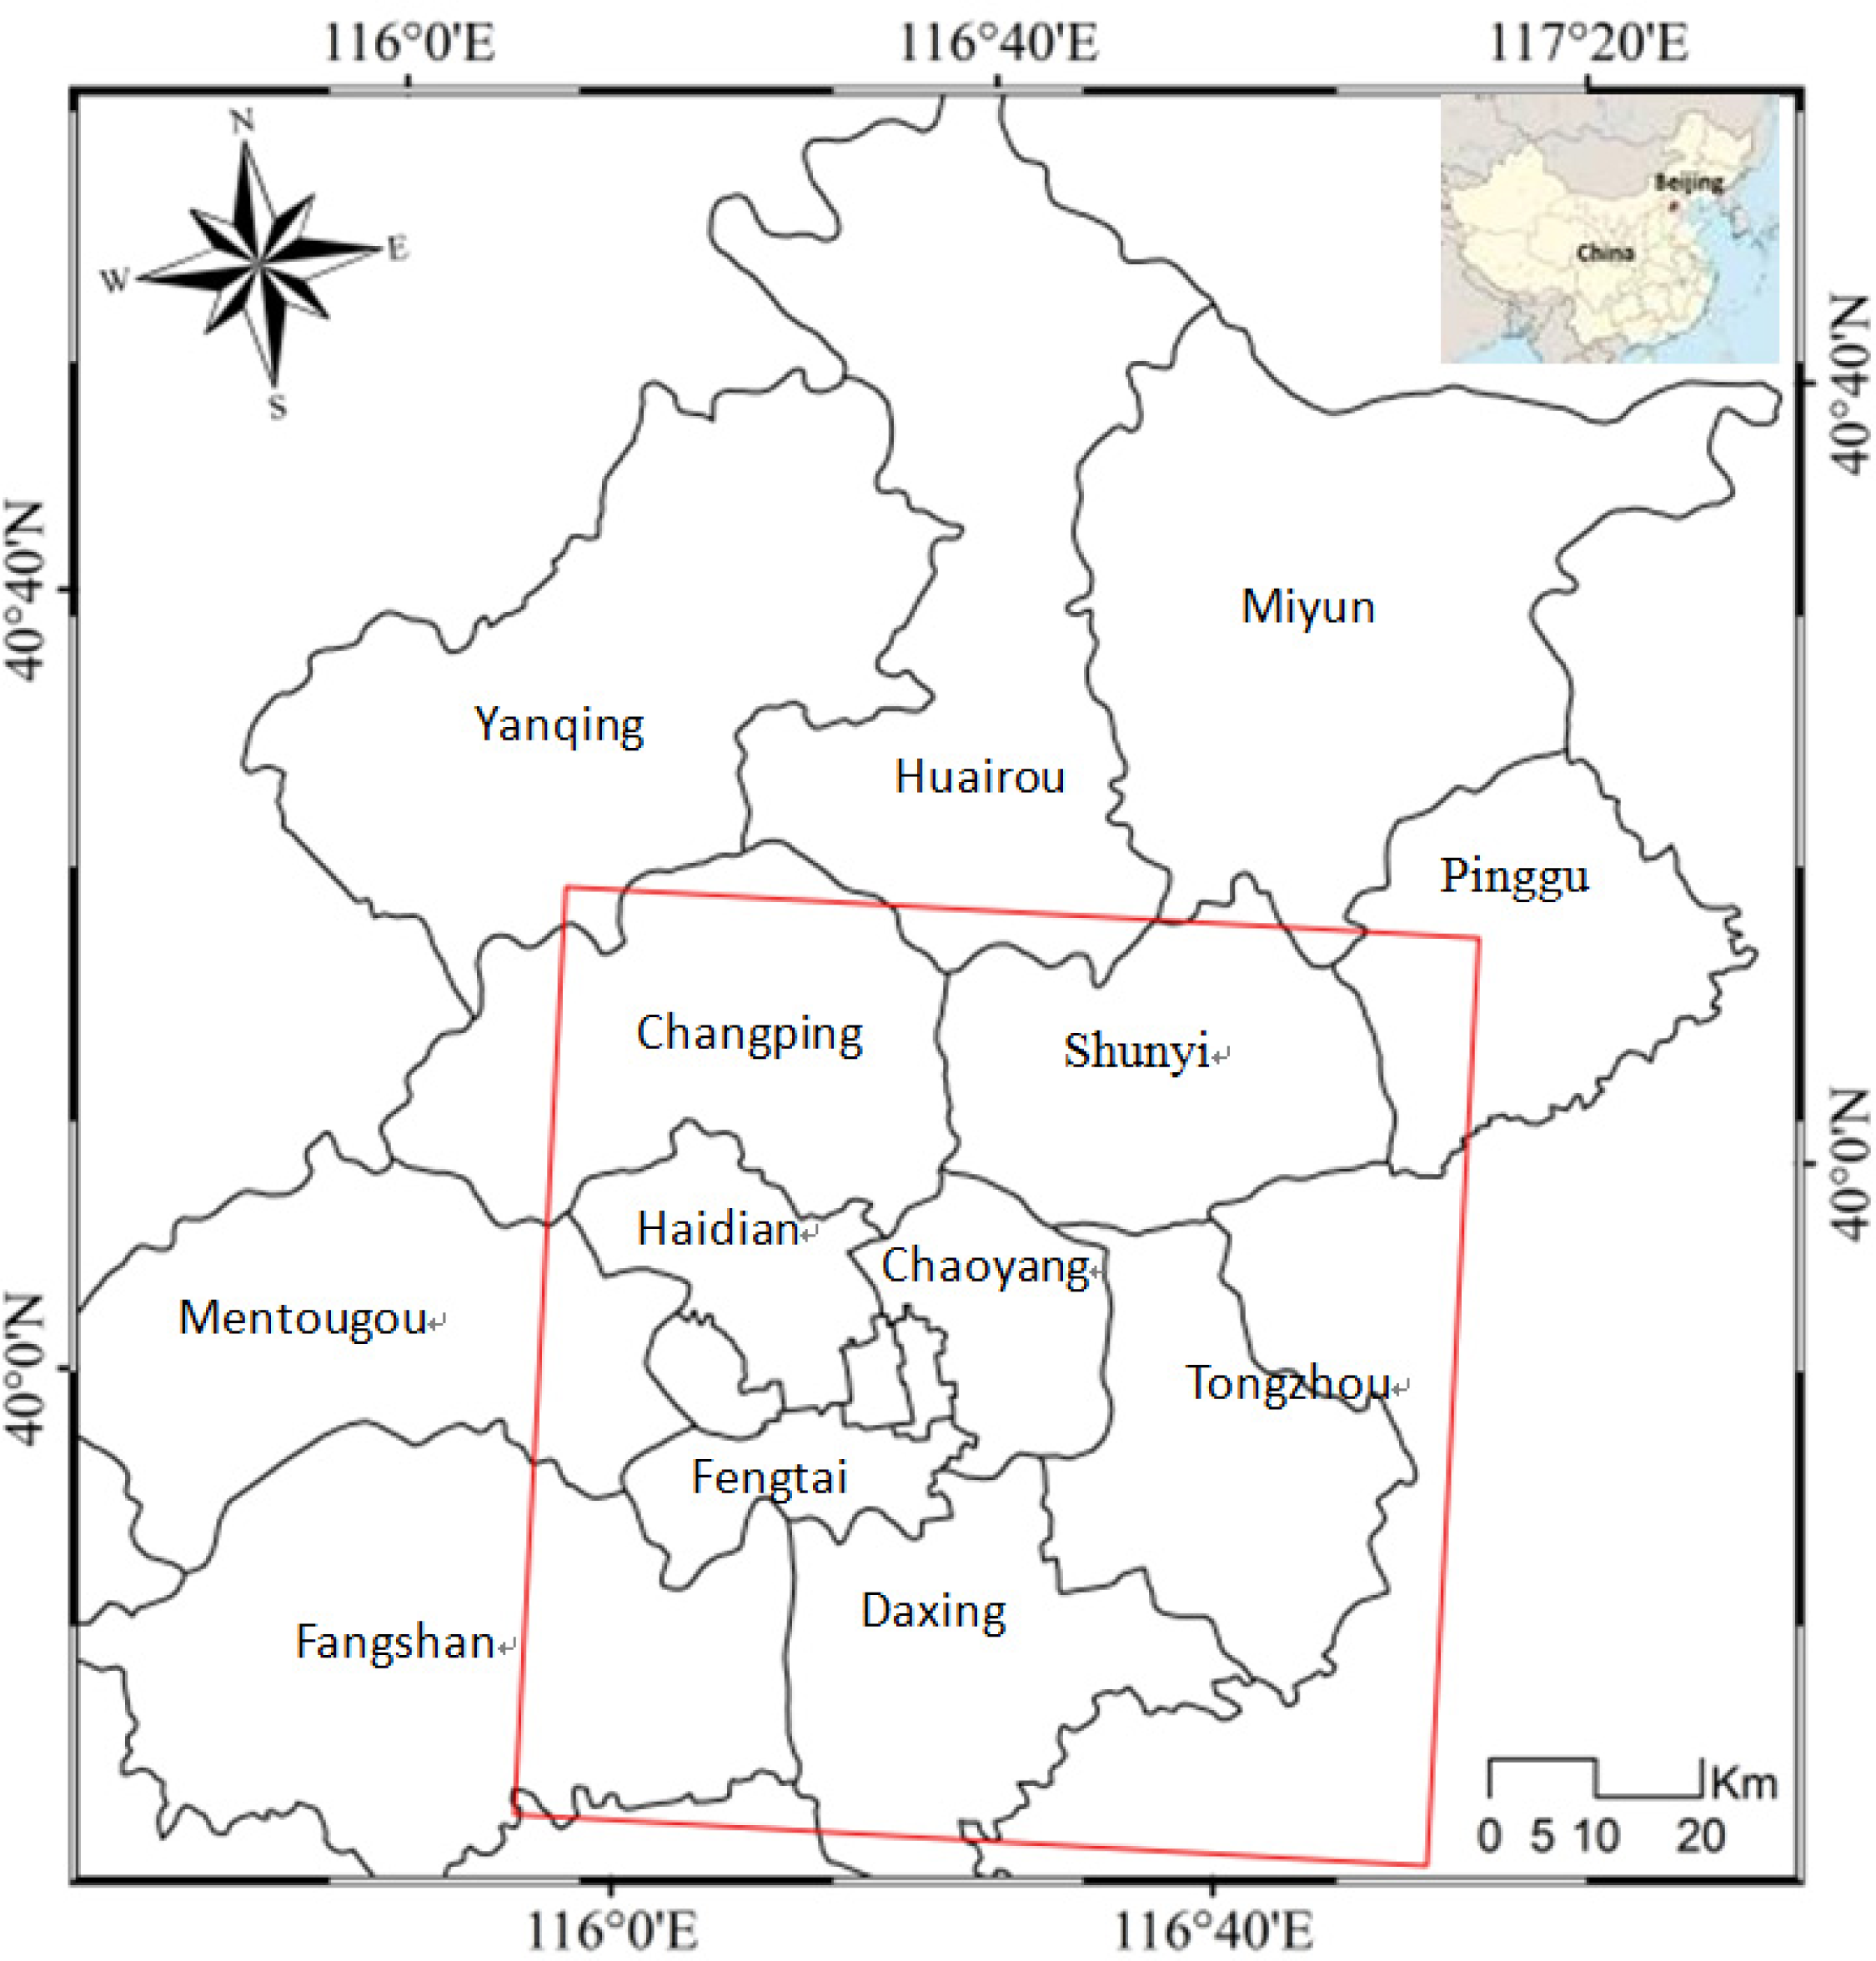
Beijing is located at the northern tip of the North China Plain, near the meeting point of the Xishan and Yanshan mountain ranges. The geographic extent of Beijing is marked by longitudes 115°25′E–117°30′E and latitudes 39°26′N–41°03′N with a total area of around 16,808 km2, as illustrated in Figure 1. The city itself lies on flat land (elevation 20–60 m) that opens to the east and south. The municipality’s outlying districts and counties extend into the mountains that surround the city from the southwest to the northeast.
The alluvial fans in the Beijing area are mainly composed of coarse sandy gravel; land subsidence is supposed to be caused by over-exploitation of ground water. Beijing has a long history of land subsidence since 1935; a cumulative subsidence of 400 mm from 1955 to 1973, 1557 mm from 1973 to 1987, 2815 mm from 1987 to 1999 and 4114.12 mm from 1999 to 2005 [16]. In recent decades, large-scale urban development has accelerated in Beijing, producing many skyscrapers, an underground railway network and tunnels. It is argued that massive engineering construction contributes significantly to the regional ground subsidence raising safety concerns [17,18].
3. Methodology
SBAS algorithm is a post-processing method to generate the mean deformation velocity maps and displacement time series from the multiple unwrapped differential interferograms. A detailed discussion on the SBAS algorithm is beyond the scope of this work and can be seen in references of [8,9]. So in this section, we will provide the key steps of the algorithm in the following.
- (1)
We start by considering a set of N + 1 single look complex (SLC) SAR images relative to the same area, acquired at the ordered times (t0, …, tN).. In the same time, we select one image as the common master image and assume that the other images are coregistered with respect to master image in order to have a common reference grid [5].
- (2)
M differential interferograms involving the previously mentioned N + 1 single look complex (SLC) SAR images were generated. Note that each differential unwrapped interferogram was absolutely calibrated by the stable region or a known variable reference point in the unwrapped interferogram. Note also that the SAR image pairs selected for the interferograms generation are characterized by a small spatial and temporal baseline as well as a small doppler centroid frequency difference [19].
- (3)
We refer to the generic j-th interferogram generated from SAR images acquired at times tB and tA, the phase signal of each unwrapped interferogram for a coherent pixel located at (x, r) coordinates can be expressed as
Where λ is the transmitted signal central wave length, ϕ(tB,x,r) and ϕ(tA,x,r) represent the phases of the two images acquired at tB and tA, d(tB,x,r) and d(tA,x,r) are the radar line of sight projections of the cumulative deformation at tB and tA with respect to the first scene t0 assumed as a reference. β(j,x,r) and Δz are the height-to-phase conversion factor and topography error. δϕj,atm(x,r) is phase difference caused by atmosphere phase screen (APS). δnj is the decorrelation effects.
The equation (1) allows us to define a system of M equations in the N unknowns ϕ(ti,x,r), which can be reorganized, by using a matrix formalism, as follows:
Where A is an incidence-like matrix directly related to the set of interferograms generated from the available data [6,9]. Accordingly, the dependence on the variables (x,r) has been neglected in (2) and this simplification will be maintained hereafter in the overall matrix representation.
We may now manipulate the system of equation (2) in such a way to replace the present unknowns with the mean phase velocity between time adjacent acquisitions. Accordingly, the new unknowns become:
And by substituting (3) in (2), we finally get the new equation:
Where B is a M × N matrix corresponding to the unknown vector. In the end, the singular value decomposition (SVD) is applied to the matrix B, which gets the minimum norm solution of the velocity vector. And through the integration of each period of time, you can get the deformation velocity of each time period. The atmospheric effect can be mitigated by filtering in the subsequent step. After removing the atmospheric effect, the displacement time series is finally achieved [5,20].
4. InSAR Dataset and Data Processing
A total of 52 SLC ASAR images, acquired by the European Space Agency (ESA) ENVISAT satellite between June 2003 and August 2010, have been used in this study. A subset of approximately 43 × 43 km was selected from the original images corresponding to the whole of Beijing region (Figure 1). DORIS precise orbit state vectors were provided by the ESRIN Help desk of ESA to calculate the initial estimation of interferometric baselines. External DEM data, Shuttle Radar Topography Mission-3 (SRTM-3) at a spatial resolution of 90 m that were provided by NASA were used to simulate and remove the topographic phase contribution[1]. The DEM data were also applied for reflatting and geocoding the resultant InSAR products from range-Doppler coordinates into map geometry corresponding to the Universal Transverse Mercator (UTM) coordinate system. ENVI and SARscape software were employed to process the raw data and perform time series analysis.
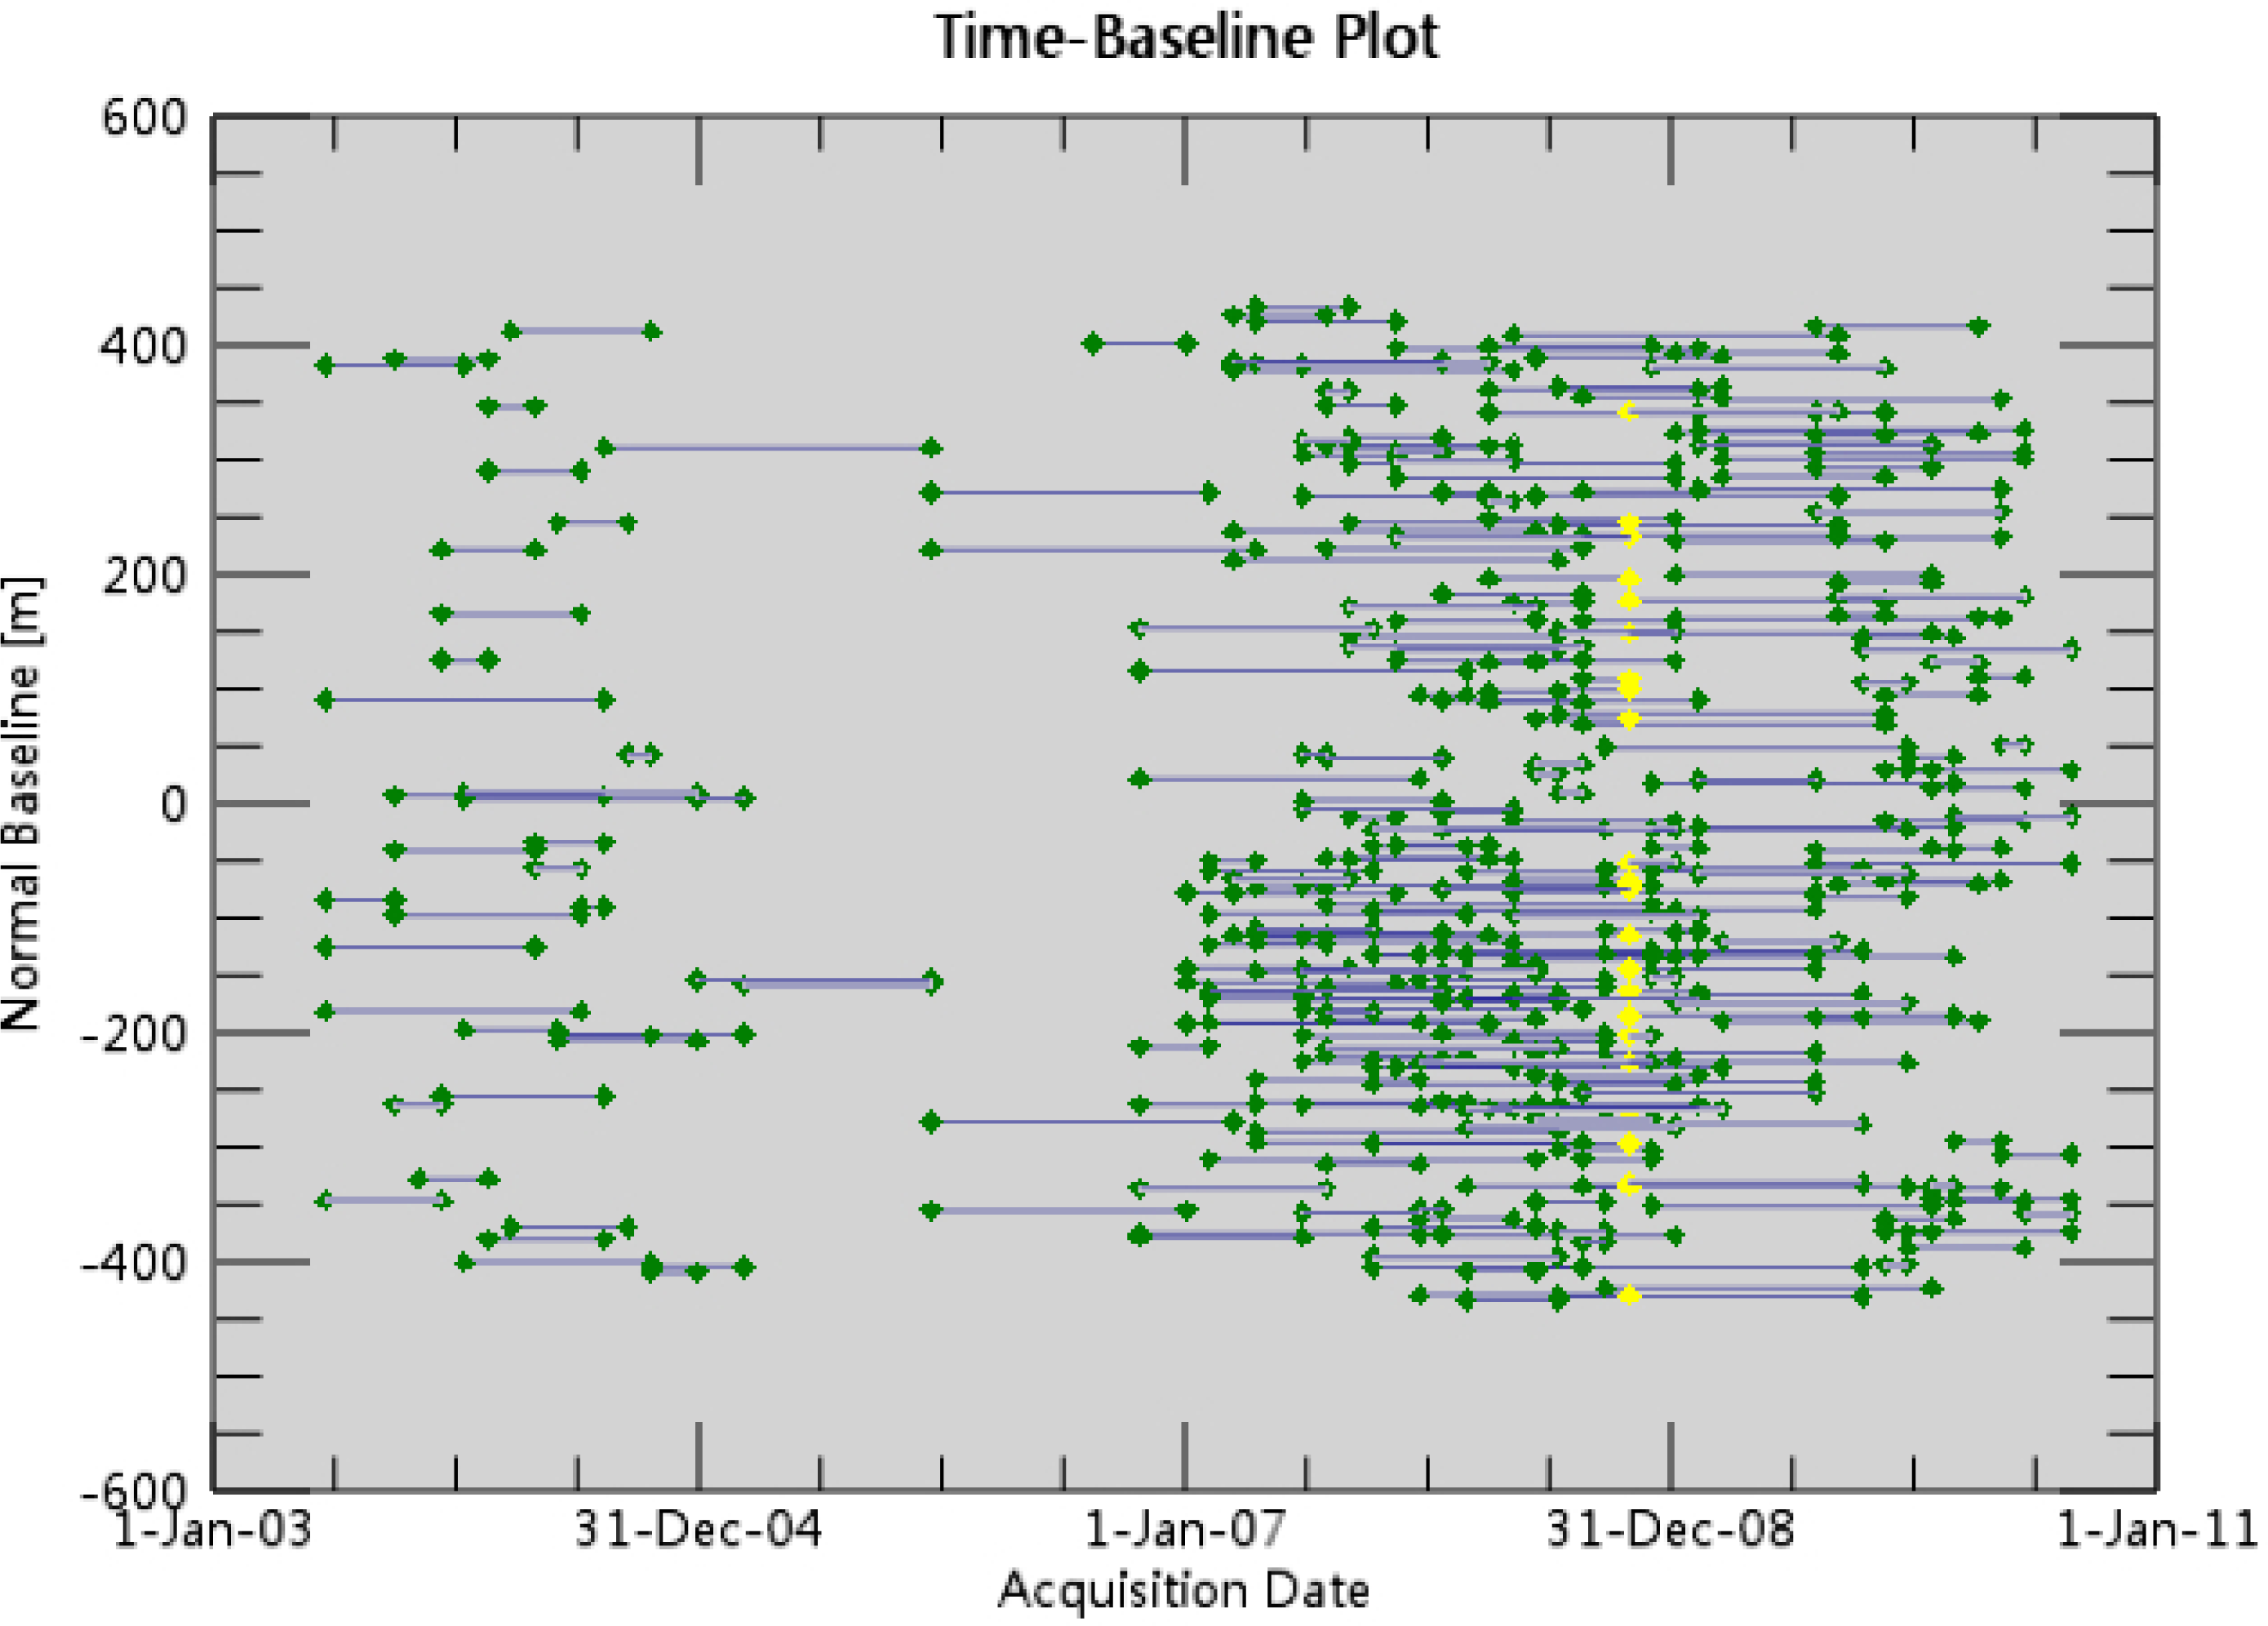
From the whole set of interferograms formed by all possible pairs of images, only those with a perpendicular component of spatial baseline smaller than 433 m, a temporal baseline shorter than 500 days, and a relative Doppler centroid frequency difference below 100 Hz were selected for the following interferometric analysis. The ASAR scene on 29 October 2008 was used as the super master image. In general, we can expect more accurate results when we analyze as many interferograms as possible, because multiple interferograms are preferred for cross-validation. In this way, the misinterpretation of topography, atmosphere, and noise as displacement could be mitigated. By limiting the baselines, the most incoherent interferograms were rejected; the number of all generated interferograms is 317. The temporal baselines of these selected interferograms are shown in Figure 2. From the 317 selected interferograms, 115 interferograms having temporal baselines lower than 180 days and perpendicular baselines less than 100 m were considered as the most significant in terms of the description of the deformation and therefore were stacked. Spatial phase unwrapping was carried out prior to the stacking analysis. It was accomplished in this work using the MCF phase unwrapping algorithm applied to a triangular irregular network.
5. Results and Interpretation
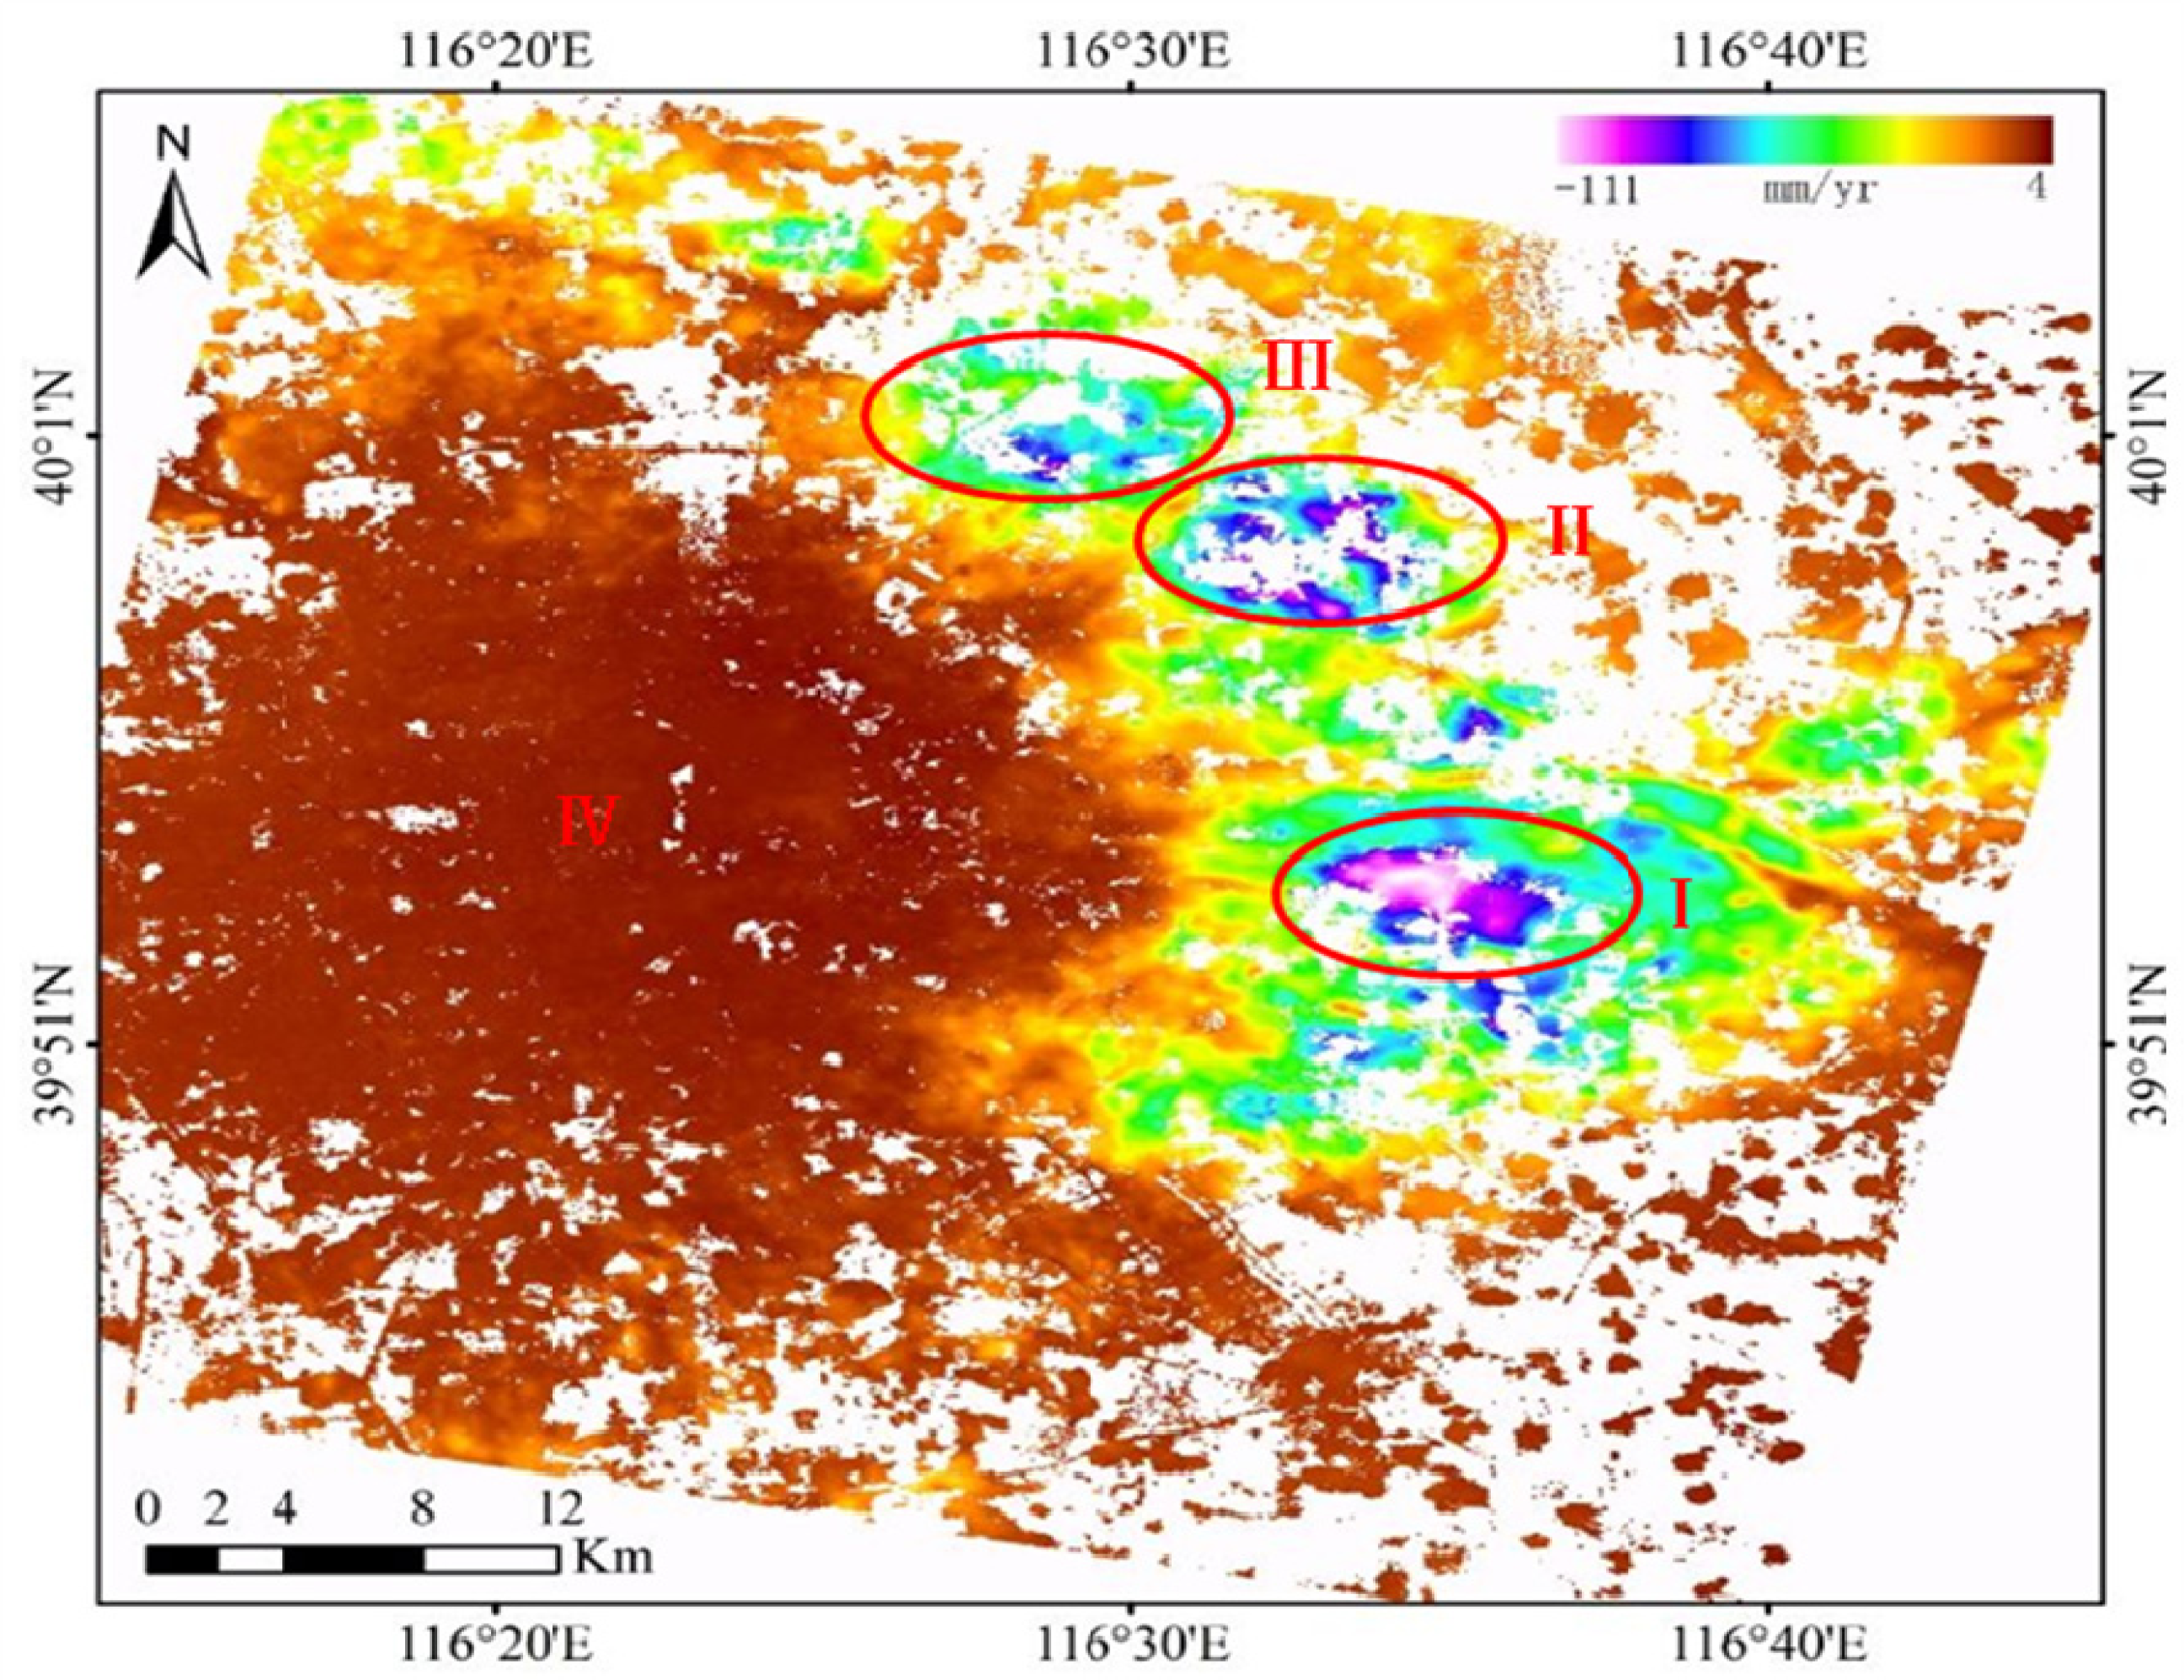
The locations and the average surface displacement velocity detected by SBAS technique in the study area are shown in Figure 3. The negative sign of the deformation rate stands for an increasing distance with time away from the satellite (e.g., subsidence), whereas the positive sign of the deformation rate stands for a decreasing distance with time towards the satellite (e.g., uplift). It can be observed in Figure 3 that three large subsidence funnels are detected in this study area, which are located in Balizhuang-Dajiaoting in Chaoyang district, Wangjing-Laiguangying Chaoyang district, and Gaoliying Shunyi district, respectively. The maximum settlement center is Wangsiying-Tongzhou along the Beijing express; the deformation velocity even exceeds 110 mm/yr in the LOS direction. Generally, the mean subsidence velocity map illustrates a relatively stable pattern (−4 to 4 mm/yr) in the center of the Beijing (e.g., Shijingshan district, Fengtai district, Haidian district, Dongcheng district and Xicheng district), while the annual average sedimentation rate is between 10 mm/yr and 20 mm/yr in the Daxing District. The overall view shows that ground subsidence is severe in the northeast of the study area, which coincides with previous ground work derived from ground data [12].
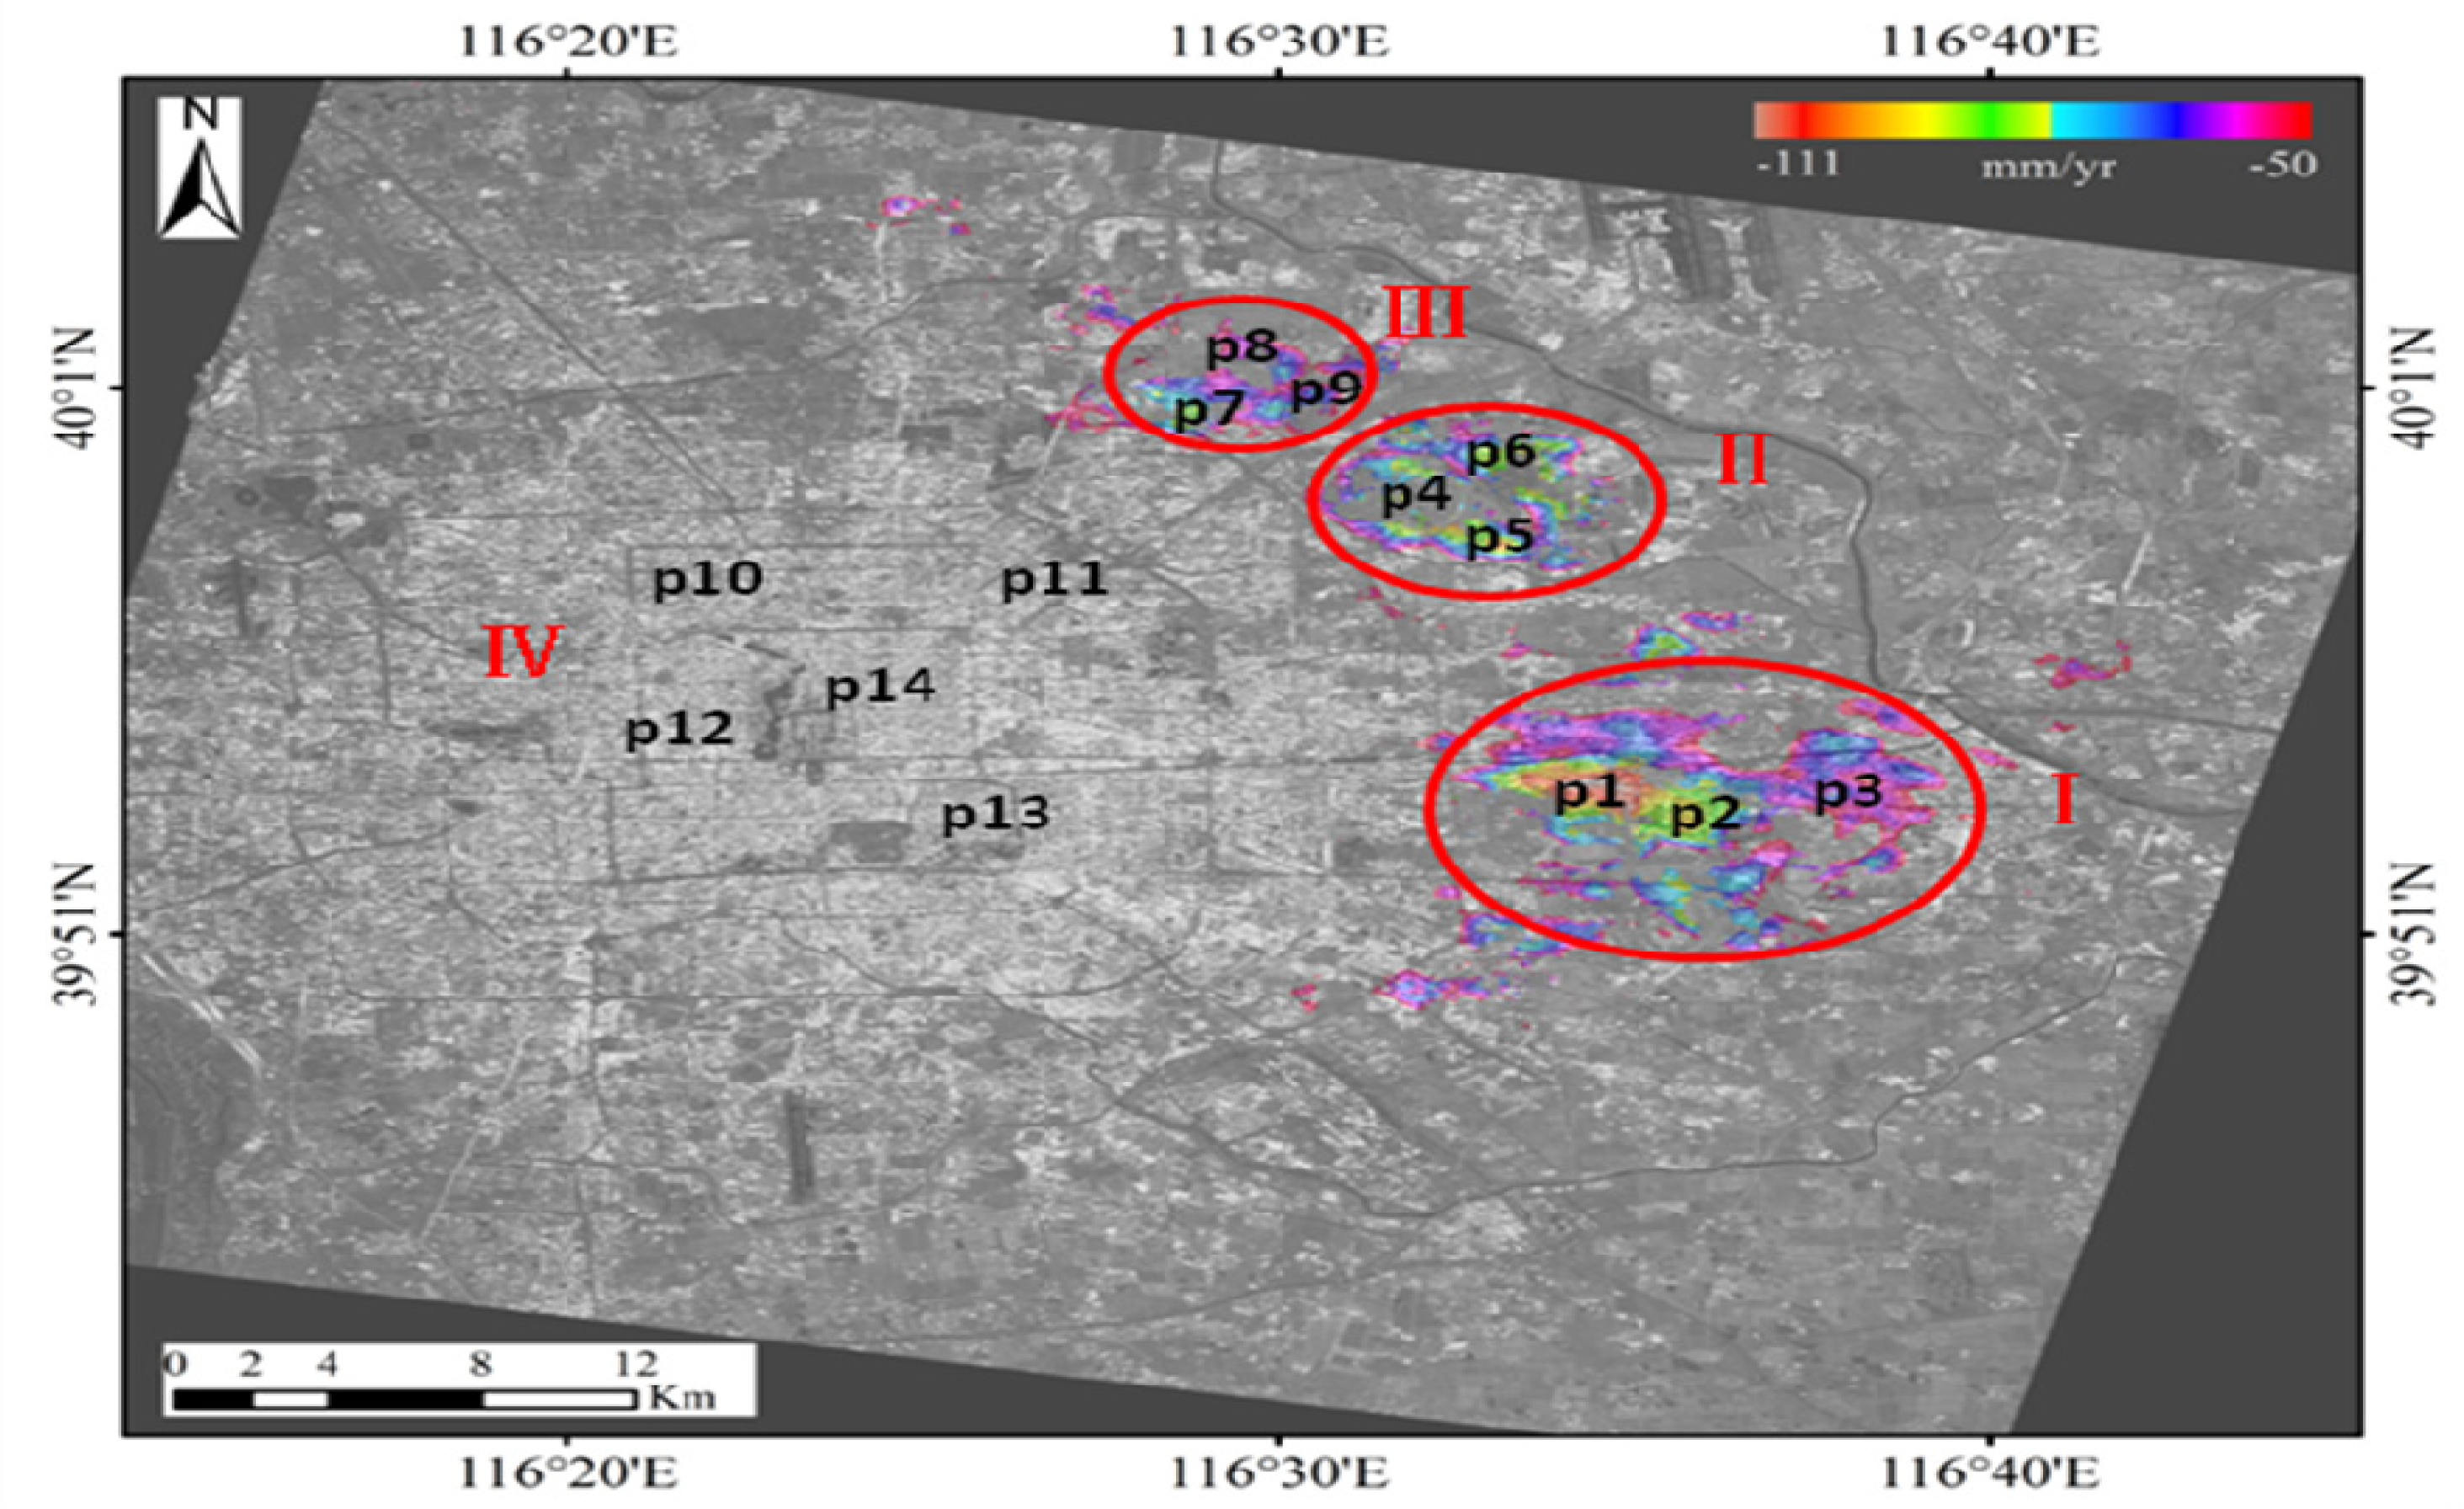
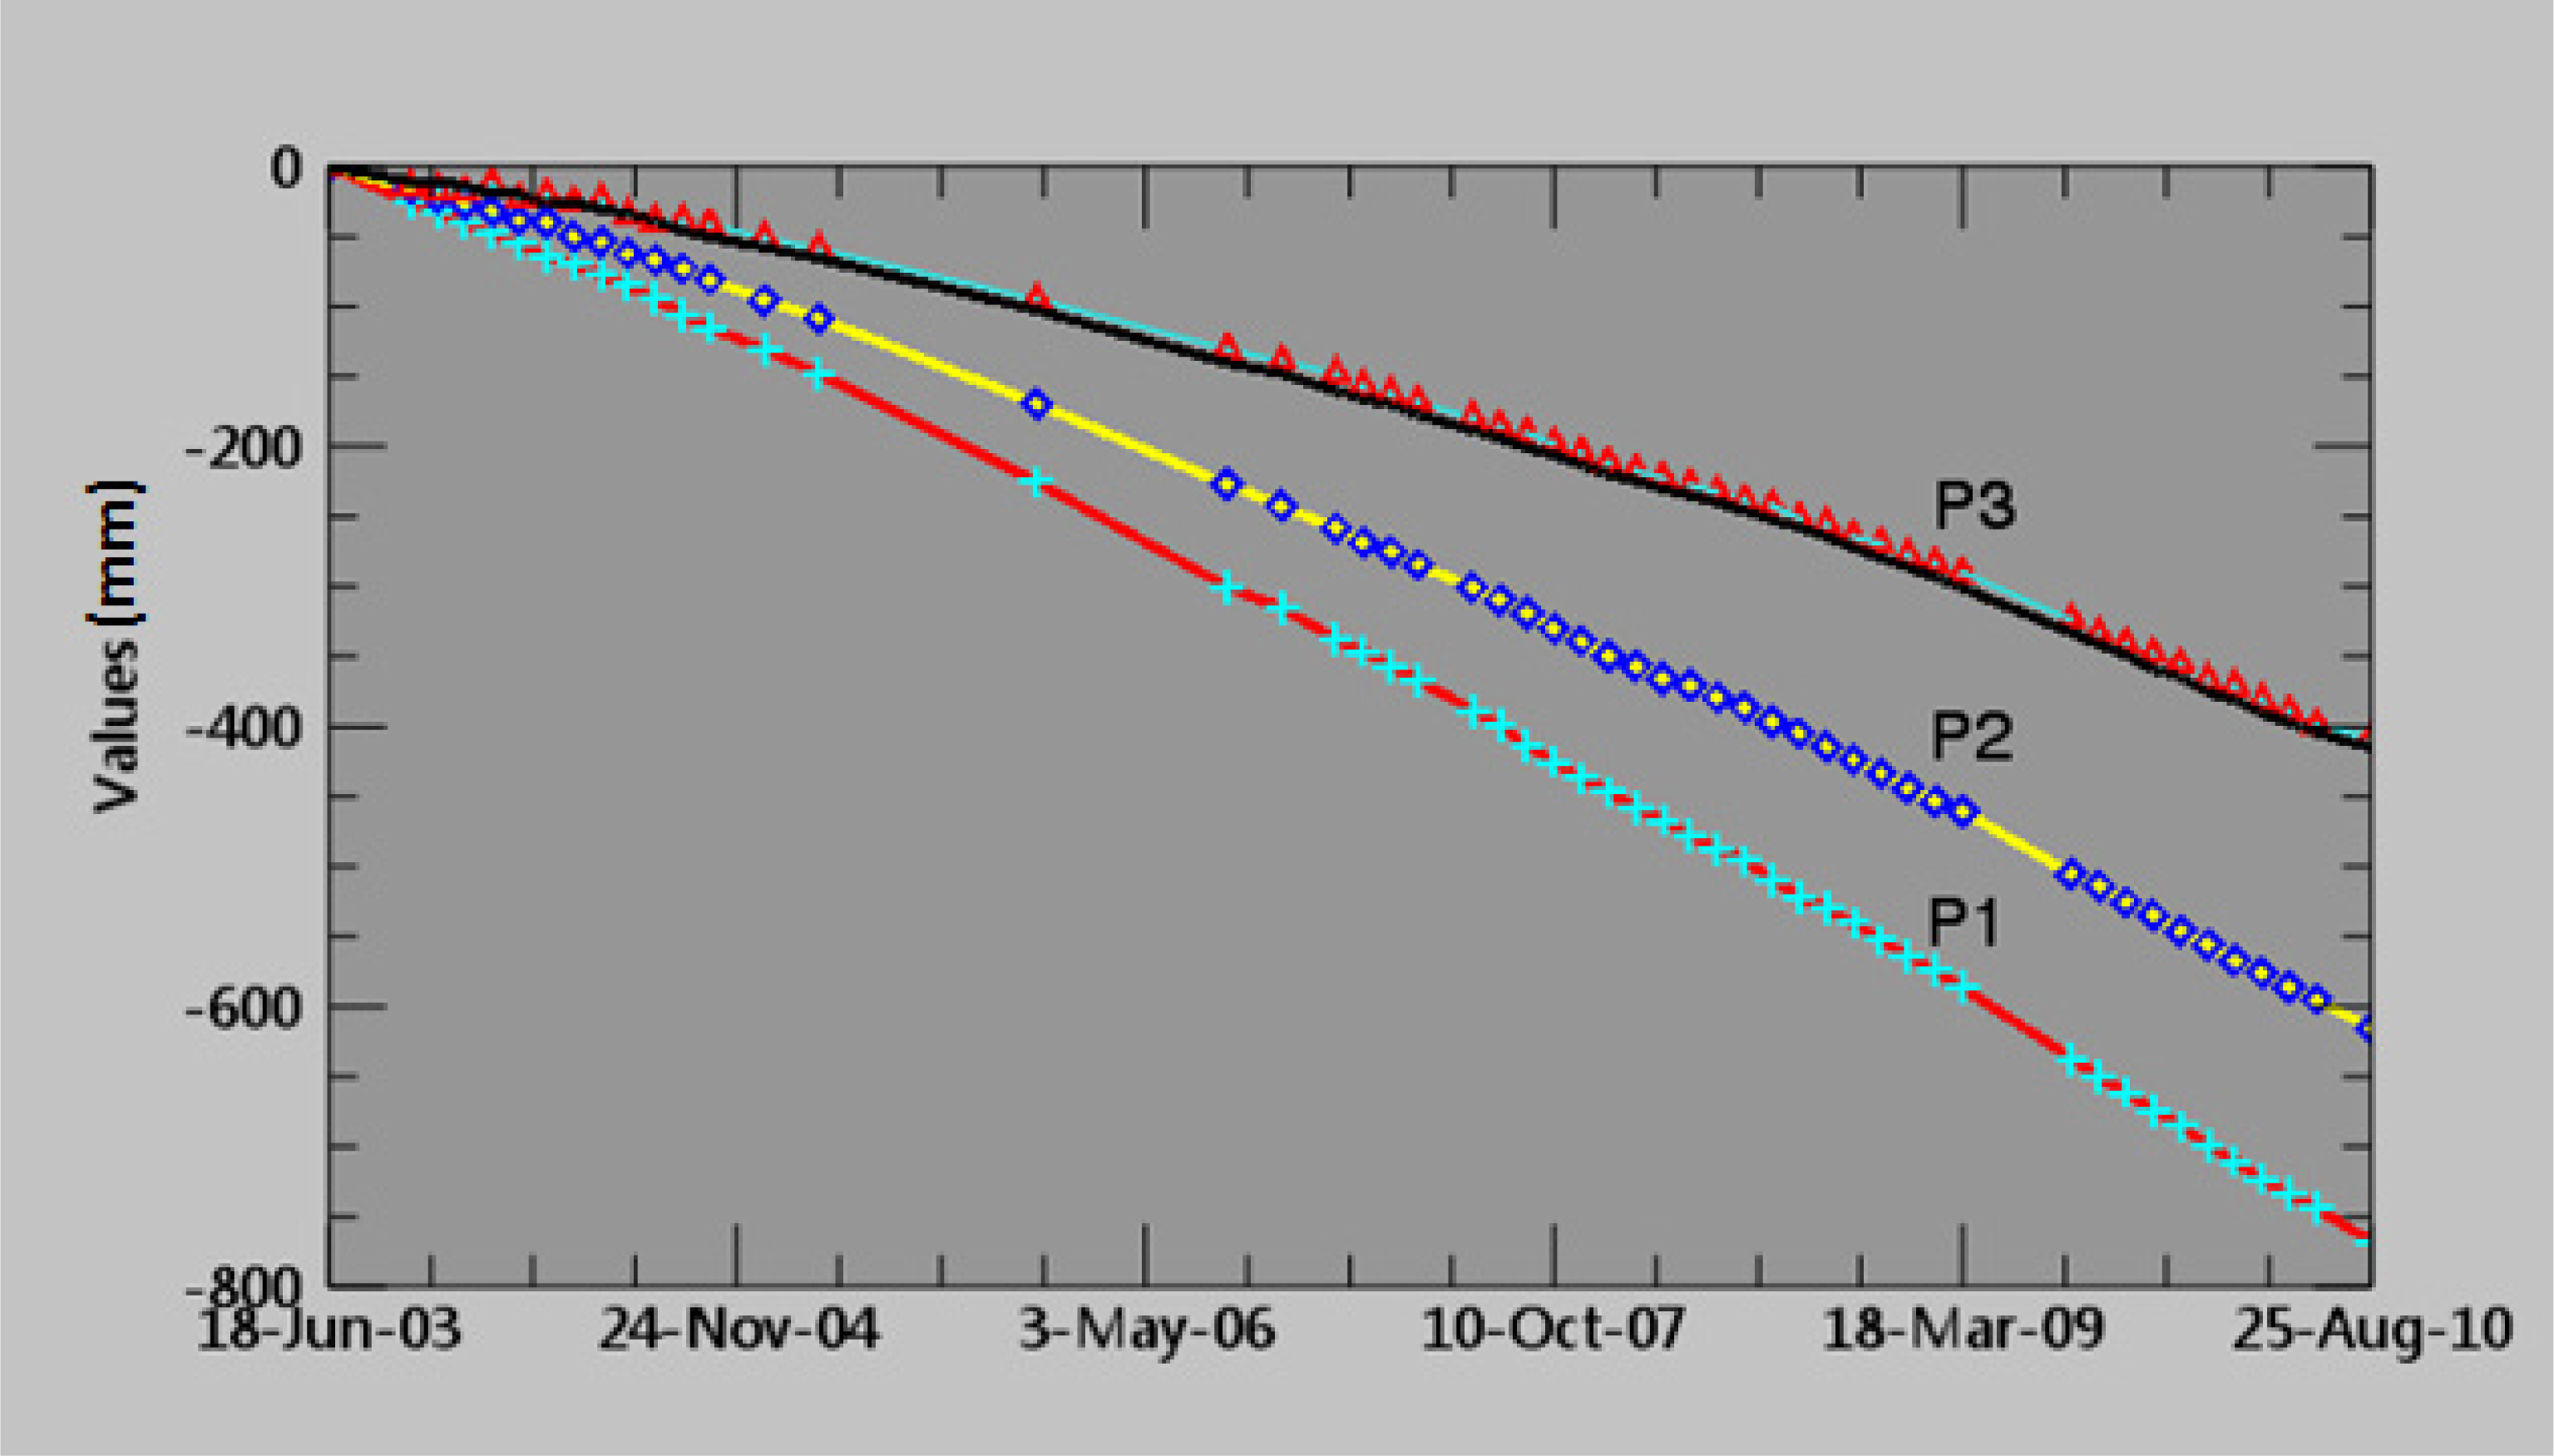
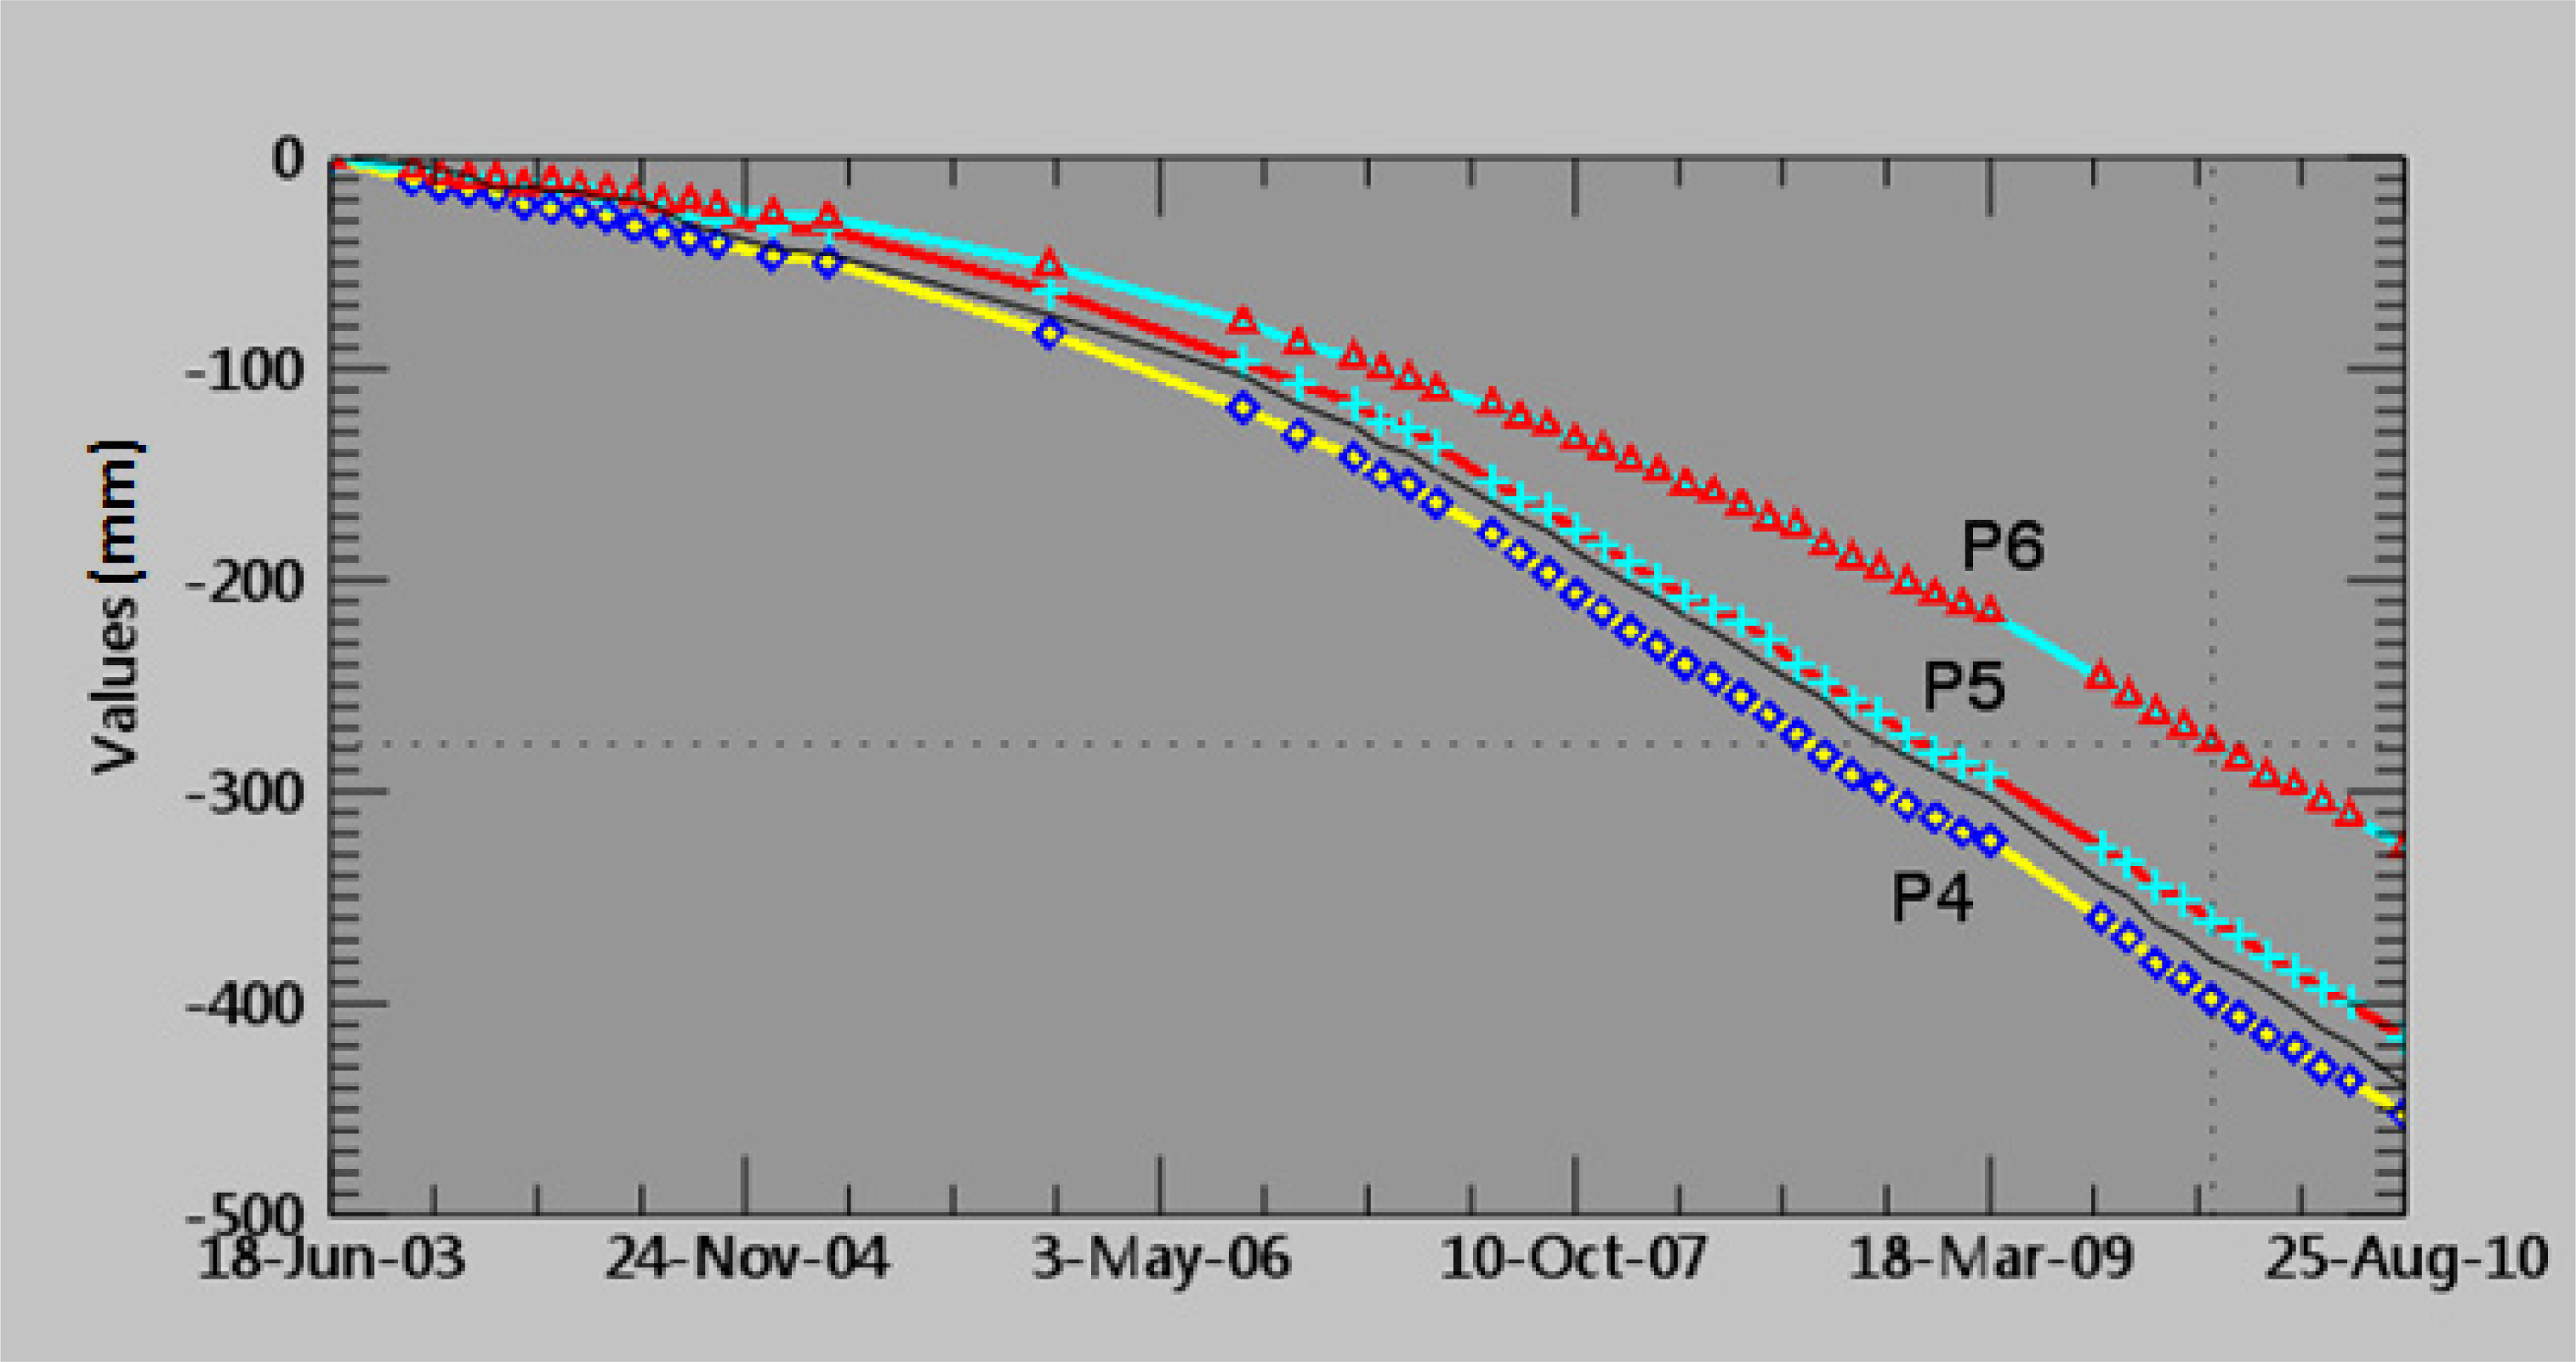
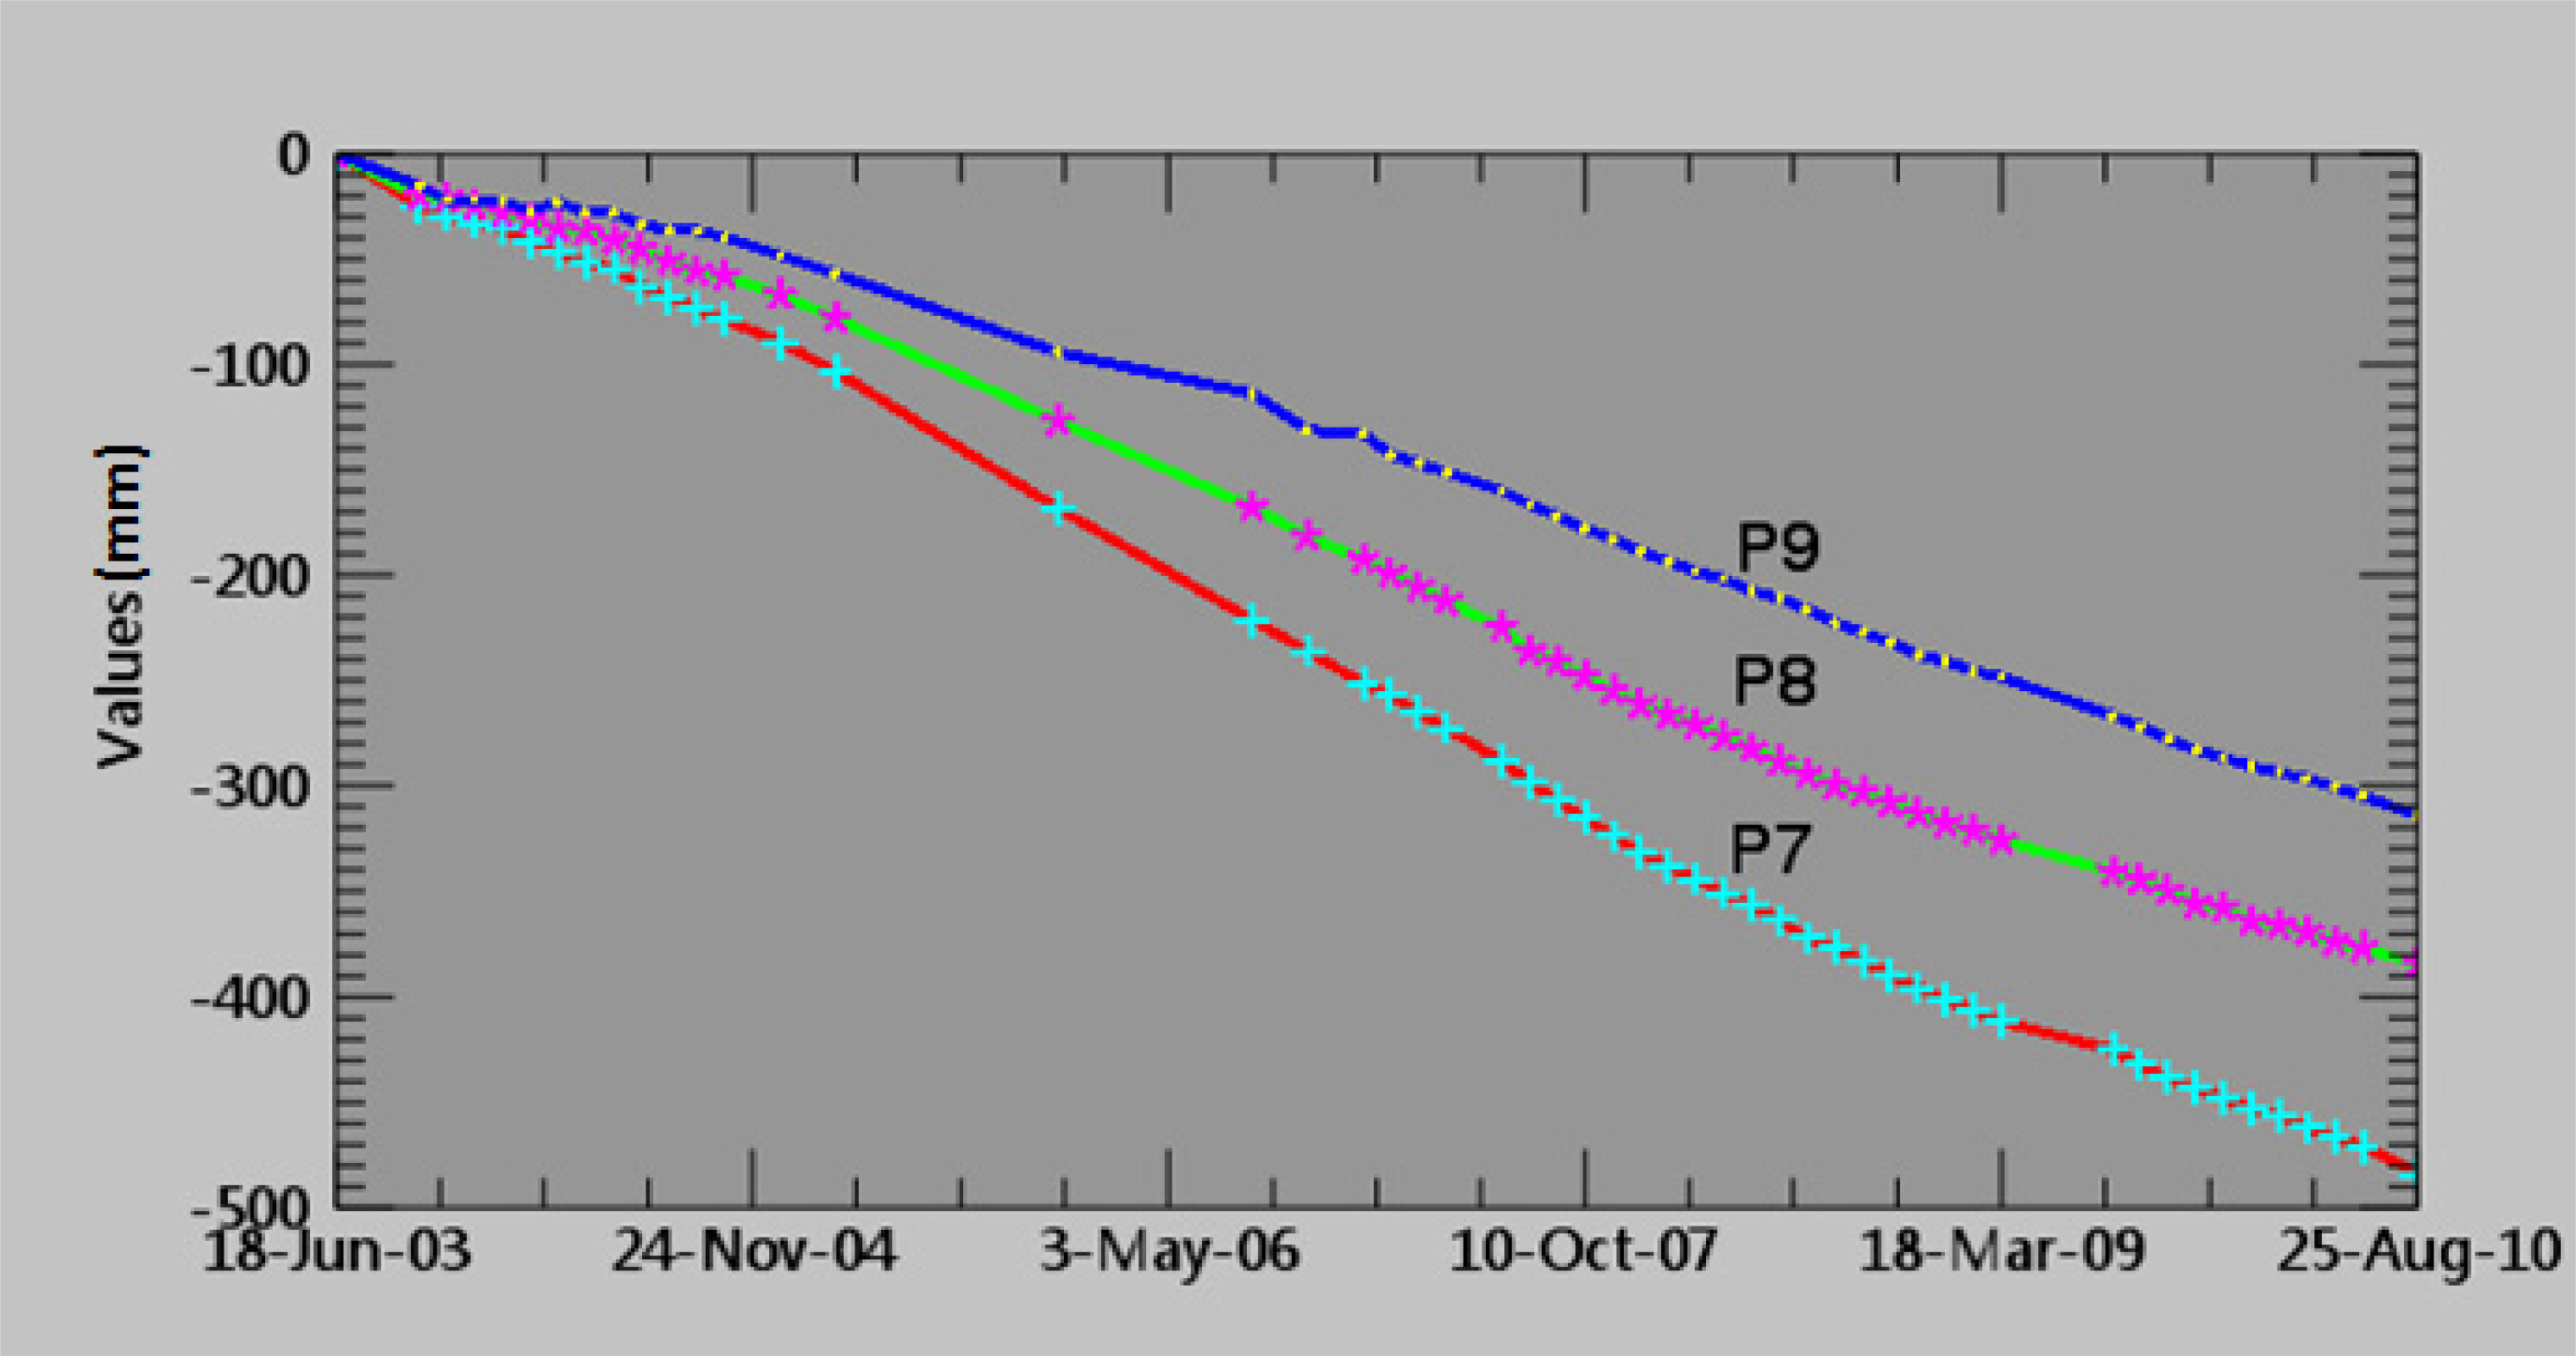
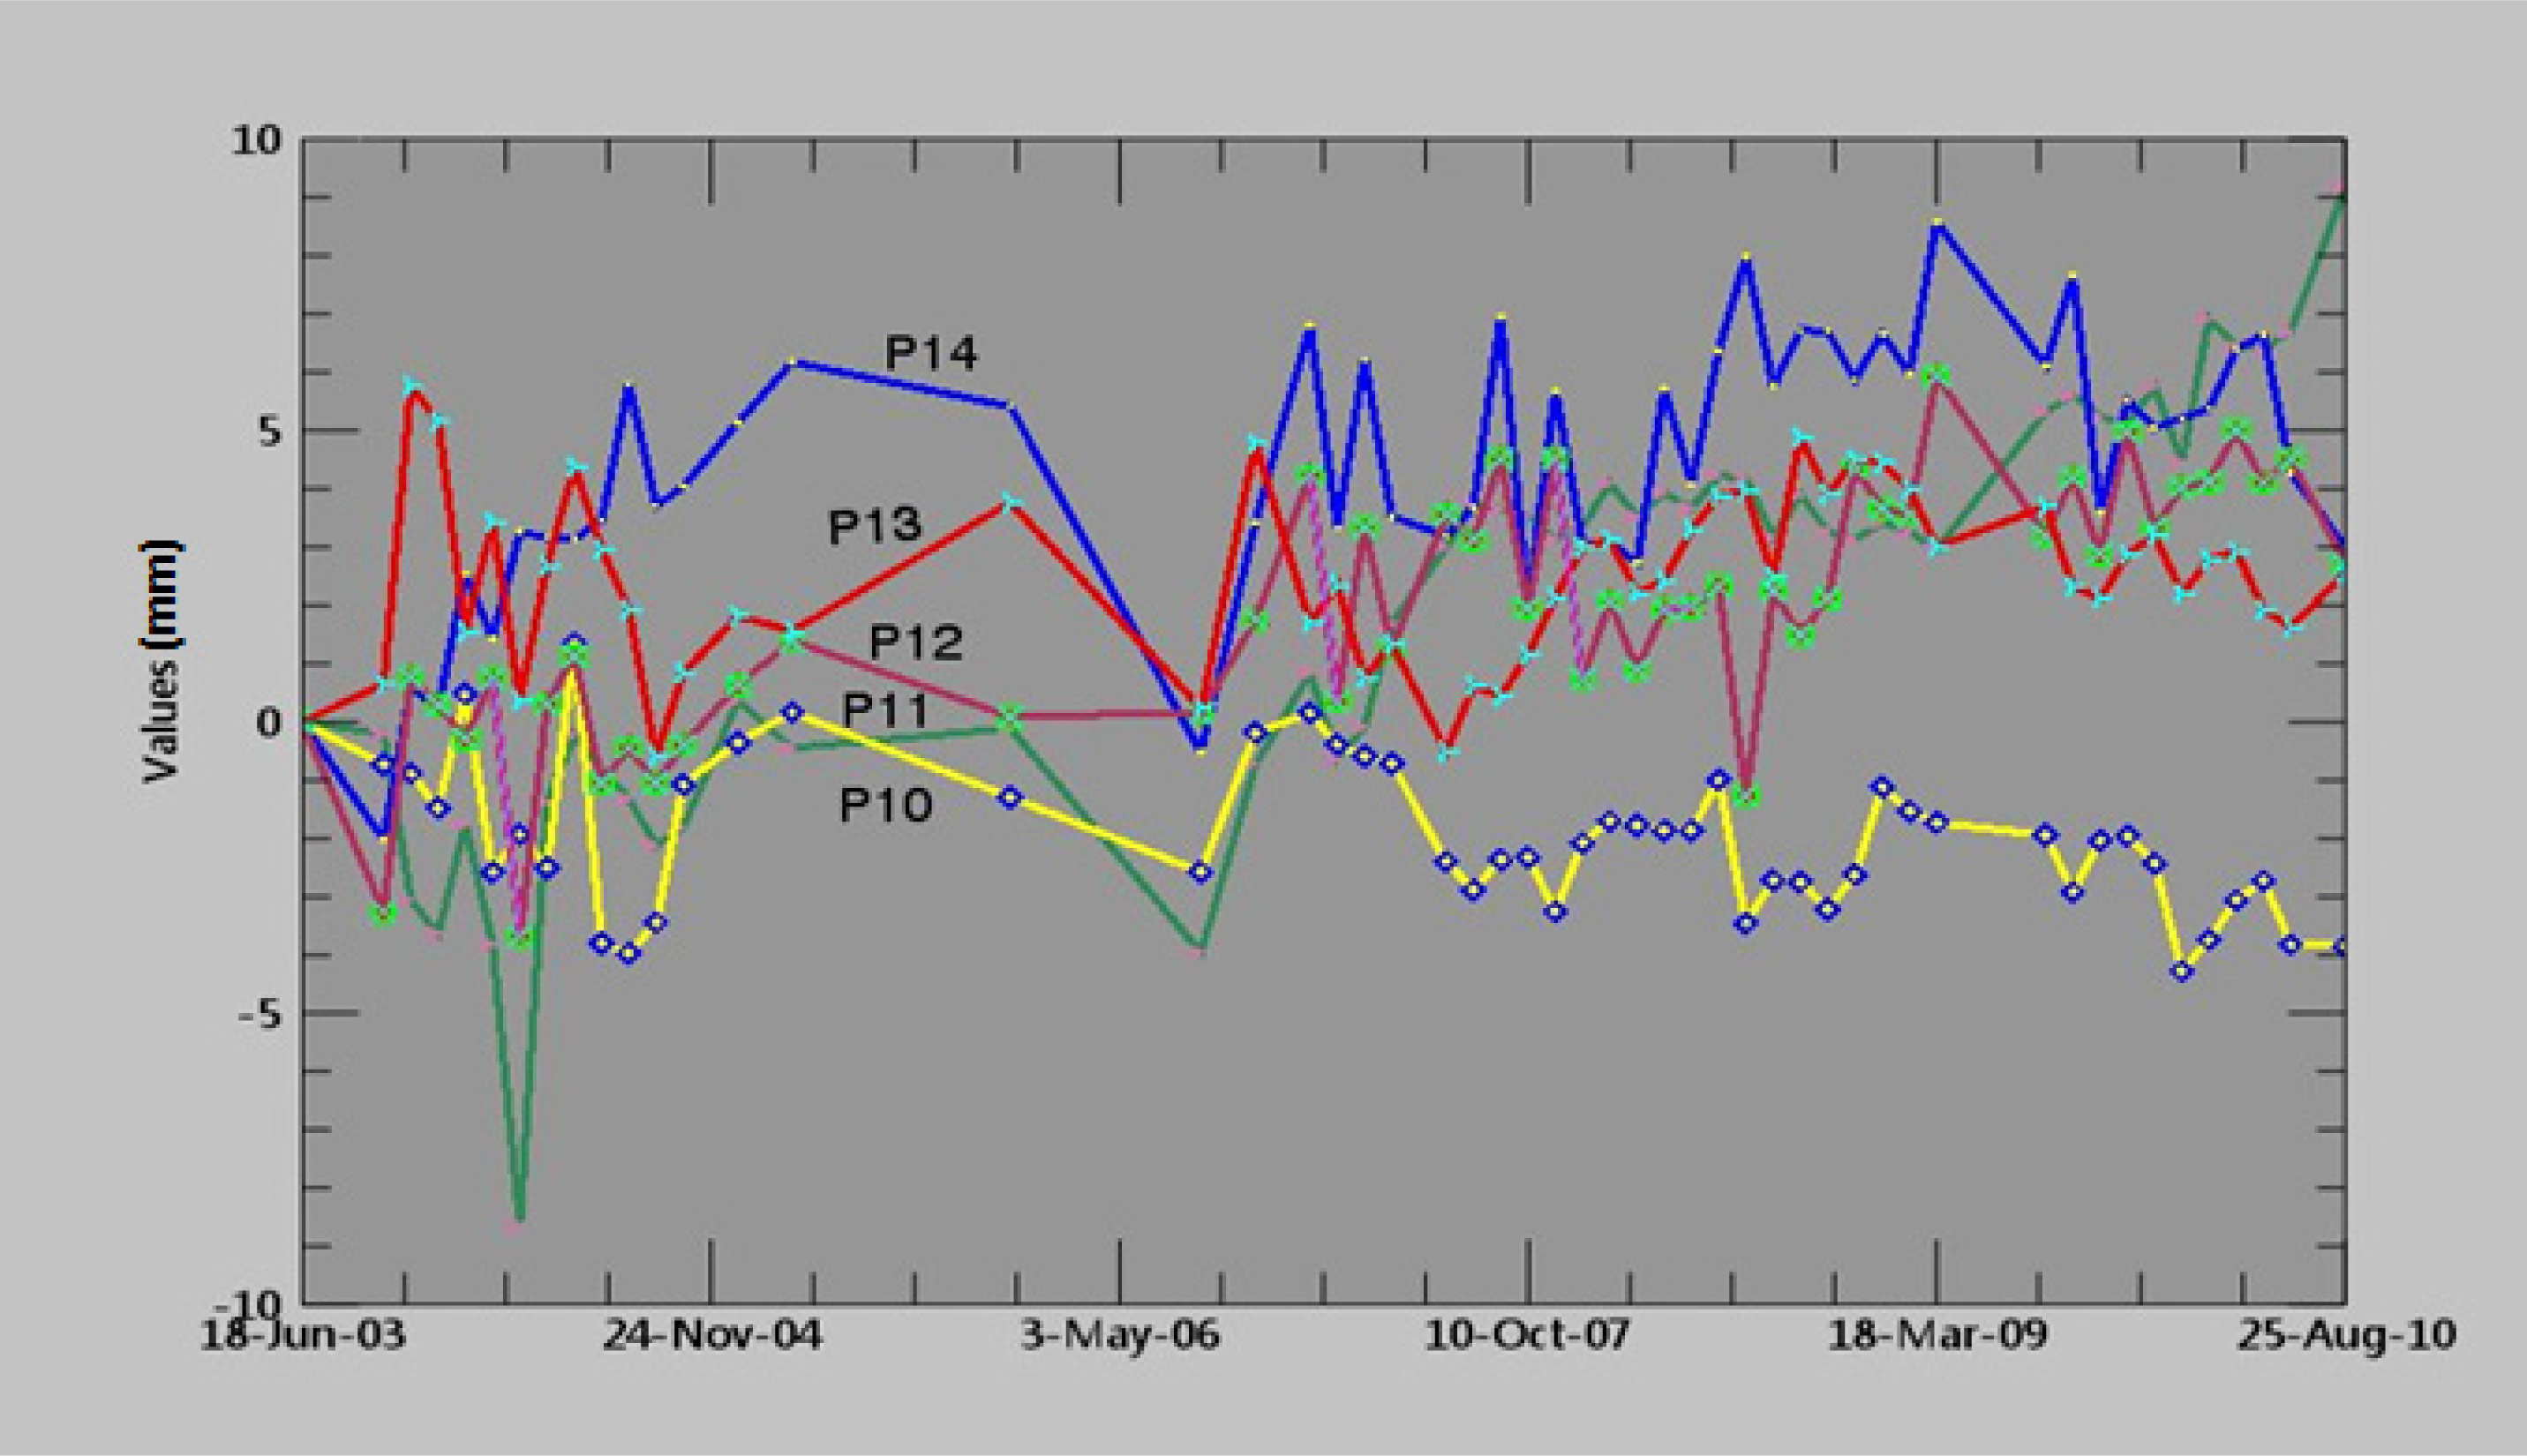
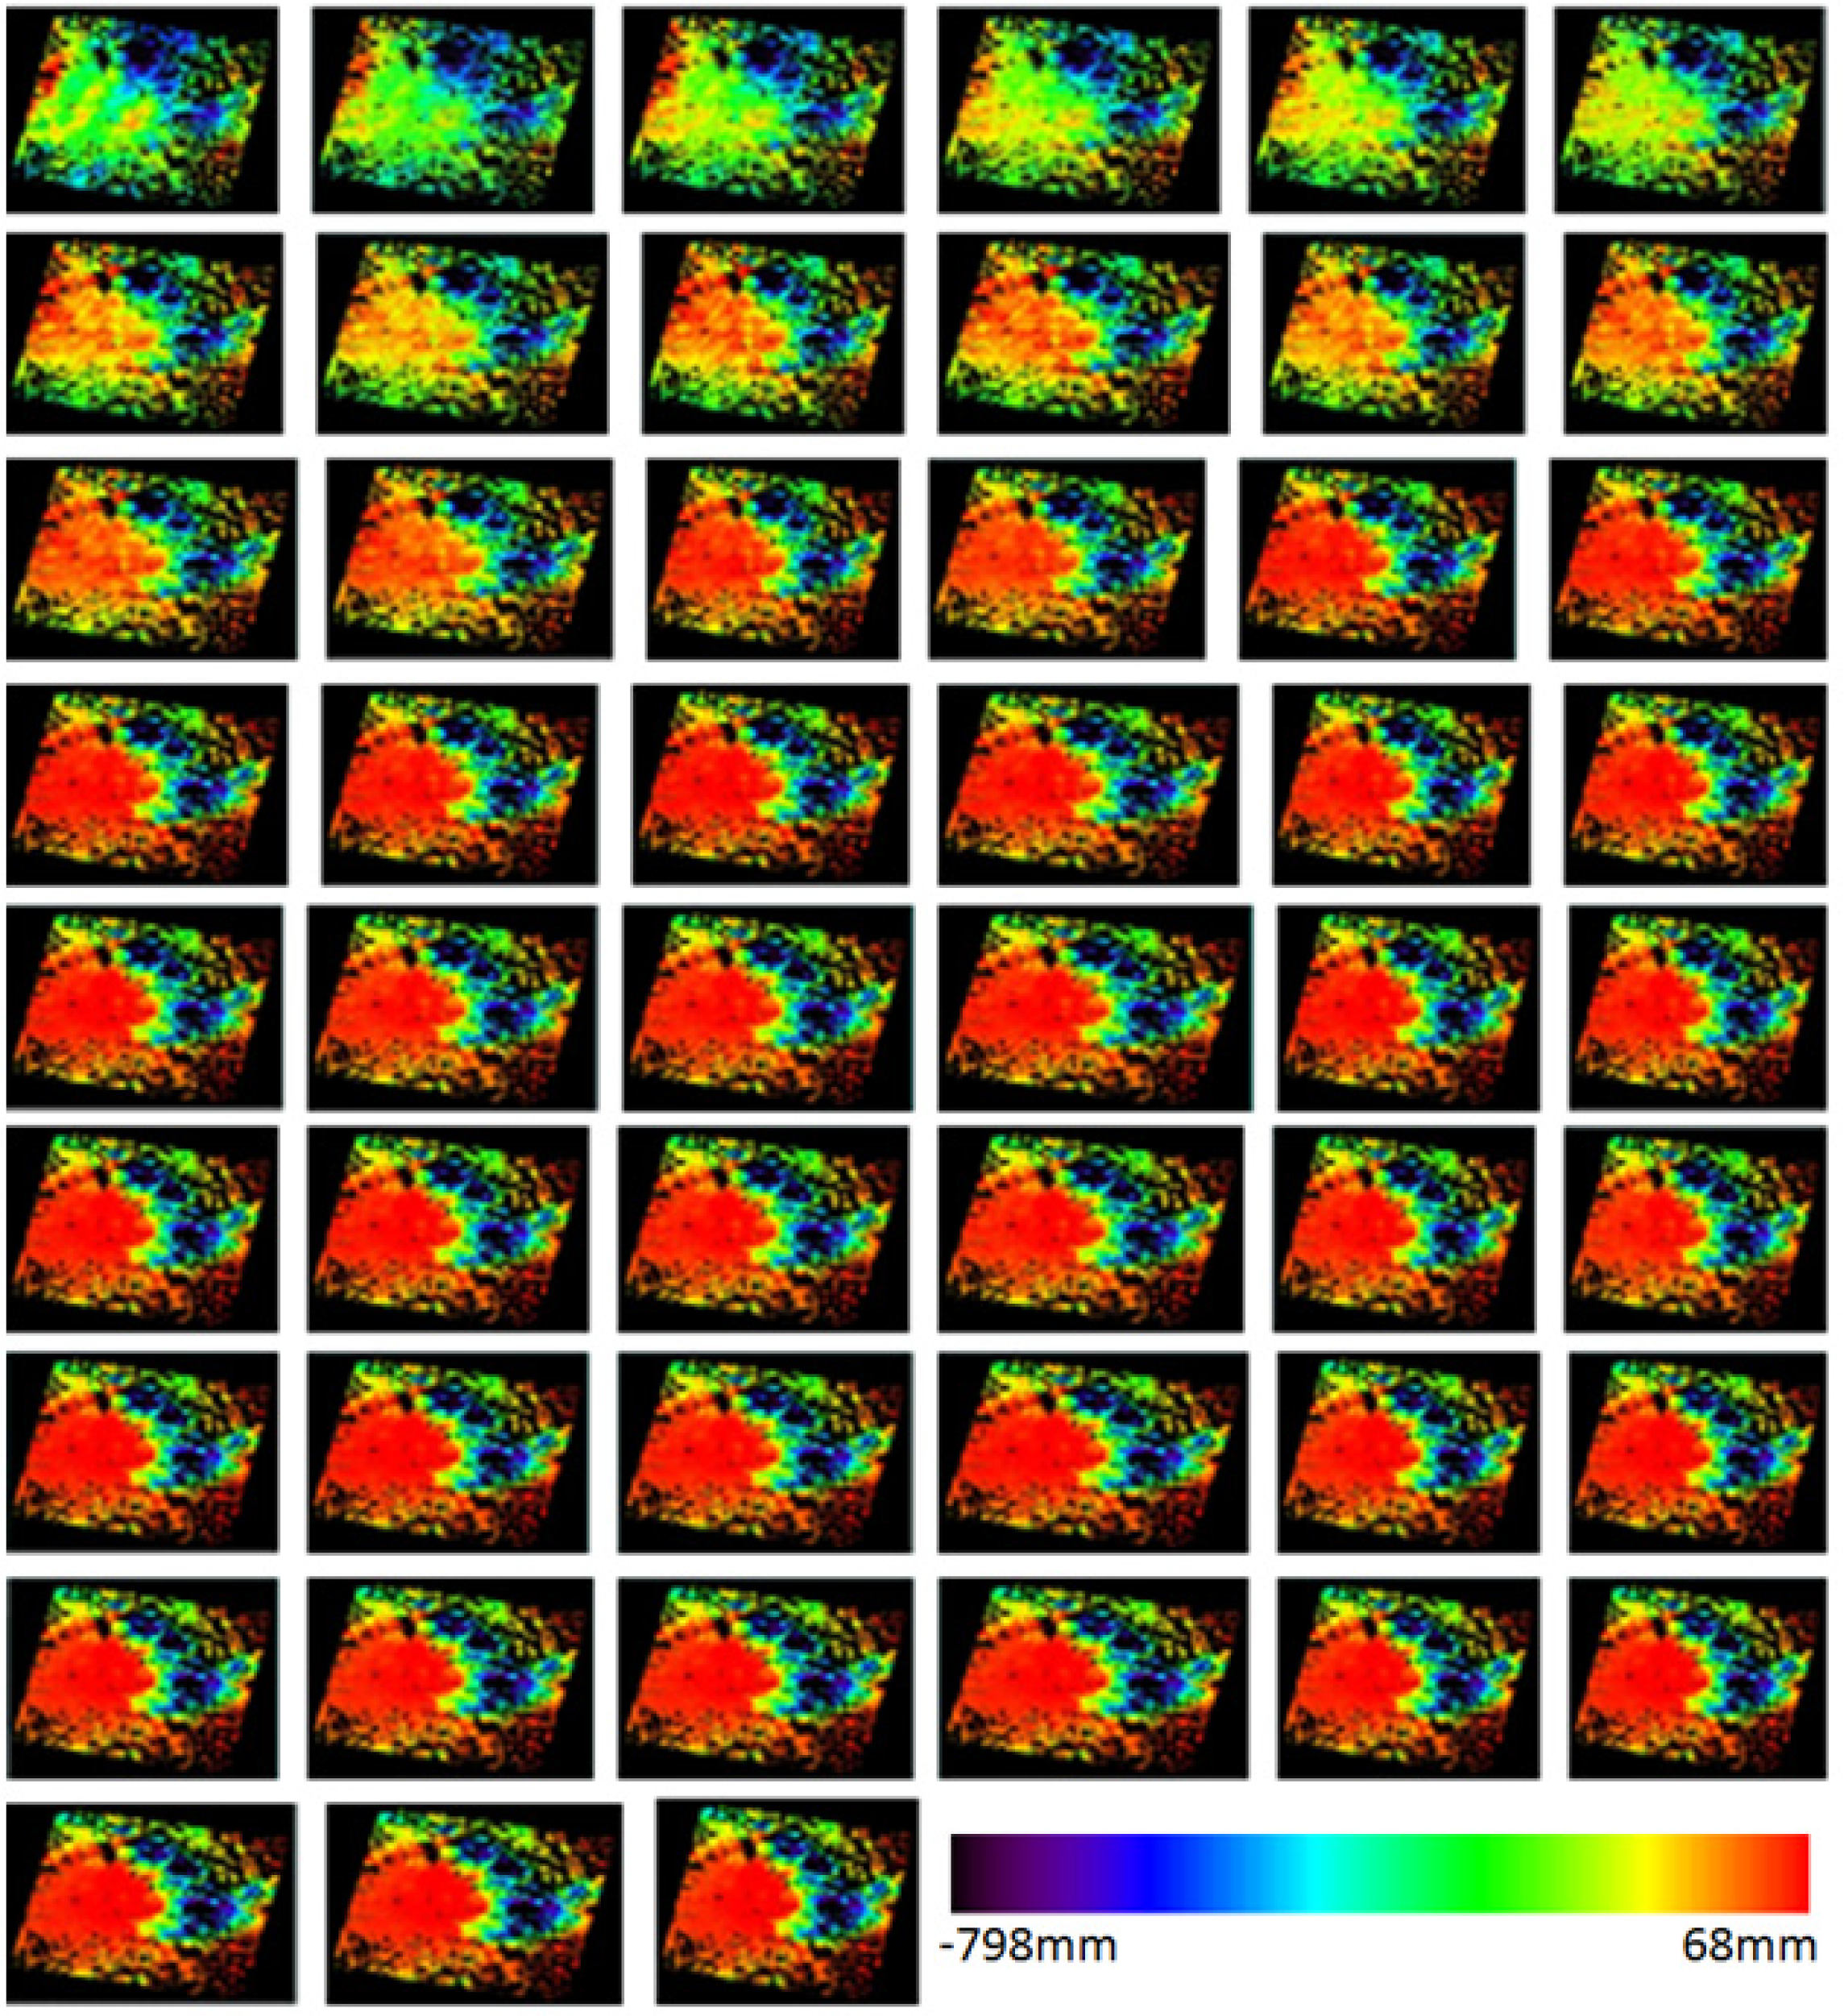
In addition, in order to intuitively analyze the subsidence of the funnel area, the annual subsidence velocity below 50 mm/y were masked (see Figure 4). It can be seen from the masked mean velocity map, the subsidence velocity of the most urban area is below 50 mm/y during the observation time (e.g., zone IV). In order to investigate the development of the underground water exploitation subsidence funnel, some feature points (e.g., P1, P2, P3, P4, P5, P6, P7, P8, P9, P10, P11, P12, P13 and P14) in the study area are selected for analyzing the time series deformation. Among them, P1, P2, P3 are the subsidence funnel zone I, P4, P5, P6 are the subsidence funnel zone II, P7, P8, P9 are the subsidence funnel zone III, P10, P11, P12, P13 and P14 are the zone IV (see Figure 4). Time series deformation estimated in points P1, P2, P3, P4, P5, P6, P7, P8, P9, P10, P11, P12, P13 and P14 are shown from Figures 5 and 8. Estimated accumulated displacement from June 2003 to August 2010 is shown in Figure 9.
It is clear that a subsidence funnel has been expanding in scale and aggravating in quantity for approximately seven years. The largest subsidence occurred in the center of the funnel with the value of more than 80 cm in the LOS direction. Besides, a moderate ground deformation is found outside the funnel. The monitoring results derived from SBAS are consistent with the history of land subsidence in Beijing. According to the field investigation, the three sedimentation funnel regions are all in or close to the underground water exploitation area [16]. Therefore, we can infer that these ground subsidence are mainly induced by the over-exploitation of ground water.
6. Discussion
6.1. Comparison with Leveling Measurements
In order to assess the SBAS-derived results in this study, we conducted a comparison of the SBAS mean deformation velocity with the leveling measurements. Although three leveling sites were provided by Beijing land subsidence monitoring stations [13], only two sites had more than two observations occur in the months when the SAR data were acquired. We first estimate the mean deformation rates for these sites in the radar line of the sight (LOS) direction based on the leveling measurements and then compare them with the deformation rates estimated with the SBAS method. The compared results are shown in Table 1. In order to provide a meaningful validation exercise, we provide the validation results in the form of a table by showing the result difference of the two points between the SBAS results and the leveling measurements.
Finally, for the two benchmarks, the mean values of the two validation parameters (average and standard deviation of the velocity difference) are μ = −1.6 mm/y and σ = 2.5 mm/y. These validation results are comparable with those in the most recent validation experiments available in the scientific literature [11,13], and demonstrate a reliable achievement in this study.
6.2. Comparison with the Groundwater Level
In this study, leveling measurements from only two discrete points were available for the comparison. Therefore, a comprehensive validation between leveling measurements and measurements from SBAS were not possible. In order to better validate the results, we further compared our results with the groundwater level. The groundwater depression cone was overlaid on the average displacement velocity map (see Figure 10). It can be seen that the detected three rapidly subsiding areas in Figure 3 in this study agree well with the location of the groundwater depression cones. It suggests that the deformation pattern observed in Beijing City is likely to be related to the drop in the groundwater level. In addition, the results in this study agree well with the results in Alex’s published study in 2012 [12]. The subsidence rate within the groundwater depression cone between June 2003 and August 2010 was over −110 mm/yr. The compared results show that the amplitude and positions of sedimentation funnel areas are very consistent.
7. Conclusions
In this paper, the ground subsidence induced from excessive groundwater withdrawal in Beijing was investigated with the SBAS technique utilizing the 52 ASAR data during the period from June 2003 to August 2010. The result in our paper reveals that the area of excessive groundwater withdrawal has experienced significant ground subsidence during the ASAR data acquisition period, whereby the maximum accumulation exceeds 800 mm. The SBAS results have been validated by leveling survey measurements with a mean difference of −1.6 mm/y and a standard deviation of 2.5 mm/y, demonstrating that an elaborate SBAS technique can effectively monitor and detect the complicated settlements in the investigated area.
For monitoring ground deformation in the future in Beijing, there are several possible options to improve our understanding of the spatial-temporal varieties of ground settlements. One is to use high resolution SAR data, e.g., those acquired by TerraSAR, Cosmo-SkyMed and Radarsat-2. Another option is to use the ALOS/PALSAR L-band data characterized by a radar long-wavelength.
Acknowledgments
This work was supported by the National Natural Science Foundation of China (Grant No. 41204012, 41021003, 41274026, 41174016, 41274024 and 51209019), National Key Basic Research Program of China (973 Program, grant No. 2012CB957703), CAS/SAFEA International Partnership Program for Creative Research Teams (Grant No. KZZD-EW-TZ-05), Opening Fund of SKLGED Laboratory (SKLGED2013-7-1-Z, SKLGED2013-7-2-Z and SKLGED2013-7-3-Z), Funded by CRSRI Open Research Program (CKWV2013211/KY) and Hunan Province Key Laboratory of Coal Resources Clean-utilization and Mine Environment Protection (E21419). Finally, we wish to acknowledge the helpful comments of the reviewers and editor.
Author Contributions
Bo Hu formulated the project and wrote the paper. Han-Sheng Wang and Yong-Ling Sun participated in the analysis of the results, and polished the manuscript. Jian-Guo Hou and Jun Liang contributed to the post-processing of the InSAR data. All authors read the manuscript and discussed the results.
Conflicts of Interest
The authors declare no conflict of interest.
References
- Hu, B.; Wang, H.-S.; Jiang, L.-M. Monitoring of the reclamation-induced ground subsidence in Macao (China) using the PSInSAR technique. J. Cent. South. Univ 2013, 20, 1039–1046. [Google Scholar]
- Hole, J.; Bromley, C.; Stevens, N.; Wadge, G. Subsidence in the geothermal fields of the Taupo Volcanic Zone, New Zealand from 1996 to 2005 measured by InSAR. J. Volcanol. Geotherm. Res 2007, 166, 125–146. [Google Scholar]
- Bo, H.; Wang, H.; Jiang, L.; Shen, Q. Measuring two-dimensional deformation using a single InSAR pair. Adv. Inf. Sci. Serv 2012, 4, 243–249. [Google Scholar]
- Yan, Y.; Doin, M.P.; Lopez-Quiroz, P.; Tupin, F.; Fruneau, B.; Pinel, V.; Trouve, E. Mexico city subsidence measured by InSAR time series: Joint analysis using PS and SBAS approaches. IEEE J. Sel. Top. Appl. Earth Obs. Remote Sens 2012, 5, 1312–1326. [Google Scholar]
- Zhang, L.; Ding, X.; Lu, Z. Ground settlement monitoring based on temporarily coherent points between two SAR acquisitions. ISPRS J. Photogramm. Remote Sens 2011, 66, 146–152. [Google Scholar]
- Berardino, P.; Fornaro, G.; Lanari, R.; Sansosti, E. A new algorithm for surface deformation monitoring based on small baseline differential SAR interferograms. IEEE Trans. Geosci. Remote Sens 2002, 40, 2375–2383. [Google Scholar]
- Usai, S. A least squares database approach for SAR interferometric data. IEEE Trans. Geosci. Remote Sens 2003, 41, 753–760. [Google Scholar]
- Lanari, R.; Mora, O.; Manunta, M.; Mallorqui, J.J.; Berardino, P.; Sansosti, E. A small-baseline approach for investigating deformations on full-resolution differential SAR interferograms. IEEE Trans. Geosci. Remote Sens 2004, 42, 1377–1386. [Google Scholar]
- Lanari, R.; Lundgren, P.; Manzo, M.; Casu, F. Satellite radar interferometry time series analysis of surface deformation for Los Angeles, California. Geophys. Res. Lett 2004, 31, 1–5. [Google Scholar]
- Dong, S.C.; Samsonov, S.; Yin, H.W.; Yin, S.J.; Cao, Y.R. Time-series analysis of subsidence associated with rapid urbanization in Shanghai, China measured with SBAS InSAR method. Environ. Earth Sci 2013, 10, 1083–1091. [Google Scholar]
- Beijing Troubled by Severe Water Shortage. Available online: http://www.bjd.com.cn/beijingnews/200912/t20091222_552289.htm (accessed on 7 May 2010).
- Hay-Man Ng, A.; Ge, L.; Li, X.; Zhang, K. Monitoring ground deformation in Beijing, China with persistent scatterer SAR interferometry. J. Geod 2012, 86, 375–392. [Google Scholar]
- Liu, M.; Jia, S.; Chu, H. The monitoring system and technologies of land subsidence in Beijing. Geol. Resour 2012, 21, 244–249. (In Chinese). [Google Scholar]
- Yang, Y.; Jia, S.; Luo, Y.; Jiang, Y. Analysis and outlook of the land subsidence in Beijing. Geol. Resour 2012, 7, 20–26. (In Chinese). [Google Scholar]
- Zhao, H.L.; Fang, J.; Guo, X.; Cheng, J.; Xia, Y.; Ge, D.; Zhang, L.; Qiu, Y.; Chang, Z. Detection of Land Subsidence in Beijing, China, Using Interferometric Point Target Analysis Technique. Proceedings of 2010 IEEE International Geoscience and Remote Sensing Symposium (IGARSS), Hawaii, HI, USA, 25–30 July 2010; pp. 1028–1037.
- Jia, S.; Wang, H.; Luo, Y.; Yang, Y.; Wang, R. The impacts of land subsidence on city build of Beijing. Urban Geol 2006, 1, 38–45. (In Chinese). [Google Scholar]
- Jia, S.; Wang, H.; Liu, Y.; Yang, Y.; Wang, R. The impacts of ground subsidence on urban construction in Beijing. Geol. Disaster 2007, 2, 20–26. (In Chinese). [Google Scholar]
- Sun, C. Analyses of ground settling in the eastern suburbs of Beijing. Geotech. Eng. Field 2005, 5, 11–20. (In Chinese). [Google Scholar]
- Mora, O.; Mallorqui, J.J.; Broquetas, A. Linear and nonlinear terrain deformation maps from a reduced set of interferometric SAR images. IEEE Trans. Geosci. Remote Sens 2003, 41, 2243–2253. [Google Scholar]
- Colesanti, C. Monitoring landslides and tectonic motions with the Permanent Scatterers Technique. Eng. Geol 2003, 68, 3–14. [Google Scholar]
- Shallow Groundwater Depression Cone Distribution Map of North China Plain. Available online: http://old.cgs.gov.cn/NEWS/Geology%20News/2005/20050826/ (accessed on 7 May 2010).


| Site Name | Long. | Lat. | Mean Rate (mm/y) a | LOS Mean Rate (mm/y) b | SBAS LOS Rate (mm/y) | Difference (mm/y) | Starting Date | Ending Date |
|---|---|---|---|---|---|---|---|---|
| Wangjing | 39.9833 | 116.4667 | −29.940 | −27.545 | −27.690 | 0.145 | 2009/09 | 2010/10 |
| Tianzhu | 40.0667 | 116.5883 | −32.910 | −30.277 | −26.900 | −3.377 | 2010/01 | 2010/10 |
Note:aThe mean rates of ground sites were determined according to the measurements performed in the period having SAR data.bThe mean rates of ground sites were projected to LOS direction by a factor of 0.92.
© 2014 by the authors; licensee MDPI, Basel, Switzerland This article is an open access article distributed under the terms and conditions of the Creative Commons Attribution license (http://creativecommons.org/licenses/by/3.0/).
Share and Cite
Hu, B.; Wang, H.-S.; Sun, Y.-L.; Hou, J.-G.; Liang, J. Long-Term Land Subsidence Monitoring of Beijing (China) Using the Small Baseline Subset (SBAS) Technique. Remote Sens. 2014, 6, 3648-3661. https://doi.org/10.3390/rs6053648
Hu B, Wang H-S, Sun Y-L, Hou J-G, Liang J. Long-Term Land Subsidence Monitoring of Beijing (China) Using the Small Baseline Subset (SBAS) Technique. Remote Sensing. 2014; 6(5):3648-3661. https://doi.org/10.3390/rs6053648
Chicago/Turabian StyleHu, Bo, Han-Sheng Wang, Yong-Ling Sun, Jian-Guo Hou, and Jun Liang. 2014. "Long-Term Land Subsidence Monitoring of Beijing (China) Using the Small Baseline Subset (SBAS) Technique" Remote Sensing 6, no. 5: 3648-3661. https://doi.org/10.3390/rs6053648