Estimation of Reservoir Discharges from Lake Nasser and Roseires Reservoir in the Nile Basin Using Satellite Altimetry and Imagery Data

Abstract
: This paper presents the feasibility of estimating discharges from Roseires Reservoir (Sudan) for the period from 2002 to 2010 and Aswan High Dam/Lake Nasser (Egypt) for the periods 1999–2002 and 2005–2009 using satellite altimetry and imagery with limited in situ data. Discharges were computed using the water balance of the reservoirs. Rainfall and evaporation data were obtained from public domain data sources. In situ measurements of inflow and outflow (for validation) were obtained, as well. The other water balance components, such as the water level and surface area, for derivation of the change of storage volume were derived from satellite measurements. Water levels were obtained from Hydroweb for Roseires Reservoir and Hydroweb and Global Reservoir and Lake Monitor (GRLM) for Lake Nasser. Water surface areas were derived from Landsat TM/ETM+ images using the Normalized Difference Water Index (NDWI). The water volume variations were estimated by integrating the area-level relationship of each reservoir. For Roseires Reservoir, the water levels from Hydroweb agreed well with in situ water levels (RMSE = 0.92 m; R2 = 0.96). Good agreement with in situ measurements were also obtained for estimated water volume (RMSE = 23%; R2 = 0.94) and computed discharge (RMSE = 18%; R2 = 0.98). The accuracy of the computed discharge was considered acceptable for typical reservoir operation applications. For Lake Nasser, the altimetry water levels also agreed well with in situ levels, both for Hydroweb (RMSE = 0.72 m; R2 = 0.81) and GRLM (RMSE = 0.62 m; R2 = 0.96) data. Similar agreements were also observed for the estimated water volumes (RMSE = 10%–15%). However, the estimated discharge from satellite data agreed poorly with observed discharge, Hydroweb (RMSE = 70%; R2 = 0.09) and GRLM (RMSE = 139%; R2 = 0.36). The error could be attributed to the high sensitivity of discharge to errors in storage volume because of the immense reservoir compared to inflow/outflow series. It may also be related to unaccounted spills into the Toshka Depression, overestimation of water inflow and errors in open water evaporation. Therefore, altimetry water levels and satellite imagery data can be used as a source of information for monitoring the operation of Roseires Reservoir with a fairly low uncertainty, while the errors of Lake Nasser are too large to allow for the monitoring of its operation.
1. Introduction
Hydrological data are key information for water resources management. However, such data are frequently not readily available, particularly in transboundary river basins, either because of not being measured or limited accessibility to the data by the riparian states. Information of river flow, reservoir storage and water use in a given riparian country is obviously of high importance for the whole basin. Such data is often not fully shared, particularly in water-scarce basins, e.g., the Nile, Indus, Tigris and Euphrates river basins [1]. The decline of hydrological networks in the world, particularly in developing countries, adds to the challenges of having accurate and representative hydrological data in river basins [2].
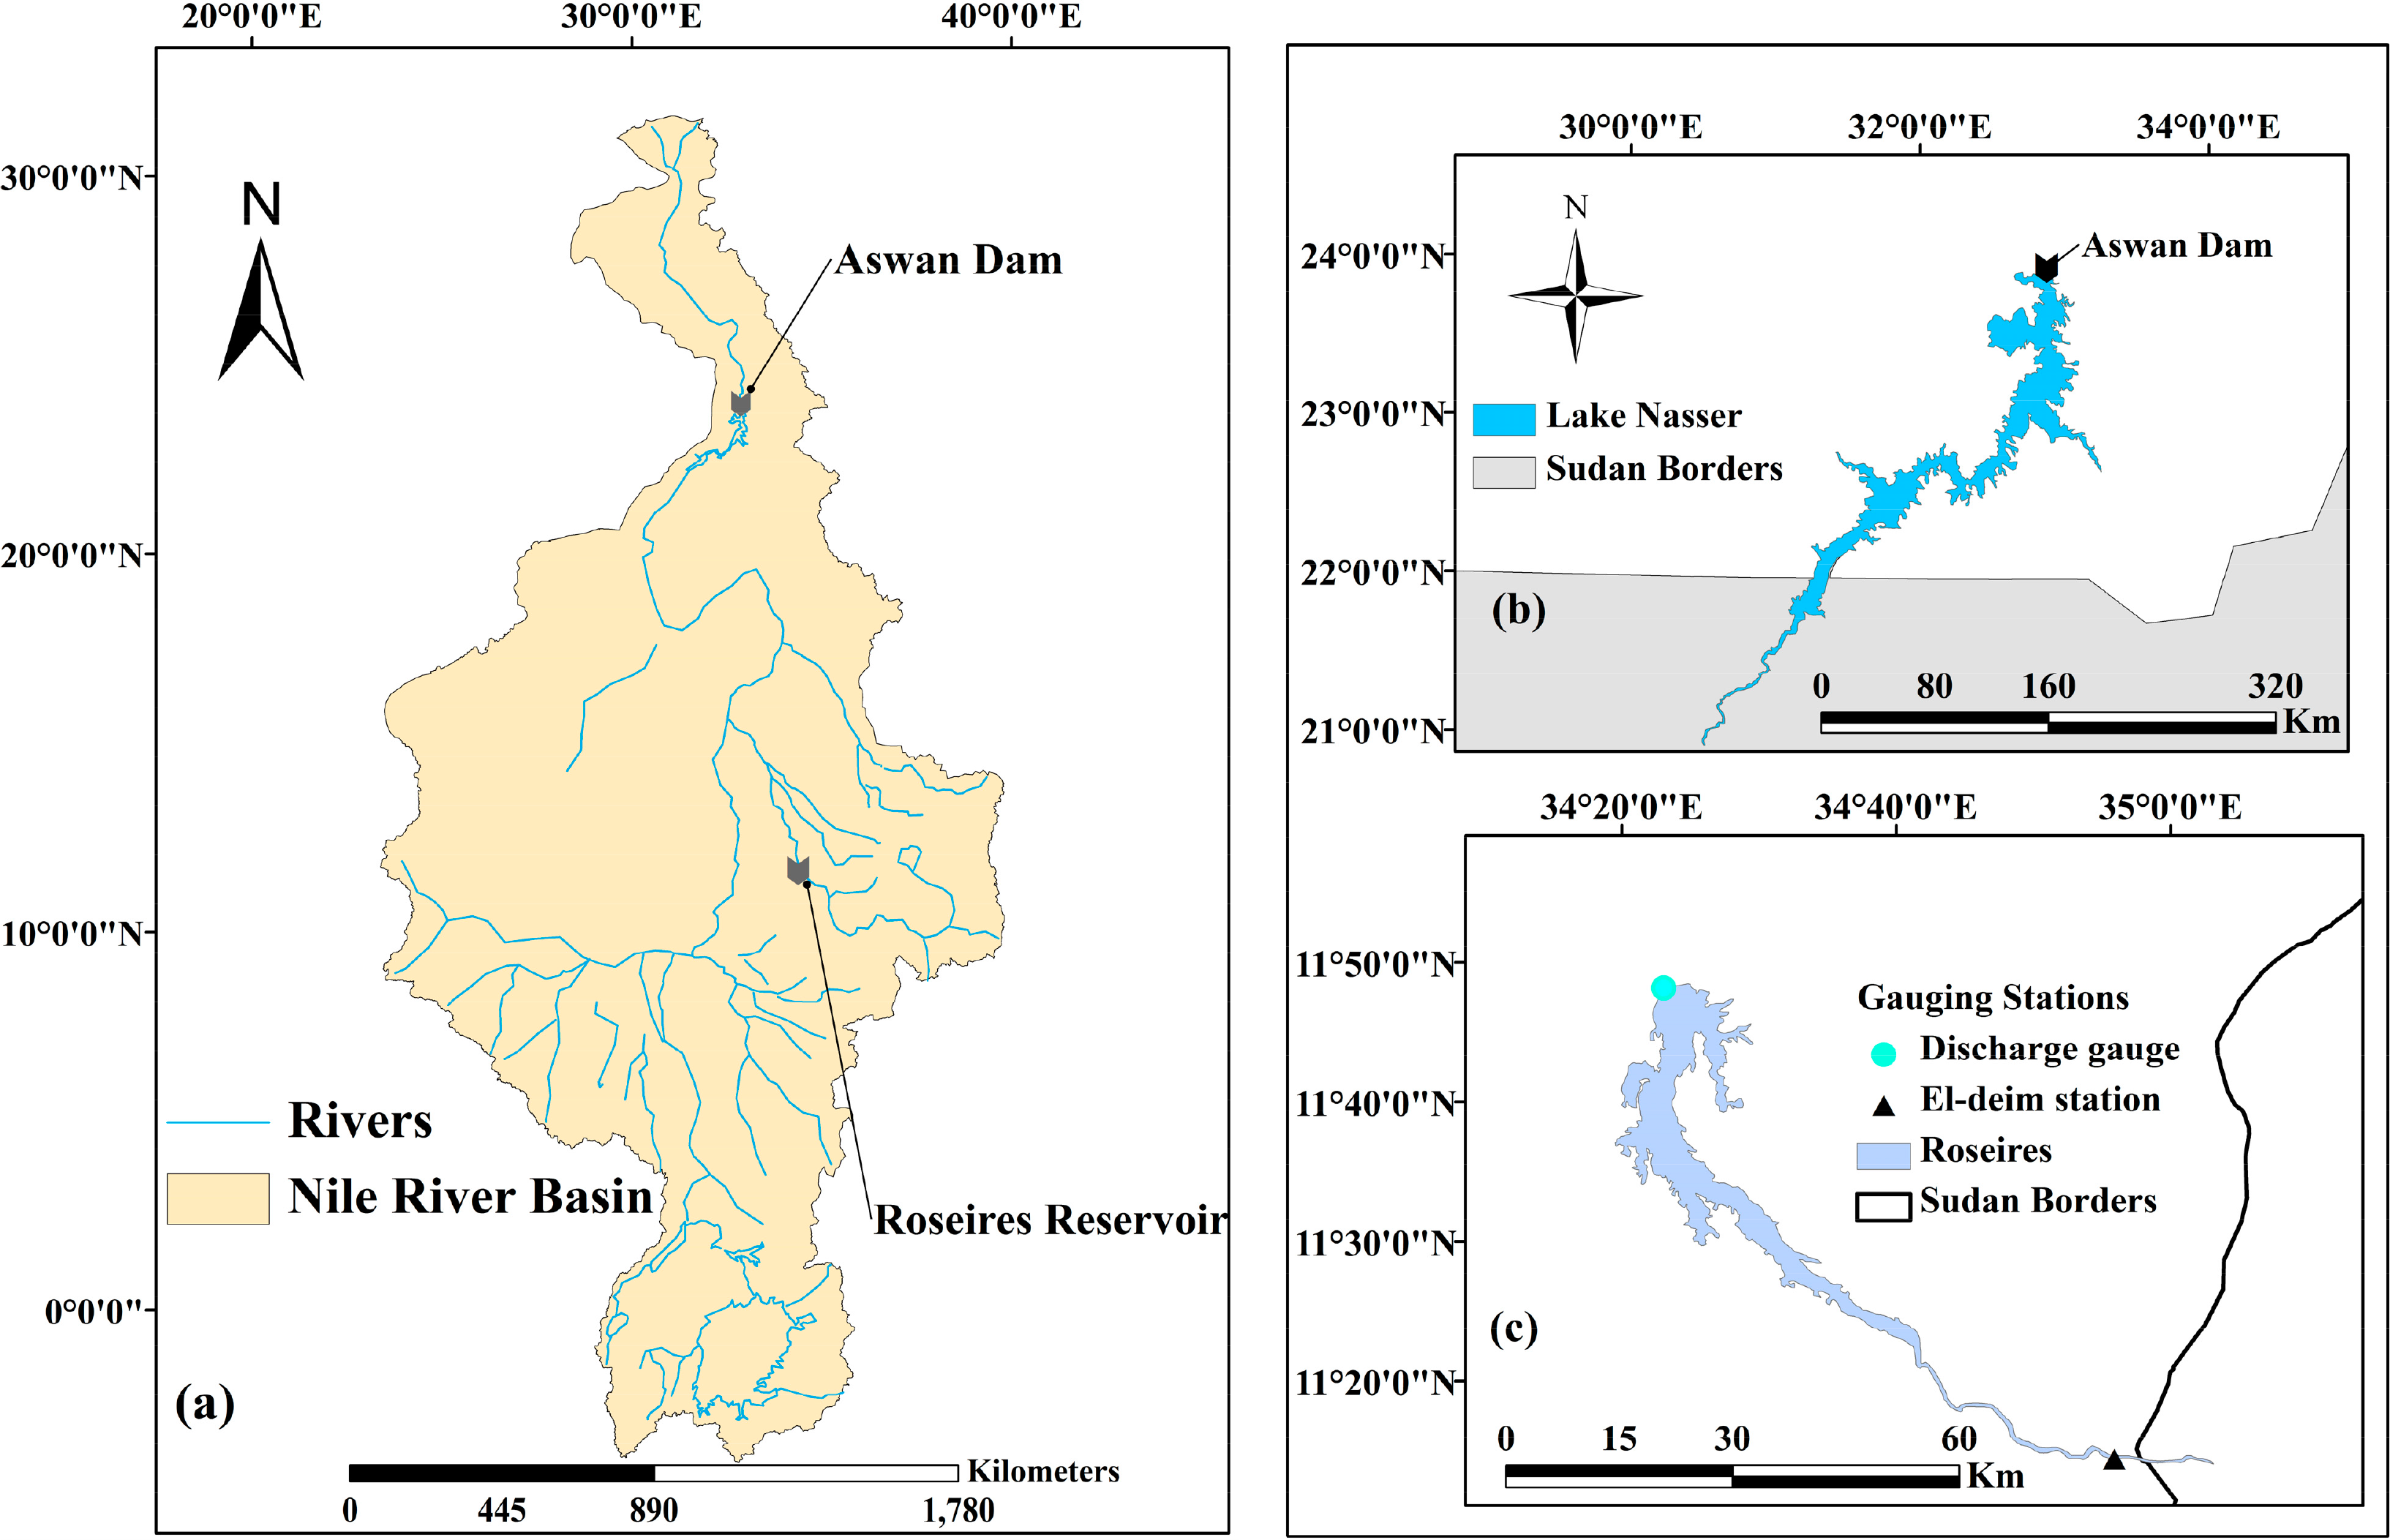
The Nile Basin covers an area of 3.3 million km2, is 6500 km long and is shared by 11 countries (Figure 1a). From south to north, the Nile traverses through varying climates, including the equatorial lakes, savannah, Sahara and, ultimately, the Mediterranean climate at its outlet. The basin is experiencing increasing water demands by the growing population, creating strong competition over the (fixed) water resource. Large dams have been constructed in the lower part of the basin (Egypt and Sudan), and new dams are planned or under construction in many locations, e.g., Bujagali Dam in Uganda, the Grand Ethiopia Renaissance Dam (GERD) in Ethiopia, and the Setit Dam in Sudan. Large dams change the water regime and availability not only locally, but at the basin scale, which then necessitates transboundary water management for optimal utilization of the resources. In fact, this has been the trigger for the formation of the Nile Basin Initiative (NBI), started in 1999, to support sustainable development and the equitable utilization of, and benefits from, the Nile water resources [3].
As at 2013, the riparian countries had not yet reached consensus on a data sharing protocol. The Comprehensive Framework Agreement (CFA) was signed by six out of the eleven Nile countries. The CFA intends to provide a legal and institutional framework for basin water resources management, including data sharing protocols [4]. The countries share only few hydrological data among themselves [5].
Satellite remote sensing is emerging as a potential technique to support hydrological monitoring and, hence, inform water resources management in river basins [1,6]. Satellite altimetry, a remote sensing technique, has been successfully used to derive water level data in lakes, reservoirs, rivers, floodplains and wetlands, providing data for more than 15 years [7].
The water level data derived from satellite altimetry have been combined with in situ measurements to estimate water storage in lakes and reservoirs, with successful applications in different parts of the world. The water volume variation of Lake Dongting in China was estimated using a relation developed between water level from satellite altimetry and in situ water storage [8]. Medina et al. [9] also estimated the volume variation of Lake Izabal in Guatemala from relations utilizing in situ measurements, satellite altimetry and imagery data. Duan and Bastiaanssen [10] proposed a method using only satellite altimetry and imagery data to estimate the volume variations of Lake Tana (Ethiopia) and Lake Mead (USA). This latter method can be used in the absence of in situ data. This method has been used in this study to estimate volume variation for Roseires Reservoir and Lake Nasser.
Altimetry data have also been used to estimate river discharges, e.g., for the Ob River [11], Chari/Ouham confluence near Lake Chad Basin [12], Amazon [13] and Ganga-Brahmaputra rivers [14]. In these studies, the river discharges were derived from rating curves developed from altimetry water levels and in situ discharge measurements. In the absence of in situ measurements, Leon et al. [15] utilized altimeter water level in a flow routing model (Muskingum–Cunge) to estimate the discharge of the upper Negro River in the Amazon basin (Brazil). The literature shows that discharge of rivers can be derived from rating curves. However, for lakes, the water level-discharge relationship does not significantly exist or, even if it exists, it may not be available for sharing. Swenson and Wahr [16] estimated the various components of Lake Victoria in East Africa using water balance. The lake’s level/storage, evaporation and precipitation were derived from satellite (e.g., altimetry, TRMM and GRACE) and the water inflow from models. The study presented here also uses the water balance, but uses satellite imagery and altimetry, public data on rainfall and evaporation and limited in situ data to estimate the discharge of a lake/reservoir. Therefore, this research seeks to add to the methods of estimating lake/reservoir discharges.
In summary, the literature shows many applications of using satellite altimetry and imagery data in combination with in situ measurements to derive hydrological information for water resources management. The degree of success is case specific, depending on the frequency and quality of satellite data in relation to the size and shape of the given water body.
This study aims at testing satellite data (altimetry and imagery) combined with limited in situ measurements for the operation of two large reservoirs in the Nile Basin: Roseires Reservoir and Aswan High Dam/Lake Nasser (Figure 1). The key question was: How accurate can satellite altimetry and imagery data estimate changes in storage volume and, combined with in situ measurements of reservoir inflow, reservoir discharges?
The paper is organized as follows: Section 2 gives a brief description of the two study sites. Section 3 presents all of the data used and their processing for the two reservoirs (altimetry, imagery and in situ measurements). The methods used for water balance and data validation are discussed in Section 4, and Section 5 presents the results and discussion. Finally, key conclusions and lessons learned are reported in Section 6.
2. Description of the Study Areas
Roseires Reservoir (Sudan) and Lake Nasser (Egypt) serve crucial functions to the population of both countries (Figure 1). They have been selected for this study because: (i) altimetry data have not been used yet to derive reservoir discharge; (ii) they are located in a transboundary river basin (Nile), where data exchange among riparian countries is limited, even though Sudan and Egypt have an agreement on data sharing (1959 agreement); and (iii) altimetry and satellite imagery data, as well as in situ data on inflows and outflows (for validation) were available for both sites.
2.1. Roseires Reservoir
Roseires Reservoir is located on the Blue Nile at Damazin, 550 km southeast of Sudan’s capital, Khartoum, and 110 km from the Ethiopia-Sudan border (Figure 1c). The reservoir is located at the southeastern part of Sudan, whose topography is made up of steppes and low mountains. The altitude ranges from about 350 m at Khartoum to 490 m above mean sea level (AMSL) at the Ethiopian-Sudan border. The reservoir was constructed in 1966 for irrigation (Gezira Scheme) and hydropower generation (280 MW). The physical characteristics of Roseires Reservoir are presented in Table 1. The reservoir capacity has decreased by 40% due to sedimentation [17]. However, in January 2013, works were completed that heightened the dam wall by 10 m, increasing the reservoir’s storage capacity to 7.4 billion m3 [18].
The temperature within the environs of the reservoir ranges from 27 to 46 °C. Rainfall normally occurs between June and October, with an annual average of 0.7 m/y (Damazin station). The annual average water inflow at El-deim is 49 km3/y.
The operation of Roseires Reservoir distinguishes four stages. During the first stage (rising flood) from July to August, the reservoir level is drawn to a minimum level of 470 m (AMSL). In the second stage, between 1 and 26 September, the reservoir is filled, depending on the water inflow from El-deim. During the third state, the full retention level is maintained, while the fourth stage marks the start of the emptying of the reservoir [17]. Now that the dam wall has been heightened, filling is expected to start earlier each year.
2.2. Lake Nasser
Lake Nasser is one of the greatest man-made lakes in the world, formed after the creation of the Aswan High Dam (AHD) in 1971 on the Nile River (Figure 1b). The lake is located in a desert region. The Arabian/Eastern Desert is located east of the Nile, while the low-lying sand dunes and depressions are found in the Western Desert. The dam was built to provide hydropower (2100 MW) and a steady water supply for irrigation in Egypt (55.5 km3/y). The lake has a length of about 500 km, 330 km in Egypt and 170 km in Sudan. Table 1 gives further characteristics of Lake Nasser.
The lake is vital to Egypt, as it stores and regulates Nile water, being the main source of freshwater for about 85% of its population. The lake is located in a very hot, dry climate with an annual evaporation ranging from 2.1 to 2.6 m/y [19]. The annual rainfall over the lake is negligible [20].
The operation rules of Nasser reservoir aim at ensuring adequate water supply and the safety of the Aswan High Dam. At the beginning of the water year (1 August), the water level is kept at 175 m AMSL to fulfil high and low flow requirement. When the water level upstream reaches an elevation between 178 m and 183 m, excess water is directed to the Toshka Depression and, if necessary, by means of the emergency spillways on the western bank of the Nile [21]. The maximum retention at 180 m AMSL is obtained in November and, subsequently, the reservoir levels decrease from January to July as water is released.
3. Input Datasets
3.1. In Situ Data for Roseires Reservoir
In situ daily water levels (h), water inflows (Qin), outflows (Qout) and volumes (V) for Roseires Reservoir for the period 2002–2010 were obtained from the Ministry of Water Resources, Sudan. The in situ water level is referenced to Alexandria Datum (i.e., above mean sea level). The level is taken from graduations on the dam wall. The inflow data is measured at El-deim station close to the Sudan-Ethiopia border. The (observed) outflow from the reservoir is monitored from a short distance downstream of the dam. The bathymetry survey of 2005 with reservoir levels and water volumes were used to derive the volume-level relationship, as given by Equation (1). Note that Equations (1) and (2) below (Section 5.2) have very sensitive decimal places and must be used as such. The bathymetric table shows that the minimum level is 467.00 m, with a corresponding volume of 13.70 m3 million, while the maximum level was 481.00 m, with a volume of 1934.73 m3 million. The data nicely spread between the minimum and maximum level every 1.00 m. The equation gave an excellent fit (R2 = 0.9995).
V = Storage volume in Mm3,
h = observed reservoir level in m AMSL.
3.2. In Situ Data for Lake Nasser
Ten-day mean measurements for in situ water levels (h), water inflows (Qin) and outflows (Qout) for the periods 1999–2002 and 2005–2009 and daily in situ water levels and volumes for the period 2007–2009 were obtained from the Ministry of Water Resources and Irrigation (MoWR), Egypt. In situ data were not received for the period 2003–2004. The in situ data are with respect to Alexandria Datum (i.e., AMSL). To allow for daily interpolation, the 10-day mean measurements were assumed to occur on Days 5, 15 and 25 of each month, and linear interpolation was performed for the intermediate days. This interpolation may introduce some uncertainty in the validation results, but this is expected to be small. The water inflow is recorded at Dongola station in Sudan and is computed by a rating curve equation.
The daily in situ water levels and volumes for the period 2007–2009 were used to derive the volume-level relationship for the lake. The relation was further used to convert in situ water levels to in situ volumes for the whole period of 1992–2002 and 2005–2009. The converted in situ volumes were used to validate the volumes from satellite measurements. The derived relation is given in Equation (2). This is based on 731 data points, with a minimum level of 173.30 m (volume: 112,600 million m3) and maximum level of 180.11 m (volume: 150,193 million m3). The data gave an excellent fit (R2 = 1.0)
3.3. Altimetry Water Level Datasets
Altimetry water levels from the Hydroweb and Global Reservoir and Lake Monitoring (GRLM) databases were used in this study. These databases were chosen because of the temporal resolution, level of processing and data availability for the two study areas. Readers are referred to Duan and Bastiaanssen [10] for a discussion of all four satellite altimetry water level databases for lakes and reservoirs.
Hydroweb is prepared by LEGOS/GOHS (Laboratoire d’Études en Géophysique et Océanographie Spatiale/Equipe Geodesie, Oceanograhie et Hydrologie Spatiale) in Toulouse, France. The altimetry data were derived from Topex/Poseidon, ERS-1 and 2, Envisat, Jason-1 and GFO satellites. The data are average monthly water level time series [22]. The reference of the water level is the GRACE Gravity Model 02 (GGM02) geoid. The procedure for water level processing in Hydroweb is described in detail by Cretaux et al. [23].
The Global Reservoir and Lake Monitor data (GRLM) are prepared by the United States Department of Agriculture’s Foreign Agricultural Service (USDA-FAS) in collaboration with NASA and the University of Maryland. The database uses data from Topex/Poseidon (T/P), Jason-1, Jason-2 and Envisat, and the data are at time interval of 10-days [24]. The reference of water levels from GRLM is with respect to the mean 9-year T/P water level. Therefore, they are expressed in relative water levels. The procedure for water level processing in GRLM can be found in [25]. The water levels of Lake Nasser are available in both databases, while water levels of Roseires can be found only in Hydroweb.
3.4. Landsat TM/ETM+ Imagery Data
Landsat TM/ETM+ imagery data were used to extract the water surface areas of the two reservoirs: Roseires and Lake Nasser. TM/ETM+ imagery data were chosen because of their long-term data availability (since 1984), free access and high spatial resolution (30 m). One scene of a Landsat image can entirely cover Roseires Reservoir, while three scenes are needed to completely cover Lake Nasser. The acquisition dates of images for the two reservoirs are given in Section 5. The data were downloaded freely [26].
Two problems were encountered when using Landsat images: cloud cover and domain, and were worked around as discussed in this section. Landsat images with dates coinciding with that of altimetry water level measurements were chosen to extract the reservoir’s water extent. The selection of coinciding dates was not always possible, because of high cloud cover and different revisit periods of the Landsat and altimeter satellites. In such cases, the closest dates were selected since the climate variations in some month(s) would not change much. In Hydroweb, water levels in a close or the same month and year with images were chosen, while in the GRLM database, specific days were chosen. Some of these dates had a big difference (i.e., 10 to 60 days) with respect to the date of altimetry water levels. Undoubtedly, this introduces an error in the estimation of the reservoir area. In the acquisition of the images of Roseires, it was observed that the boundary of Roseires Reservoir overlapped with the edge of some image scenes, reducing the availability of one complete scene. This situation also limited the acquisition of close or coinciding dates to derive the area-level relationship. The merging of three Landsat images to cover Lake Nasser with different acquisition dates also introduces errors in the delineation of the lake area.
The Landsat-7 satellite has had a problem with its Scan Line Corrector (SLC) since 31 May 2003, resulting in SLC-off ETM+. This failure has led to about a 22% data loss due to the increased scan gap [27]. Therefore, gap filling was done for images after May 2003, using Local Linear Histogram Matching (LLHM). The LLHM uses a Landsat TM or ETM+ SLC-on image to fill the SLC-off image [28]. The images chosen for the gap filling were cloud-free images and had comparable seasonal conditions. The Landsat-7 image gap filling was done for both Roseires Reservoir and Lake Nasser, since some of the acquisition dates were after May 2003.
3.5. Rainfall and Evaporation
Long-term mean values of monthly rainfall data for Roseires Reservoir and Lake Nasser were obtained from the International Water Management Institute (IWMI) On-line Climate Summary Service Model [29]. Generally, the IWMI On-line Service Model data is based on data obtained from weather stations around the world for the period 1961–1990. Using mean values of rainfall and evaporation is expected to generate negligible error in the water balance of the two reservoirs. Rainfall volume on Roseires Reservoir is very small, because the reservoir area is at a minimum during the rainy season, while on Lake Nasser, the rainfall rate is negligible. Open water evaporations from the two reservoirs were calculated using the Penman [30] formula. All parameters in the Penman formula, i.e., temperature, relative humidity, wind speed and relative sunshine duration, were obtained from long-term mean monthly values of the IWMI online climate summary service model. This is expected to cause a small error in evaporation volume, which is at least much smaller than the uncertainty of the reservoir area.
4. Methods
4.1. Altimetry Water Level Measurements
As given in Section 3.2, altimetry water levels for the two reservoirs were acquired from two databases (Hydroweb and GRLM). The mean difference (constant shift) between the in situ and altimetry water levels was computed and then simply added to altimetry water levels [10,31]. This ensures the attainment of a common datum, which allows the comparison of the two data series. For validation, the commonly used indicators, i.e., the coefficient of determination (R2) and the root mean square error (RMSE), were computed.
Alternatively, Global Navigation Satellite System (GNSS) data provide a datum shift for altimetry data for certain specific locations. However, there were no network stations of GNSS for our studies of the two reservoirs, and therefore, these were not used [32].
4.2. Delineation of Reservoir Surface Area
The extents (surface areas) of the two reservoirs were delineated from Landsat satellite images using the Normalized Difference Water Index (NDWI) [33] as given by Equation (3):
4.3. Storage Volume Estimation
A surface area-water level relation (based on satellite measurements) was integrated to obtain volume-level relations for each reservoir. First, the lowest water level (hmin) of the altimetry time series data was identified. The lowest water level was then subtracted from all water levels (h) obtained from each satellite altimetry data (i.e., h − hmin). The (h − hmin) can also be known as the water depth d above hmin [10]. It is assumed that the storage volume is zero at hmin, i.e., when d = 0, V = 0, but A ≠ 0, where A is surface area of the reservoir/lake. However, in reality, there is a storage volume in the reservoir at d, at least equal or larger than the dead storage. This is to allow water volume computations independent of the dead storage. For comparison, the in situ volumes have also been converted to volumes above the lowest water level (hmin). The conversion was done by subtracting the in situ volume for the same date that the lowest water level occurred in the satellite altimetry products.
Therefore, time series of two variables (surface area and water level) were prepared. The surface area (A) of a reservoir/lake delineated from the TM/ETM+ images for a given date is associated with altimetry water level measurements (h), converted to (h − hmin) of the same (or closest) date. A second-polynomial function (A = f(d) = ad2+ bd + c) was obtained by correlating the surface area (A) in Mm2 and water depth (d) in m, a, b, c being constants determined by regression analysis. The A-d relation was then integrated to obtain the volume-level relation (V = f (d) = ad3/3 + bd2/2 + cd + e); where V is the water volume above hmin. The A-d relation was integrated with the condition that the water volume (V) is equal to zero when water depth (d) is zero. The constants a, b, and c are the same values as in the A-d relation, and e is solved as zero (0) given the condition V = 0 when d = 0.
4.4. Water Balance of Reservoirs
The discharge from a reservoir/lake has been computed from the water balance equation of Equation (4), assuming negligible groundwater interactions:
Qin = inflow in Mm3/day
Qout = reservoir discharge in Mm3/day
P and E = precipitation and open water evaporation in m/day, respectively
dS/dt = change in storage volume with time in Mm3/day
A = the reservoir’s water surface area in Mm2 (=km2).
The inflow, Qin, was obtained from in situ measurements. The reservoir discharge, Qout, was computed based on altimetry water level measurements, Area-level and volume-level relations (i.e., dS/dt) were derived from Landsat and altimetry data. Qout is computed on decadal time steps (10-day) for GRLM and monthly for Hydroweb. The computed discharges Qout of Equation (4) were then validated against observed discharges. The objective here is to assess the accuracy of the discharge computed from a reservoir if it is based on satellite data of water levels and storage volume.
5. Results and Discussion
5.1. Results for Roseires Reservoir
5.1.1. Altimetry Water Level Measurements
The time-series of monthly water levels from Hydroweb and in situ measurements for Roseires Reservoir is shown in Figure 2. The Hydroweb water levels have been shifted vertically to the datum of the in situ measurements by adding a constant shift [31]. The shift of −1.54 m is the mean difference between the two data series for the period of nine years from 2002 to 2010 (Table 2). Figure 2 shows that water levels from Hydroweb agreed well with the in situ water level measurements (R2 = 0.96), in particular for high reservoir levels. However, water levels from Hydroweb overestimate reservoir levels during the flood season (when water levels are kept low), as was the case in 2004 and 2005, but not during the 2006 flood. Note that usually, the reservoir is at the maximum level by the end/beginning of the year and at minimum level during the flood season, June, July and August. Because of the very high flow during the flood season of 2006, which exceeded the gate capacity of Roseires Dam, the reservoir level rose above minimum levels, the so-called compulsory storage [35]. The under estimation at high water levels and over estimation at low levels could be attributed to the adjustment from the constant shift.
The RMSE of Hydroweb water levels against in situ water levels for Roseires was 0.92 m, which is about 7% of the seasonal variation (∼14 m), and R2 is 0.96, showing good agreement with in situ measurements. The literature reports a wide range of RMSE for different lakes and reservoirs worldwide. In general, the RMSE is small for large lakes, e.g., 3 to 7 cm for Lake Victoria, East Africa [31], but increases to several decimeters for smaller lakes, e.g., 26 cm for Lake Woods and 105 cm for Lake Powel [23]. The accuracy of altimetry water levels has been attributed to the size of the target water body, the surrounding topography and the roughness of the surface [23]. With larger rivers, RMSE ranges from 10 to 20 cm, e.g., Amazon River [36], and increases over narrower rivers and/or in the presence of vegetation [6]. The satellite laser altimetry, Ice, Cloud and Elevation Satellite (ICESat) derived water levels for Roseires Reservoir reveal an RMSE of 17 cm [37]. The improved accuracy of water levels from ICESat as compared to Hydroweb could be due to the smaller footprint of satellite laser altimeter (ICESat) than satellite radar altimeter (Hydroweb).
5.1.2. Reservoir Area and Volume
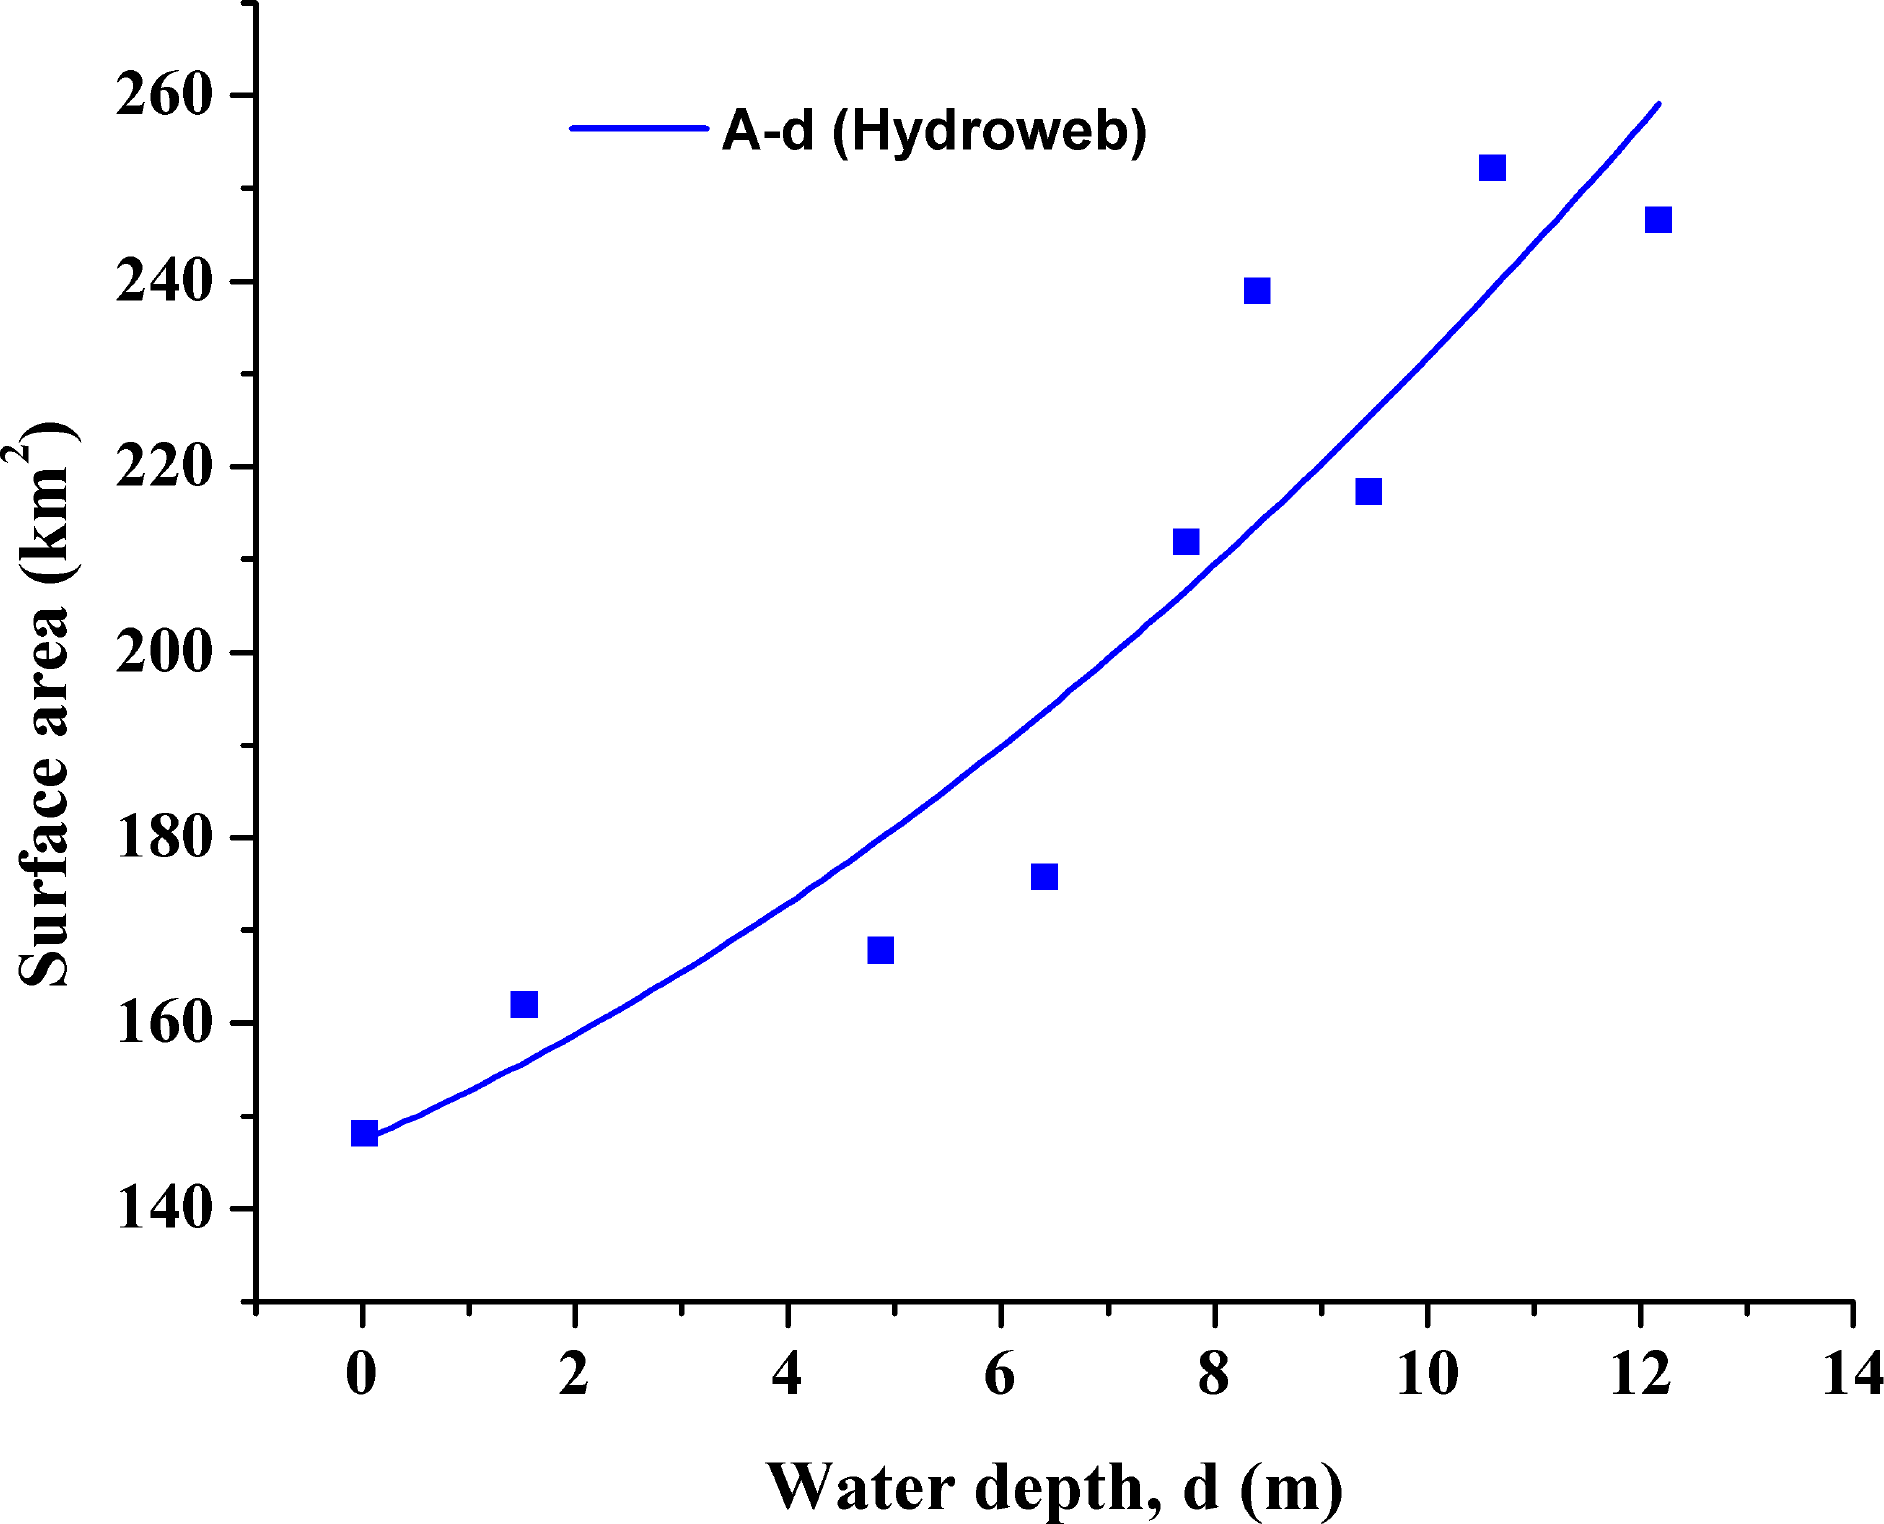
Nine pairs of coincident water levels from Hydroweb and Landsat TM/ETM+ imagery data were selected to determine surface area-level and further volume-level relations for Roseires (Table 3). Based on these nine pairs, the area-level relationship for Roseires was derived by regression analysis, as shown in Figure 3. The scatter could be attributed to two reasons: (i) different acquisition dates of altimetry data and satellite images, in particular during transition periods (filling or emptying of the reservoir); and (ii) the inherent uncertainties of both altimetry measurements (discussed in Section 5.1.1) and the area delineation from the NDWI images. However, a representative A-d relation could be derived (R2 = 0.87). The volume-level relation was obtained by the integration of Equation (5). The resulting function, as shown in Equation (6), was used to convert water levels from Hydroweb to calculated volumes for Roseires Reservoir.
A = area of reservoir derived from Landsat imagery (km2).
d = water depth (m).
V = volume in Mm3.
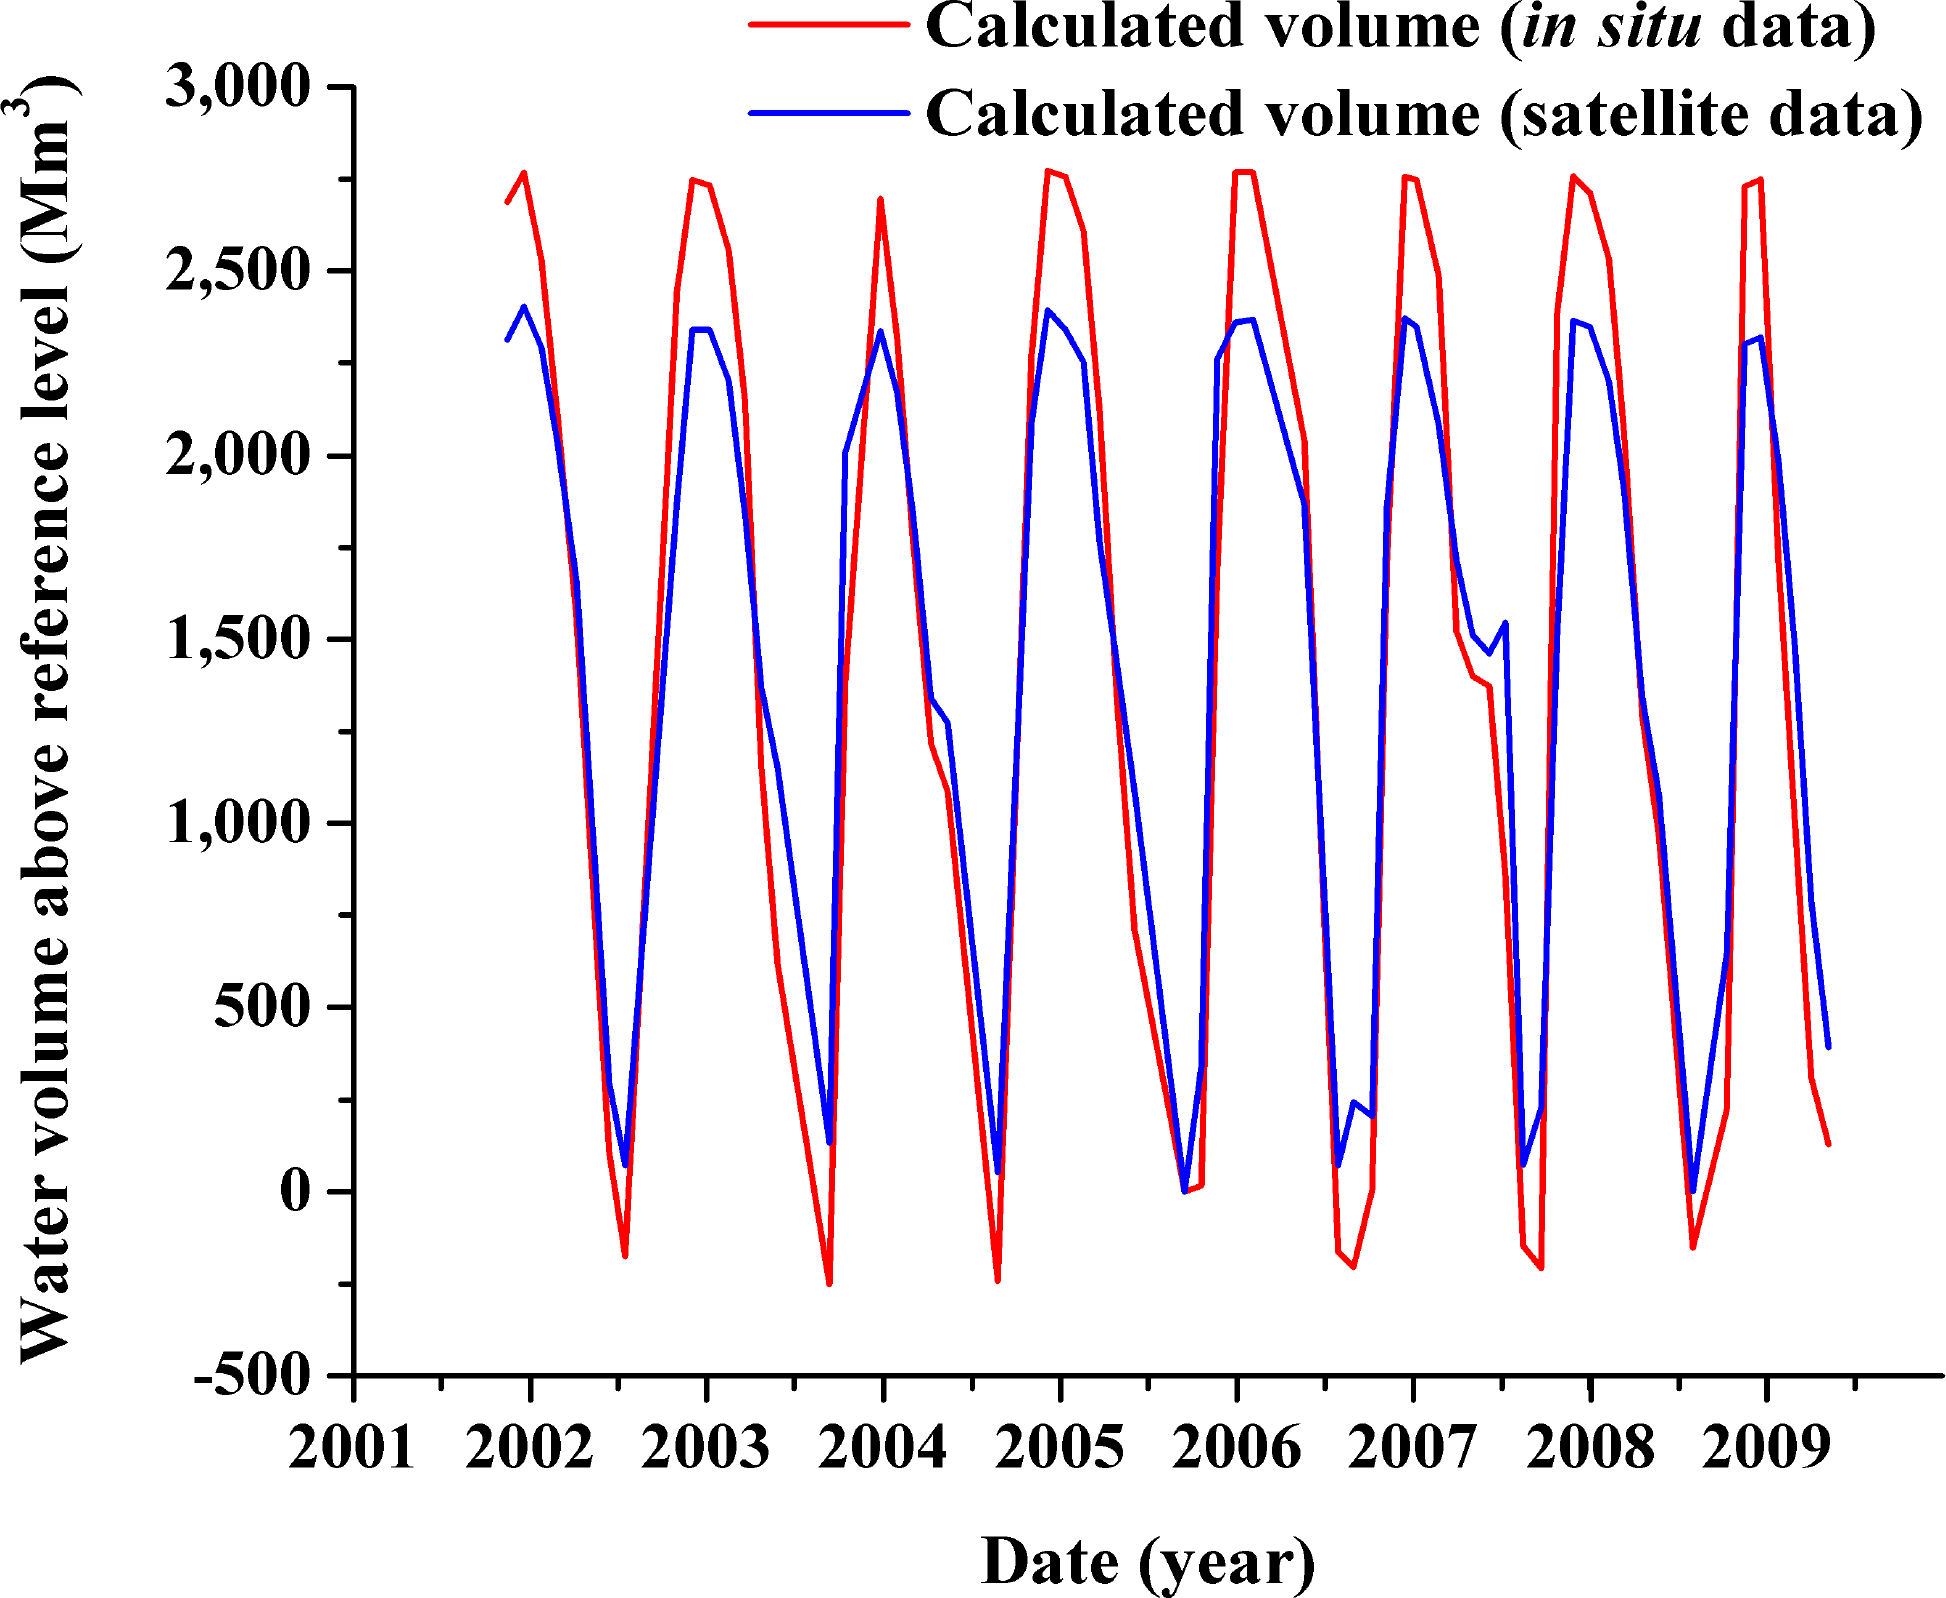
The monthly series of calculated from volume satellite data and calculated volume from in situ data for Roseires Reservoir from 2002 to 2010 are shown in Figure 4. The calculated volumes from satellite data were obtained by applying Equation (6) to altimetry water level data. The calculated volumes from satellite data were relative to the reference volume, which corresponds to the lowest water level (hmin) from Hydroweb. The calculated volumes from in situ data were derived by subtracting the in situ water volume that corresponds to the lowest altimetry water level from all in situ water volumes obtained from Equation (1). As can be seen from Figure 4, the operation pattern could be reproduced by satellite-derived data. The RMSE was 355 Mm3 (i.e., 23% of the mean volume of 1529 Mm3), while R2 was 0.94. The calculated volume based on satellite data consistently underestimated water volumes when the reservoir was at a maximum and overestimated at minimum levels. At low water levels, all of the calculated volumes (in situ) had negative values, except for August 2006, when the lowest water level occurred. August 2006, was used as the reference water level for the in situ water volume, since the date corresponds to the lowest water level (hmin) from Hydroweb. However, for other dates, even lower in situ water levels were measured. This reference water level value is thus greater than the other low water levels, hence the existence of negative volumes at low levels. These negative volumes do not affect our discharge estimation, since this is calculated from water volume differences between two time periods rather than the absolute values of water volumes for a specific time (see Section 5.1.3 on discharge estimation).
5.1.3. Reservoir Discharge
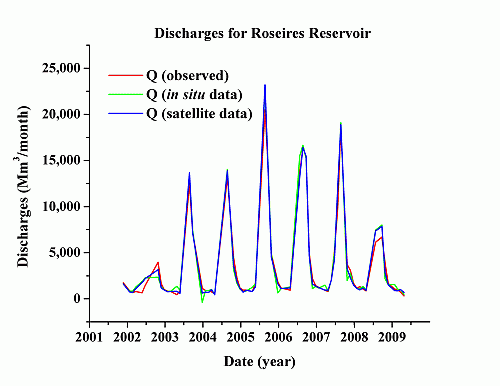
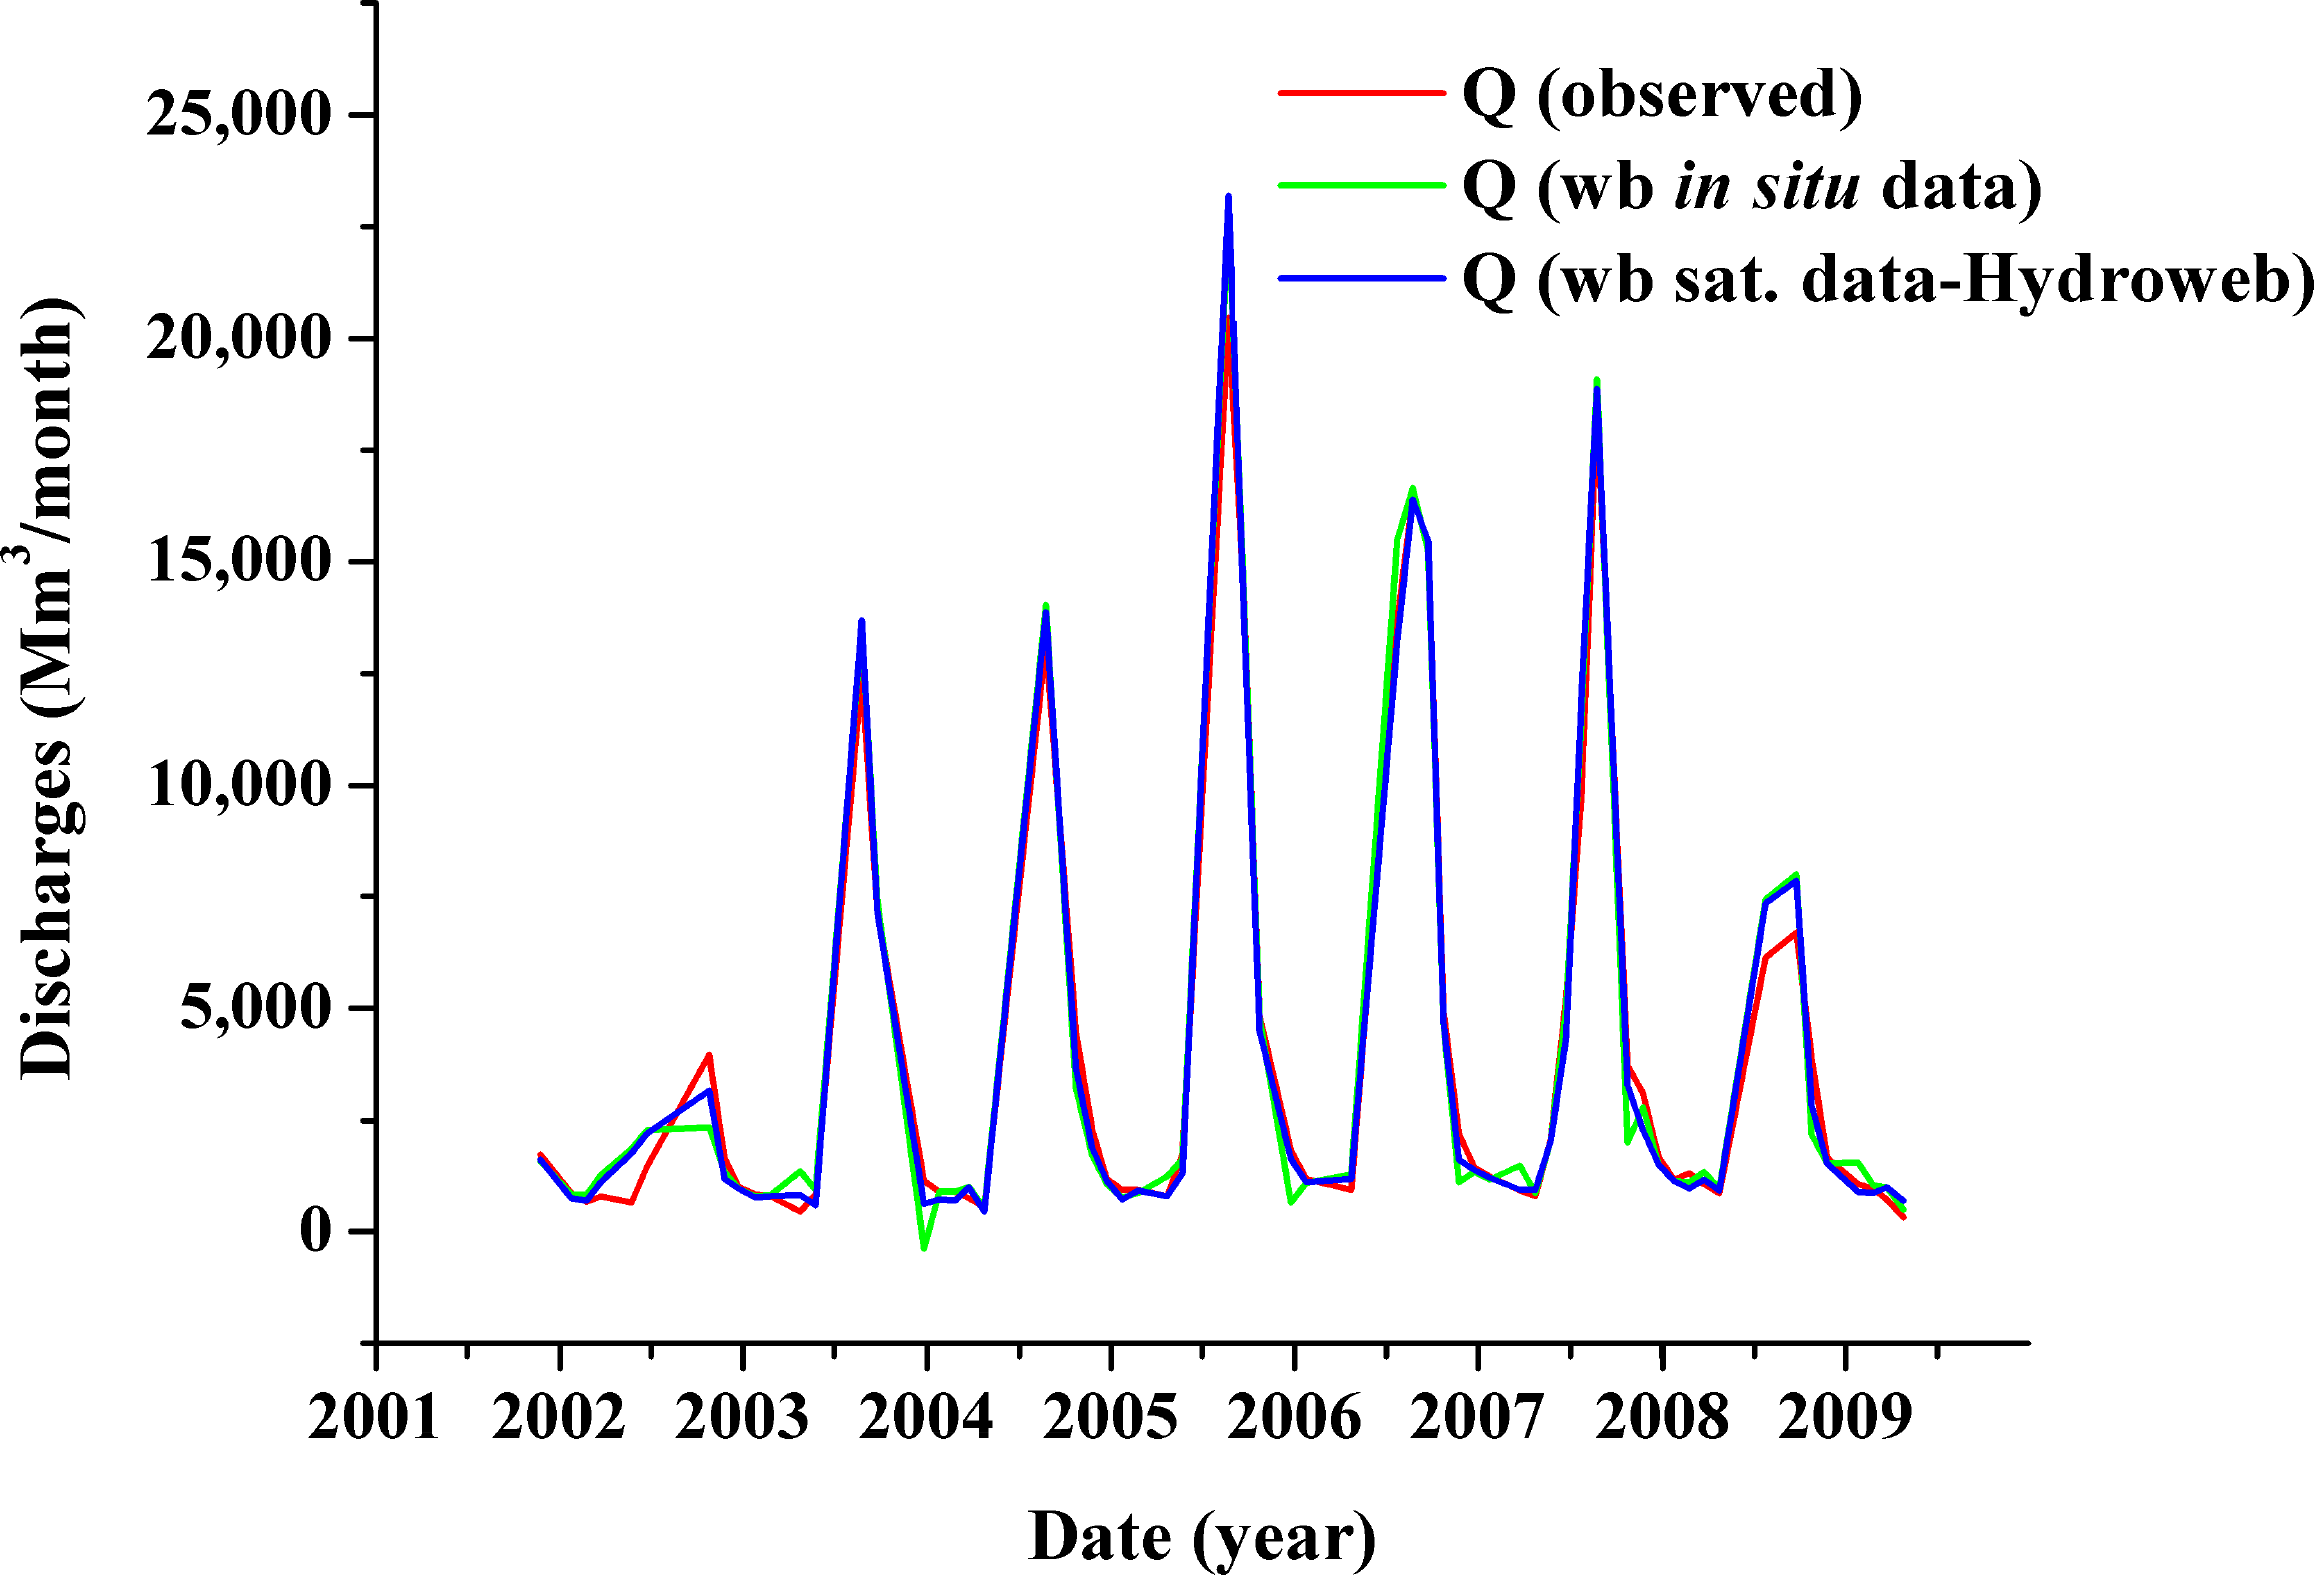
For validation, observed discharges from Roseires Reservoir based on a rating curve were compared with those computed by the water balance (wb) equation (Equation (4)). First, Qout was computed using all in situ measurements (Qin, P, E, A, dS/dt), labelled as Q (wb in situ data) in Figure 5. Here, dS/dt is based on in situ water level measurements, and the volume-level- relation is derived from bathymetric survey. Subsequently, Qout was computed using satellite (sat.) data of A and dS/dt and in situ data of Qin, P, E, labelled as Q (wb sat. data-Hydroweb). Here, dS/dt is based on altimetry water level measurements and the volume-level relation from satellite data with respect to the time step of the altimetry database (10-day or monthly). As shown, the three differently computed outflows are in excellent agreement with each other, e.g., Q (wb sat. data-Hydroweb) correlates well with Q (observed), R2 = 0.98. The RMSE between the two datasets is 671 Mm3/month, corresponding to 18% of the observed mean discharge. This can be considered an acceptable accuracy, given that the uncertainty of discharge measurement is between 5% and 10%, while errors up to 15% to 20% were reported for large rivers [14]. Discharge measurement errors of 4%–17% were reported for the Amazon River [13], and 17% for the Ob’ river [11].
To understand the errors introduced by satellite versus other sources of errors, the two observed discharges were compared, Q (observed) from the rating curve and Q (wb in situ data). The mean difference between the two discharges resulted in 16%. This shows that the error of the discharge using satellite data relative to the discharge (all in situ data) can be in the order of 2%, assuming linear error propagation.
5.2. Results of Lake Nasser
5.2.1. Altimetry Water Level Measurements
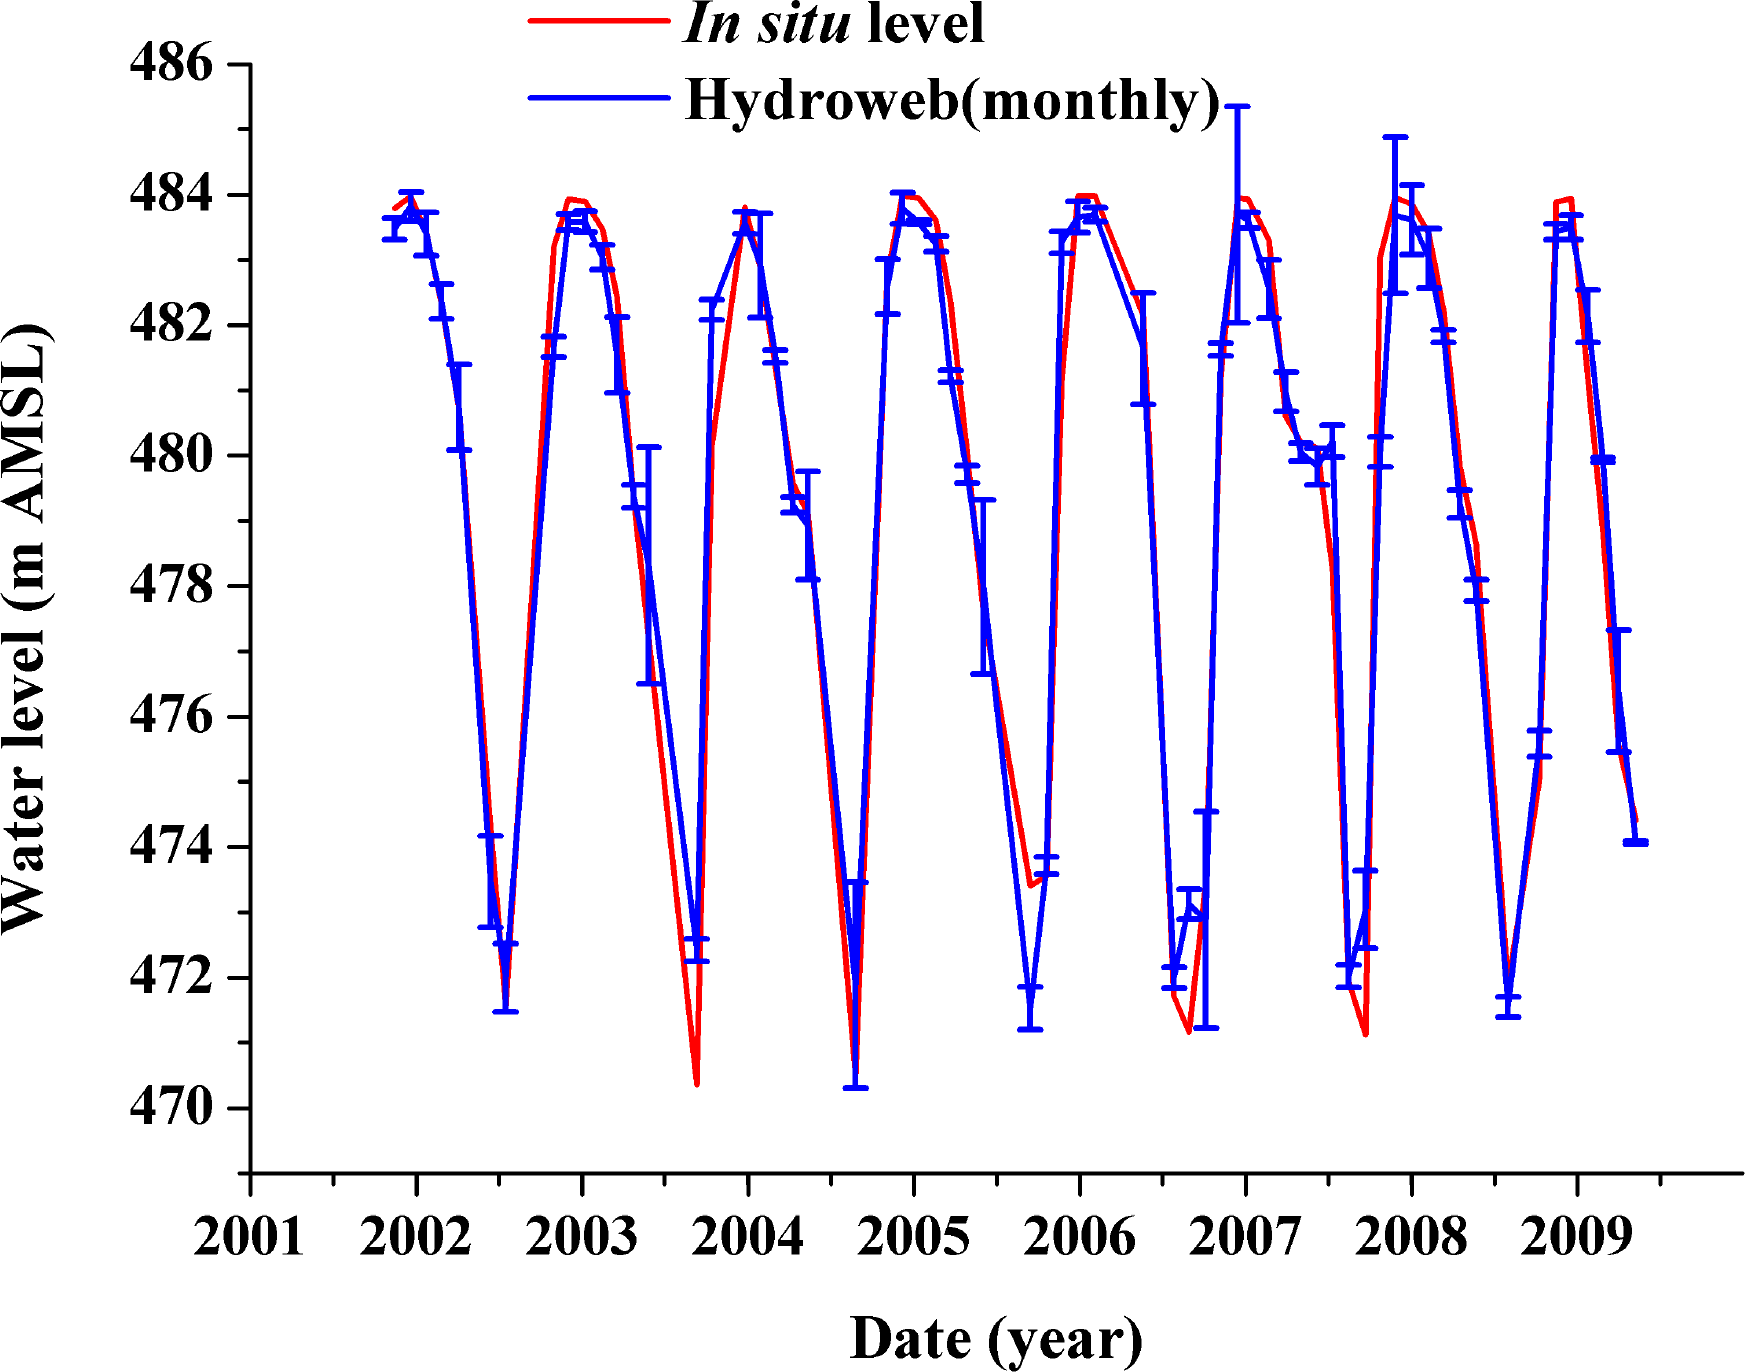
The water level data for Lake Nasser from Hydroweb (monthly) and GRLM (10-day) covered the periods 1999 to 2002 and 2005 to 2009. To attain a common datum for comparison, the water levels of Hydroweb and GRLM were shifted vertically with −0.12 m and 179.43 m, respectively (Table 2). The shifted values varied largely in magnitude, because the Hydroweb products were absolute water levels, while the GRLM products were water level variations referenced to the mean nine-year T/P water level. Figure 6 shows the time-series of in situ measurements, Hydroweb and the GRLM. It compares the in situ levels and shifted altimetry water levels, and the gap is a result of the lack of in situ data from 2003 to 2005. In the absence of in situ data for this period, Section 5.2.2 shows the possibility of estimating water volume from Hydroweb water levels to cover this gap.
In Figure 6, both altimetry water levels are in good agreement in phase and amplitude, especially at high reservoir levels. It could be observed that the Lake Nasser levels showed a clear decline between 2002 and 2007. This could be attributed to the drought in East Africa affecting the major sources of the Nile River, i.e., the White Nile from Lake Victoria and the Blue Nile from the Ethiopian Plateau [16]. The huge size of Lake Nasser reservoir (two-times annual flows) allows a long memory of response to inflow variability. Inflow was declining until 2005, but higher flows entered the lake from 2006 onward.
The RMSE of monthly data from Hydroweb against in situ water levels was 0.72 m, which is about 6% of the annual fluctuation (∼13 m), while R2 is 0.81 (Table 2). Similarly, the RMSE of altimetry data from GRLM against in situ water levels was 1.22 m, and R2 is 0.82. In general, the raw GRLM data has outliers, which were identified by comparison with in situ data. The mean square errors (MSE) between the two datasets exceeding 3 m were considered major outliers and were removed. Consequently, 20 outliers were taken out of the 235 data points of GRLM. The RMSE after the removal was 0.62 m, which is about 5% of the annual fluctuation, and the R2 was 0.94 (Table 2). The lower accuracy for Lake Nasser compared to Roseires could be attributed to the narrow and long shape of the former, which allows only small areas to be covered in the footprint of satellite altimetry, leading to the altimetry product being contaminated by land [25]. Land contamination for inland water is normally removed through customized processing of altimetry data, which is beyond the scope of this current study. Details on the removal of land contaminations have been discussed by developers of GRLM [25] and Hydroweb [23]. Furthermore, the difference in the places where the in situ gauge and altimetry satellites measure water levels would add some uncertainty. The single point-based in situ gauge station cannot reflect the spatial variation of water levels. The satellite altimetry measures along the track, which has a certain distance from the in situ gauge station.
5.2.2. Reservoir Area and Volume
Table 4 presents the selection of Landsat images matched with altimetry water level dates and the derived surface areas for Lake Nasser. Six monthly water levels from Hydroweb and areas derived from Landsat Images were paired to estimate the A-d relationship. Similarly, eight GRLM water levels and areas were paired to determine the A-d. Due to the narrow and long shape of Lake Nasser, three scenes were merged to obtain one complete scene for the lake. Two of the image scenes have similar dates, and each scene has its specific water level and extent. The acquisition dates for two of the scenes, Path 175 Row 44 and Path 175 Row 45, are the same; hence only one column is maintained as for both in Table 4. To reduce the error of water extent (area) arising from scene merging, the maximum allowed reservoir water level difference between the selected images scenes was assumed to be 0.6 m. Landsat images spanning from 1999 to 2002 were mostly used for area estimation, as they were free of image gaps, i.e., easier to process compared to the SLC gap-filling procedure. Few Landsat SLC-off images were used, since the gap filling of three SLC-off image scenes using SLC-on images for Lake Nasser was time consuming.
The Equations (7), (8), (9) and (10) represent the A-d and V-d relationships derived from Hydroweb and GRLM. Equation (7) and (9) were integrated to obtain Equation (8) and (10) respectively. The lowest water levels (as the reference for water volume estimation) for Hydroweb and GRLM were different; therefore, their derived equations are database specific. Equations (8) and (10) were used to convert the water levels to water volumes.
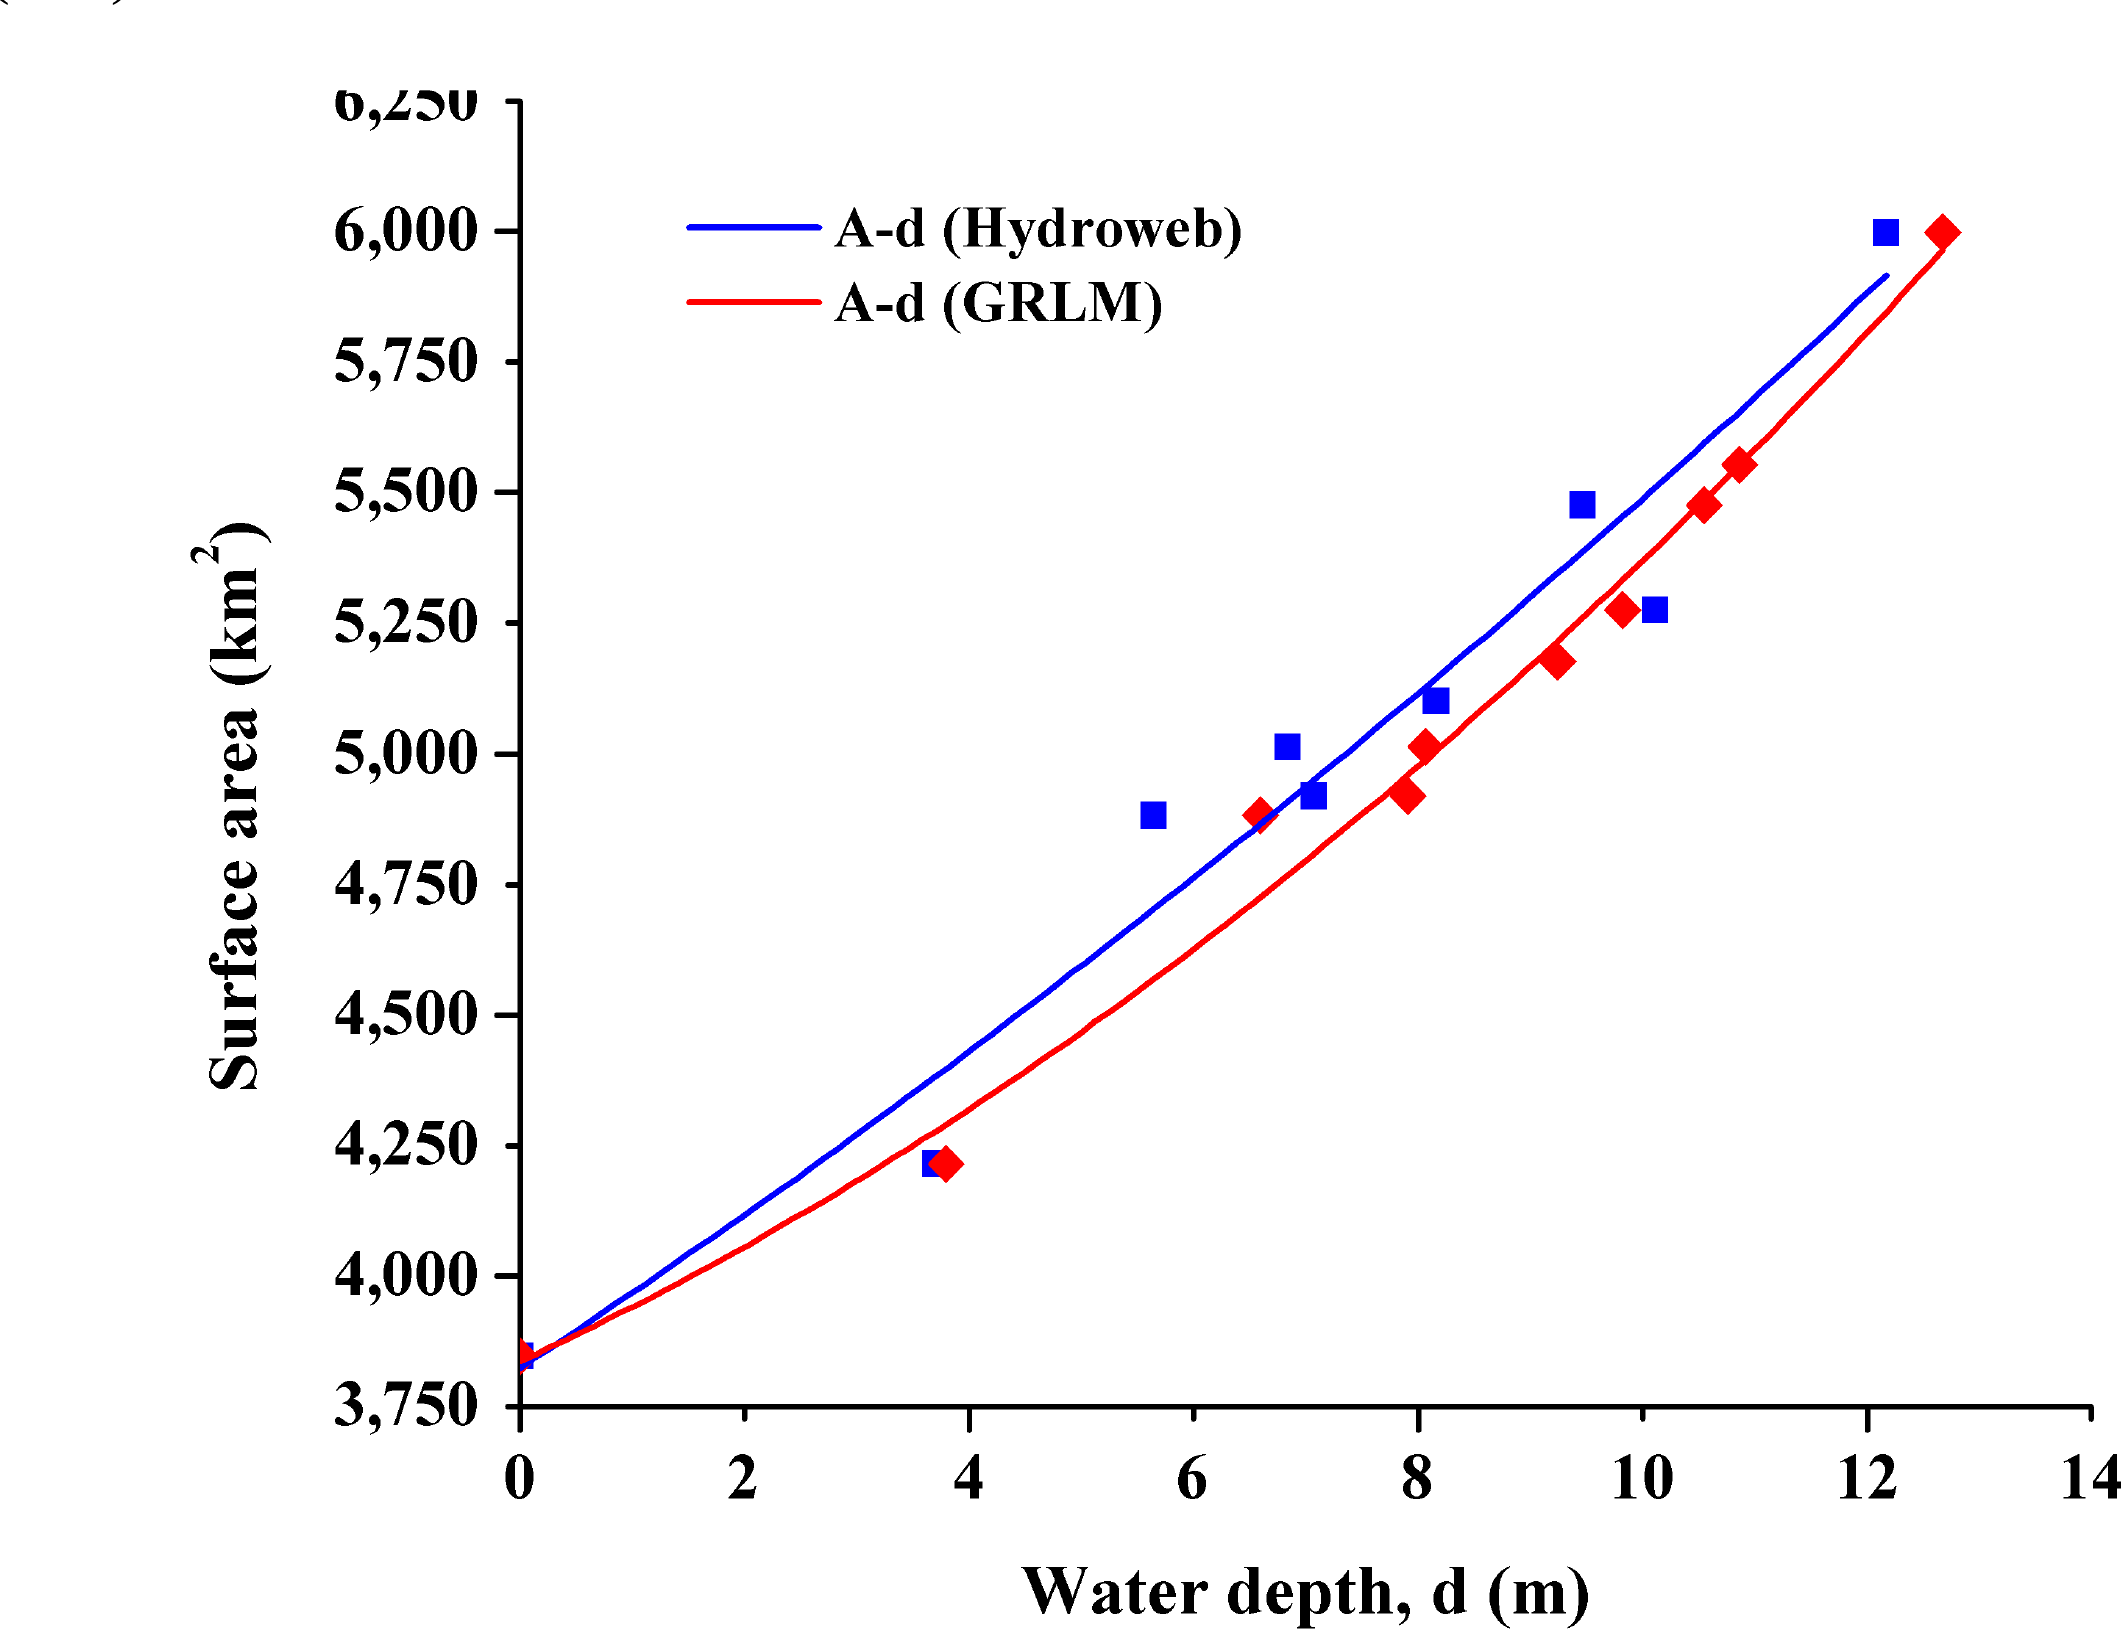
For Hydroweb, the A-d relation is given by Equation (7), represented by the blue curve in Figure 7. The R2 was 0.96.
For GRLM, the A-d relation with R2 of 0.99 is given by Equation (9), represented by the red curve in Figure 7.
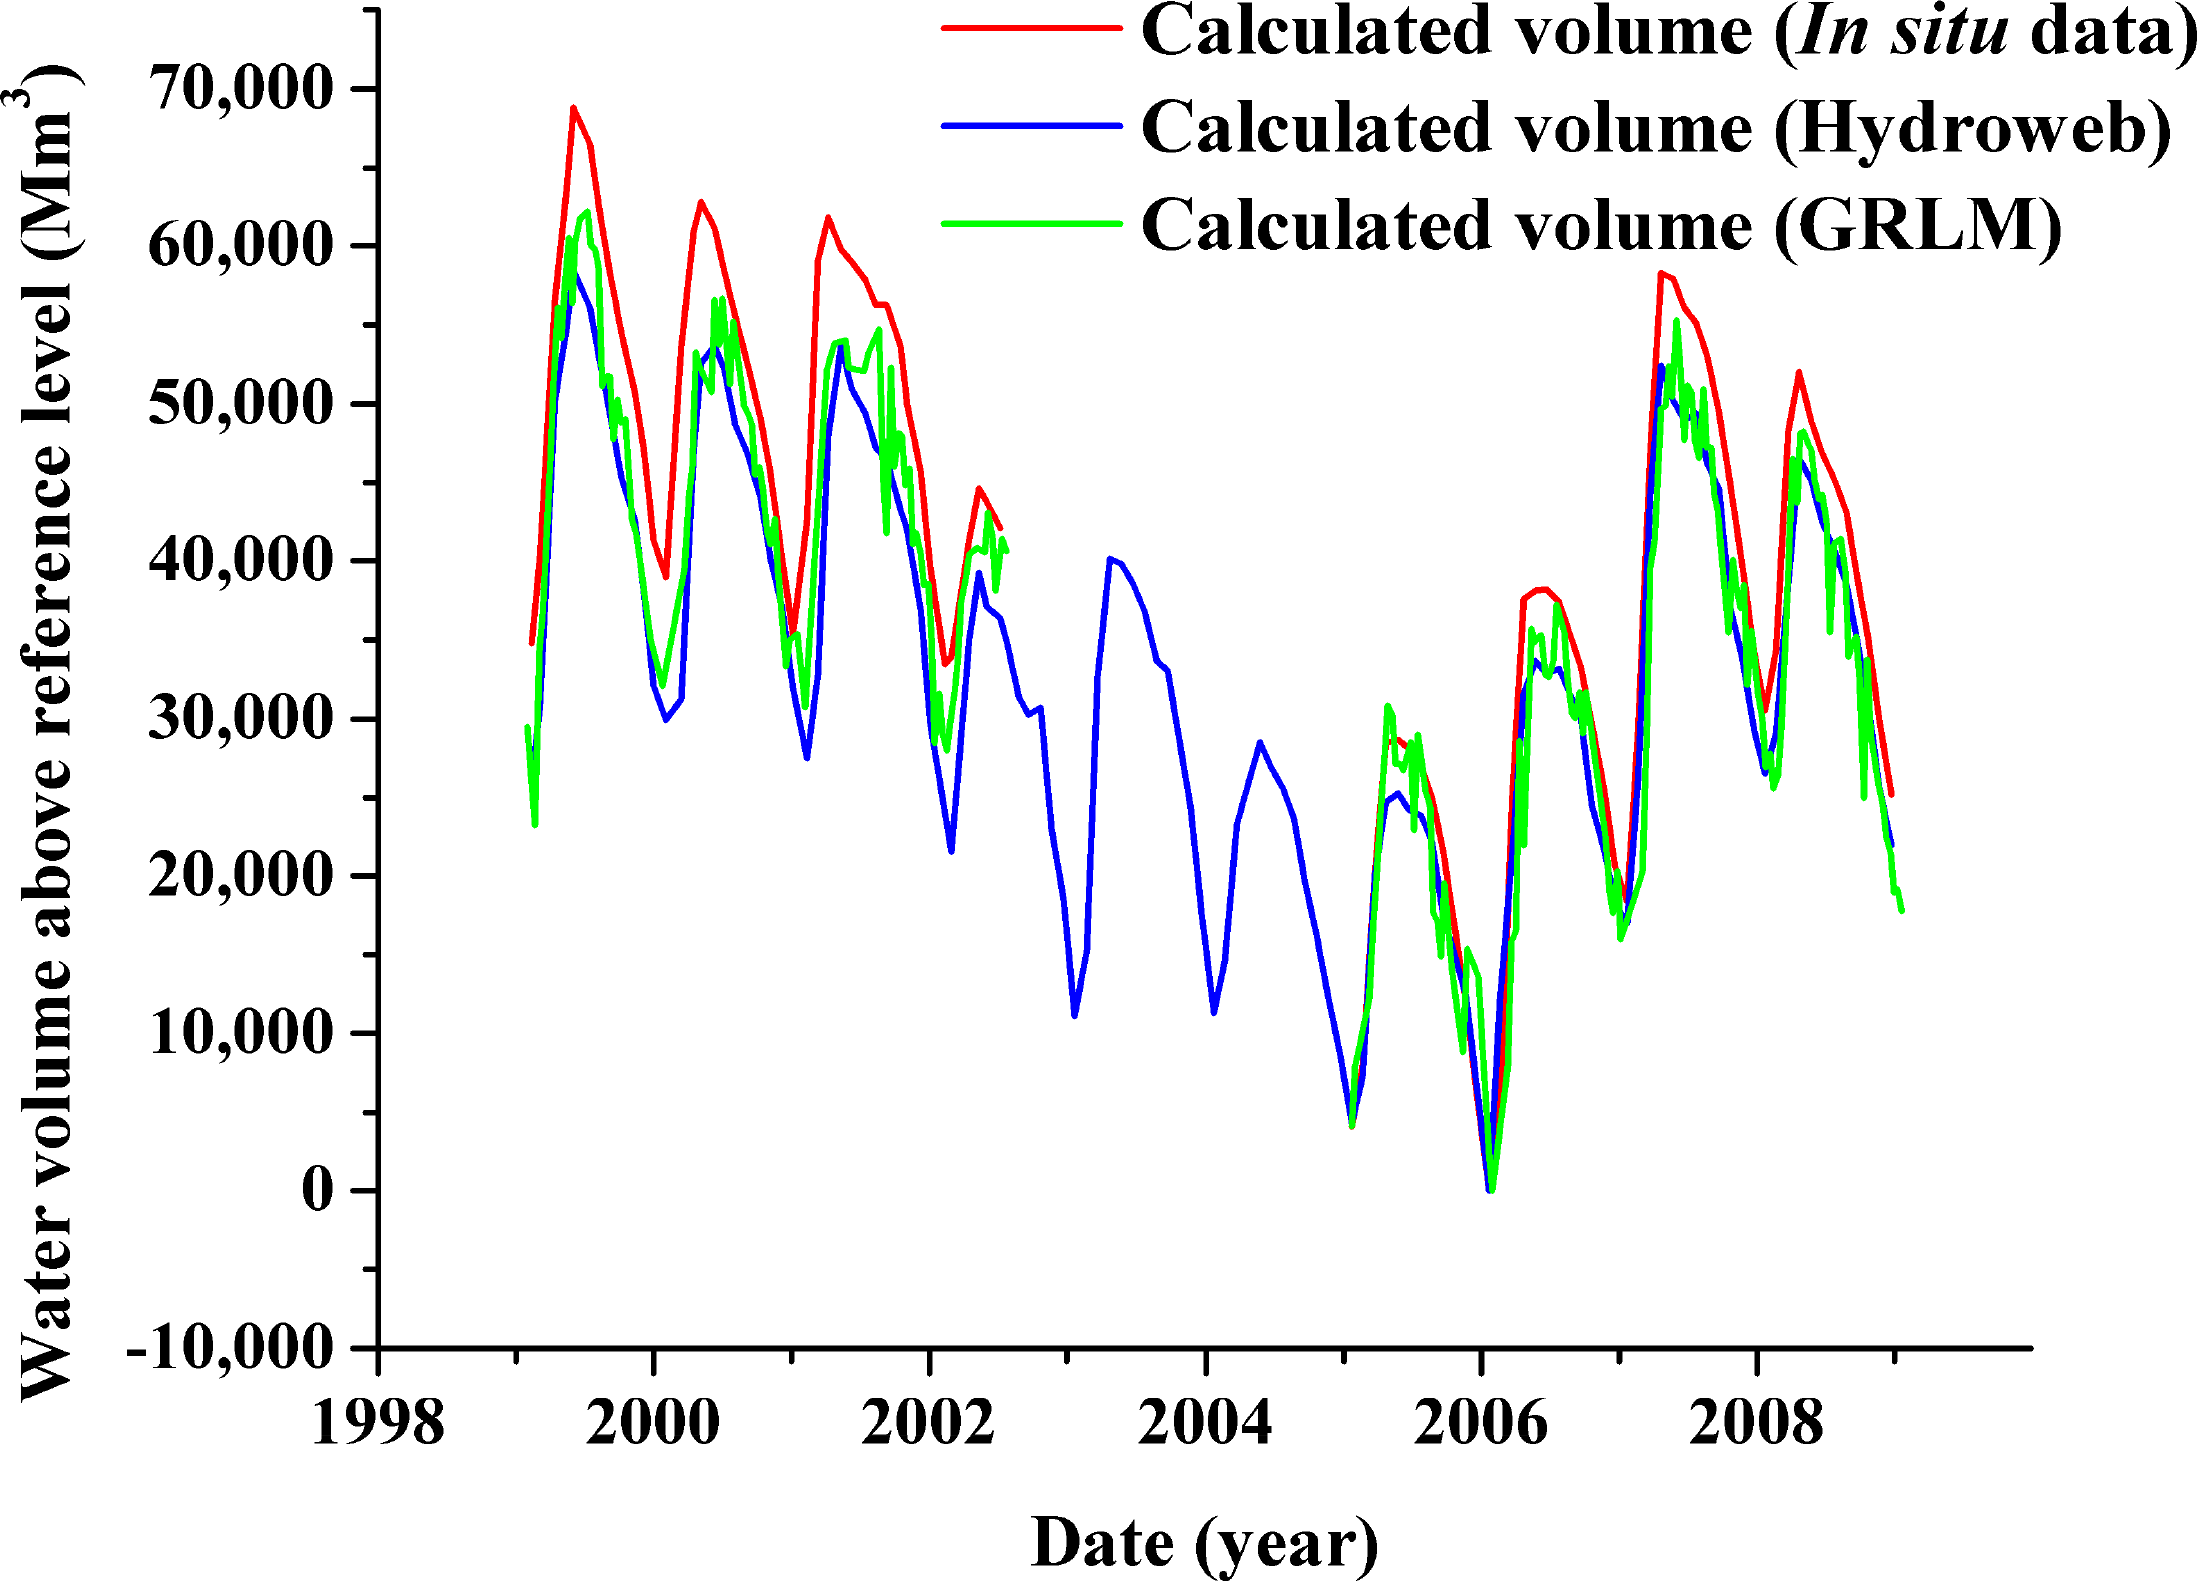
Figure 8 shows time-series of calculated volume from in situ data (Equation (2)) and calculated volumes from Hydroweb data (Equation (8)) and GRLM data (Equation (10)) for Lake Nasser during the periods 1999 to 2002 and 2005 to 2007. The calculated volumes from in situ data were relative to the reference volume, which corresponds to the lowest water level (hmin) from Hydroweb and GRLM. The operation pattern of Lake Nasser has been agreeably reproduced, although Hydroweb and GRLM underestimated the volume at minimum and maximum reservoir levels. The RMSE from Hydroweb data was 5720 Mm3 (i.e., 15% of the mean volume of 38,847 Mm3), while R2 was 0.93. The RMSE based on GRLM data was 3858 Mm3 (i.e., 10% of the mean volume of 39,377 Mm3), while R2 was 0.94. GRLM is slightly better than Hydroweb in terms of smaller relative RMSE for Lake Nasser.
5.2.3. Reservoir Discharge
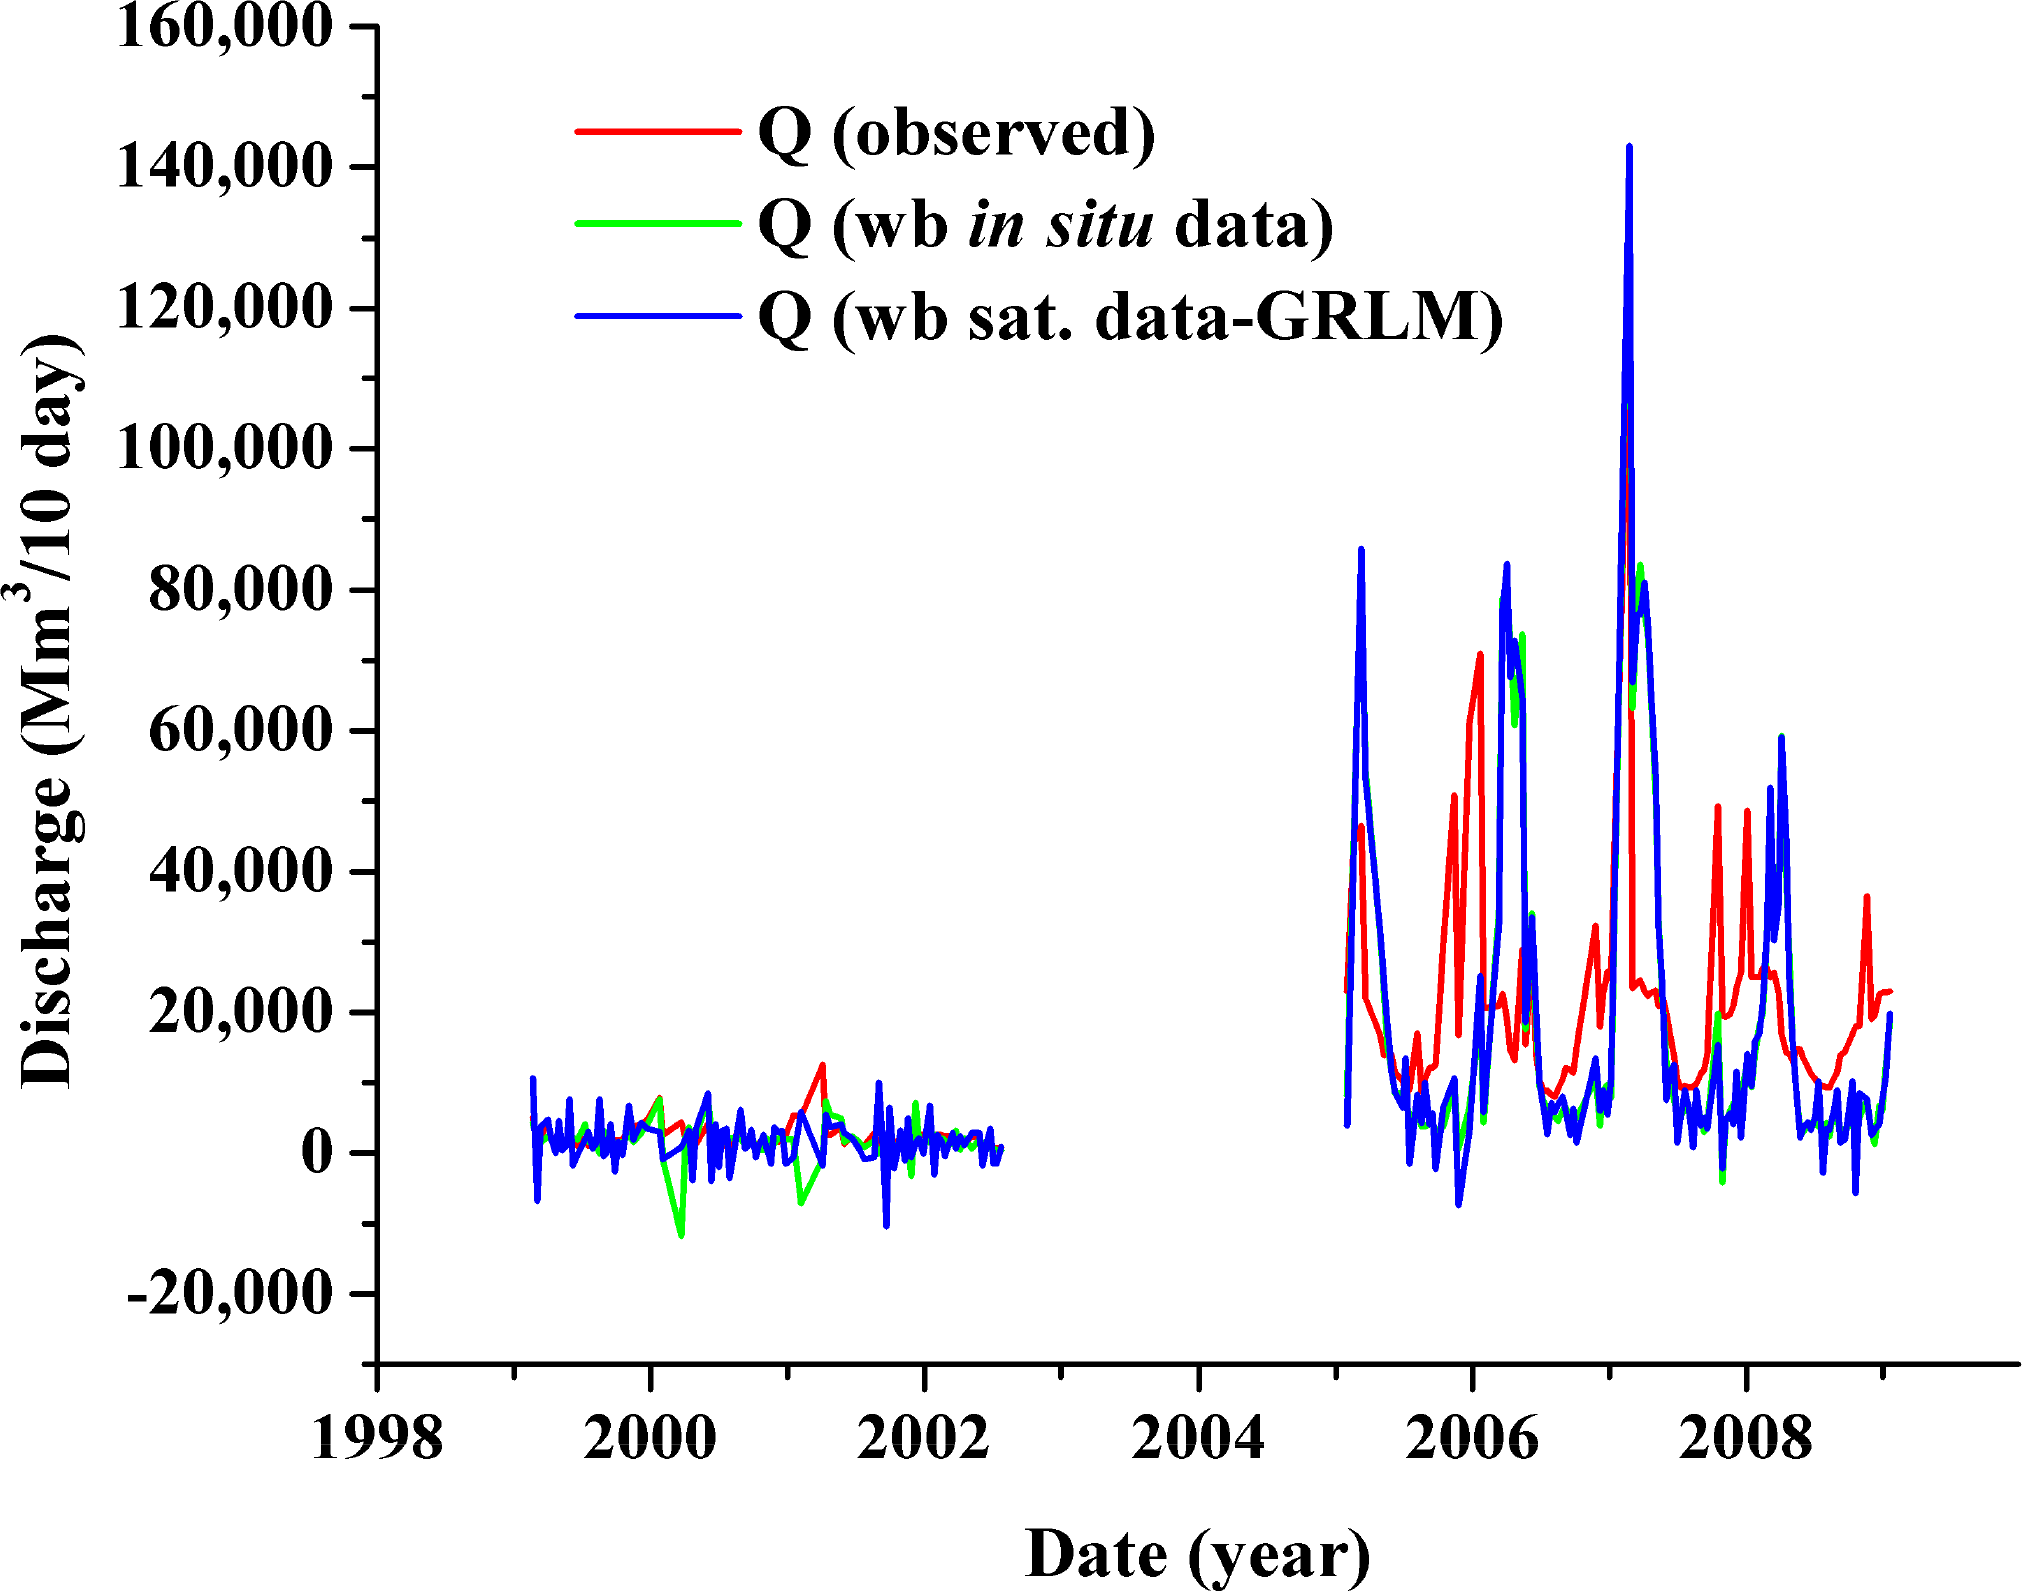
The discharges of Lake Nasser have been computed by the water balance equation. The comparison of the three discharges is given in Figure 9. Q (observed) is the observed discharge based on the rating curve, Q(wb sat. data-GRLM) is based on satellite data, while Q (wb in situ data) is based on in situ data.
There was good agreement between Q (wb sat. data-GRLM) and Q (wb in situ data), but large differences between Q(observed) and either Q (wb sat. data-GRLM) or Q (wb in situ data). The estimated discharges were overestimated at both low and high water levels. The 10-day discharge Q (wb sat. data-GRLM) poorly agreed with the Q (observed), giving an RMSE of 139% and an R2 of 0.36 (Table 5). This error far exceeds the acceptable error in discharge measurements in large rivers.
The three sets of discharge data were compared to understand error sources. A comparison of Q (wb in situ data) and Q (observed) also yielded a relatively large error (RMSE = 137%) and poor agreement (R2 = 0.36). Comparing Q (wb sat. data-GRLM) and Q (wb in situ data) resulted in a much smaller, but still unacceptably high, error (RMSE = 30%), with a very high R2 of 0.97. This may imply that satellite measurements might not be the major source of error. Discharges derived using Hydroweb (monthly) data in the water balance computations gave a relatively low error compared to GRLM (Table 5).
The difference between Q (observed) and Q (wb) might be due to several reasons. Firstly, it could be due to unaccounted spills from the reservoir into the Toshka Depression and to other desert streams. It is known that when the reservoir level exceeds 178 m, water may flow into Toshka. Bastawesy et al. [38] confirm that there were water releases into Toshka within the period 1998–2002. This indicates that Toshka receives excess water in certain times of the year when water level exceeds 178 m. Secondly, the inflow Qin might have been overestimated in this study, as it was measured at about 250 km upstream of the lake and more than 750 km from the outflow gates of the dam. Inflow in this reach may not be accurately captured. Finally, the large size of Lake Nasser compared to its inflow (i.e., its large residence time) increases the uncertainty in computed reservoir releases, compared with that of a reservoir with a smaller residence time (such as Roseires Reservoir); i.e., the same error in water level estimation introduces, in the case of a reservoir with a large residence time, a large absolute error in the computed volume of the water stored, which will translate into a large absolute error in computed outflow, which may result in a very large relative error.
6. Conclusions
As data on reservoirs are often scarce or not in the public domain, this study evaluated the feasibility and accuracy of using satellite altimetry and imagery data to estimate stored water volumes and, combined with limited in situ data, discharges from Roseires Reservoir (Sudan) and Lake Nasser (Egypt) in the Nile Basin. These estimated discharges would not only provide information on water releases to downstream users, but also give insight into the reservoir operation strategies.
The water volume of the reservoirs was derived from the integration of a lake-specific area-level relationship. The surface area was estimated from Landsat images using NDWI, while the water level was from satellite altimetry. The discharge was computed using the water balance of the reservoir. The other components of the water balance (evaporation and rainfall data) were obtained from the IWMI online database. The in situ water levels, V-d relations, water inflows and outflows were obtained from the responsible ministries of Sudan and Egypt. The obtained in situ water levels, water volumes and discharges were used for the validation of satellite-derived results.
For Roseires Reservoir, monthly water levels from Hydroweb showed a good agreement with in situ water levels (RMSE = 0.92 m and R2 = 0.96). The RMSE of the calculated volume and discharge Q (wb, sat. data) were 23% and 18%, respectively. The discharge is within the acceptable error of 15%–20% for single discharge measurements in large rivers. The outcome shows the potential to use satellite information for reservoir operation, which could be very useful for the contexts of no in situ data. The results showed that satellite-derived data can be used as a fairly reliable source of information for water resources management at a river basin scale.
For Lake Nasser, water levels from both GRLM (10-day) and Hydroweb (monthly) agreed well with in situ water levels (i.e., RMSE = 0.62 m, R2 = 0.96 and RMSE = 0.72 m, R2 = 0.81, respectively). The RMSE of the calculated volume from GRLM and Hydroweb were 10% and 15%, respectively. However, the error of the estimated discharge based on the water balance was quite high. The RMSE of the estimated discharge from GRLM and Hydroweb were 139% and 70%, respectively. Similarly, the same order of magnitude of error was obtained when the discharge was calculated with the water balance equation using in situ measurements. Sources of errors could include unaccounted outflows (e.g., reservoir spills to the Toshka Depression and water flows to desert streams) and overestimation of the water flowing into Lake Nasser. These errors would affect the water balance and influence the computed reservoir discharge.
This research contributes to the derivation of water discharges/releases in reservoir operations where there are limited or no in situ data. Specifically, the stored water volumes of Roseires Reservoir and Lake Nasser were successfully estimated, deriving their respective area-level and volume-level relationships using satellite data. Furthermore, by combining satellite-derived information on storage changes with in situ inflow data, the water releases from the two reservoirs could be adequately estimated for Roseires Reservoir, but with major limitations in the case of Lake Nasser. In the latter case, some major error sources may in fact not be related to satellite-derived information. It is also concluded that in general, error propagation in the estimation of reservoir releases for reservoir systems with shorter residence times will be smaller than in systems with longer residence times.
These findings are valuable for water resources management, particularly in a transboundary basin, such as the Nile Basin, where data sharing is still limited.
Acknowledgments
We wish to thank the Ministry of Water Resources and Irrigation, Egypt, and the Ministry of Water Resources, Sudan, for providing data on in situ measurements for this research. Eric Muala is grateful to the Joint Japan World Bank Graduate Scholarship Program (JJ/WBGSP) for its financial support of this research at UNESCO-IHE Institute for Water Education, Delft, The Netherlands. Zheng Duan is also grateful for financial support from China Scholarship Council (CSC). We also acknowledge financial support from the DGIS-UNESCO|IHE Programmatic Cooperation (DUPC) program of UNESCO-IHE.
Author Contributions
Eric Muala collected, analysed data and processed most data, including the satellite imagery. All in-situ measurements were facilitated, obtained and analysed by Yasir Mohamed. Zheng Duan analysed some data, gave guidance for volume methodology and satellite data processing. Eric Muala was responsible for the research and the write up of the manuscript with contributions from all co-authors. Yasir Mohamed, Zheng Duan and Pieter van der Zaag critically revised the manuscript. All authors read and approved the final manuscript.
Conflicts of Interest
The authors declare no conflicts of interest.
References
- Alsdorf, D.E.; Rodriguez, E.; Lettenmaier, D.P. Measuring surface water from space. Rev. Geophys 2007, 45, 1–24. [Google Scholar]
- Report of the GCOS/GTOS/HWRP Expert Meeting on Hydrological Data for Global Studies. Available online: http://www.fao.org/gtos/doc/pub32.pdf (accessed on 8 August 2014).
- Arsano, Y.; Tamrat, I. Ethiopia and the Eastern nile Basin. Aquat. Sci 2005, 67, 15–27. [Google Scholar]
- Gerlak, A.; Lautze, J.; Giordano, M. Water resources data and information exchange in transboundary water treaties. Int. Environ. Agreem.: Polit. Law Econ 2011, 11, 179–199. [Google Scholar]
- Water Resources Management, Nile Basin Initiative. Available online: http://nilebasin.org/newsite/ (accessed on 8 August 2014).
- Calmant, S.; Seyler, F.; Cretaux, J.F. Monitoring continental surface waters by satellite altimetry. Surv. Geophys 2008, 29, 247–269. [Google Scholar]
- Cretaux, J.F.; Birkett, C. Lake studies from satellite radar altimetry. Comp. Rend. Geosci 2006, 338, 1098–1112. [Google Scholar]
- Zhang, J.Q.; Xu, K.Q.; Yang, Y.H.; Qi, L.H.; Hayashi, S.; Watanabe, M. Measuring water storage fluctuations in Lake Dongting, China, by Topex/Poseidon satellite altimetry. Environ. Monit. Assess 2006, 115, 23–37. [Google Scholar]
- Medina, C.; Gomez-Enri, J.; Alonso, J.J.; Villares, P. Water volume variations in Lake Izabal (Guatemala) from in situ measurements and ENVISAT Radar Altimeter (RA-2) and Advanced Synthetic Aperture Radar (ASAR) data products. J. Hydrol 2010, 382, 34–48. [Google Scholar]
- Duan, Z.; Bastiaanssen, W.G.M. Estimating water volume variations in lakes and reservoirs from four operational satellite altimetry databases and satellite imagery data. Remote Sens. Environ 2013, 134, 403–416. [Google Scholar]
- Kouraev, A.V.; Zakharova, E.A.; Samain, O.; Mognard, N.M.; Cazenave, A. Ob’ river discharge from TOPEX/Poseidon satellite altimetry (1992–2002). Remote Sens. Environ 2004, 93, 238–245. [Google Scholar]
- Coe, M.T.; Birkett, C.M. Calculation of river discharge and prediction of lake height from satellite radar altimetry: Example for the Lake Chad basin. Water Resour. Res 2004, 40, 1–11. [Google Scholar]
- Zakharova, E.A.; Kouraev, A.V.; Cazenave, A.; Seyler, F. Amazon river discharge estimated from TOPEX/Poseidon altimetry. Comp. Rend. Geosci 2006, 338, 188–196. [Google Scholar]
- Papa, F.; Durand, F.; Rossow, W.B.; Rahman, A.; Bala, S.K. Satellite altimeter-derived monthly discharge of the Ganga-Brahmaputra River and its seasonal to interannual variations from 1993 to 2008. J. Geophys. Res.: Oceans 2010, 115, 1–19. [Google Scholar]
- Leon, J.G.; Calmant, S.; Seyler, F.; Bonnet, M.P.; Cauhope, M.; Frappart, F.; Filizola, N.; Fraizy, P. Rating curves and estimation of average water depth at the upper Negro River based on satellite altimeter data and modeled discharges. J. Hydrol 2006, 328, 481–496. [Google Scholar]
- Swenson, S.; Wahr, J. Monitoring the water balance of Lake Victoria, East Africa, from space. J. Hydrol 2009, 370, 163–176. [Google Scholar]
- Bashar, K.E.; Ahmed, E. Sediment accummulation in roseires reservoir. Nile Basin Water Sci. Eng. J 2010, 3, 46–55. [Google Scholar]
- Dams Implementation Unit (DIU). Available online: http://www.roseiresdam.gov.sd/en/index.php (accessed on 8 August 2014).
- Ebaid, H.M.I.; Ismail, S.S. Lake nasser evaporation reduction study. J. Adv. Res 2010, 1, 315–322. [Google Scholar]
- Elsawwaf, M.; Willems, P.; Pagano, A.; Berlamont, J. Evaporation estimates from Nasser Lake, Egypt, based on three floating station data and Bowen ratio energy budget. Theor. Appl.Climatol 2010, 100, 439–465. [Google Scholar]
- Mobasher, A.M.A. Adaptive Reservoir Operation Strategies under Changing Boundary Conditions—The Case of Aswan high Dam Reservoir. Ph.D. Thesis, TU Darmstadt, Darmstadt, Germany. 2010. [Google Scholar]
- Hydrology from Space. Lakes, Rivers and Wetlands Water Levels from Satellite Altimetry. Available online: http://www.legos.obs-mip.fr/soa/hydrologie/hydroweb/ (accessed on 8 January 2014).
- Cretaux, J.F.; Jelinski, W.; Calmant, S.; Kouraev, A.; Vuglinski, V.; Berge-Nguyen, M.; Gennero, M.C.; Nino, F.; del Rio, R.A.; Cazenave, A.; et al. SOLS: A lake database to monitor in the Near Real Time water level and storage variations from remote sensing data. Adv. Space Res 2011, 47, 1497–1507. [Google Scholar]
- USDA/FAS/OGA and NASA Global Agriculture Monitoring (GLAM) Project. Lake and Reservoir Surface Height Variations from the USDA’s Global Reservoir and Lake (GRLM). Available online: http://www.pecad.fas.usda.gov/cropexplorer/global_reservoir/ (accessed on 8 January 2014).
- Birkett, C.; Reynolds, C.; Beckley, B.; Doorn, B. From research to operations: The USDA global reservoir and lake monitor coastal altimetry. In Coastal Altimetry; Vignudelli, S., Kostianoy, A.G., Cipollini, P., Benveniste, J., Eds.; Springer: Berlin/Heidelberg, Germany, 2011; pp. 19–50. [Google Scholar]
- United States Geological Survey (USGS)/Earth Resources Observation Center (EROS). Available online: http://glovis.usgs.gov/ (accessed on 25 July 2014).
- Maxwell, S. Filling Landsat ETM+ SLC-off gaps using a segmentation model approach. Photogramm. Eng. Remote Sens 2004, 70, 1109–1112. [Google Scholar]
- Scaramuzza, P.; Micijevic, E.; Chander, G. Slc gap-filled products: Phase one methodology. Available online: http://landsat.usgs.gov/documents/SLC_Gap_Fill_Methodology.pdf (accessed on 8 August 2014).
- International Water Management Institute (IWMI). On-Line Climate Summary Service Model. Available online: http://wcatlas.iwmi.org/Default.asp (accessed on 25 July 2014).
- Penman, H.L. Natural evaporation from open water, bare soil, and grass. Proc. R. Soc. Lond. A 1948, 193, 120–145. [Google Scholar]
- Birkett, C.M.; Beckley, B. Investigating the performance of the Jason-2/OSTM radar altimeter over lakes and reservoirs. Mar. Geod 2010, 33, 204–238. [Google Scholar]
- Global Navigation Satellite System (GNSS). Available online : http://igscb.jpl.nasa.gov/network/complete.html (accessed on 6 June 2014).
- McFeeters, S. The use of the Normalized Difference Water Index (NDWI) in the delineation of open water features. Int.J. Remote Sens 1996, 17, 1425–1432. [Google Scholar]
- Xu, H. Modification of normalised difference water index (NDWI) to enhance open water features in remotely sensed imagery. Int. J. Remote Sens 2006, 27, 3025–3033. [Google Scholar]
- Muala, E. The Use of Satellite Altimetry for Water Resources Management: Case Study of the Nile Basin. Master’s Thesis, UNESCO-IHE, Delft, The Netherlands. 2012. [Google Scholar]
- Birkett, C.M.; Mertes, L.A.K.; Dunne, T.; Costa, M.H.; Jasinski, M.J. Surface water dynamics in the Amazon Basin: Application of satellite radar altimetry. J. Geophys. Res.: Atmos 2002, 107, 8059–8080. [Google Scholar]
- Duan, Z.; Bastiaanssen, W.G.M.; Muala, E. Icesat-derived water level variations of roseires reservoir (Sudan) in the Nile basin. Proceedings of the 2013 IEEE International Geoscience and Remote Sensing Symposium (IGARSS), Melbourne, VIC, Australia, 21–26 July 2013.
- Bastawesy, M.A.; Khalaf, F.I.; Arafat, S.M. The use of remote sensing and GIS for the estimation of water loss from Tushka lakes, southwestern desert, Egypt. J. Afr. Earth Sci 2008, 52, 73–80. [Google Scholar]


| Characteristics | Roseires Reservoir (Sudan) | Lake Nasser (Egypt) |
|---|---|---|
| Max length (km) | 80 | 500 |
| Max width (km) | 9 | 12 |
| Maximum depth (m) | 68 | 110 |
| Mean depth (m) | 50 | 70 |
| Reservoir area (km2) | 290 | 6000 |
| Water volume (km3) | 3 | 162 |
| Average annual inflow (km3/y) | 49 | 70 |
| Average residence time (y) | 0.06 | 2.30 |
| Major water uses | Irrigation, hydropower | Irrigation, hydropower |
| Study Areas | Dataset | Period | No.* | Interval | R2 | RMSE (m) | Shift Constant (m) | Mean Shifted Water Level (m) |
|---|---|---|---|---|---|---|---|---|
| Roseires | Hydroweb | 2002–2010 | 63 | monthly | 0.96 | 0.92 | −1.54 | 479.75 |
| Lake Nasser | Hydroweb | 1999–2002 | 89 | monthly | 0.81 | 0.72 | −0.12 | 176.89 |
| GRLM | 2005–2009 1999–2002 2005–2009 | 215 | 10-day | 0.94 | 0.62 | 179.43 | 177.12 |
*Refers to the number of data points used.
| No. | Altimetry Water Levels | Landsat TM/ETM+ Images | ||||
|---|---|---|---|---|---|---|
| Date | Original (m) | d (m) a | Date | Sensor | Area (km2) | |
| 1 | July 2009 | 473.09 | 0.02 | 14 September 2009 | ETM+ | 148.10 |
| 2 | August 2008 | 474.59 | 1.52 | 27 September 2008 | ETM+ | 162.00 |
| 3 | March 2010 | 477.93 | 4.87 | 9 March 2010 | ETM+ | 167.90 |
| 4 | April 2009 | 479.48 | 6.41 | 23 April 2009 | ETM+ | 175.70 |
| 5 | March 2009 | 480.80 | 7.74 | 22 March 2009 | ETM+ | 211.90 |
| 6 | February 2010 | 481.48 | 8.41 | 12 January 2010 | TM | 239.00 |
| 7 | March 2008 | 482.52 | 9.45 | 4 April 2008 | ETM+ | 217.30 |
| 8 | January 2010 | 483.68 | 10.61 | 4 January 2010 | ETM+ | 252.20 |
| 9 | November 2007 | 485.24 | 12.17 | 28 November 2007 | ETM+ | 246.60 |
“Original” is the original value obtained from Hydroweb.aThe water depth referred to above is lowest altimetry water level, hmin.
| Water Level Sources | No. | Altimetry Water Level | Landsat TM/ETM+ Images | ||||
|---|---|---|---|---|---|---|---|
| Date | Original (m) | d (m) a | Path 174 Row 44 | Path 175 Row 45 | Area (km2) | ||
| Hydroweb | 1 | July 2006 | 169.24 | 0.00 | 9 July 2006 | 16 July 2006 | 3846.08 |
| 2 | April 2006 | 172.94 | 3.70 | 20 April 2006 | 27 April 2006 | 4214.58 | |
| 3 | July 2002 | 174.88 | 5.64 | 12 June 2002 | 21 July 2002 | 4881.45 | |
| 4 | June 2002 | 176.07 | 6.84 | 12 June 2002 | 11 June 2002 | 5012.57 | |
| 5 | August 1999 | 176.31 | 7.07 | 7 August 1999 | 6 August 1999 | 4919.08 | |
| 6 | December 2002 | 177.40 | 8.16 | December 2002 | 28 December 2002 | 5102.32 | |
| 7 | March 2002 | 178.71 | 9.47 | 8 March 2002 | 15 March 2002 | 5476.42 | |
| 8 | September 2000 | 179.35 | 10.11 | 10 September 2000 | 9 September 2000 | 5274.76 | |
| 9 | November 1999 | 181.41 | 12.17 | 3 November 1999 | 10 November 1999 | 5998.30 | |
| GRLM | 1 | 12 July 2006 | −10.76 | 0.00 | 9 July 2006 | 16 July 2006 | 3846.08 |
| 2 | 4 May 2006 | −6.96 | 3.80 | 20 April 2006 | 27 April 2006 | 4214.58 | |
| 3 | 26 July 2002 | −4.17 | 6.59 | 12 June 2002 | 21 July 2002 | 4881.45 | |
| 4 | 10 August 1999 | −2.85 | 7.91 | 7 August 1999 | 6 August 1999 | 4919.08 | |
| 5 | 16 June 2002 | −2.69 | 8.07 | 12 June 2002 | 11 June 2002 | 5012.57 | |
| 6 | 16 April 2001 | −1.52 | 9.24 | 8 May 2001 | 13 April 2001 | 5177.57 | |
| 7 | 10 September 2000 | −0.94 | 9.82 | 10 September 2000 | 9 September 2000 | 5274.76 | |
| 8 | 19 March 2002 | −0.21 | 10.55 | 24 March 2002 | 15 March 2002 | 5476.42 | |
| 9 | 5 February 2001 | 0.11 | 10.87 | 5 March 2001 | 8 February 2001 | 5552.88 | |
| 10 | 17 November 1999 | 1.92 | 12.68 | 3 November 1999 | 10 November 1999 | 5998.30 | |
“Original” is the original value obtained from the satellite altimetry products.aThe water depth refers to above the lowest water level (hmin).
| Study Areas | Data | Period | No. * | Observedmean a | Estimatedmean a | R2 | RMSE a | %RMSE b |
|---|---|---|---|---|---|---|---|---|
| Roseires | Hydroweb | 2002–2010 | 63 | 3769 | 3833 | 0.99 | 652 | 17.79% |
| In situ data | " | 101 | 3792 | 3869 | 0.98 | 611 | 16.11% | |
| Lake Nasser | Hydroweb | 1999–2002 | 89 | 5467 | 4235 | 0.09 | 3826 | 69.98% |
| 2005–2009 | ||||||||
| In situ data | " | 89 | 5467 | 4127 | 0.26 | 3566 | 65.21% | |
| GRLM | 1999–2002 | 215 | 11,947 | 11,409 | 0.36 | 16,704 | 138.92% | |
| 2005–2009 | ||||||||
| In situ data | " | 215 | 11,947 | 11,358 | 0.37 | 16,416 | 137.41% |
*Refers to the number of datasets used.aMm3/month for Hydroweb and in situ data and Mm3/10-day for GRLM and in situ data. Observedmean is the mean of the observed discharges, and Estimatedmean is the mean of the estimated discharges.bPercentage of the RMSE relative to the mean observed data, i.e., (RMSE/the mean observed discharge) × 100%.
© 2014 by the authors; licensee MDPI, Basel, Switzerland This article is an open access article distributed under the terms and conditions of the Creative Commons Attribution license (http://creativecommons.org/licenses/by/3.0/).
Share and Cite
Muala, E.; Mohamed, Y.A.; Duan, Z.; Van der Zaag, P. Estimation of Reservoir Discharges from Lake Nasser and Roseires Reservoir in the Nile Basin Using Satellite Altimetry and Imagery Data. Remote Sens. 2014, 6, 7522-7545. https://doi.org/10.3390/rs6087522
Muala E, Mohamed YA, Duan Z, Van der Zaag P. Estimation of Reservoir Discharges from Lake Nasser and Roseires Reservoir in the Nile Basin Using Satellite Altimetry and Imagery Data. Remote Sensing. 2014; 6(8):7522-7545. https://doi.org/10.3390/rs6087522
Chicago/Turabian StyleMuala, Eric, Yasir A. Mohamed, Zheng Duan, and Pieter Van der Zaag. 2014. "Estimation of Reservoir Discharges from Lake Nasser and Roseires Reservoir in the Nile Basin Using Satellite Altimetry and Imagery Data" Remote Sensing 6, no. 8: 7522-7545. https://doi.org/10.3390/rs6087522