Inversion of Aerosol Optical Depth Based on the CCD and IRS Sensors on the HJ-1 Satellites


Abstract
: To perform a high-resolution aerosol optical depth (AOD) inversion from the HJ-1 satellites, a dark pixel algorithm utilizing the HJ-1 satellite data was developed based on the Moderate-Resolution Imaging Spectroradiometer (MODIS) algorithm. By analyzing the relationship between the apparent reflectance from the 1.65 μm and 2.1 μm channels of MODIS, a method for estimating albedo using the 1.65 μm channel data of the HJ-1 satellites was established, and a high-resolution AOD inversion in the Chengdu region based on the HJ-1 satellite was completed. A comparison of the inversion results with CE318 measured data produced a correlation of 0.957, respectively, with an absolute error of 0.106. An analysis of the AOD inversion results from different aerosol models showed that the rural aerosol model was suitable as a general model for establishing an aerosol inversion look-up table for the Chengdu region.
1. Introduction
Aerosols have had a significant impact on the global climate and environment by altering the atmospheric radiation balance, resulting in global climate change. In addition, aerosols have also had an important influence on human environments. Aerosols are one of the main components of atmospheric pollution [1–5]. Due to the large temporal and spatial scale characteristics, satellite remote sensing can be used for aerosol monitoring. Aerosol optical depth (AOD) is a common monitoring indicator of aerosols in the atmosphere. However, AOD inversion using satellite remote-sensing data presents two problems: Removing the contribution from surface reflection, i.e., separating the atmosphere from the surface and determining the appropriate aerosol models [6–8]. Utilizing the CE318 solar photometer to measure the Ångström exponent of aerosols, complex refractive index, and spectrum distribution of aerosol particles, ground-based observations are the commonly used method for determining the aerosol model [9,10]. As for removing the contribution from surface reflection, there are different solutions for different satellite sensors, such as the multi-angle polarization method for the Polarization and Directionality of the Earth’s Reflectances/Polarization & Anisotropy of Reflectances for Atmospheric Sciences coupled with Observations from Lidar (POLDER/PARASOL) satellites [11], the structure function method for Thematic Mapper (TM) and Advanced Very High Resolution Radiometer (AVHRR) data [12,13], and bright target algorithms based on albedo database [14,15]. The dark target algorithm is one of the common methods for removing the contribution from surface reflection for Moderate-Resolution Imaging Spectroradiometer (MODIS) data [6–8,16–18], which is the operational aerosol inversion algorithm used by the National Aeronautics and Space Administration (NASA).
The dark target algorithm [19] for MODIS data primarily uses the linear relationship between the apparent reflectance (the reflectance measured by the satellite sensor at the top of the atmosphere) data from the 2.1 μm channel and the surface albedo of the red/blue channels in the dark target area to remove the contribution from surface reflection in the red/blue channels. The AOD inversion result has high precision but has low spatial resolution, so this method is not well suited for intense aerosol monitoring. The HJ-1 satellite system is approved by the State Council of the People’s Republic of China and is dedicated to the ground environment and disaster monitoring. The HJ-1 satellite system consists of two optical satellites (HJ-1A and HJ-1B), which can conduct all-weather and all-day monitoring with a high resolution to detect environmental change in China over a wide range, and the joint observation of the two satellites can achieve a revisit cycle every two days. Therefore, HJ-1 satellite system is of great importance in regional remote sensing. A common method of performing aerosol inversion for the HJ-1 satellite data is to use the normalized differential vegetation index (NDVI) to determine the dark pixels and then to retrieve the AOD according to the red/blue channel ratio in specific land-cover types, assuming that the dark pixels are homogenous land cover [20]. However, this method has limitations that affect the accuracy of the inversion results. The NDVI value is easily affected by the atmosphere, and when the AOD is high, the NDVI values will decrease sharply in the same area. Therefore, it is difficult to ensure the accuracy of the dark pixel determination. When the AOD increases, the contribution of albedo relatively decreases, especially in the contaminant spreading process. During this process, the difference between polluted areas and unpolluted areas is clear, so the visible channels of remote sensing images for polluted areas are primarily aerosols, whereas the visible channels for unpolluted areas are primarily surface. Although the dark pixels can be determined by lowering the threshold of the NDVI, the accuracy of the dark pixels cannot be guaranteed, and non-dark pixels might be identified as dark pixels. In addition, dark pixels are not identical, and there may be immense differences between different dark pixel types. If the assumed dark pixel type differs greatly from the actual dark pixel type, the albedo estimation for the visible bands will have a large error [21,22]. As shown in Table 1, the rice field albedo in the red/blue channel is far higher than that of other land covers, but the corresponding NDVI is much lower than that of other land covers. Therefore, if there is an area of rice cultivation in the remote-sensing images, the ranges of the AOD inversion in this region will be affected. Clearly, methods that employ NDVI for the determination of dark pixels have significant limitations in AOD inversion.
An infrared sensor camera (IRS) is carried on the HJ-1B satellite (see the sensor parameters in Table 2). Compared to the MODIS satellite, the HJ-1 satellites have infrared channels but do not include a 2.1 μm channel, so no AOD inversion using the IRS data of HJ-1 satellites have been performed. We used the charge-coupled device (CCD) and IRS data of the HJ-1 satellites to resolve the two primary problems related to performing AOD inversion and realize AOD inversion in the Chengdu region.
2. Inversion Principle and Method
2.1. Basic Principle
The inversion process in the dark target algorithm [19] for MODIS data primarily involves the expansion of the apparent reflectance expression:
Because the albedos in MODIS’s channel 1 (0.62–0.67 μm) and channel 3 (0.46–0.48 μm) are linearly correlated with the apparent reflectance in channel 7 (2.10–2.15 μm) for dense vegetation areas and dark soil areas (dark pixel areas), they are less susceptible to the effects of atmospheric aerosol. By studying a significant amount of data for multiple land covers, Kaufman et al. established the relationship between albedo in the red/blue channel and apparent reflectance in the middle infrared channel (2.1 μm) [7]:
From this Equation, we can retrieve the albedo for the red/blue channel.
The three parameters ρ0, S and T(μs) · T(μv) are functions of the AOD. In combination with the 6S radiation transportation model, the relationship between the AOD and its corresponding parameters are calculated and AOD lookup table is established. The geometry information is then read from observations collected from the satellite data, and the observations that are close or equal to the geometry parameters in the lookup table are selected. The corresponding multiple sets are obtained by selecting those that are close or equal to the lookup table of observation geometry parameters. After obtaining the corresponding multiple sets of ρ0, S and T(μs) · T(μv) parameters, the parameters ρ0, S, T(μs) · T(μv) and ρs should be substituted into Equation (1) to calculate the multiple sets of red/blue band apparent reflectances. By comparing the calculated results with the actual apparent reflectance in the red/blue channel of the satellite, the AOD corresponding to the set of parameters that are closest to the actual apparent reflectance is used as the AOD of the pixel.
The AOD inversion in the MODIS data is used to determine the dark pixels based on the apparent reflectance in the 2.1 μm channel, which is not susceptible to the effects of atmosphere. The method to determine the albedo in the red/blue channel is derived based on the linear relationship of the apparent reflectance of 2.1 μm channel and the albedo in the red/blue channel. Kaufman found that the difference between each dark pixel of land cover is not obvious in the curve fitting [7]; thus, there is no need to differentiate different surface dark pixel types.
2.2. Estimated Albedo in the Blue Channel from the HJ-1B Satellite
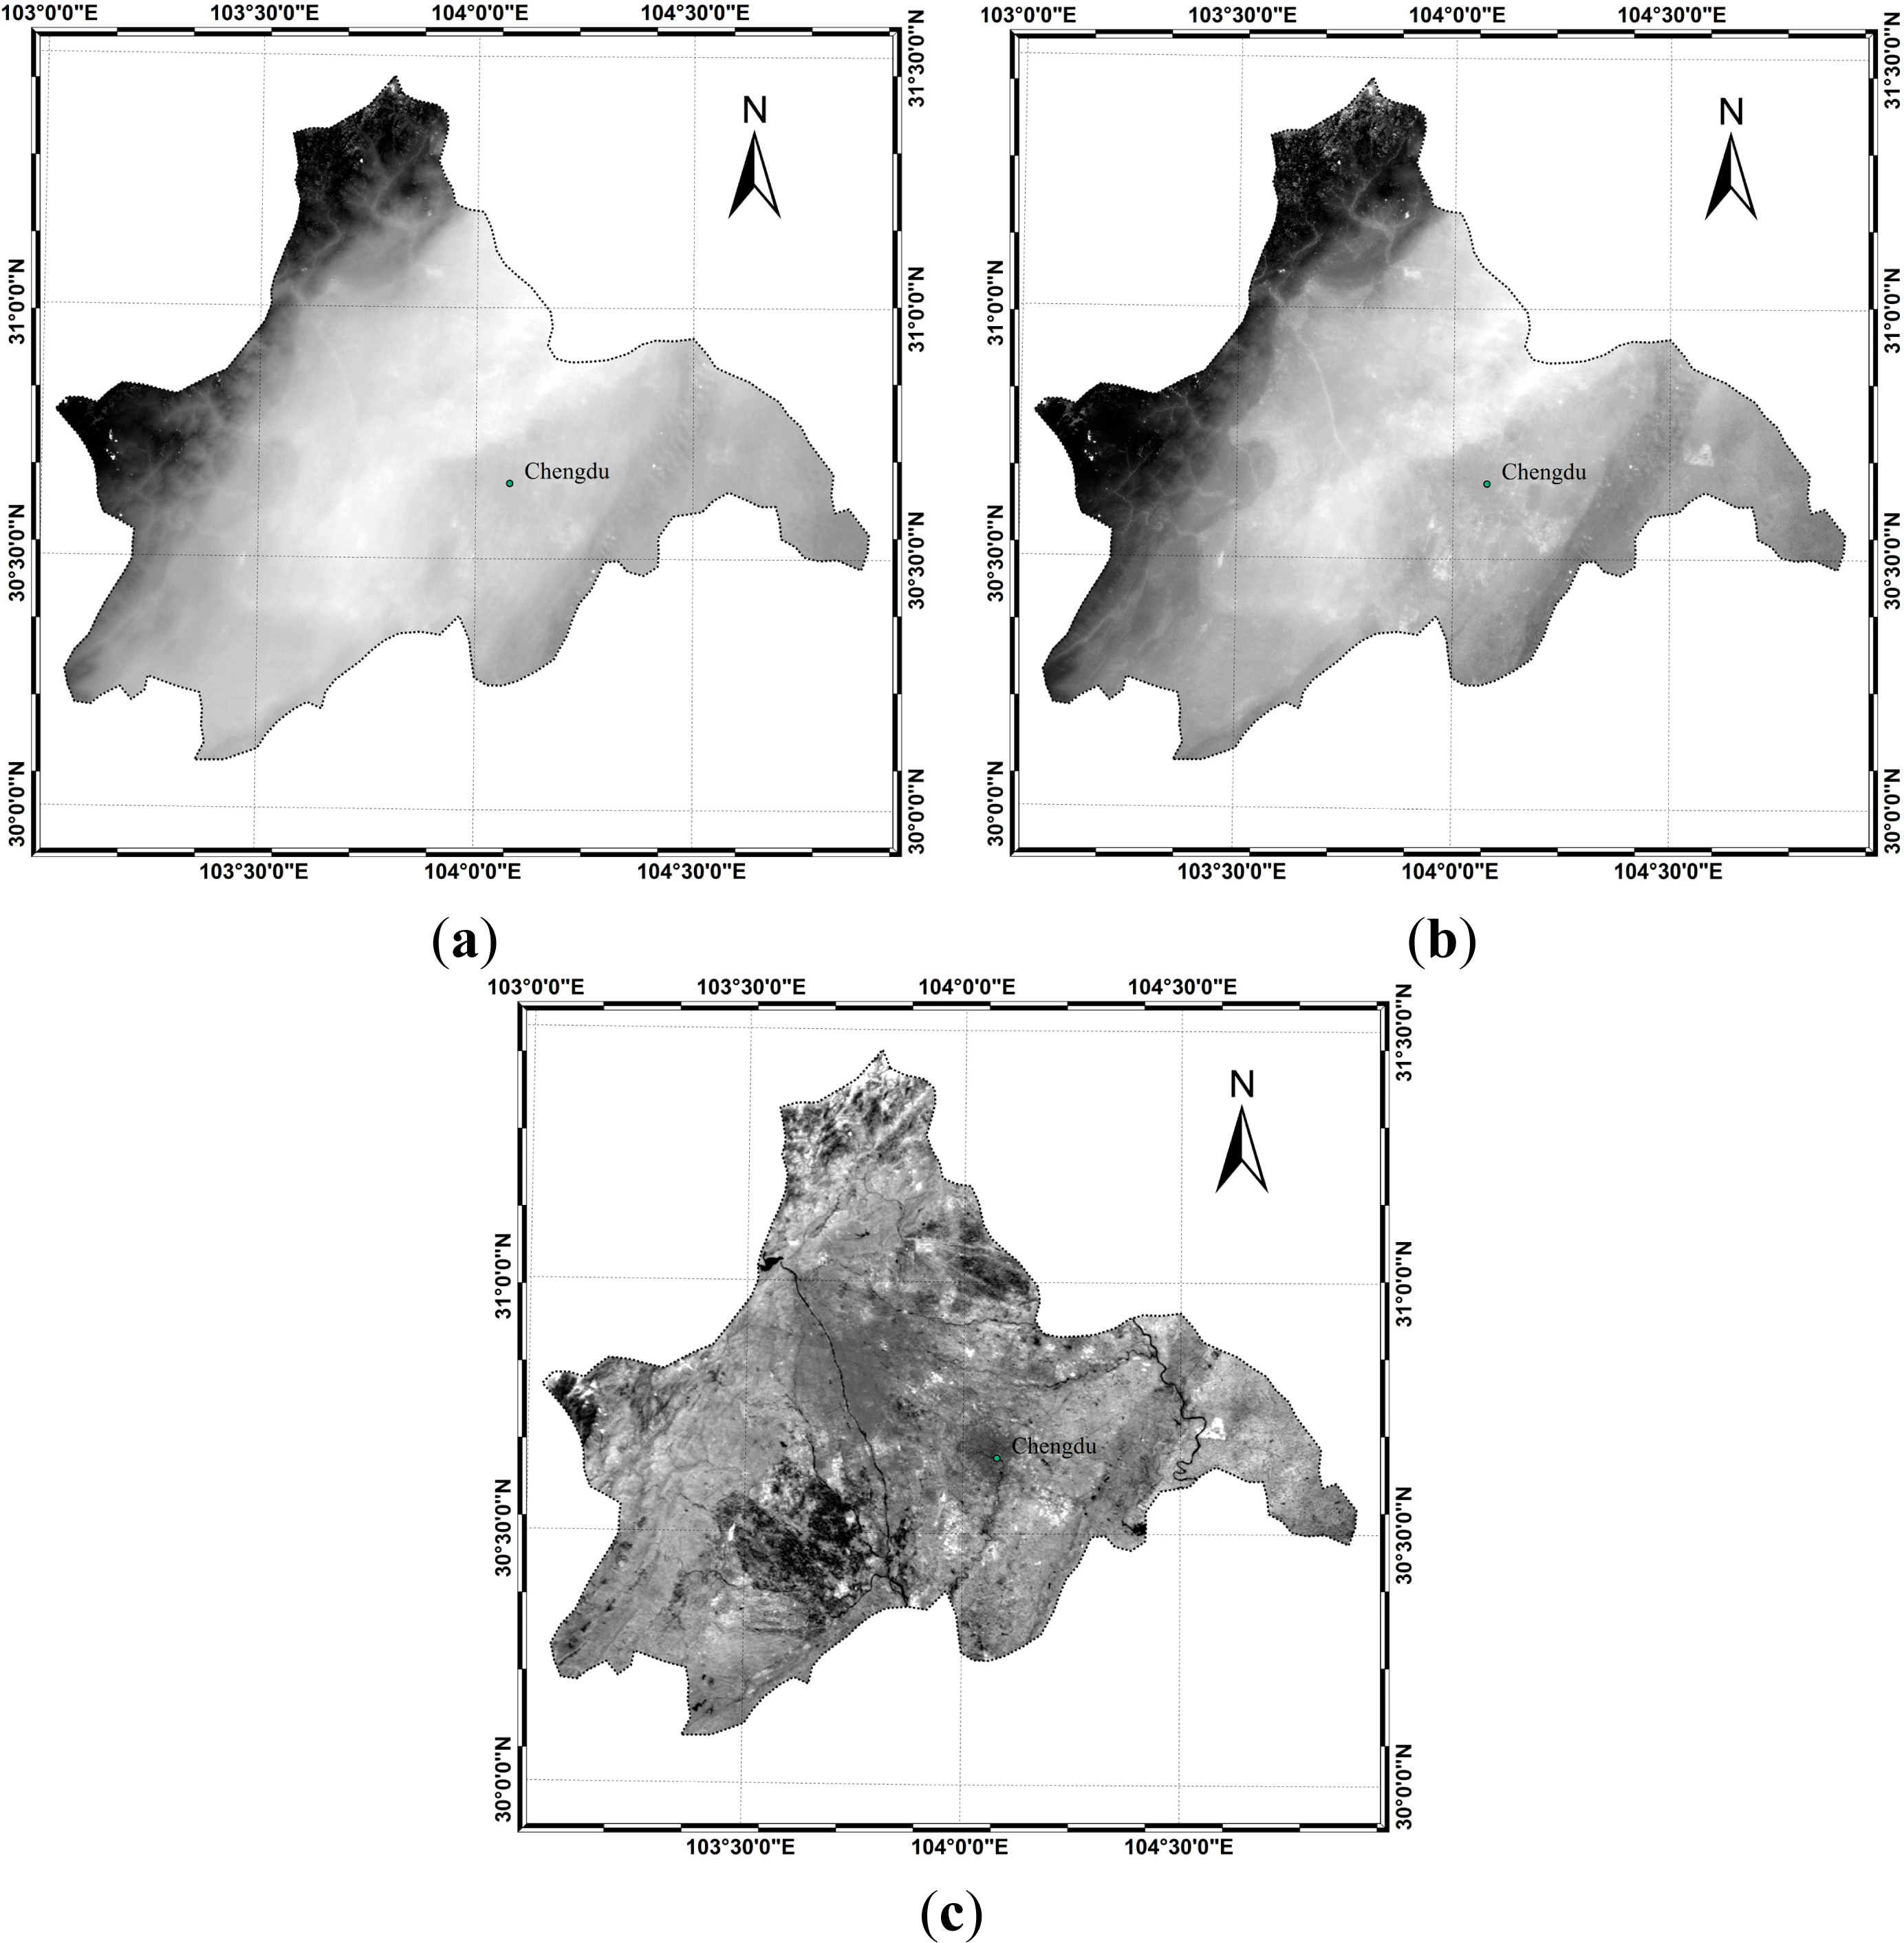
The MODIS satellite and IRS sensor both have a 1.65 μm channel. If we assume that there is a certain functional relationship between the apparent reflectance of the 2.1 μm channel and 1.65 μm channel, then it is possible to retrieve the red/blue channel albedo using the 1.65 μm channel and then to retrieve the AOD. A comparison between the red/blue channels and 1.65 μm channel images (Figure 1) suggests that the red channel is more significantly affected by the atmosphere than the blue channel. The 1.65 μm channel of the HJ-1 satellites provides an accurate reflection of the land-cover information that is less influenced by aerosol information, so it is possible to estimate the red/blue channel albedo using the 1.65 μm channel.
To confirm that the 1.65 μm channel is less affected by aerosols, the effects of aerosol information on the 1.65 μm channel is validated by mutual authentication in terms of aerosol sensitivity between the 1.65 μm channel and 2.1 μm channel. Through simulating a relationship between the apparent reflectance variation (1.65 μm channel and 2.1 μm channel) and the changes of albedo and AOD (Table 3) using the 6S radiation transportation model, it can be seen that the apparent reflectance changes along with the AOD in both the MODIS 1.65 μm/2.1 μm channels and HJ-1 1.65 μm channel. The apparent reflectance received by satellites is primarily from albedo, and the changing tendency of the 1.65 μm channel and 2.1 μm channel apparent reflectance is close to that of the AOD. Therefore, the 1.65 μm channel is often only weakly sensitive to the aerosol information.
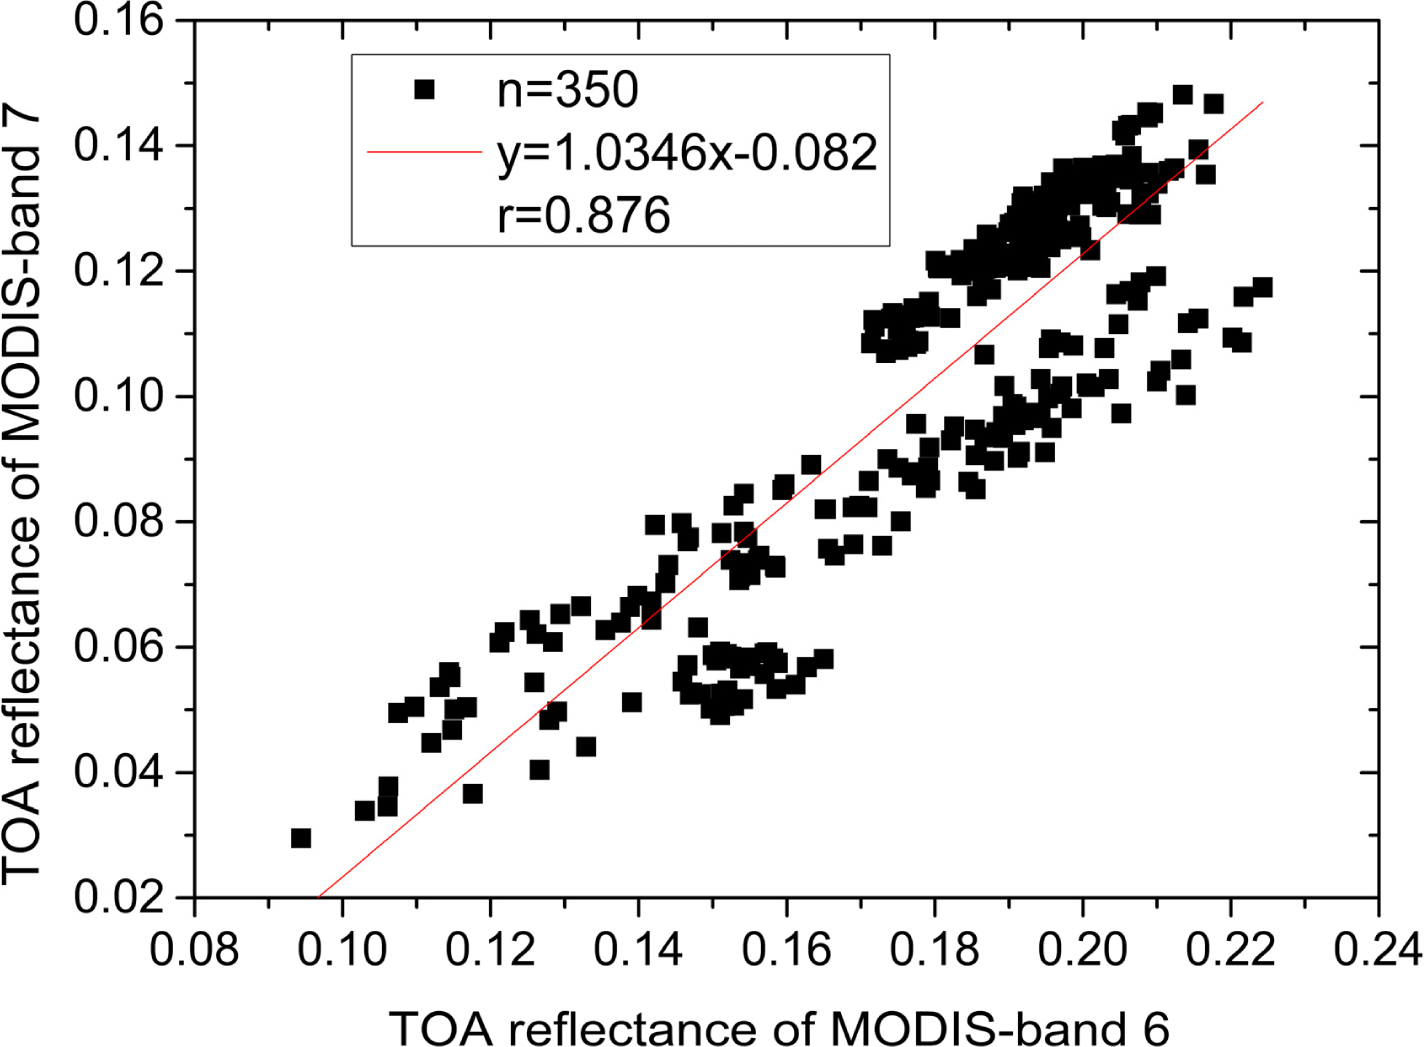
To reduce the impact of mixed pixels, Google Earth was used to locate dense vegetation areas, and the apparent reflectance in the dense vegetation area that had the same field of view as the 1.65 μm channel and 2.1 μm channel in MODIS satellite data (MOD02HKM data) was selected. A linear relationship was found between the apparent reflectance in the MODIS visible 1.65 μm channel and 2.1 μm channel dark pixels. In the 0 < < 0.15 area, the fitting relationship was , with an R value of 0.876 (Figure 2). Hence, the characteristics of the reflection spectra for dense vegetation areas were close to each other. Combined with the information in Table 3, although and were equal to 0.25, the aerosol effects and were at most 0.06. Therefore, combined with Equation (2), the estimation error of the red/blue channel albedo using the 1.65 μm channel was at most 0.03/0.015, and combined with the fitting relation, the estimation error of the red/blue channel albedo by the 1.65 μm channel was at most 0.04/0.02. However, when = 0.25, the red/blue channel albedo was rarely present in the 1.65 μm channel or 2.1 μm channel and did not even exist in dark pixel areas. Therefore, in this paper, the red/blue channel albedo in the dark pixel area was estimated using the fitting relationship above and Equation (2).
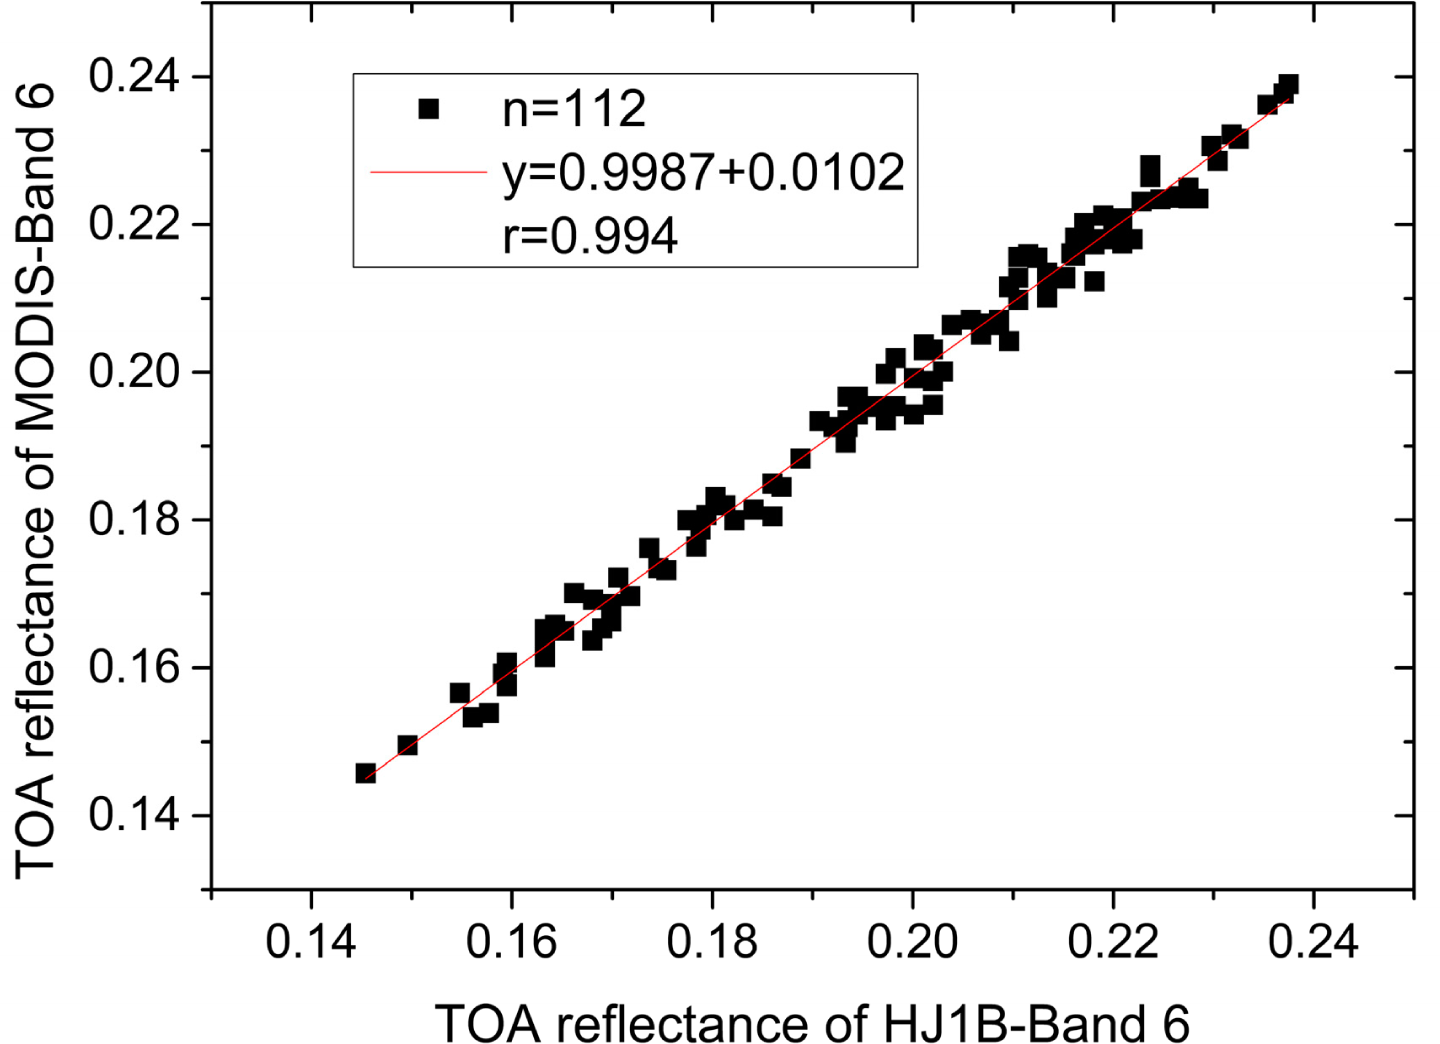
Based on the analysis above, the land cover reflection spectra of the dark pixels in the 1.65 μm channel and 2.1 μm channel of MODIS were consistent with the sensitivity of aerosol, which means that these two channels exhibited similar aerosol information. Therefore, the red/blue channel albedo in the dark pixel areas could be obtained, which was used to retrieve AOD. To explore the difference of the 1.65 μm channel between the MODIS and HJ-1 satellites, data with the same date and similar time period were selected. The HJ-1B data were resampled in accordance with the MOD02HKM data in terms of spatial resolution (500 m) to reduce the error caused by resampling. The apparent reflectance samples were randomly chosen from the 1.65 μm channel for both the MODIS and HJ-1B satellites, and the correlation coefficient was 0.994 (Figure 3). The fitting relation was ; the minor difference between the two sets of data may have been caused by the scaling parameter, central wavelength, spectral range, and resampling method.
In the present inversion algorithm, the fitting relationship was integrated to estimate the blue channel albedo using the IRS sensor’s 1.65 μm channel on the HJ-1B satellite. The red/blue channel albedo estimated using this method was consistent with the characteristics of the MODIS red/blue channel, but because the red/blue channel spectral response was not consistent with MODIS, the estimated albedo needed to be corrected. Previous research results (Table 4) were used along with the corrected relationship between the MODIS and HJ-1 blue channel albedo to estimate the HJ-1B blue channel albedo [23]. Because the albedo of the red channel could not be corrected, the AOD inversion in this paper was performed by using the blue channel of the CCD and 1.65 μm channel of the IRS.
Because the quantitative albedo estimation of remote sensing is a difficult problem, we assumed that the blue channel albedo in the 2.1 μm channel was the actual albedo and estimated the blue channel albedo using the 1.65 μm channel of the HJ-1 satellites and 2.1 μm channel of the MODIS satellite. A comparison of these blue channel albedos from the two channels showed that the error of the blue channel albedo using the HJ-1 1.65 μm channel was within 0.01, with a standard deviation of 0.003 (Figure 4). By combining the information from Table 3 and considering the influence of aerosol particles on the apparent reflectance from the 1.65 μm channel of the HJ-1 satellites, the blue channel maximum albedo that was affected by the apparent reflectance of the aerosol particles (0.02) was input into the calculation of the standard error, and the error range was expanded to 0.025 to calculate the possible AOD inversion errors caused by albedo. The differences in the AOD inversions caused by the albedo in subsections within the error range were then calculated. As shown in Figure 5, the AOD inversion estimation error changed linearly with changes in the albedo estimation; when Δρ = 0.01, the mean error of the AOD inversion was 0.13 (Table 5). These results are consistent with those of Kaufman et al. [6–8].
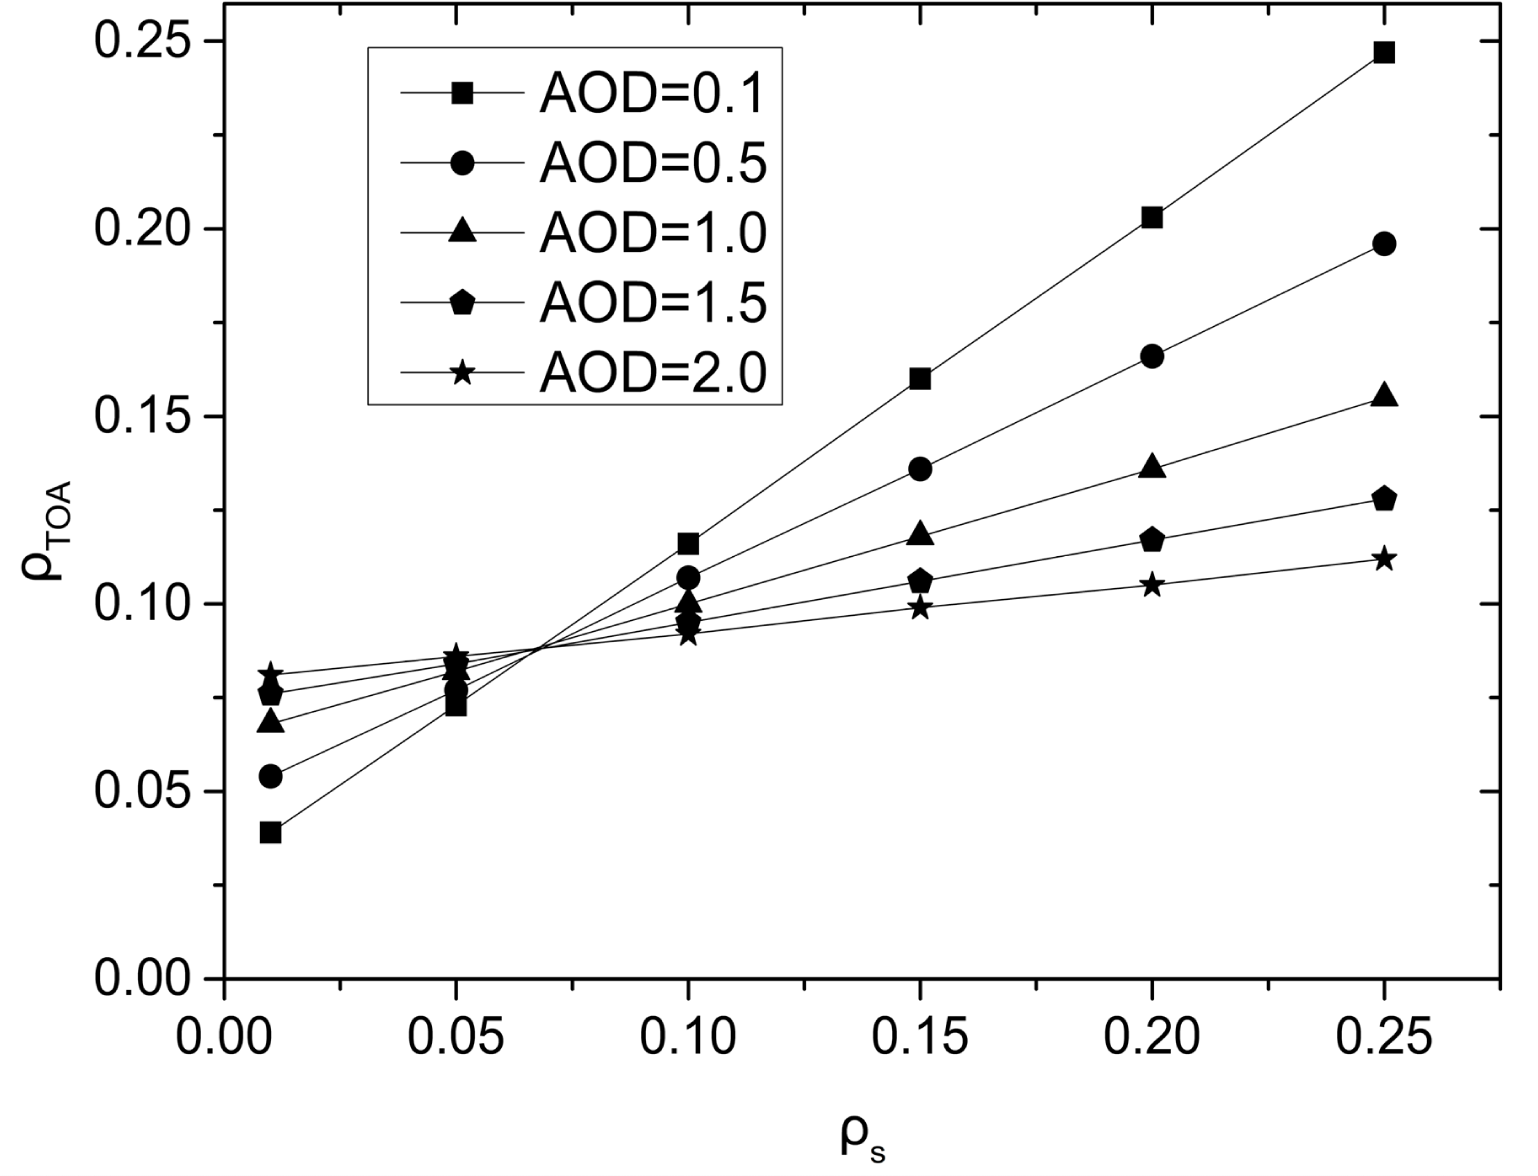
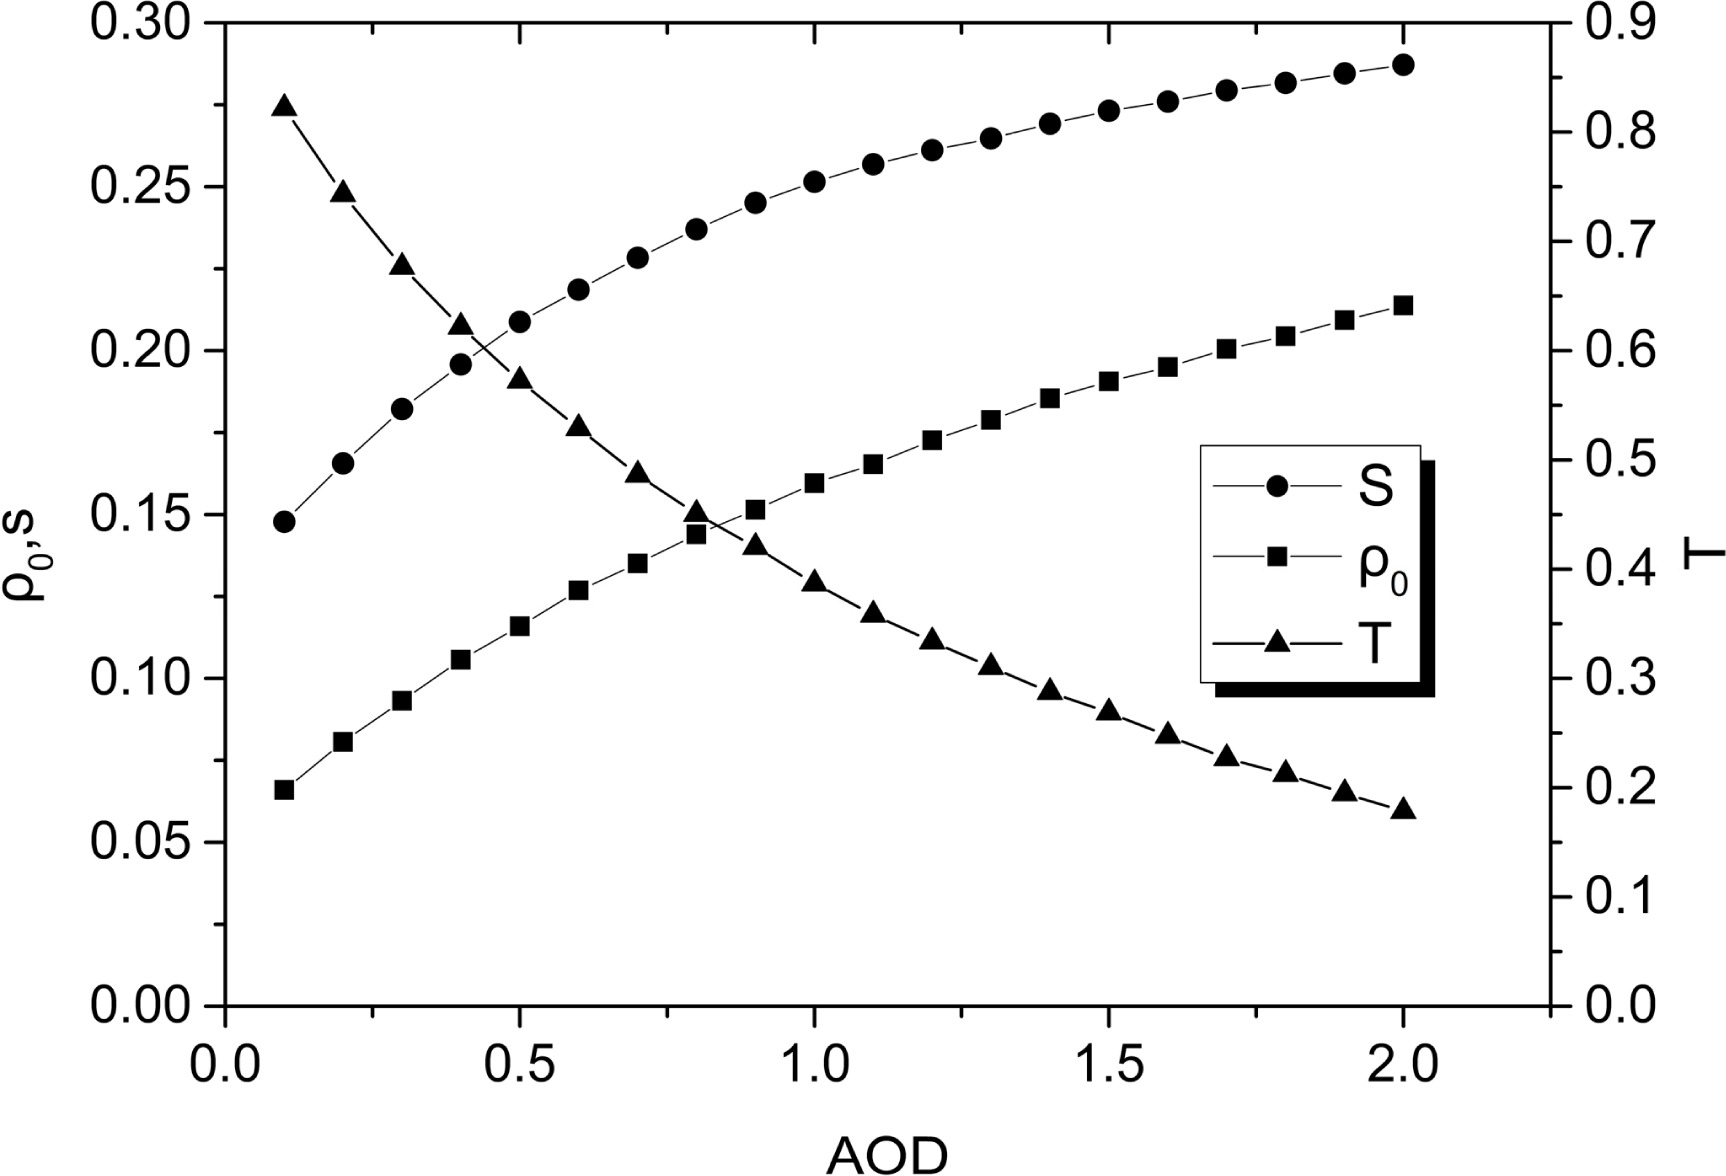
However, there was a large difference in the influence of Δρ on different pixels. In the albedo change interval of 0.001 to 0.025, the minimum impact of Δρ on different pixels for the AOD inversion was not more than 0.02, and the maximum impact gradually increased from 0.027 to 0.469. By comparing multiple inversion images, the maximum influenced pixel area was found to primarily correspond to the lower value area of the AOD inversion, which means that the AOD inversion error decreased as the AOD increased because of the principle of AOD inversion. In Equation (1), the three parameters ρ0, S and T(μs) · T(μv) are all functions related to the AOD. To discuss the influence of variations in these three parameters on the estimation of the blue channel ρTOA, we used the method of simulating the change of ρTOA with ρs and AOD. We set ρs at 0.01, 0.05, 0.1, 0.15, 0.2 and 0.25, using the 6S model to input the different AOD at 550 nm to calculate the corresponding aerosol parameters: ρ0, S and T(μs) · T(μv). As shown in Figure 6, when AOD = 0.1, the ρTOA value increased from 0.039 to 0.247 along with ρs, and the amplitude of increase was 533.33%; when AOD = 0.2, the ρTOA value increases from 0.081 to 0.112 along with ρs, and the amplitude of increase was only 38.27%. These data show that that the increase in amplitude of ρTOA along with ρs decreases as AOD increases. This result may be explained by analyzing the relationship between AOD and ρ0, S and T(μs) · T(μv). The 6S model was used to calculate ρ0, S, and T(μs) · T(μv) according to different AODs, and the AOD varied from 0.1 to 2.0 with a step-size of 0.1. As shown in Figure 7, as the AOD increased, the ρ0 value increased gradually, and the increase in amplitude dropped gradually and finally became level; the range of variation was ρ0 ∈ (0.07, 0.21). As the AOD increased, the S value increased gradually, and the increase in amplitude declined gradually and finally became level; the range of variation was S ∈ (0.15, 0.29). As the AOD increased, the T(μs) · T(μv) value decreased gradually, and the decrease in amplitude dropped gradually and finally became level; the range of variation was T(μs) · T(μv) ∈ (0.85, 0.15). Considering the variation range of the three parameters, the change range of T(μs) · T(μv) was clearly greater than those of ρ0 and S, and the ranges of ρ0 and S were similar. Therefore, for δ ρ in Equation (1), along with an increase of the AOD, the effect of T(μs) · T(μv) was greater than that of S, which means that the increased amplitude of the numerator was greater than that of the denominator and the entire fraction value was reduced. The value of ρ0 increased gradually as AOD increased and contributed to the ρTOA value. Therefore, variations in the three parameters ρ0, S, and T(μs) · T(μv) will ultimately cause the contribution of albedo ρs in the calculated ρTOA to decrease as AOD increases, whereas the contribution of ρ0 becomes larger. The whole process could be viewed as follows: As AOD increases, the blocking effect of the atmospheric particles, including the effect of aerosols on albedo signals, increases and the satellite receives an increasing amount of solar radiation scattered by aerosols. This hypothesis also explains the phenomenon that the influence of albedo estimation error on the low-AOD area is larger than that on the high-AOD area.
2.3. Establishment of the Lookup Table
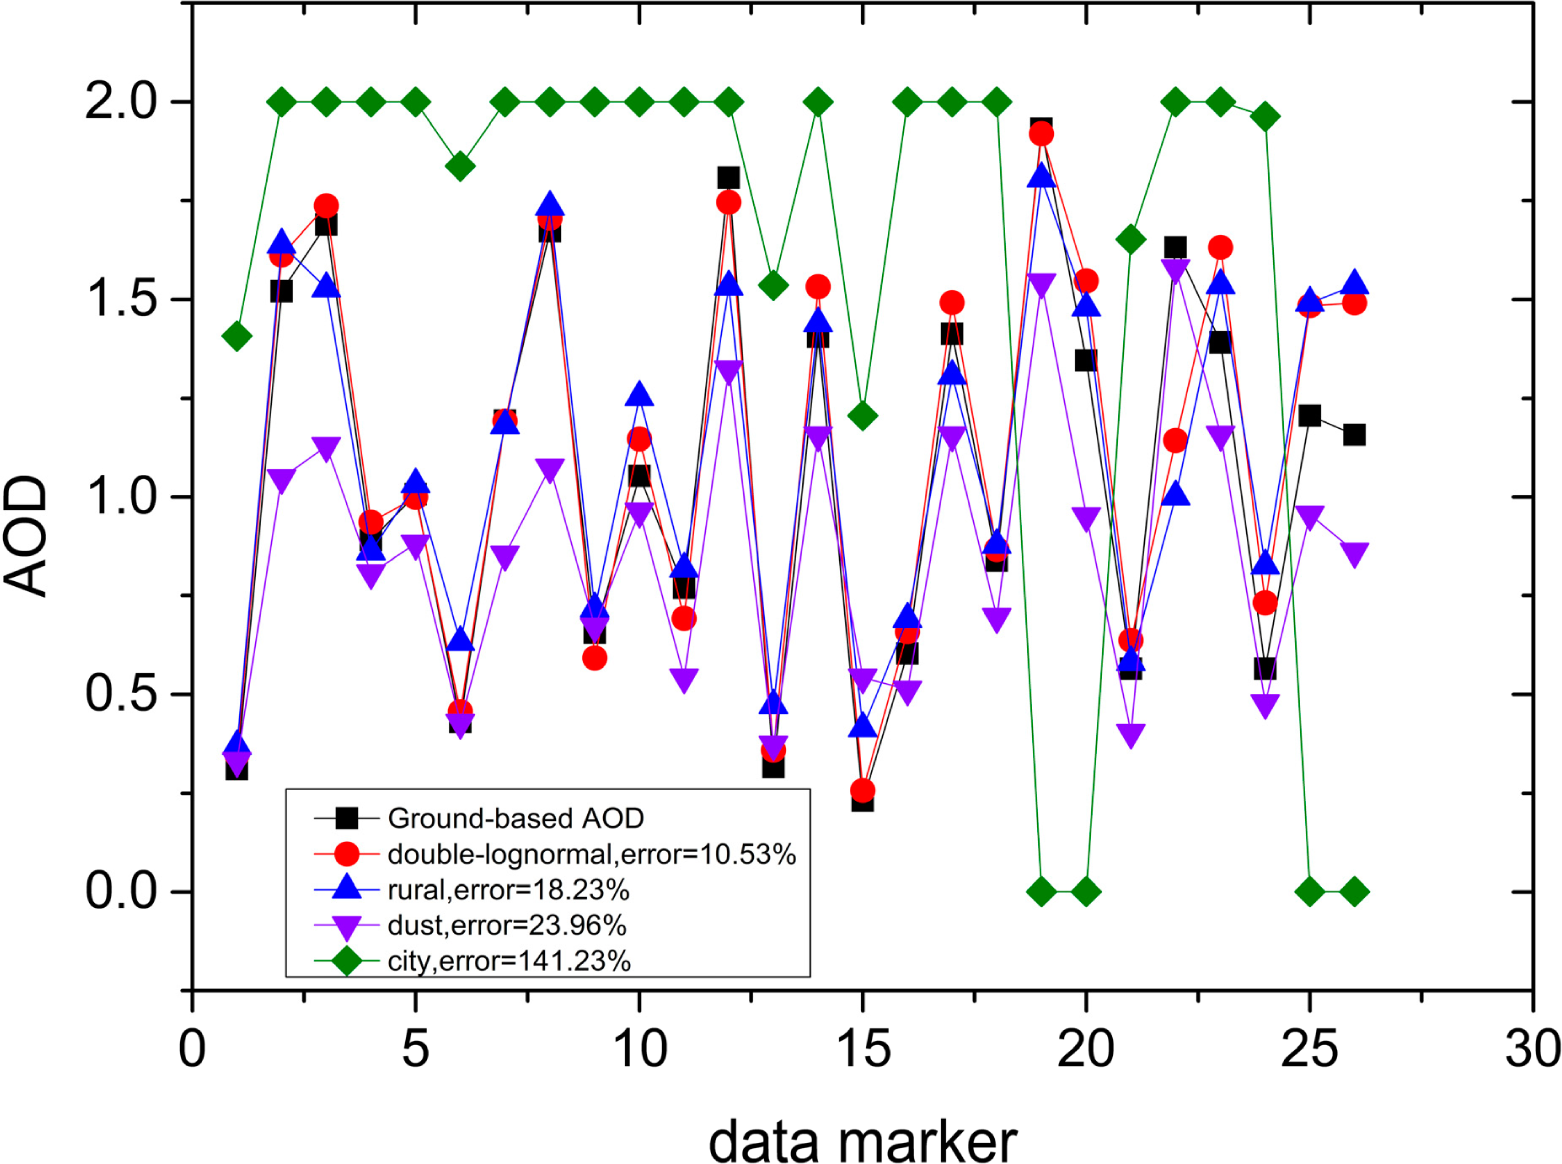
The aerosol model must be identified prior to establishing a lookup table. In this paper, because of the lack of a long time series of Ångström exponent, complex refractive indices, and aerosol particle distribution data in the Chengdu region, it was difficult to define a unified standard for the aerosol model in Chengdu. However, according to the measurement data of 8 months of a CE318 solar photometer installed at the Chengdu University of Information Technology, we assume a double-lognormal size distribution for Chengdu. The AOD values were set as 0, 0.25, 0.5, 0.75, 1.25, 1.5 and 2.0, and there were thirteen solar zenith angles (0°–72°, step 6°), seven sensor zenith angles (0°–42°, step 7°) and sixteen relative azimuth angles (0°–180°, step 12°). The remaining AOD values and observational geometric parameters were calculated by linear interpolation. Then, a 6s model was used to input the above parameters and the corresponding channel spectral response function of the HJ-1 satellites to establish the AOD inversion lookup table for Chengdu. However, the aerosol model is a problem worth studying. In order to discuss this problem, the double-lognormal size distribution aerosol model, rural aerosol model, dust aerosol model, and city aerosol model were separately used to establish lookup tables. The parameters in the double-lognormal size distribution aerosol model were from the CE318 observation data, and the parameters in the other three aerosol models were the default settings of the 6S model, while all the other parameters were the same for the four lookup tables. Using the four lookup tables, we implemented the AOD inversion in the same images and compared the results using the CE318 measurements as the standard. According to Figure 8, the AOD inversion using the double-lognormal size distribution aerosol model with CE318 data had the highest precision, with an average error of 10.53% and smaller gap. The rural aerosol model had the next-highest precision, with an average error of 18.23% and small gap. The average error using the dust aerosol model was 23.96%, and the inversion results were similar when the AOD was low. However, when AOD > 1.0, the overall inversion value was low. The AOD inversion using the city aerosol model was significantly different, with an average error of 141.23%, and numerous inversion values reached the maximum value of 2.0 in the lookup table. If the maximum value set for the AOD became larger, the error of the AOD inversion increased sharply, so the city aerosol model was not suitable for the AOD inversion in Chengdu. From the analysis above, the rural aerosol model was suitable for AOD inversion in Chengdu in the absence of the CE318 observation data and without sudden events.
2.4. Inversion Process
This paper uses the HJ-1B satellite CCD camera and IRS sensor and adopts the 1.65 μm channel to estimate the blue channel albedo to invert the AOD for dark object areas. The inversion steps are listed below.
2.4.1. Data Preprocessing
Before the AOD inversion, the CCD and IRS data needed to be preprocessed, which primarily included radiation calibration and vector cutting operations. For the radiation calibration, the calibration parameters inside the XML metadata file were directly used to convert the digital number (DN) value to radiation brightness and then convert the radiation brightness into apparent reflectance. When radiation brightness was converted to apparent reflectance, the average solar apparent emissivity corresponding to the wavelengths was required [24]:
However, the Ministry of Environmental Protection of China only releases the average solar apparent emissivity of the CCD sensor and does not release the average solar apparent emissivity of the IRS sensor. Therefore, using the 6S model and spectral response function of the IRS sensor’s 1.65 μm channel as input, we calculated the average apparent solar radiation as 231.16 W/m2·μm. Inputting this value to Equation (3), the apparent reflectance in the 1.65 μm channel was then calculated. The apparent reflectance in the other channels was directly calculated using the parameters released by the Ministry of Environmental Protection.
2.4.2. Selection of Inversion Pixels
In this paper, however, the linear relationship between the apparent reflectance in the 1.65 μm channel and 2.1 μm channel is only valid when < 0.15 because 0.15 is the threshold for the dark pixel determination in the 2.1 μm channel. The dark pixels generally refer to dense vegetation, and their correlation with the vegetation reflectance spectra influences the correlation between the reflection characteristics of the 1.65 μm and 2.1 μm channels. According to the linear relationship between these two channels combined with the information in Table 3, the atmospheric influence on the apparent reflectance in the 1.65 μm channel could be determined, and the determination condition of the dark pixels was set as < 0.25.
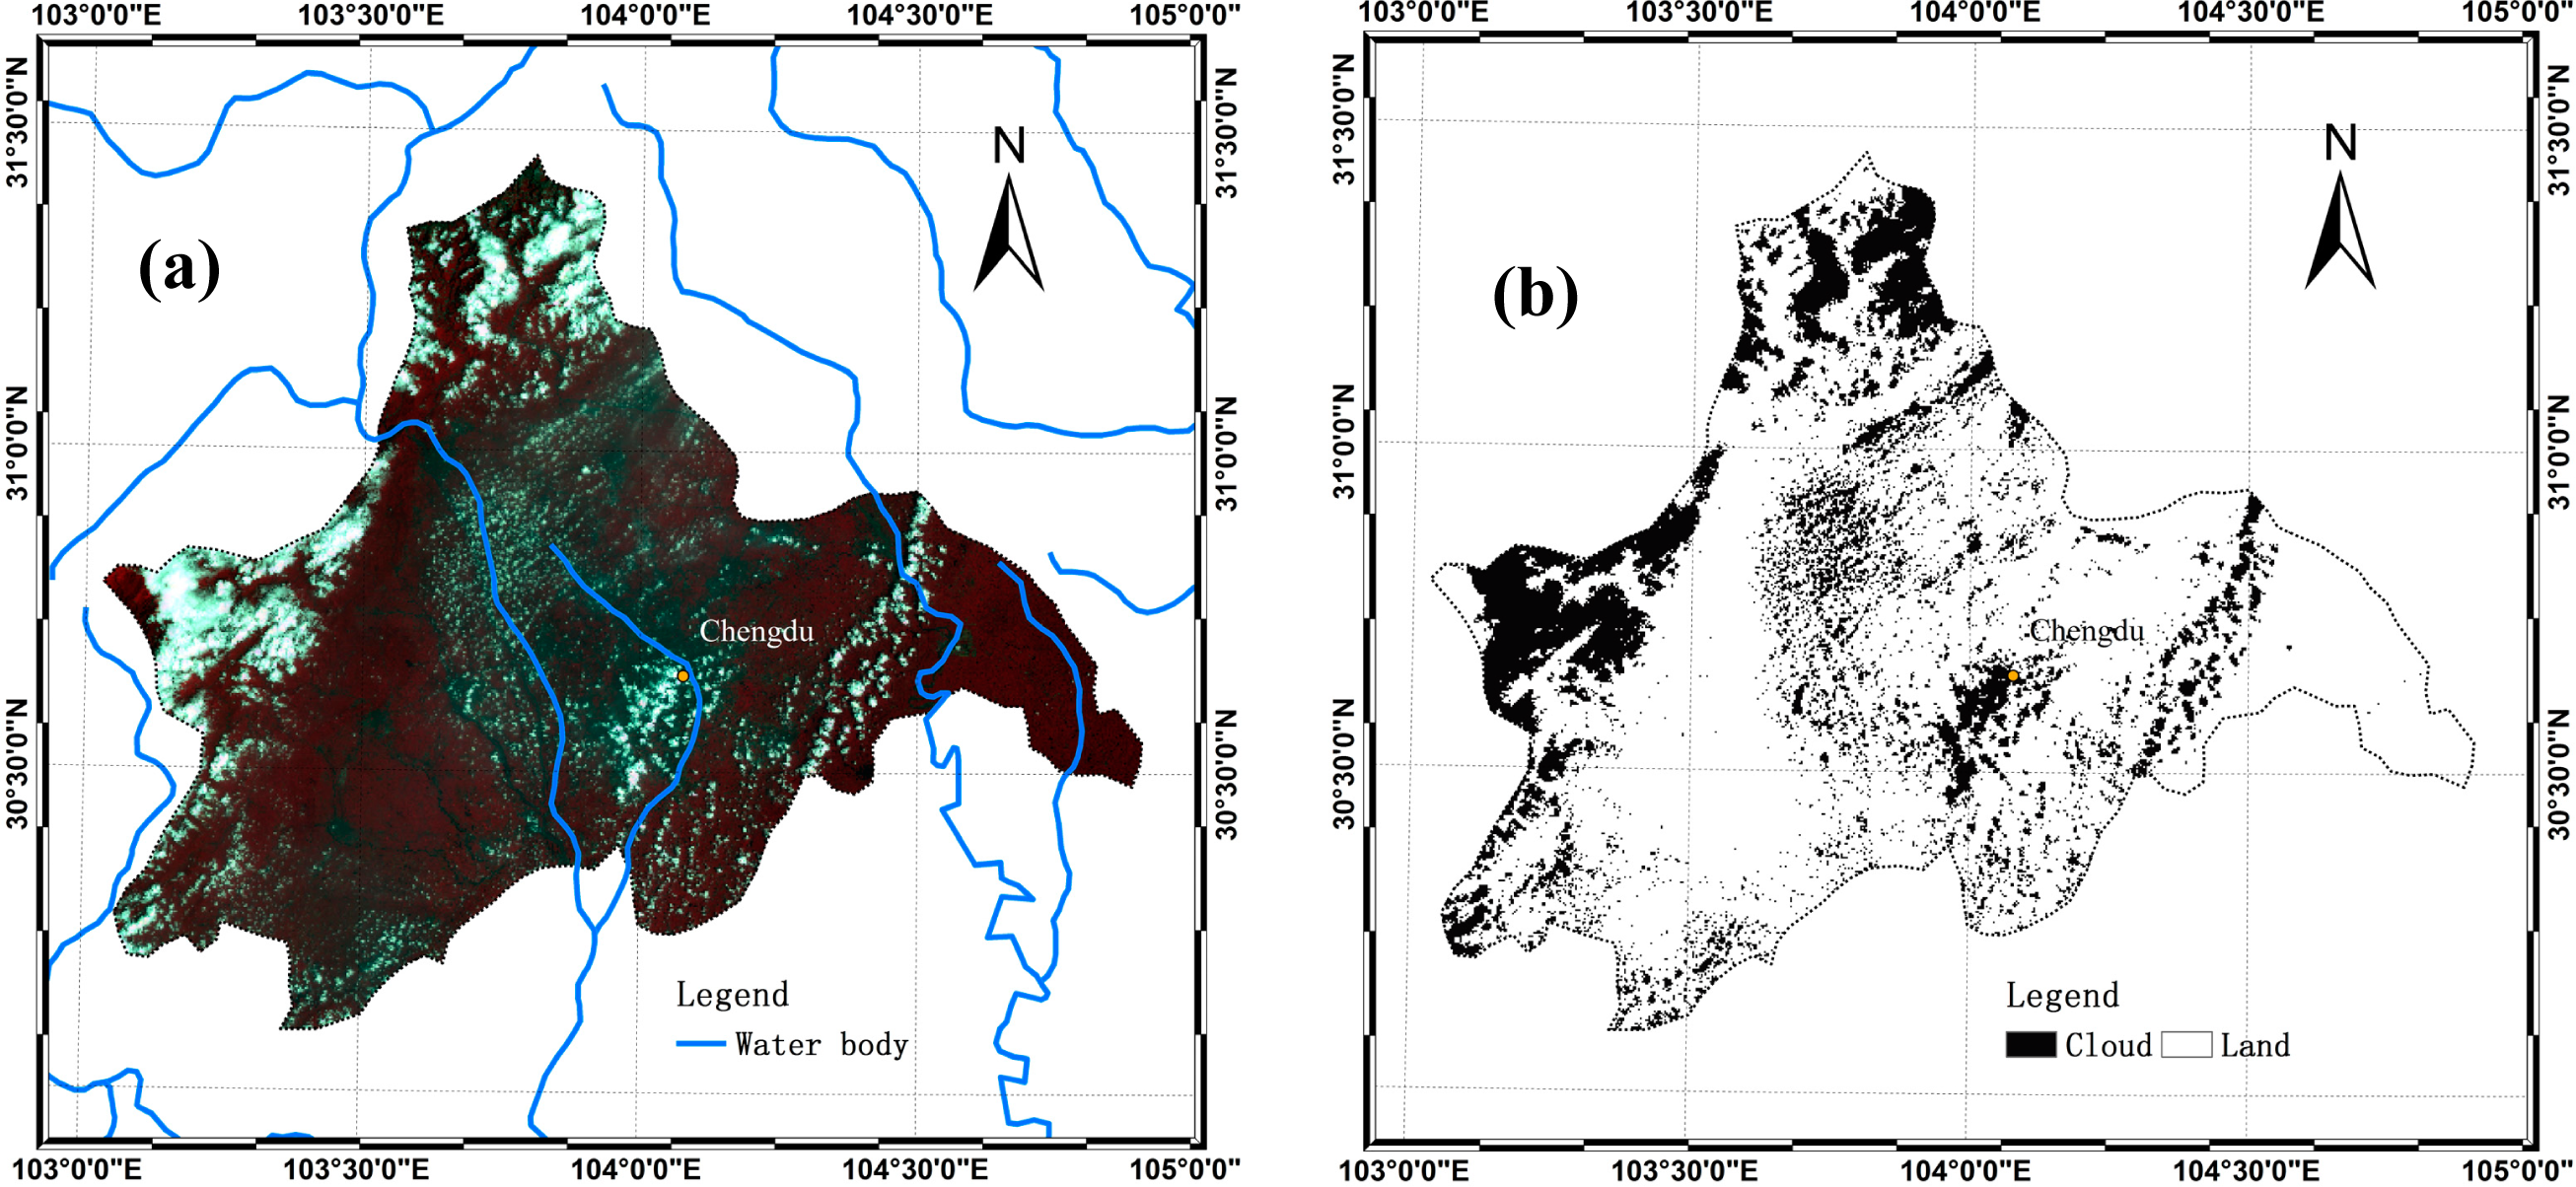
Moreover, we used NDVI for removal of cloud pixels. Usually, the reflectance of cloud pixels in the red band is larger than that in the near-infrared band, so the NDVI of cloud pixels is negative. Therefore, after calculation, when the NDVI of cloud pixels was less than zero, we removed the corresponding cloud pixels. Meanwhile, this may also remove snow, water, and other pixels, but these pixels were originally beyond our range of inversion. The cloud mask result is shown as Figure 8. However, quite often we can see cases with an optically thin cloud or a water body with positive NDVI, this depends on the solar/view geometry and what is in the atmosphere. For example, water body and even some optically thin cloud pixels are not removed in Figure 9. This suggests that the manner with which to remove the cloud pixels on the HJ-1 satellites is worth discussing.
2.4.3. AOD Inversion
Using the linear relationship between the apparent reflectance in the 1.65 μm channel and 2.1 μm channel, we determined the albedo in the blue band. According to the established lookup table of the AOD inversion, we read the solar zenith angle, azimuth angle, satellite zenith angle, and azimuth angle observation geometry parameters of the dark pixels in the satellite data files and then obtained the corresponding values that were close or equal to values in the lookup table. We obtained multiple sets of ρ0(μs, μv, φ),T(μv), S and AOD values and input these parameters into Equation (1) to calculate the multiple sets of theoretical apparent reflectance in the blue band. Through a comparison with the blue channel apparent reflectance of the CCD sensor, we derived a set of corresponding AODs that were closest to the actual apparent reflectance and defined this set as the AOD of this pixel. By repeating the above process, we inverted the blue channel AOD of the dark pixels and finally achieved AOD inversion in Chengdu.
In addition, to verify the feasibility of the method that estimated the blue channel albedo using the linear relationship between the apparent reflectance in the 1.65 μm channel and 2.1 μm channel, we estimated the blue channel albedo using the 1.65 μm channel and 2.1 μm channel of MODIS and used the estimated surface albedo for the AOD inversion. That is, we referred the MODIS dark target algorithm documentation [19] to verify the inversion results from the 1.65 μm channel of MODIS.
3. Results and Discussion
As shown in Figure 10, the results of the AOD inversion using the apparent reflectance in the 1.65 μm channel and 2.1 μm channel were highly consistent and were capable of removing the contribution from surface reflection; the inversion result cannot be differentiated by the naked eye. The correlation coefficient R reached 0.994 (Figure 11), and the inversion error was 0.035, which were in the acceptable tolerance range. Therefore, using the 1.65 μm channel to estimate albedo is an acceptable method.
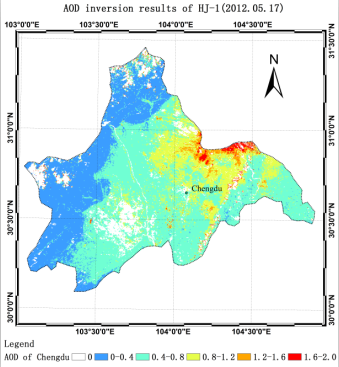
We further used the 1.65 μm channel of the IRS sensor for the AOD inversion. The inversion results on 5 August 2013 are generally the same as the inversion results from MODIS (Figure 12a), even though their imaging time differed by approximately 2 h and thus pollutant transfer and dispersion might have occurred. A severe pollution occurred in Chengdu from 17 to 19 May 2012, when the daily average PM10 concentration reached 164 μg/m3 and 316 μg/m3, respectively. We first used the 1.65 μm channel of the IRS camera to estimate the surface albedo. Under the assumption that there was no significant change in the surface cover over such a short time, we implemented the AOD inversion on the data from the HJ-1A satellite on 17 May 2012. According to the inversion results (Figure 12b,c), the HJ-1 satellites confirmed this severe pollution. Because of the impact of cloud pollution in the subsequent days, we could not obtain inversion results. However, this result still showed to a certain extent that the quality of the AOD inversion from the HJ-1 satellites was reliable. Therefore, the application of the HJ-1 satellites for fine monitoring of atmospheric pollution has great potential.
We resampled the AOD inversion results from a resolution of 150 m to a resolution of 10 km and compared the results with those of the MOD04 AOD products of NASA. The AOD inversion of the HJ-1 data was highly correlated with the MOD04 aerosol products of NASA, with a correlation coefficient (R) of 0.932 (Figure 13); however, the relative difference was 12%, which can be explained as follows. Due to the immense spatial span when resampling from a resolution of 150 m to 10 km, there must be a loss of information, and the overpass times of the HJ-1B satellite and MODIS are not completely consistent and have a time difference of approximately 1 to 2 h. Therefore, pollutant diffusion and dilution might occur. The most crucial problem lem is that the HJ-1 was used in this study to estimate the blue channel albedo, the results should be different with the method using MODIS to estimate the albedo. Moreover, the sensor parameters are not the same in these two satellites, so there are definite differences in the estimation of albedo. In addition, when determining the aerosol model, we used the AOD inversion lookup table based on ground observations, but NASA has adopted a mixture of sand/dust and industrial aerosol models for southern China (the dark target algorithm).
Because of the limitations of the CE318 ground observations, we selected the results from a 26-day AOD inversion from the HJ-1 data to validate the AOD inversion results from the CE318 installed at Chengdu University of Information Technology. Chengdu University of Information Technology is located at 30°35′1″N, 103°56′58″E. We extracted the AOD inversion results of the HJ-1 satellites for this location and compared these data with the CE318 data that were synchronized with the overpass time of the HJ-1 satellites. Using the 6S model to input the AOD at 550 nm to calculate the aerosol parameters, the established lookup table contained the aerosol parameters of different bands for the AOD at 550 nm, and the satellite inversion results showed an AOD at 550 nm. Therefore, we transformed the CE318 AOD data to AOD at 550 nm to validate the inversion results of the HJ-1 satellites. According to the Angstrom formula, the AOD and wavelengths are in line with the following:
4. Conclusions
In this paper, based on the dark target algorithm for MODIS AOD inversion, we estimated the blue channel albedo using the IRS sensor of the 1.65 μm channel on the HJ-1B satellite, completed the crucial requirements for the surface/atmosphere separation of aerosol inversion, and realized an AOD inversion for the Chengdu region. By analyzing the AOD inversion error caused by albedo changes in terms of albedo estimation error, the AOD inversion error was negatively correlated with the AOD. The significant impact of albedo estimation error on low-AOD areas is related to the relationships between each of the aerosol parameters: ρ0, S and T(μs) · T(μv).
The AOD inversion results of HJ-1 were consistent with MODIS AOD products and CE318 measured data. A comparison of the AOD inversion error in different aerosol models showed that among the common aerosol models, the rural aerosol model was the most suitable general model for AOD inversion in Chengdu. The city aerosol model causes immense inversion errors, which is not favorable for establishing the lookup table for aerosol inversion in the Chengdu region.
The AOD inversion algorithm in this paper was based on the dark target algorithm for MODIS AOD inversion, and the inversion results are relatively good. However, this method is only suitable for dark target areas, so further investigations for AOD inversions in bright-object areas from the HJ-1 satellites will be conducted in due course.
Acknowledgments
We gratefully acknowledge the financial support provided from the Air Pollution Prevention and Control Countermeasures of Sichuan and Chengdu Region (2013HBZX03). We also acknowledge NASA and China Centre for Resources Satellite Data and Application for providing the MODIS and HJ-1A/B CCD data.
Author Contributions
All authors made great contributions to the work. Yang Zhang and Zhihong Liu performed the AOD algorithm research and prepared the paper. Yongqian Wang provided the technical guidance and contributed to the error discussion. Zhixiang Ye and Lu Leng helped ground-based data collection.
Conflicts of Interest
The authors declare no conflict of interest.
References
- Kaufman, Y.J.; Tanré, D.; Boucher, O. A satellite view of aerosols in the climate system. Nature 2002, 419, 215–223. [Google Scholar]
- Tollefson, J. Asian pollution delays inevitable warming. Nature 2010, 463, 860–861. [Google Scholar]
- Li, Z.; Xia, X.; Cribb, M.; Mi, W.; Holben, B.; Wang, P.; Chen, H.; Tsay, S.C.; Eck, T.F.; Zhao, F.; et al. Aerosol optical properties and their radiative effects in northern China. J. Geophys. Res 2007. [Google Scholar] [CrossRef]
- Lohmann, U.; Lesins, G. Stronger constraints on the anthropogenic indirect aerosol effect. Science 2002, 298, 1012–1015. [Google Scholar]
- Penner, J.E.; Dong, X.; Yang, C. Observational evidence of change in radiative forcing due to the indirect aerosol effect. Nature 2004, 427, 231–234. [Google Scholar]
- Kaufman, Y.J.; Tanré, D.; Gordon, H.R.; Nakajima, T.; Lenoble, J.; Frouin, R.; Grassl, H.; Herman, B.M.; King, M.D.; Teillet, P.M. Passive remote sensing of tropospheric aerosol and atmospheric correction for the aerosol effect. J. Geophys. Res 1997, 102, 16815–16830. [Google Scholar]
- Kaufman, Y.J.; Wald, A.E.; Remer, L.A.; Gao, B.C.; Li, R.R.; Flynn, L. The MODIS 2.1 m channel-correlation with visible reflectance for use in remote sensing of aerosol. IEEE Trans. Geosci. Remote Sens 1997, 35, 1286–1298. [Google Scholar]
- Kaufman, Y.J.; Tanré, D.; Remer, L.A.; Vermote, E.F.; Chu, A.; Holben, B.N. Remote sensing of tropospheric aerosol from EOS-MODIS over the land using dark targets and dynamic aerosol models. J. Geophys. Res 1997, 102, 17051–17067. [Google Scholar]
- Tarantola, A. Inverse Problem Theory: Methods for Data Fitting and Model Parameter Estimation; Elsevier: New York, NY, USA, 1987. [Google Scholar]
- Dubovik, O.; King, M.D. A flexible inversion algorithm for retrieval of aerosol optical properties from Sun and sky radiance measurements. J. Geophys. Res 2000, 105, 20673–20696. [Google Scholar]
- Deuzé, J.L.; Bréon, F.M.; Devaux, C.; Golub, P.; Herman, M.; Lafrance, B.; Maignan, F.; Marchand, A.; Nadal, F.; Perry, G.; et al. Remote sensing of aerosols over land surfaces from POLDER-ADEOS-1 polarized measurements. J. Geophys. Res 2001, 106, 4913–4926. [Google Scholar]
- Holben, E.; Kaufman, Y.J.; Tanré, D. Aerosol retrieval over land from AVHRR data-application for atmospheric correction. IEEE Trans. Geosci. Remote Sens 1997, 30, 212–222. [Google Scholar]
- Tanré, D.; Devaux, C.; Herman, M. Estimation of Saharan aerosol optical thickness from blurring effects in thematic mapper data. J. Geophys. Res 1988, 93, 15955–15964. [Google Scholar]
- Li, S.S.; Chen, L.F.; Tao, J.H.; Han, D.; Wang, Z.T.; Su, L.; Fan, M.; Yu, C. Retrieval of aerosol optical depth over bright targets in the urban areas of North China during winter. Sci. China Earth Sci 2012, 55, 1545–1553. [Google Scholar]
- Hsu, N.C.; Tsay, S.C.; King, M.D.; Herman, J.R. Aerosol retrievals over bright reflecting source regions. IEEE Trans. Geosci. Remote Sens 2004, 42, 557–569. [Google Scholar]
- Algorithm for Remote Sensing of Tropospheric Aerosol over Dark Targets from MODIS: Collections 005 and 051: Revision 2. Available online: http://modis-atmos.gsfc.nasa.gov/_docs/ATBD_MOD04_C005_rev2.pdf (accessed on 17 September 2014).
- Levy, R.C.; Remer, L.A.; Mattoo, S.; Vermote, E.F.; Kaufman, Y.J. The second-generation operational algorithm: Retrieval of aerosol properties over land from inversion of MODIS spectral reflectance. J. Geophys. Res 2007. [Google Scholar] [CrossRef]
- Remer, L.; Kaufman, Y.; Tanre, D.; Mattoo, S.; Chu, D.A.; Martins, J.V.; Li, R.R.; Ichoku, C.; Levy, R.C.; Kleidman, R.G.; et al. The MODIS aerosol algorithm, products, and validation. J. Atmos. Sci 2005, 62, 947–973. [Google Scholar]
- Algorithm for Remote Sensing of Tropospher Aerosol from MODIS: Collection 5. Available online: http://modis.gsfc.nasa.gov/data/atbd/atbd_mod02.pdf (accessed on 27 August 2014).
- Wang, Z.-T.; Li, Q.; Tao, J.-H; Li, S.-S.; Wang, Q.; Chen, L.-F. Monitoring of aerosol optiacal depth over land surface using CCD camera on HJ-1 satellite. China Environ. Sci 2009, 29, 902–907. [Google Scholar]
- Chen, L.; Li, S.; Tao, J.; Wang, Z. Research and Application of Quantitative Inversion on Aerosol Remote Sensing; Science Press: Beijing, China, 2011. [Google Scholar]
- Li, S.-S; Chen, L.-F.; Tao, J.-H; Han, D.; Wang, Z.-T.; He, B.-H. Retrieval and validation of the surface reflectance using HJ-1-CCD data. Spectrosc. Spectr. Anal 2011, 31, 516–520. [Google Scholar]
- Wang, Z.; Li, Q.; Wang, Q.; Li, S.; Chen, L.; Zhou, C.; Zhang, L.; Xu, Y. HJ-1 terrestrial aerosol data retrieval using deep blue algorithm. J. Remote Sens 2012, 16, 596–610. [Google Scholar]
- Chander, G.; Markham, B.L.; Helder, D.L. Summary of current radiometric calibration coefficients for Landsat MSS, TM, ETM+, and EO-1 ALI sensors. Remote Sens. Environ 2009, 113, 893–903. [Google Scholar]


| Vegetation Types | Albedo | Red/Blue Band Ratio | NDVI | |||
|---|---|---|---|---|---|---|
| Band-1 | Band-2 | Band-3 | Band-4 | |||
| Sugarcane | 0.051 | 0.083 | 0.089 | 0.254 | 1.733 | 0.482 |
| Peanut | 0.035 | 0.064 | 0.052 | 0.326 | 1.491 | 0.726 |
| Jasmine | 0.025 | 0.058 | 0.04 | 0.377 | 1.582 | 0.809 |
| Cassava | 0.032 | 0.059 | 0.046 | 0.415 | 1.449 | 0.802 |
| Mulberry | 0.036 | 0.077 | 0.058 | 0.406 | 1.617 | 0.750 |
| Rice | 0.052 | 0.09 | 0.118 | 0.26 | 2.248 | 0.377 |
| Holly | 0.019 | 0.08 | 0.033 | 0.358 | 1.746 | 0.837 |
| Wheat | 0.039 | 0.091 | 0.063 | 0.482 | 1.613 | 0.769 |
| Corn | 0.063 | 0.153 | 0.098 | 0.701 | 1.561 | 0.754 |
| Satellite Platform | Sensor | Band | Spectrum Range (μm) | Spatial Resolution (m) | Amplitude Width (km) | Revisiting Cycle (days) |
|---|---|---|---|---|---|---|
| HJ-1A | CCD1 & CCD2 | 1 | 0.43–0.52 | 30 | 360 (single) 700 (double) | 4 |
| 2 | 0.52–0.60 | |||||
| 3 | 0.63–0.69 | |||||
| 4 | 0.76–0.90 | |||||
| HSI | -- | 0.45–0.95 (110–128 band) | 100 | 50 | 4 | |
| HJ-1B | CCD1 & CCD2 | 1 | 0.43–0.52 | 30 | 360 (single) 700 (double) | 4 |
| 2 | 0.52–0.60 | |||||
| 3 | 0.63–0.69 | |||||
| 4 | 0.76–0.90 | |||||
| IRS | 5 | 0.75–1.10 | 150 | 720 | 4 | |
| 6 | 1.55–1.75 | |||||
| 7 | 3.50–3.90 | |||||
| 8 | 10.5–12.5 | 300 | ||||
| ρs | AOD | ρs | AOD | ||||||
|---|---|---|---|---|---|---|---|---|---|
| 0.01 | 0.1 | 0.0114 | 0.0113 | 0.0096 | 0.15 | 0.1 | 0.1453 | 0.1441 | 0.1342 |
| 0.5 | 0.0162 | 0.0161 | 0.0119 | 0.5 | 0.1405 | 0.1392 | 0.131 | ||
| 0.9 | 0.0209 | 0.0207 | 0.0141 | 0.9 | 0.1358 | 0.1344 | 0.1278 | ||
| 1.3 | 0.0255 | 0.0253 | 0.0162 | 1.3 | 0.1314 | 0.1301 | 0.1247 | ||
| 1.7 | 0.0308 | 0.0307 | 0.0184 | 1.7 | 0.1272 | 0.1259 | 0.1217 | ||
| 2 | 0.0329 | 0.0327 | 0.0199 | 2 | 0.1243 | 0.1229 | 0.119 | ||
| 0.05 | 0.1 | 0.0496 | 0.0484 | 0.0452 | 0.2 | 0.1 | 0.1932 | 0.1928 | 0.1778 |
| 0.5 | 0.0516 | 0.0503 | 0.0459 | 0.5 | 0.1852 | 0.1848 | 0.1737 | ||
| 0.9 | 0.0536 | 0.0523 | 0.0465 | 0.9 | 0.1773 | 0.1760 | 0.1687 | ||
| 1.3 | 0.0555 | 0.0542 | 0.0471 | 1.3 | 0.1697 | 0.1683 | 0.1637 | ||
| 1.7 | 0.0574 | 0.0560 | 0.0477 | 1.7 | 0.1626 | 0.1624 | 0.1589 | ||
| 2 | 0.0588 | 0.0575 | 0.0482 | 2 | 0.1575 | 0.1562 | 0.1554 | ||
| 0.1 | 0.1 | 0.0974 | 0.0962 | 0.0897 | 0.25 | 0.1 | 0.2411 | 0.2399 | 0.2233 |
| 0.5 | 0.096 | 0.0948 | 0.0884 | 0.5 | 0.23 | 0.2286 | 0.2165 | ||
| 0.9 | 0.0946 | 0.0933 | 0.0871 | 0.9 | 0.2189 | 0.2176 | 0.2097 | ||
| 1.3 | 0.0934 | 0.0922 | 0.0858 | 1.3 | 0.2083 | 0.2069 | 0.2029 | ||
| 1.7 | 0.092 | 0.0906 | 0.0846 | 1.7 | 0.1981 | 0.1968 | 0.1963 | ||
| 2 | 0.0914 | 0.0901 | 0.0837 | 2 | 0.1918 | 0.1905 | 0.1915 | ||
| Sensor | Correlation Coefficient | a | b |
|---|---|---|---|
| HJ-1B-CCD1 | 0.922 | 0.014 | 0.921 |
| HJ-1B-CCD2 | 0.952 | 0.010 | 0.960 |
| Albedo Change | AOD Minimum Error | AOD Maximum Error | AOD Average Error |
|---|---|---|---|
| 0.001 | 0.001 | 0.027 | 0.013 |
| 0.005 | 0.003 | 0.082 | 0.066 |
| 0.01 | 0.006 | 0.164 | 0.133 |
| 0.015 | 0.012 | 0.276 | 0.201 |
| 0.02 | 0.016 | 0.355 | 0.273 |
| 0.025 | 0.019 | 0.469 | 0.348 |
© 2014 by the authors; licensee MDPI, Basel, Switzerland This article is an open access article distributed under the terms and conditions of the Creative Commons Attribution license (http://creativecommons.org/licenses/by/3.0/).
Share and Cite
Zhang, Y.; Liu, Z.; Wang, Y.; Ye, Z.; Leng, L. Inversion of Aerosol Optical Depth Based on the CCD and IRS Sensors on the HJ-1 Satellites. Remote Sens. 2014, 6, 8760-8778. https://doi.org/10.3390/rs6098760
Zhang Y, Liu Z, Wang Y, Ye Z, Leng L. Inversion of Aerosol Optical Depth Based on the CCD and IRS Sensors on the HJ-1 Satellites. Remote Sensing. 2014; 6(9):8760-8778. https://doi.org/10.3390/rs6098760
Chicago/Turabian StyleZhang, Yang, Zhihong Liu, Yongqian Wang, Zhixiang Ye, and Lu Leng. 2014. "Inversion of Aerosol Optical Depth Based on the CCD and IRS Sensors on the HJ-1 Satellites" Remote Sensing 6, no. 9: 8760-8778. https://doi.org/10.3390/rs6098760