Article

Future Climate Impact on the Desertification in the Dry Land Asia Using AVHRR GIMMS NDVI3g Data

1
State Key Laboratory of Earth Surface Processes and Resource Ecology, College of Global Change and Earth System Science, Beijing Normal University, 19 Xinjiekouwai Street, Beijing 100875, China
2
Mongolian and Inner Asia Studies Unit, Cambridge University, Cambridge CB2 3RF, UK
3
College of Atmospheric Sciences, Lanzhou University, 222 TianShui Street, Lanzhou 730000, China
4
Department of Cultural Relics and Museology, Fudan University, 220 Handan Road, Shanghai 200433, China
5
School of Mathematical Sciences, University of Dublin, Belfield, D4, Ireland
*
Author to whom correspondence should be addressed.
Remote Sens. 2015, 7(4), 3863-3877; https://doi.org/10.3390/rs70403863
Submission received: 6 December 2014 / Revised: 17 March 2015 / Accepted: 23 March 2015 / Published: 1 April 2015
(This article belongs to the Special Issue Remote Sensing of Land Degradation in Drylands)

Abstract

:
Dry Land Asia is the largest arid and semi-arid region in the northern hemisphere that suffers from land desertification. Over the period 1982–2011, there were both overall improvement and regional degeneration in the vegetation NDVI. We analyze future climate changes in these area using two ensemble-average methods from CMIP5 data. Bayesian Model Averaging shows a better capability to represent the future climate and less uncertainty represented by the 22-model ensemble than does the Simple Model Average. From 2006 to 2100, the average growing season temperature value will increase by 2.9 °C, from 14.4 °C to 17.3 °C under three climate scenarios (RCP 26, RCP 45 and RCP 85). We then conduct multiple regression analysis between climate changes compiled from the Climate Research Unit database and vegetation greenness from the GIMMS NDVI3g dataset. There is a general acceleration in the desertification trend under the RCP 85 scenario in middle and northern part of Middle Asia, northwestern China except Xinjiang and the Mongolian Plateau (except the middle part). The RCP 85 scenario shows a more severe desertification trend than does RCP 26. Desertification in dry land Asia, particularly in the regions highlighted in this study, calls for further investigation into climate change impacts and adaptations.

Graphical Abstract

1. Introduction

Dry lands are areas of land with low amounts of water in the soil; they encompass hyper-arid, arid, semi-arid and dry sub-humid areas [1]. A large majority of dry lands are located in Asia (34.4%) and Africa (24.1%), followed by the Americas (24%), Australia (15%) and Europe (2.5%) [2]. Dry lands occupy approximately 41% of the earth’s terrestrial surface and feed more than 33% of the world’s population [3]. Recently, dry land environments are extremely vulnerable, with fragile ecosystems, deterioration of lands, water shortages and the social impoverishment these induce [4,5]. Middle and East Asia contain the driest lands in the northern hemisphere; these areas have been greatly influenced by significant global warming and intensive human activities. Climate and environmental change in arid Central Asia will pose a threat to human vulnerability through food security, water stress and human health [6]. Normally, drought, land degradation and desertification occur simultaneously in dry lands. Desertification is one of the biggest socioeconomic problems over Dry Land Asia, but it is usually vaguely defined; the more general term “land degradation” is preferred to desertification unless it is quite clear that the degradation has led to the creation of desert-like conditions [7].
Warming trends and increasing temperature extremes have been observed in most of Asia over the past century, but there is much uncertainty in future precipitation; this is critical because water scarcity is expected to be a major challenge for humankind [8]. The negative effects of increased temperatures as well as unexpected changes in precipitation, storm events, snowfall and snowmelt, evapotranspiration, run-off and soil moisture will disturb the hydrological cycles in the dry lands [9]. Work by Huang and Guan indicates that semi-arid regions in mid-latitude semi-arid areas of Europe, Asia and North America are becoming warmer, especially in the cold season [10]. In the future, major expansion of arid regions will occur over southwest North America, the northern fringe of Africa, southern Africa and Australia, while major expansion of semi-arid regions will occur over the north side of the Mediterranean, southern Africa and North and South America [1]. As predicted by the HadCM2 model, dry lands and sub-humid arid areas in China will increase in size by the years 2030 and 2056, respectively [11]. There are few studies that evaluate the future impact of climate change on the vegetation growth over Dry Land Asia under rapid global environmental change.
In recent decades, investigating satellite-derived vegetation greenness and its association with the climate change has provided useful information for the complex coupling of the biosphere and the atmosphere [12,13]. Our study aims to predict the future changes of climate and associated dynamics of land desertification over Dry Land Asia in 2020, 2050, 2080 and 2100 based on three climate scenarios. We firstly build multiple regressions between meteorological and GIMMS NDVI3g data and then attempt to predict the spatial and temporal dynamics of the future NDVI distribution through climate simulation data from CMIP5. The future temperature and precipitation data are derived from the results of 22 CMIP5 models through two primary methods, Simple Model Averaging and Bayesian Model Averaging.

2. Material and Methods

2.1. Study Area

Dry Land Asia comprises seven countries: the Republic of Mongolia (RM); the middle Asia countries (MA) of Tajikistan, Kazakhstan, Kyrgyzstan, Uzbekistan and Turkmenistan; and the six provinces in northwestern China (NWC) of Inner Mongolia, Shaanxi, Gansu, Ningxia, Qinghai and Xinjiang. Dry Land Asia has a temperate continental arid climate: it is hot in summer and extremely cold in winter. As shown in Figure 1, the mean temperature during the growing season (from April to October) ranges from −10 to 30 °C and the hottest regions are the MA, Xinjiang, Ningxia, Gansu, Shaanxi, Inner Mongolia and the southern part of RM. The total precipitation during the growing season ranges from 0-500 mm; precipitation is especially scarce in the MA, NWC and the western part of the Mongolian Plateau (MP). Land use types mainly include meadow, typical and desert steppe, and desertification is one of the most serious problems in regional land suitability. Figure 1a shows the growing season NDVI from 1982 to 2011. Bare soil and sparse vegetation regions have red colors (NDVI < 0.1) and are defined as potential desertified areas in the following calculation [14]. We find that most of the desertified areas correspond to low precipitation patterns.

2.2. Datasets

(1)
Remote-sensing-based vegetation data
The NDVI index is used to trace the vegetation dynamics and distribution. It is a proxy for vegetation productivity of the terrestrial ecosystem [15,16]. The GIMMS (Global Inventory Modeling and Mapping Studies) 15-day composite NDVI3g dataset applied here has been shown to be more accurate than the GIMMS NDVI for monitoring vegetation activity and phonological change [17,18,19]. Its spatial resolution is 8 km. It is acquired by a NOAA (National Oceanic and Atmospheric Administration) satellite over the 30-year period spanning from 1982 to 2011.
(2)
Climate observations and model data
The climate observations are from the Climatic Research Unit and extend from 1950 to 2011 (http://www.cru.uea.ac.uk/). The simulated climate dataset is from the Coupled Model Intercomparison Project Phase 5 (CMIP5) experiment and spans 1850 to 2100 (http://cmip-pcmdi.llnl.gov/cmip5/data_portal.html). As introduced in Table 1, twenty-two global climate models from CMIP5 provide simulated temperature and precipitation data in three future scenarios (RCP 26, RCP 45 and RCP 85). Historical data extends from 1850 to 2005, while the future dataset runs from 2006 to 2100. The three RCP pathways represent low- (RCP 26), medium- (RCP 45) and high- (RCP 85) emission scenarios with radiative forcings of 2.6, 4.5 and 8.5 Wm−2, respectively. Under these different radiative forcings, greenhouse gases and anthropogenic aerosols will affect vegetation growth in different ways.
Figure 1. Average vegetation NDVI (a); mean temperature (b); and total precipitation (c) over the growing season from 1982 to 2011.
Remotesensing 07 03863 g001
Table 1. List of 22 CMIP5 climate models with a historical run and three future scenarios with their sources.
GCMResources
1BCC-CSM1-1Beijing Climate Center, China
2BNU-ESMBeijing Normal University, China
3CanESM2Canadian Centre for Climate, Canada
4CCSM4National Center for Atmospheric Research, USA
5CNRM-CM5Centre National de Researches Meteorologiques, France
6CSIRO-Mk3-6-0Commonwealth Scientific and Industrial Research, Australia
7FGOALS-g2Institute of Atmospheric and Industrial Research, Australia
8FIO-ESMThe First Institute of Oceanography, SOA, China
9GFDL-CM3Geophysical Fluid Dynamics Laboratory, USA
10GFDL-ESM2GGeophysical Fluid Dynamics Laboratory, USA
11GFDL-ESM2MGeophysical Fluid Dynamics Laboratory, USA
12GISS-E2-HNASA Goddard Institute for Space Studies, USA
13GISS-E2-RNASA Goddard Institute for Space Studies, USA
14HadGEM2-AOMet Office Hadley Centre, UK
15IPSL-CM5A-LRInstitut Pierre-Simon Laplace, France
16IPSL-CM5A-MRInstitut Pierre-Simon Laplace, France
17MIROC5Atmosphere and Ocean Research Institute, Japan
18MIROC-ESMJapan Agency for Marine-Earth Science and Technology, Japan
19MIROC-ESM-CHEMJapan Agency for Marine-Earth Science and Technology, Japan
20MPI-ESM-LRMax Planck Institute for Meteorology, Germany
21MRI-CGCM3Meteorological Research Institute, Japan
22NorESM1-MNorwegian Climate Centre, Norway

2.3. Methods

(1)
Multi-model ensemble mean and assessment
Both Simple Model Averaging (SMA) and Bayesian Model Averaging (BMA) are widely applied in multi-model ensemble simulations [20,21,22]. We compare these two methods to obtain the ensemble mean of the 22 climate models. The SMA is calculated by assigning the same weight to each model without evaluating the performance of each model [20]. The BMA generates a probability density function (PDF), which is a weighted average of the PDFs centered on the forecasts. Thus, BMA weights reflect the relative contributions of the component models to the predictive skill over a training sample [21]. Then, a Taylor diagram is used to summarize multiple aspects of model performance in a single diagram that maps the correlation, centered root mean-square-error (RMSE) and the amplitude of the standard deviations of each model. It provides a direct evaluation of the output performance of different models and allows us to track changes in model performance [23].
(2)
Calculation of the relationship between vegetation NDVI and climate change
Partial correlation analysis is employed to determine whether vegetation NDVI over dry land Asia is primarily determined by surface temperature or by precipitation [24,25]. Because the growing season NDVI is better correlated to climate change than the annual NDVI [26], we construct a multiple linear regression relationship between NDVI and climate change during the growing season (from April to October) in Equation (1). It is based on the assumption that the surface vegetation NDVI correlates directly with the temperature and precipitation, which is supported by previous studies focusing on the dry lands [13,27,28]. The land degradation area is defined as the area of potential desertification among all of the areas in the following calculation [7]. As for the discrepancies of spatial resolution between the climate and NDVI data, we match these data based on their geographic locations. When multiple pixels in the NDVI data occupy the same grid point of climate data, we simply assigned them the grid point value based on the assumption that data within a single grid point is homogeneous. Finally, the spatial resolution of all databases is 8 km.
N D V I = a × T + b × P + c
Here, T is the average surface temperature during the growing season; P is the average precipitation during the growing season; a, b are the regression coefficients; and c is a constant.
P = ( NDV I m NDV I n ) NDV I n
To assess the change in percentage of the vegetation NDVI, we use Equation (2). Here, P means the percentage of change from year m to year n.

3. Results

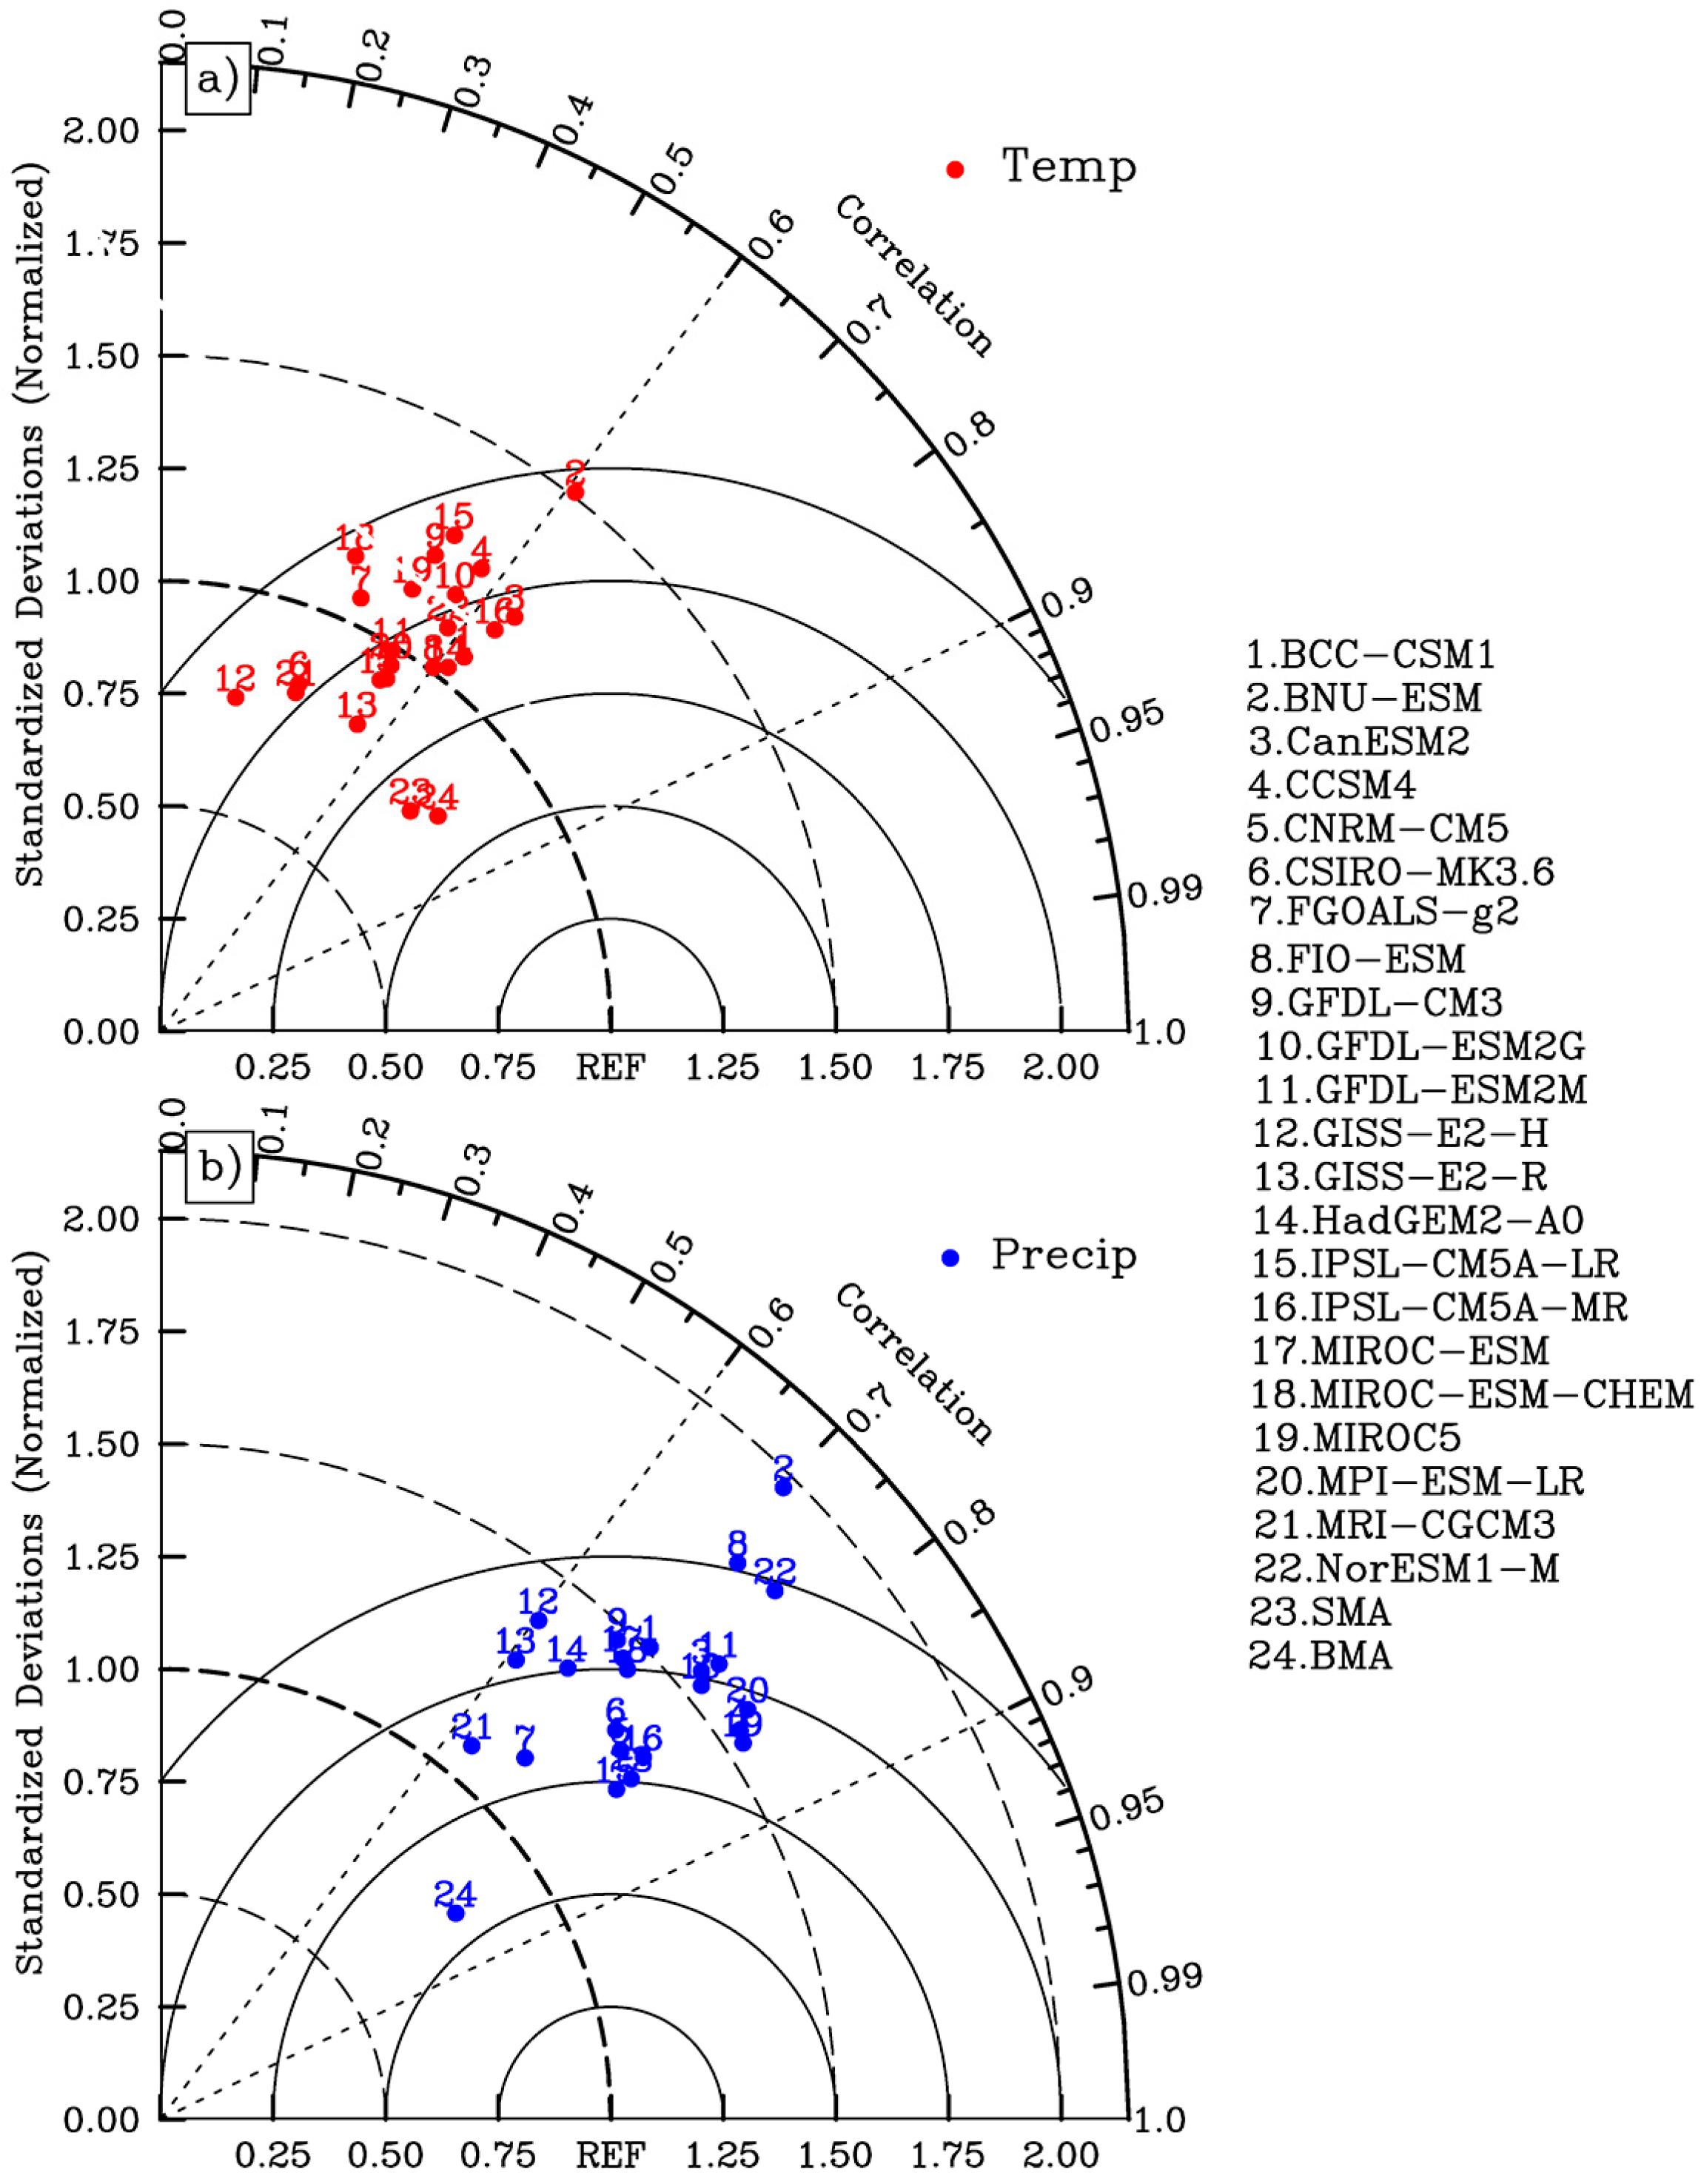
3.1. Multi-Model Ensemble Mean by SMA and BMA

We predict spatial and temporal trends in future temperature and precipitation during the growing season over the period 2006–2100 and use Taylor diagrams to evaluate the performance of 22 climate models in simulating these changes. As shown in Figure 2a & 2b, the correlation coefficient between the 22 GCM temperatures and the CRU observation ranges from 0.30 to 0.80 and from 0.60 to 0.90, respectively. Our study also confirms that temperature and precipitation simulations through SMA and BMA both improve the simulation accuracy over single-model simulations, as shown in Figure 2a. In particular, the BMA method has a better performance in our research area than the SMA and the single-model output (the closer a model’s data point is to REF, the more accurate the model is). Precipitation simulations from different models have more scatter than temperature simulations do, as shown in Figure 2b. This ensemble mean can be interpreted as our best estimate of the climate responses to a given external forcing because individual ensemble runs simulate random internal variations and contain errors associated with individual models [1]. Thus, because the BMA simulations have more accurate values and lower uncertainties, we use these results. The multi-model ensemble means calculated by SMA and BMA are able to eliminate the uncertainty among all climate models over northern Eurasia by Miao’s study [21].
Figure 2. The accuracy of the modeled temperature (a) and precipitation (b) during the growing season, as evaluated by Taylor diagrams.
Remotesensing 07 03863 g002

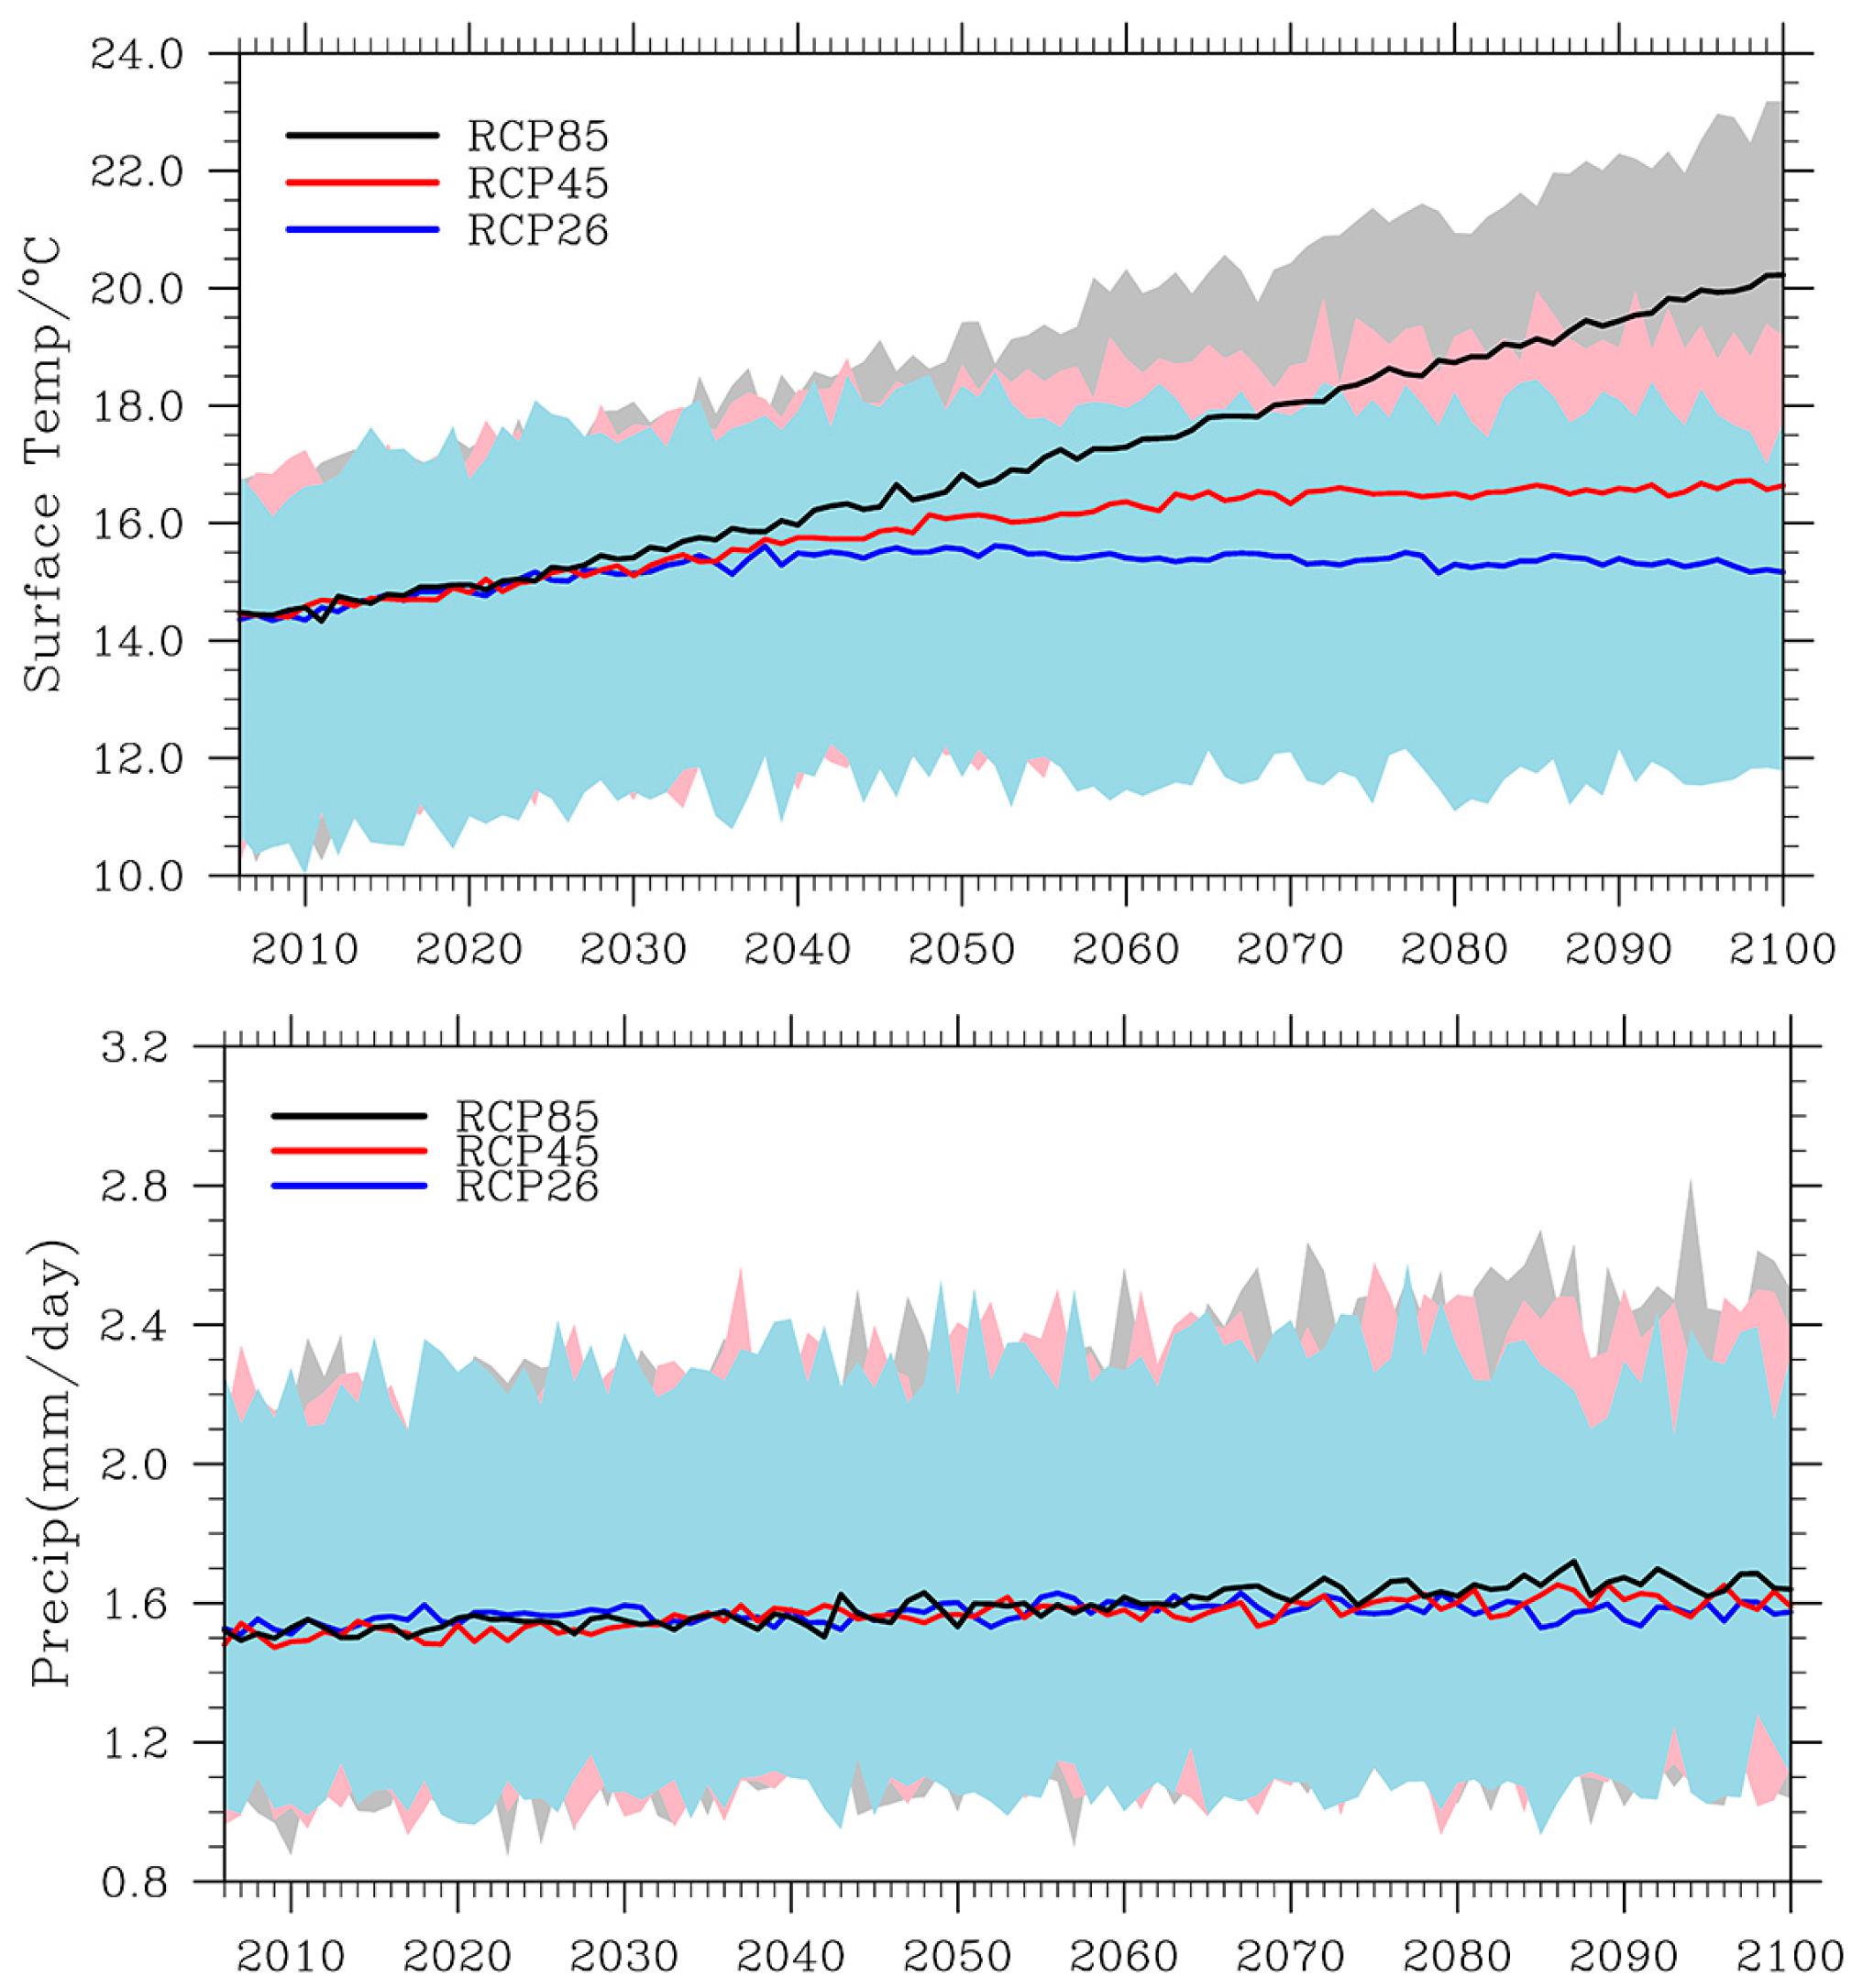
3.2. Temperature and Precipitation Projections from 2006–2100

(1)
Temporal trends of the future temperature and precipitation
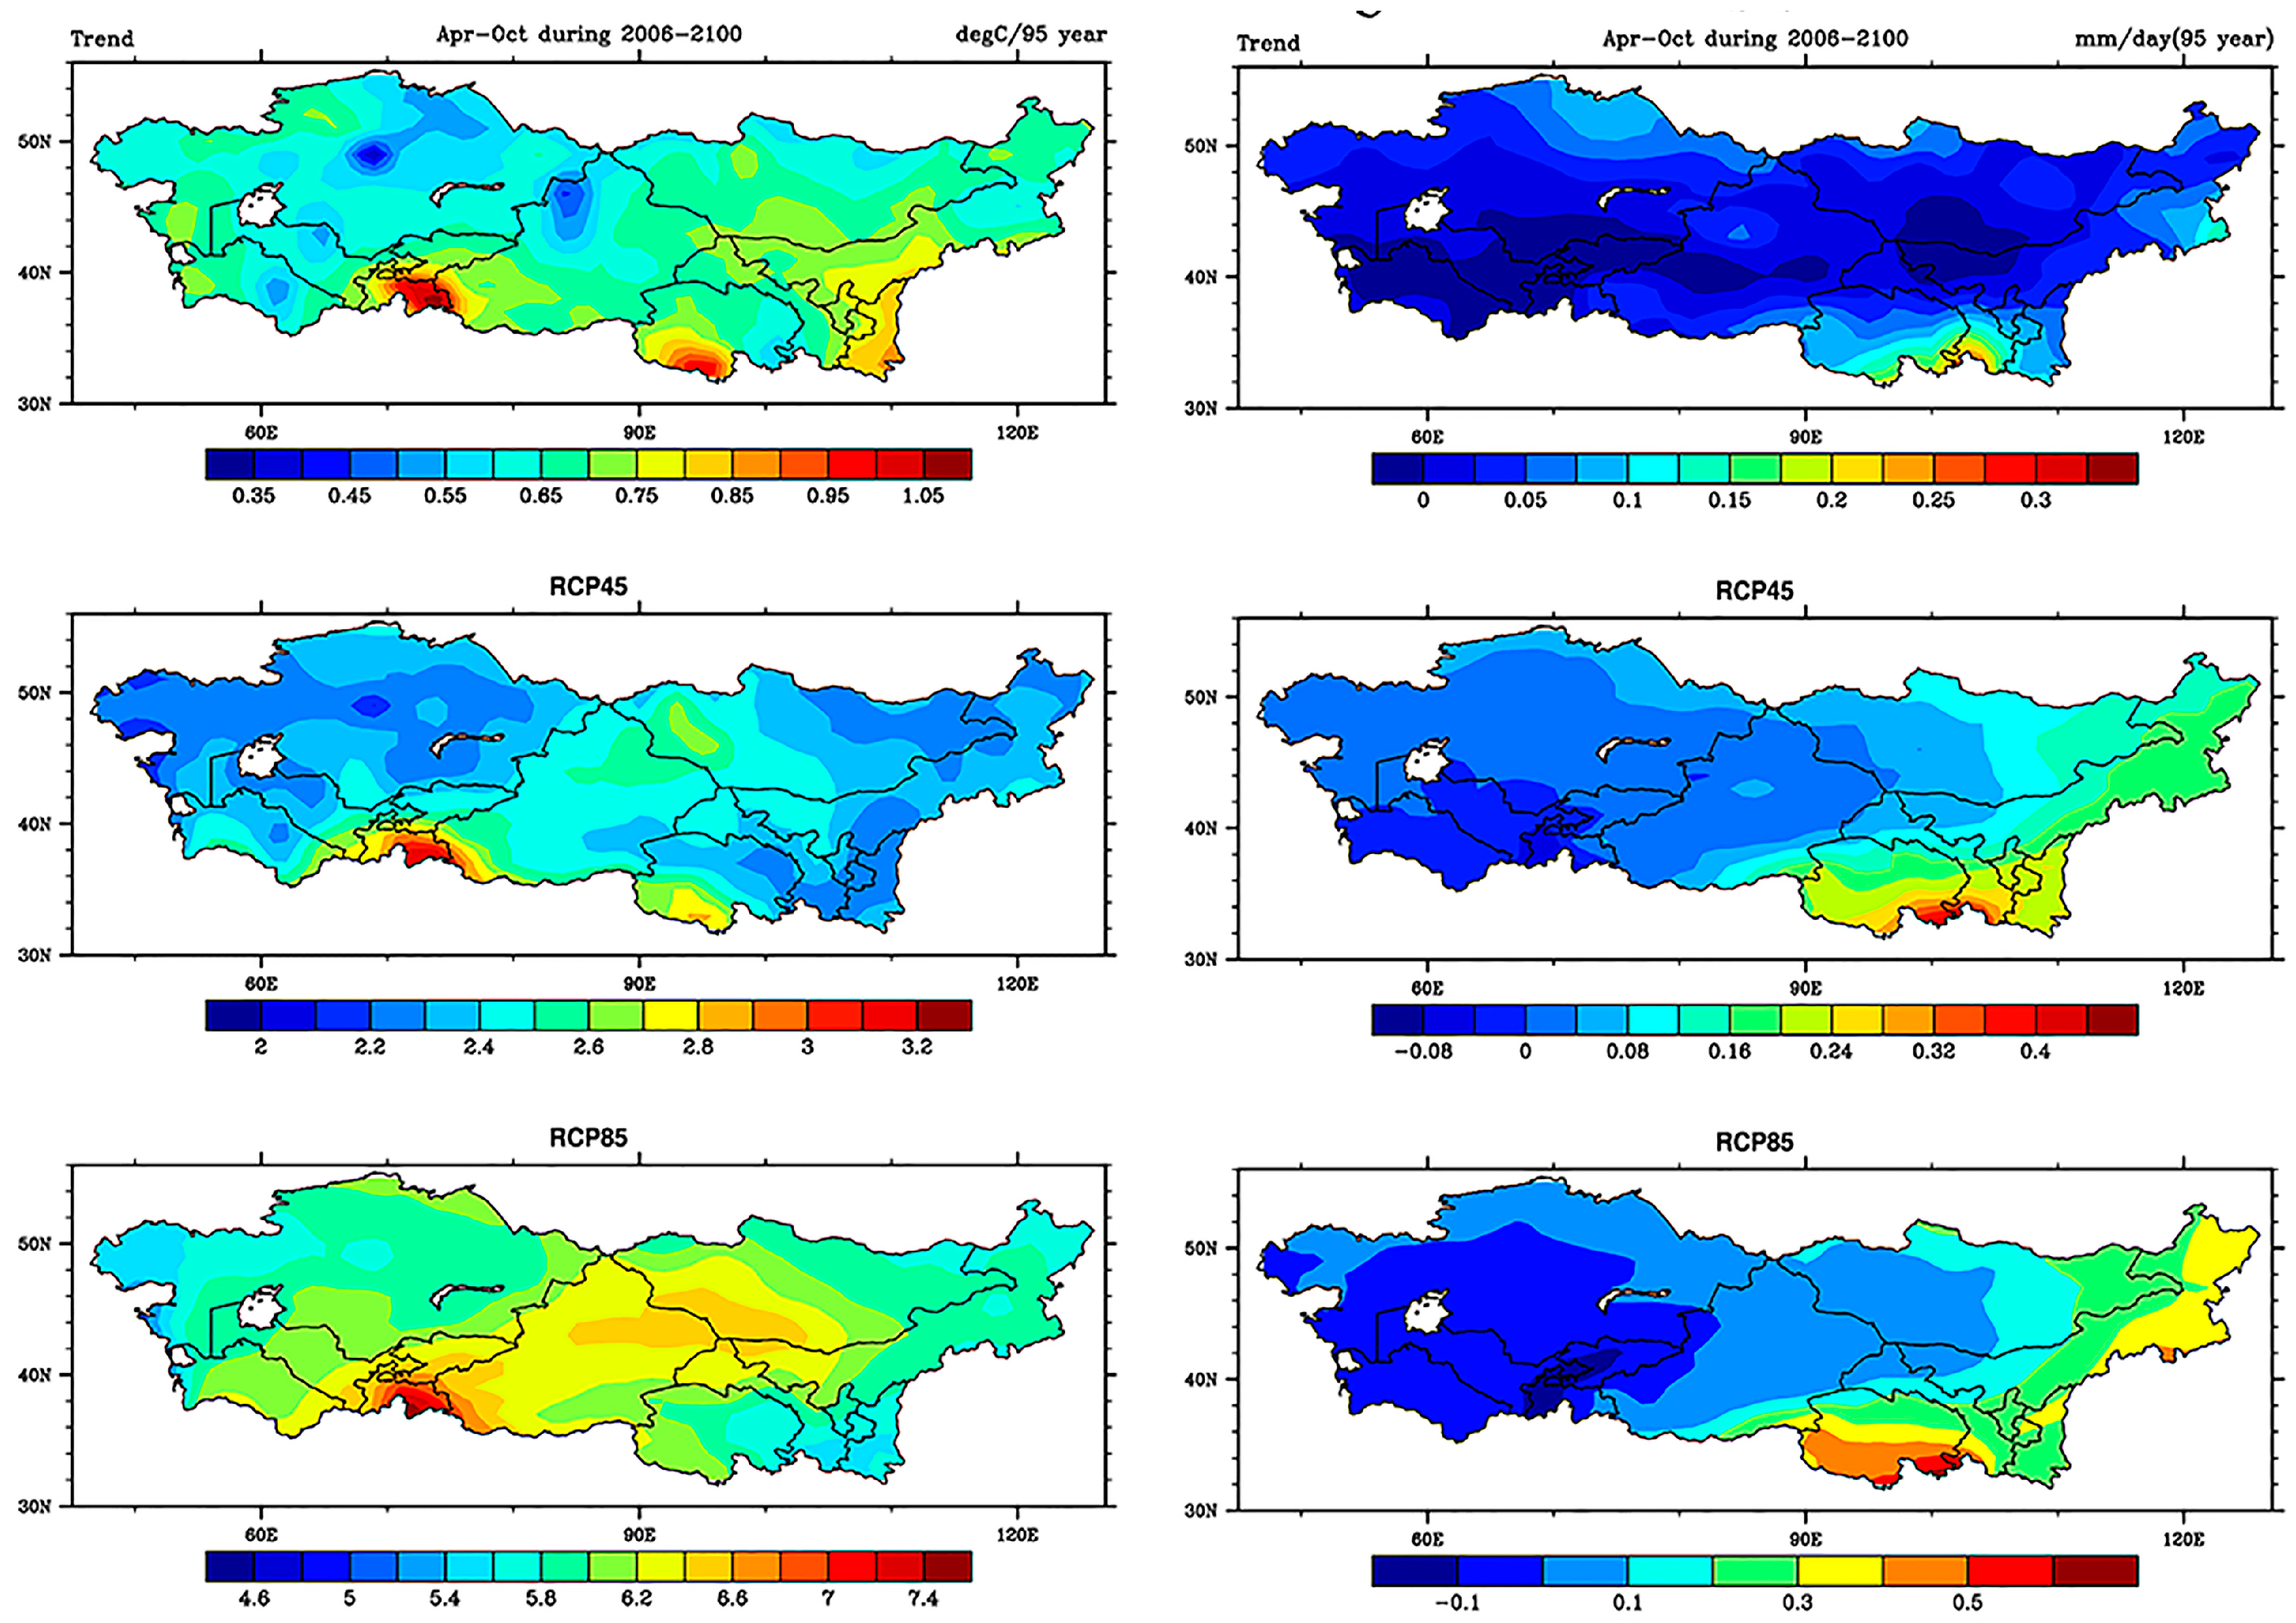
We compare the performance of the SMA and BMA methods when simulating the temperature and precipitation. The result shows that BMA gives more accurate predictions than SMA. Figure 3 shows the temporal trend of growing season temperature and precipitation based on the BMA method in three scenarios (RCP 26, RCP 45 and RCP 85) during the period from 2006–2100 (Why the BMA is superior is explained in section 3.1.) All three scenarios conclude that the growing season temperature will increase, on average, from 14.4 °C to 17.3 °C from 2006 to 2100 and that the temperature will increase at a rate of at least 0.7 °C per century (R = 0.61, p < 0.05), 2.5 °C per century (R = 0.95, p < 0.05) and 6.4 °C per century (R = 0.99, p < 0.05) for the RCP 26, RCP 45 and RCP 85 scenarios, respectively. Meanwhile, the annual precipitation will increase slowly from 1.5 mm in 2006 to 1.6 mm in 2100 at a rate of 0.03 mm per century (R = 0.49, p < 0.05), 0.08 mm per century (R = 0.81, p < 0.05) and 0.11 mm per century (R = 0.90, p < 0.05), respectively, for the three scenarios. In the RCP 85 scenario, the warmest and wettest weather will occur for the next 100 years.
Figure 3. Ensemble mean temperature and precipitation simulations by BMA during the growing season from 2006–2100 in three scenarios (RCP 26, RCP 45 and RCP 85).
Remotesensing 07 03863 g003
(3)
Spatial trends of future temperature and precipitation
Figure 4 shows the spatial trends of the growing season temperature and precipitation over dry land Asia during the 95 years of the period 2006–2100. Spatially, the RCP 85 scenario shows a much warmer and wetter trend than the RCP 45 and RCP 26 scenarios: the average temperature increase in RCP 85 ranges from 4.4 °C to 7.6 °C and the liner precipitation ranges from −0.2 mm to 0.7 mm. The southern and middle parts (e.g., the western Mongolian plateau and northwestern China) show warmer conditions. The precipitation trends show a stripe from the west to the east with decreased precipitation trends for the RCP 26 scenario. Precipitation trends in the future are also enhanced in almost the entire region, with a gradually increasing gradient from the west to the east for the RCP 45 and RCP 85 scenarios. This result agrees with that of Shi in 2003, which indicated that the climate in northwest China will change from warm and dry to warm and wet in the future because the warming will accelerate the hydrological cycle [29].
Figure 4. Future temperature (a) and precipitation (b) trends during the growing season from 2006–2100 in the three scenarios studied. Precipitation trends with black points are statistically significant at the 95% level. All temperature trends passed significance tests at the 95% level.
Remotesensing 07 03863 g004

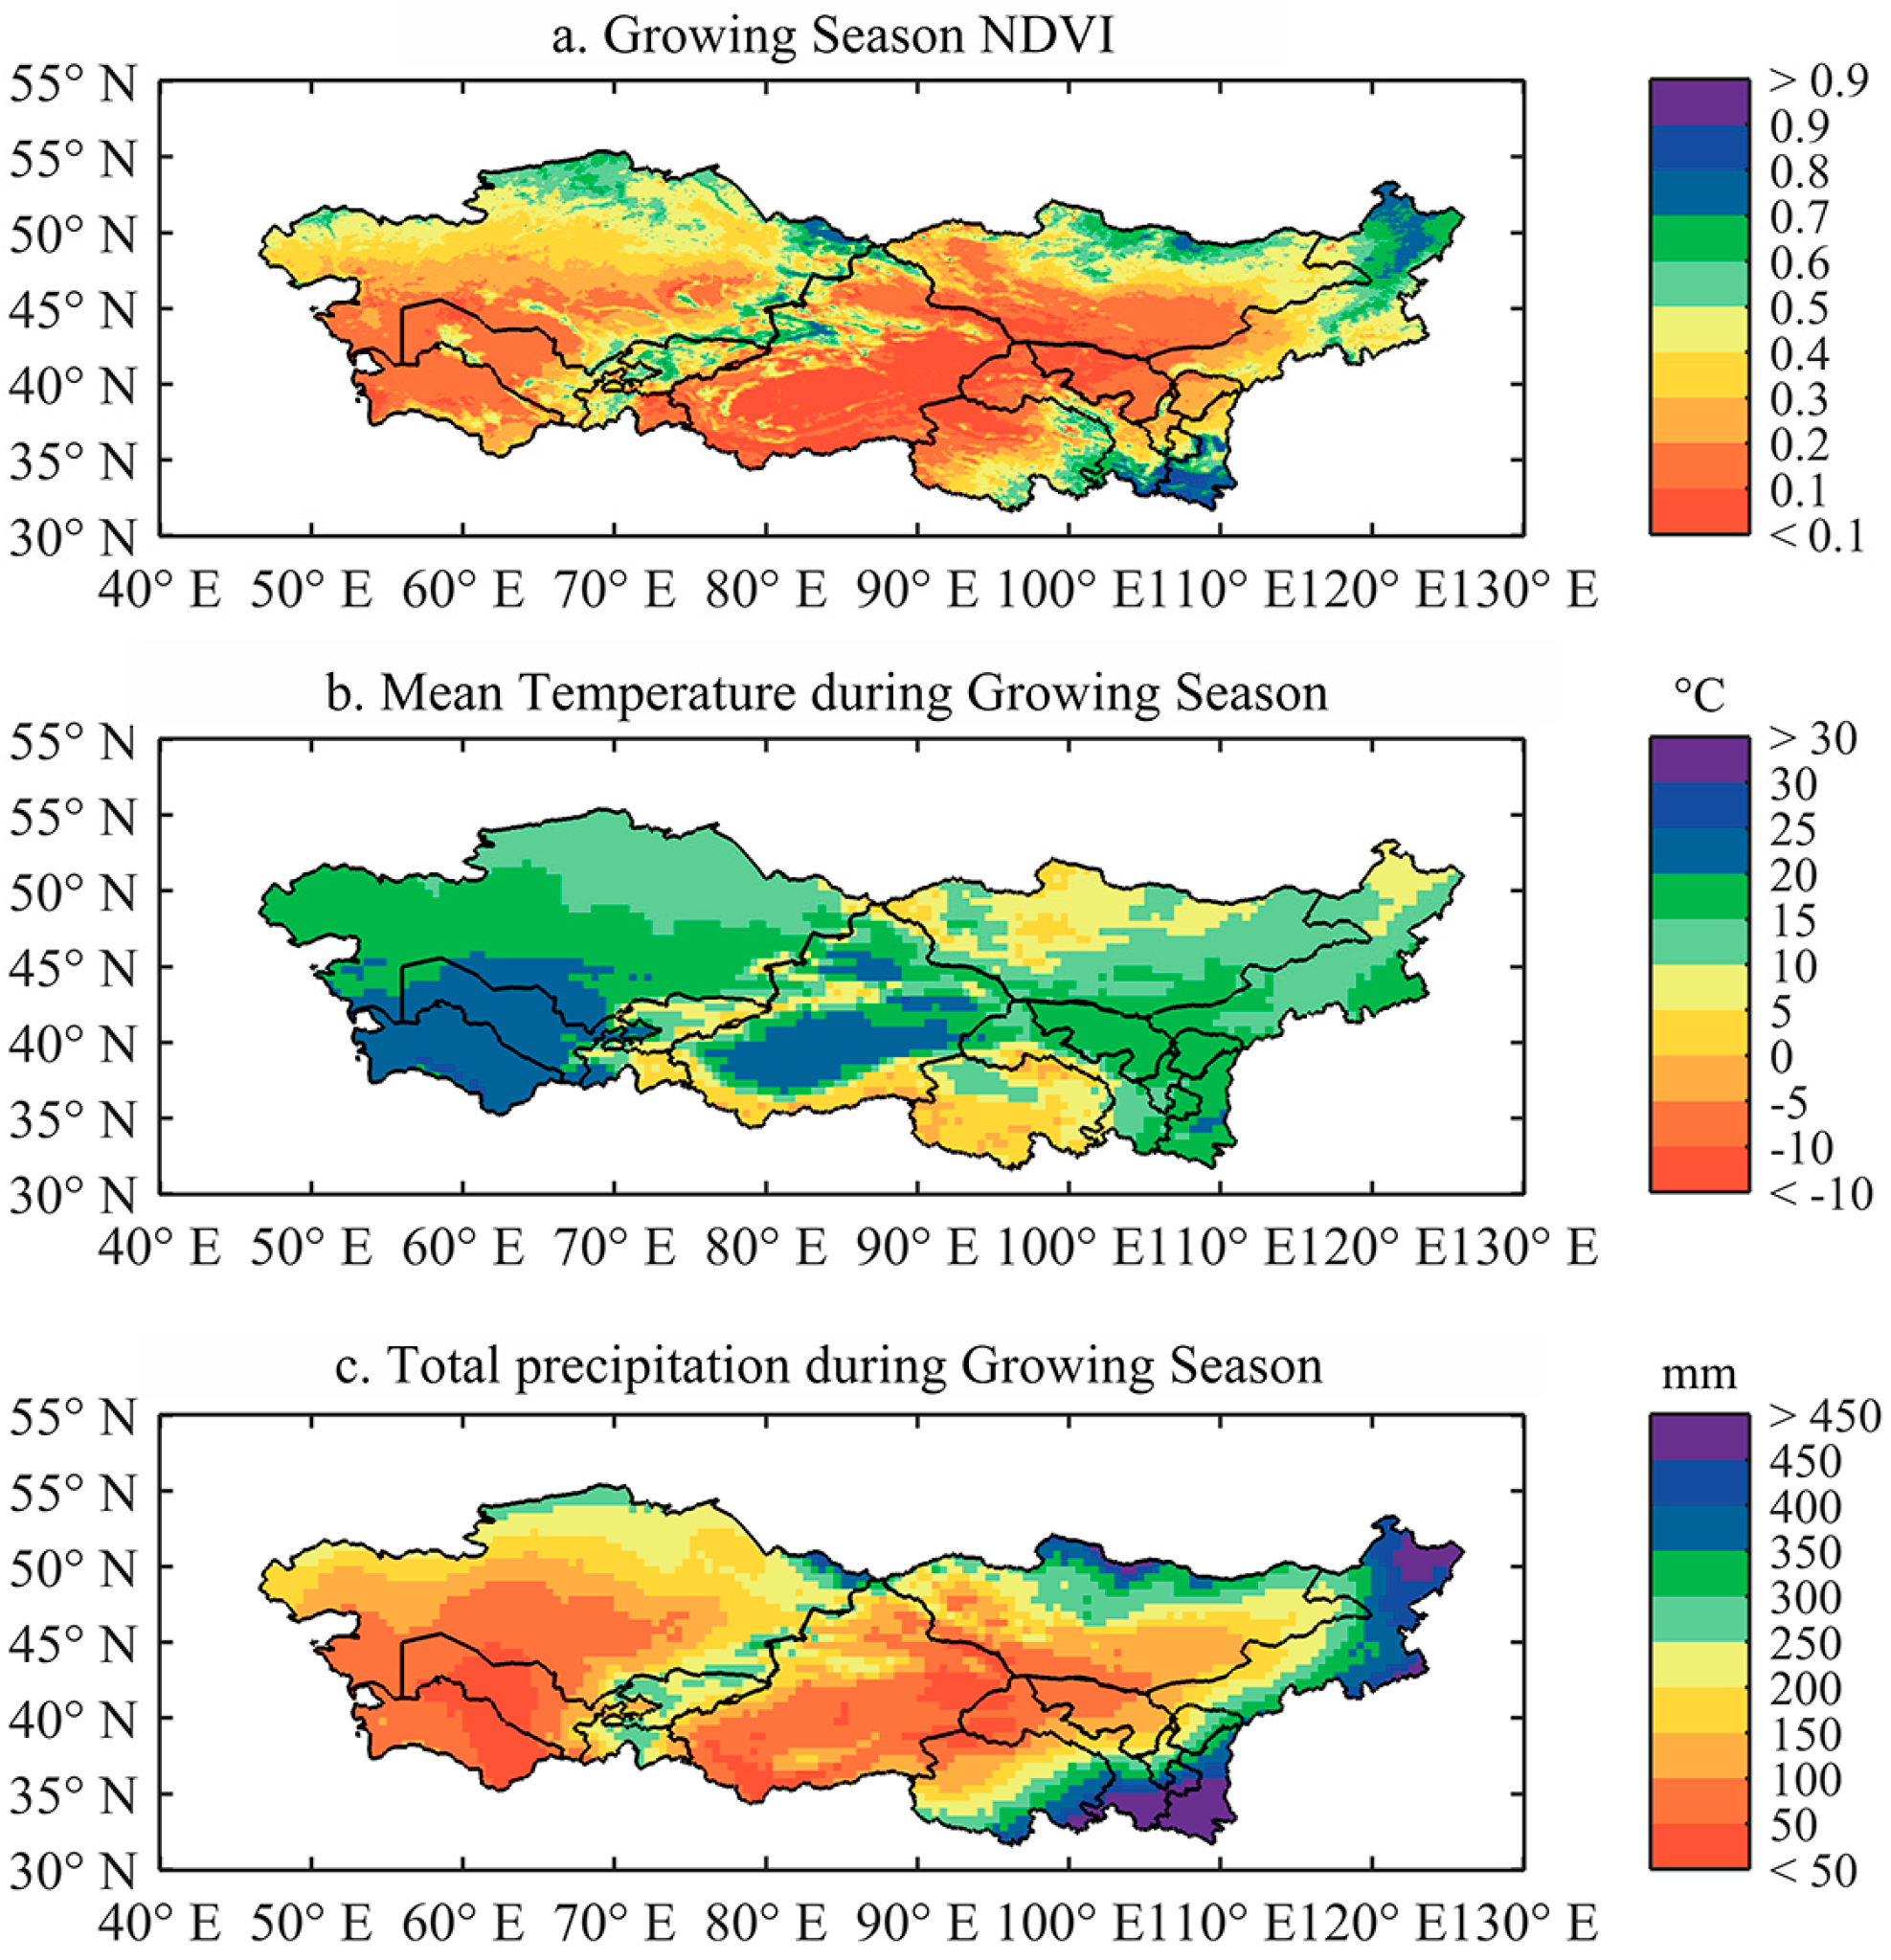
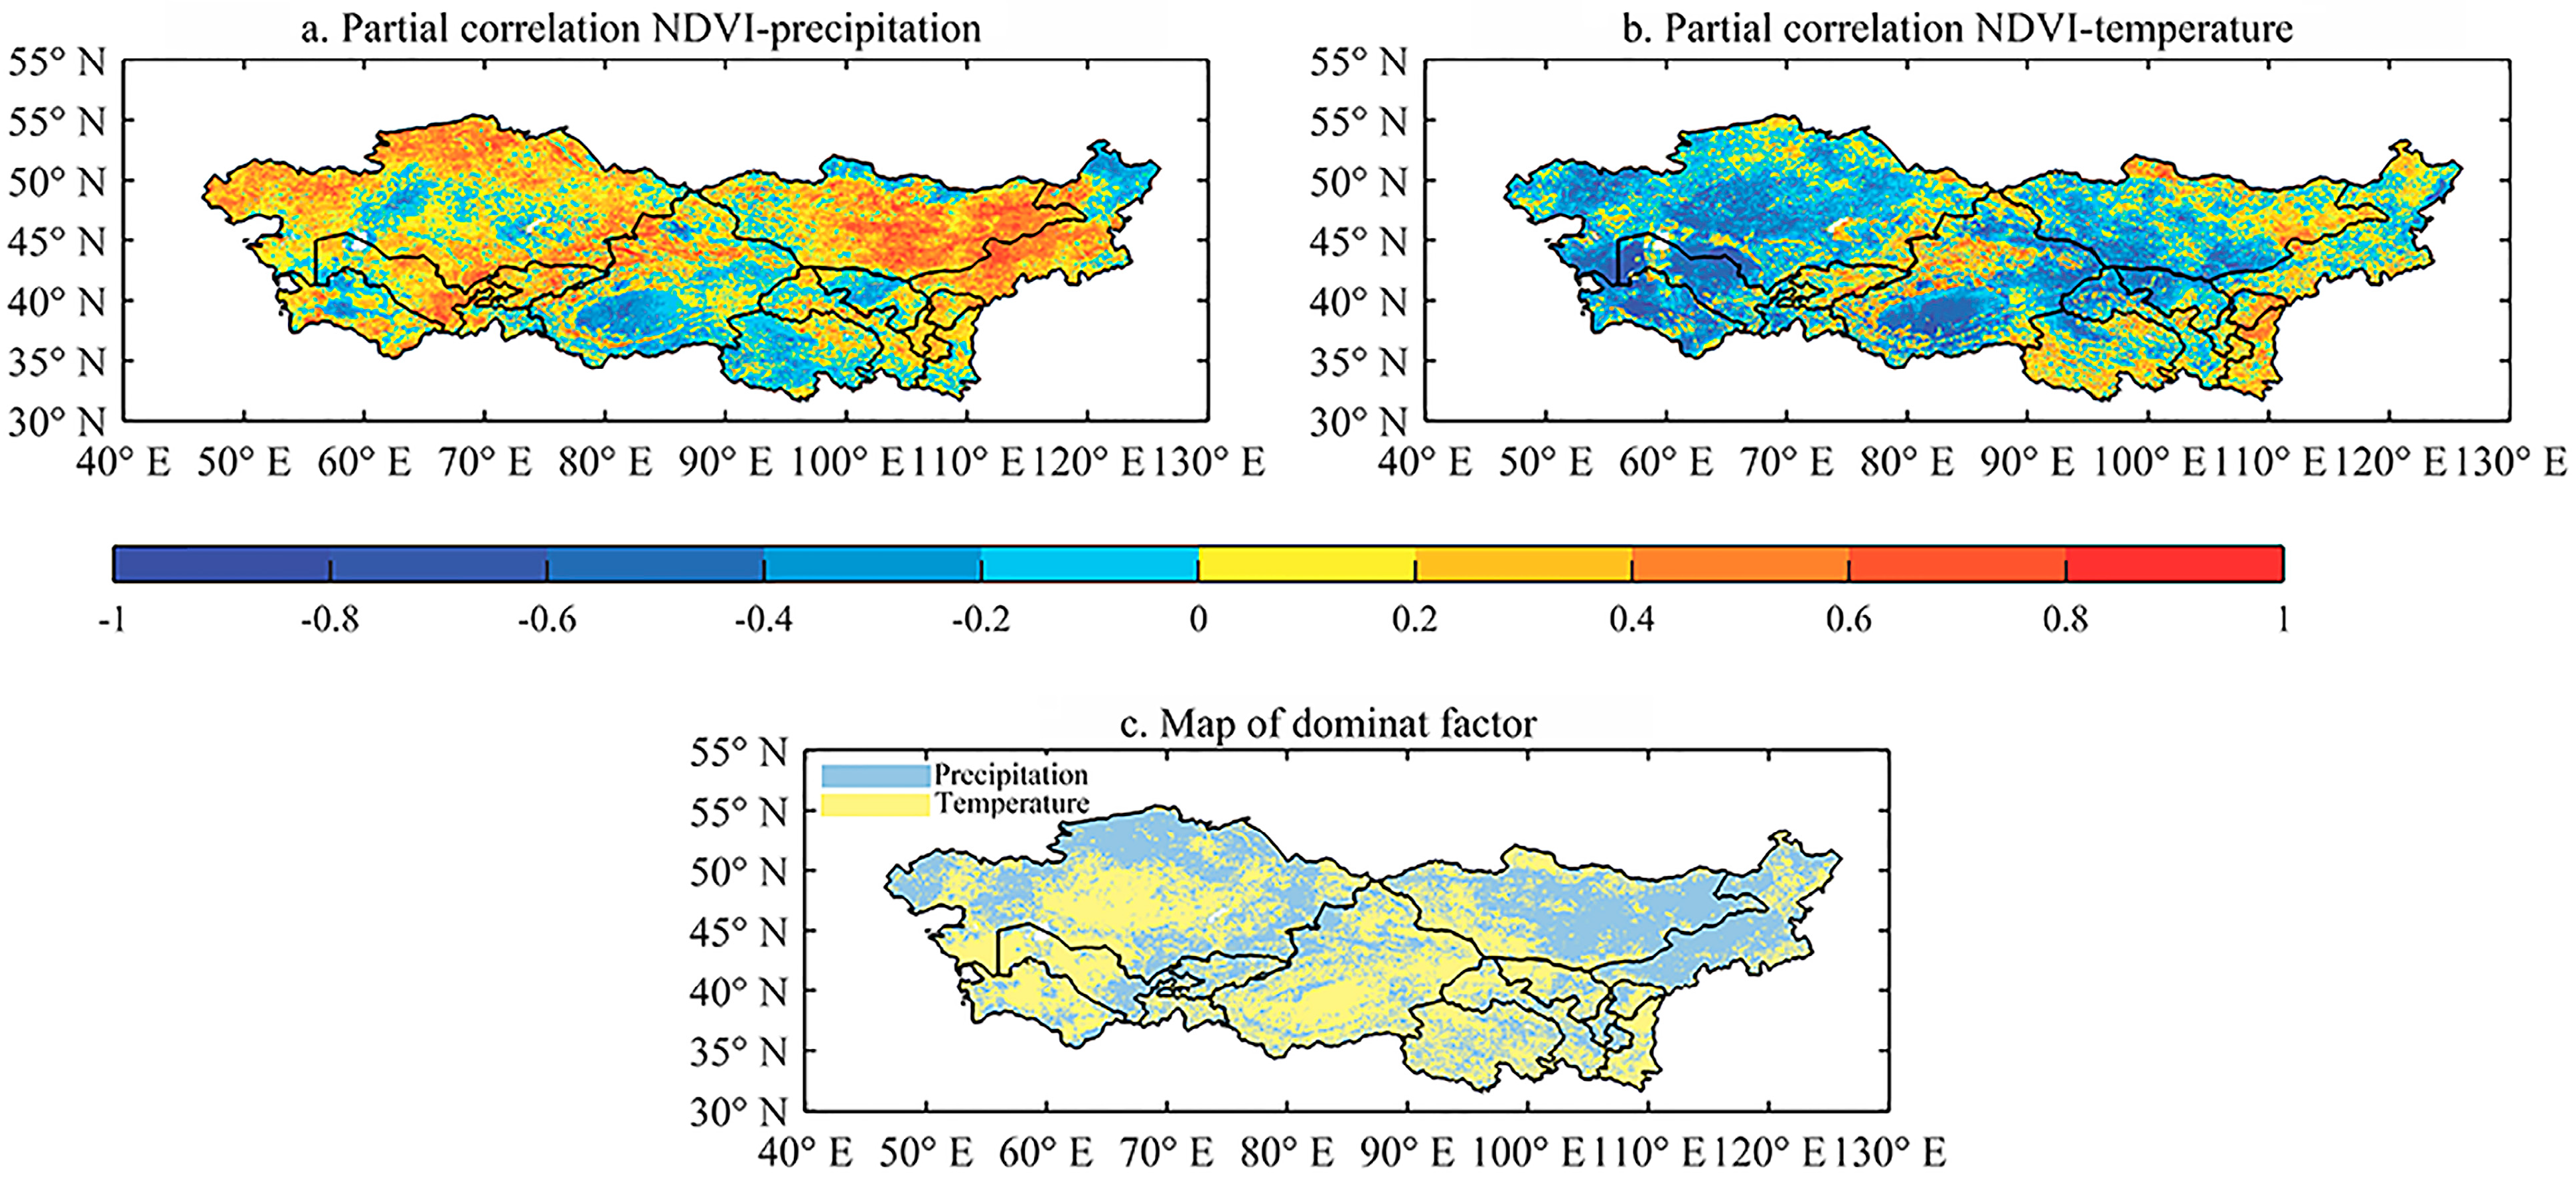
3.3. Relationship between Vegetation Growth and Climate Factors

Figure 5a,b show the partial correlation between NDVI and temperature and between NDVI and precipitation during the growing season from 1982 to 2011. There are divergent correlations among temperature, precipitation and NDVI. The spatial variation of the partial correlation coefficients shows that neither temperature nor precipitation produces a coherent effect on the entire region. Positive correlations (red section of Figure 5b) between NDVI and temperature indicate that increases in temperature enhance the growth of vegetation, although excessively high temperatures may also lead to loss of soil moisture due to evaporation in dry lands. In fact, water is the limiting factor for vegetation growth when the relationship is negative (blue section of Figure 5b), while energy is the limiting factor for vegetation growth when the relationship is positive (red section of Figure 5b) [30,31]. Precipitation plays a positive role in most of our study area: sufficient precipitation will reduce the chances or intensities of drought and improve the growth of steppes during the growing season in dry land regions. We locate the main controls of temperature and precipitation on vegetation growth over the entire area in Figure 5c. Regions such as the NWC and the middle part of MA (in yellow) are dominated by the effects of temperature, with positive or negative correlation. Regions such as the northern MA and MP show a significant positive relationship between precipitation and vegetation NDVI.
Figure 5. Partial correlation between NDVI and temperature (a) and between NDVI and precipitation (b) during the growing season and dominant control on the NDVI (c).
Remotesensing 07 03863 g005

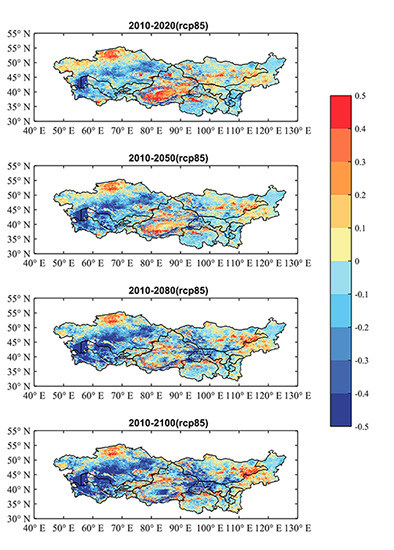
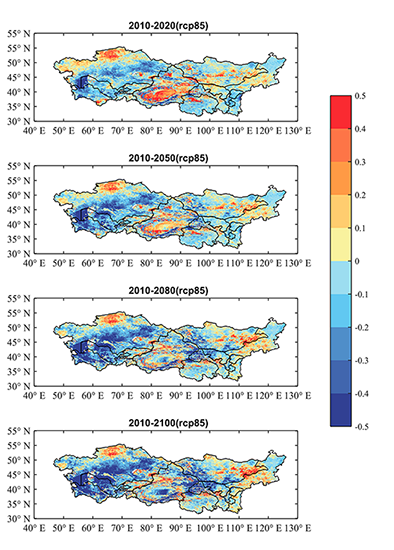
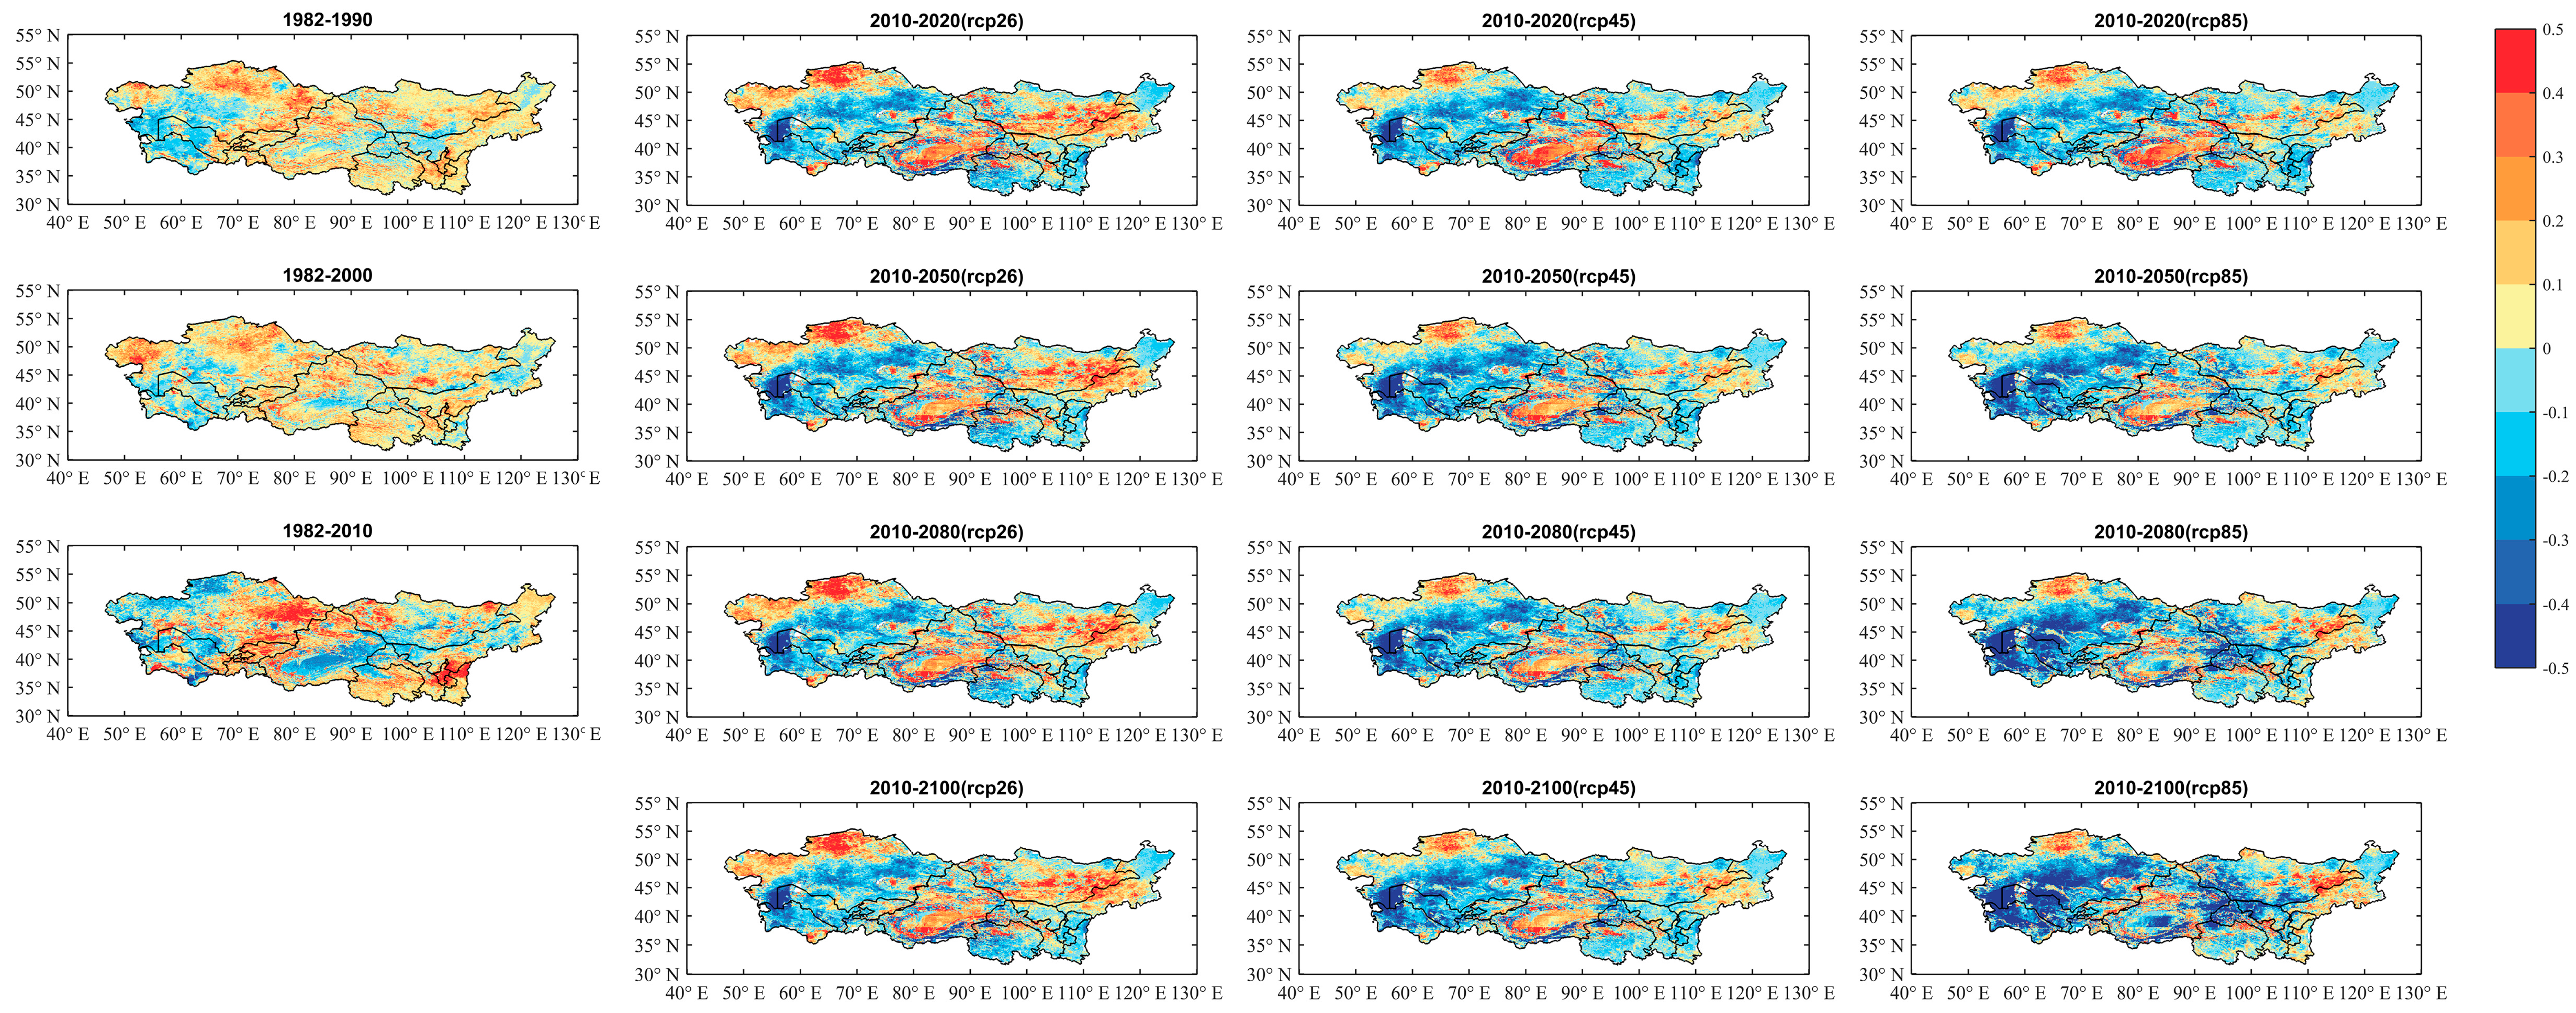
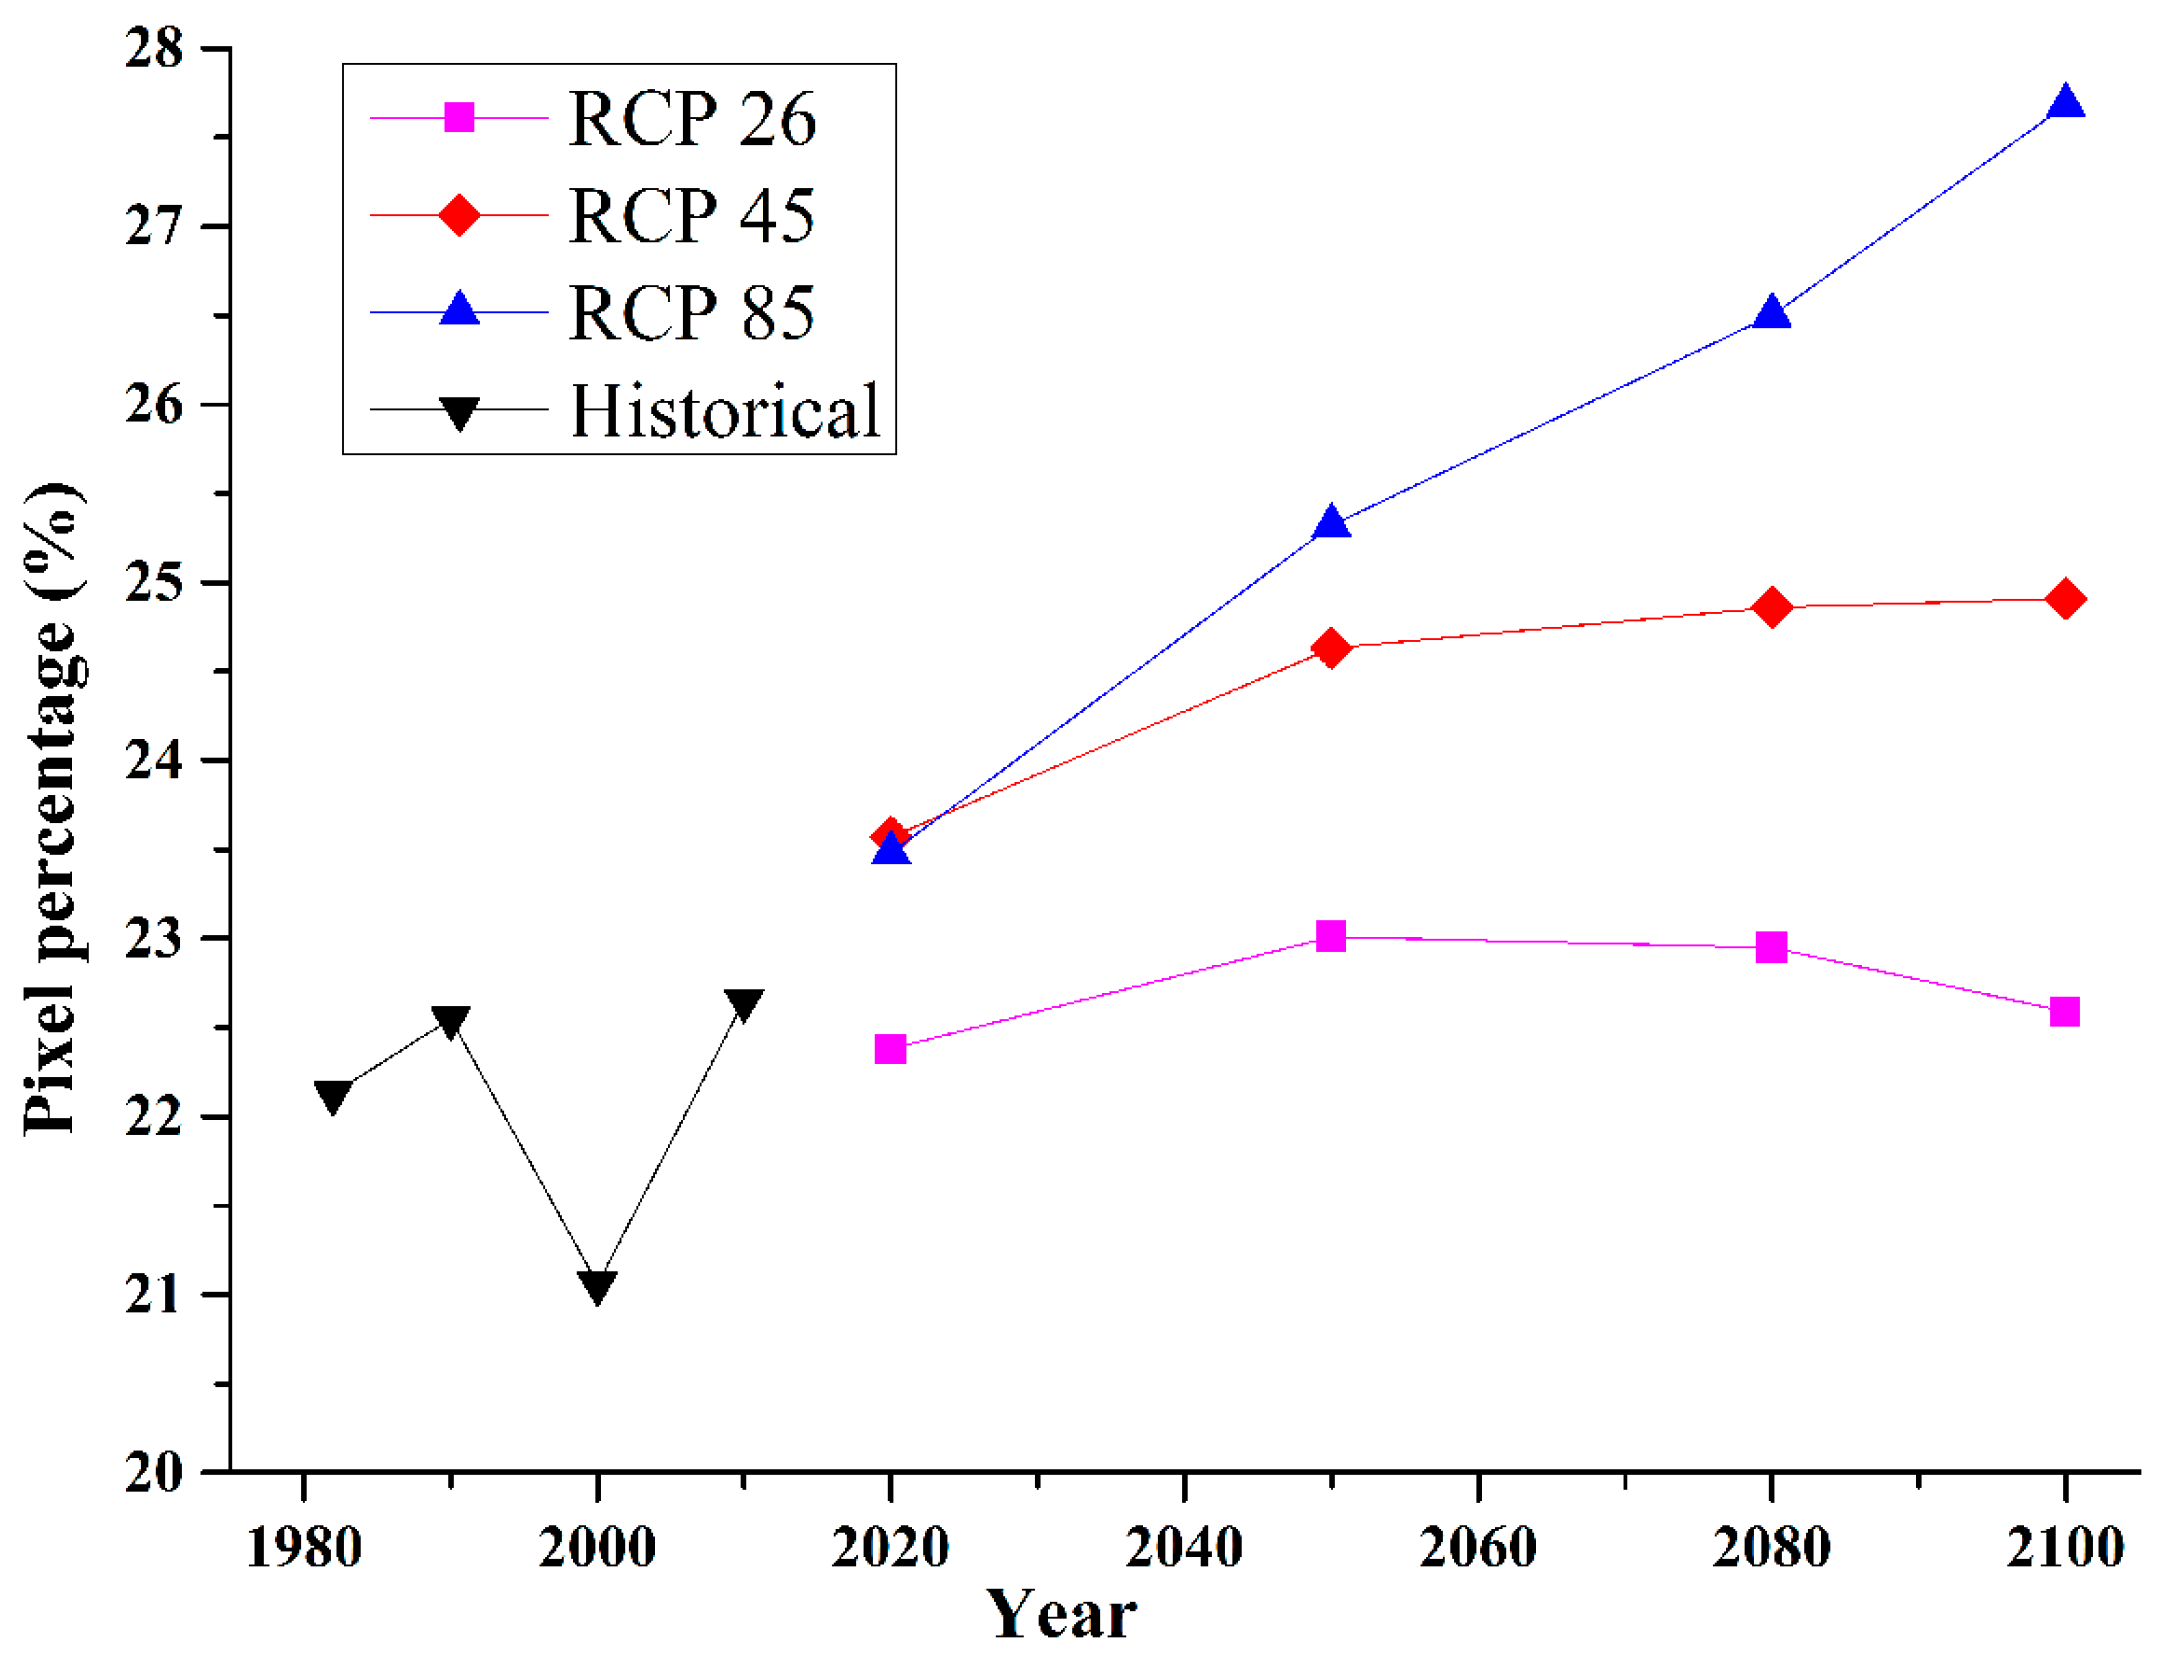
3.4. Projections of Future Vegetation NDVI Dynamics

Based on previous work, prediction of future climate and building upon multiple liner regression, we are able to predict the future vegetation dynamics using Equation (3) on a decadal scale from 2020–2100, as shown in Figure 6. This shows that there is an overall improvement but regional degeneration in the vegetation NDVI over dry land Asia from 1982–2010. Most of the degradation area is located in Xinjiang, northern Qinghai, northern Gansu, MP and eastern MA. We list the years 2020, 2050 and 2080 as specific time points for short-, middle- and long-term plans for future Chinese national development. According to the future predictions for the years 2020, 2050, 2080 and 2100 under the three scenarios, there is a substantial difference among the three scenarios in terms of the spatial patterns of the desertification extent. RCP 85 shows more serious desertification trends than the RCP 26 and RCP 45. The RCP 26 and RCP 45 scenarios show almost identical patterns, with most of the desertified regions located in the middle and northern MA, the NWC except the middle Xinjiang and the MP except the central part. Under the RCP 85 scenario, desertification from 2010–2100 in the middle and northern MA, NWC and the southwestern and northeastern MP will intensify from its status over the past three decades from 1982–2011. Vegetation in some local areas, however, may improve: for example, northern MA and the middle MP.
Bail soil and sparse vegetation regions (NDVI < 0.1) are defined as the potential desertified area in the following calculation [14]. Figure 7 shows the temporal percentage of desertified area at eight time points (1982, 1990, 2000, 2010, 2020, 2050, 2080 and 2100). During the period from 1982 to 2011, we find that the desertified area decreased before 2000 and then increased rapidly from 2000 to 2011. For the period of 2020 to 2100, the desertified area under the RCP 45 and RCP 85 scenarios increased the most rapidly, increasing from 23.6% to 24.9% and from 23.5% to 27.7% of the region, respectively. The trend under the RCP 26 scenario is the opposite: the desertified area under this scenario is the smallest among all three scenarios and will expand slowly from 2020 to 2050, then decrease from 23.0% in 2050 to 22.6% in 2100.
Figure 6. Gap of vegetation NDVI during the historical periods 1982–1990, 1982–2000 and 1982–2010 and the future periods 2010–2020, 2010–2050, 2010–2080 and 2010–2100 under three scenarios.
Remotesensing 07 03863 g006
Figure 7. Percentage of desertified area from 1982 to 2100.
Remotesensing 07 03863 g007

4. Discussion

This result is consistent with previous study over Northern Eurasia: Miao indicated that the uncertainty of BMA simulation is the smallest among all the single model outputs and SMA simulation [21]. The ensemble technique BMA can greatly improve the temperature and precipitation simulation in dry land Asia according to the Taylor diagrams in Figure 2. All three climate scenarios agree that the future will become warmer over the dry land Asia, which confirm the global warming trend identified by the IPCC AR5. Based on the BMA method, the future average temperature and the average precipitation during the growing season will both increase in the next 100 years. In terms of the temporal trends, the average temperature during the growing season over the dry land Asia will enhance at a rate of 0.7 °C per century, 2.5 °C per century and 6.4 °C per century under the RCP26, RCP45 and RCP85 scenarios, respectively. In terms of changes in spatial patterns, most of the warmer regions are located in western MP and the NWC. Precipitation trends in the future are also enhanced in the whole region, with a gradually increasing gradient from west to east, except in the western part. This highlights the vulnerable areas in arid Asia when considering future climate projections and raises the concern to look after the local environment with global warming.
The control of climate for land use and vegetation dynamics is complex over the whole area, and the dominant factors are surface air temperature and precipitation [32,33]. Overall, NDIV in regions such as the NWC and the middle part of the MA is primarily controlled by temperature, with either positive or negative correlation. The vegetation NDVI in northern MA and MP is primarily controlled by precipitation, with positive correlation. However, stressors including regional climate change and economic development impact upon land use, population growth and an increasing demand for food production have resulted in significant impacts on the dry land ecosystems in the East Asia region [5,34]. Our prediction is based on the assumption that climate is the main natural driving factor controlling the vegetation dynamics, ignoring human activity and national policy. In fact, in the future, when population grows rapidly, human pressure on the land, land degradation and water scarcity will become vital factors that will require deep consideration. It is of great importance to determine the relative contribution of both climatic and human factors.
Overall, historical vegetation trends show an overall improvement, but they have decreased in eastern middle Asia, northwestern China and the western Mongolian Plateau during the past 30 years. The “dry gets drier, wet gets wetter” paradigm has become a standard catchphrase frequently used in studies and assessments of historical and future climate change [35]. According to RCP85 scenario, the middle and northern MA, NWC and the southwestern Gobi desert and northeastern grassland region in the Xilin Gol of MP will experience the most desertified status in the next 100 years; all of these regions are in an area that will experience pronounced future warming. These highlighted warm regions will have a higher risk of drought and desertification. The future dry lands area in Dry Land Asia will expand according to a rapid rate, which is not identified through climate index (the ratio of annual precipitation to annual potential evapotranspiration) [1].

5. Conclusions

This work was the first attempt to assess the impact of future climate on desertification in dry land Asia by applying remote sensing data and climate model projections. The future temperature and precipitation trends were analyzed using SMA and BMA methodologies basing on 22 CMIP5 models output under the three RCP scenarios. In this study in dry land Asia, Bayesian Model Averaging Method proves to be an advanced tool applied in multi-model ensemble simulations and shows better coefficient than individual climate models or the Simple Model Average Method. Both the average growing season temperature and precipitation would increase in year 2100 than that in 2006. Based on the partial correlation analysis between climate and vegetation growth, we concluded that water and energy were controlling vegetation growth in different regions. Applying the historical relationships into future perspective, RCP85 scenario shows the most desertified trend in the future from 2020 to 2100 and most of the regions are located in the warming areas, including middle and northern parts of middle Asia, northwestern China and the Mongolian Plateau. In the future, human activities and extreme weather events will be discussed when conducting future prediction of desertification trends when dry land ecosystem adapts to climate change.

Acknowledgments

The work is financially supported by the National Basic Research Development Program of China (Grant No. 2011CB952001) and the National Science Foundation of China (Grant No. 41271542) and is sponsored by the State Foundation for Studying Abroad to visit the United Kingdom.

Author Contributions

Lijuan Miao and Xuefeng Cui designed the study. Lijuan Miao wrote the main manuscript text. Bin He, Lizi Chen and Xuefeng Cui modified the manuscript. Lijuan Miao and Peilong Ye processed and analyzed the data. All authors have reviewed the manuscript.

Conflicts of Interest

The authors declare no conflict of interest.

References

  1. Feng, S.; Fu, Q. Expansion of global drylands under a warming climate. Atmos. Chem. Phys. 2013, 13, 10081–10094. [Google Scholar] [CrossRef]
  2. Sivakumar, M. Interactions between climate and desertification. Agric. For. Meteorol. 2007, 142, 143–155. [Google Scholar] [CrossRef]
  3. Mortimore, M.; Anderson, S. Dryland Opportunities: A new Paradigm for People, Ecosystems and Development; IUCN: Gland, Switzerland; IIED: London, UK; UNDP: New York, NY, 2009. [Google Scholar]
  4. Watts, M. Drought, environment and food security: Some reflections on peasants, pastoralists and commoditization in dryland west Africa. Drought Hunger Afr. 1987, 171–211. [Google Scholar]
  5. Reynolds, J.F.; Smith, D.M.S.; Lambin, E.F.; Turner, B.L.; Mortimore, M.; Batterbury, S.P.J.; Downing, T.E.; Dowlatabadi, H.; Fernández, R.J.; Herrick, J.E.; et al. Global desertification: Building a science for dryland development. Science 2007, 316, 847–851. [Google Scholar] [CrossRef] [PubMed]
  6. Lioubimtseva, E.; Henebry, G.M. Climate and environmental change in arid central asia: Impacts, vulnerability, and adaptations. J. Arid Environ. 2009, 73, 963–977. [Google Scholar] [CrossRef]
  7. Hellden, U. Desertification: Time for an assessment? Ambio 1991, 20, 372–383. [Google Scholar]
  8. IPCCAR5. In Climate Change 2013: The Physical Science Basis; Cambridge University Press: Cambridge, UK/New York, NY, USA, 2014.
  9. Thomas, R.J. Opportunities to reduce the vulnerability of dryland farmers in central and west Asia and north Africa to climate change. Agric. Ecosyst. Environ. 2008, 126, 36–45. [Google Scholar] [CrossRef]
  10. Huang, J.; Guan, X.; Ji, F. Enhanced cold-season warming in semi-arid regions. Atmos. Chem. Phys. 2012, 12, 5391–5398. [Google Scholar] [CrossRef]
  11. Ci, L.J.; Yang, X.H.; Chen, Z.X. The potential impacts of climate change scenarios on desertification in China. Earth Sci. Front. 2002, 9, 287–294. (In Chinese) [Google Scholar]
  12. Piao, S.; Nan, H.; Huntingford, C.; Ciais, P.; Friedlingstein, P.; Sitch, S.; Peng, S.; Ahlstrom, A.; Canadell, J.G.; Cong, N.; et al. Evidence for a weakening relationship between interannual temperature variability and northern vegetation activity. Nat. Commun. 2014, 5. [Google Scholar] [CrossRef] [PubMed] [Green Version]
  13. Miao, L.; Jiang, C.; Xue, B.; Liu, Q.; He, B.; Nath, R.; Cui, X. Vegetation dynamics and factor analysis in arid and semi-arid inner Mongolia. Environ. Earth Sci. 2015, 73, 1–10. [Google Scholar] [CrossRef]
  14. Zhou, L.; Tucker, C.J.; Kaufmann, R.K.; Slayback, D.; Shabanov, N.V.; Myneni, R.B. Variations in northern vegetation activity inferred from satellite data of vegetation index during 1981 to 1999. J. Geophys. Res.: Atmos. 2001, 106, 20069–20083. [Google Scholar] [CrossRef]
  15. Miao, L.; Luan, Y.; Luo, X.; Liu, Q.; Moore, J.C.; Nath, R.; He, B.; Zhu, F.; Cui, X. Analysis of the phenology in the mongolian plateau by inter-comparison of global vegetation datasets. Remote Sens. 2013, 5, 5193–5208. [Google Scholar] [CrossRef]
  16. Lunetta, R.S.; Knight, J.F.; Ediriwickrema, J.; Lyon, J.G.; Worthy, L.D. Land-cover change detection using multi-temporal MODIS NDVI data. Remote Sens. Environ. 2006, 105, 142–154. [Google Scholar] [CrossRef]
  17. Wang, J.; Dong, J.; Liu, J.; Huang, M.; Li, G.; Running, S.; Smith, W.; Harris, W.; Saigusa, N.; Kondo, H.; et al. Comparison of gross primary productivity derived from gimms NDVI3g, GIMMS, and MODIS in southeast Asia. Remote Sens. 2014, 6, 2108–2133. [Google Scholar] [CrossRef]
  18. Jiang, N.; Zhu, W.; Zheng, Z.; Chen, G.; Fan, D. A comparative analysis between GIMSS NDVIG and NDVI3G for monitoring vegetation activity change in the northern hemisphere during 1982–2008. Remote Sens. 2013, 5, 4031–4044. [Google Scholar] [CrossRef]
  19. Luo, X.; Chen, X.; Xu, L.; Myneni, R.; Zhu, Z. Assessing performance of NDVI and NDVI3G in monitoring leafunfolding dates of the deciduous broadleaf forest in northern China. Remote Sens. 2013, 5, 845–861. [Google Scholar] [CrossRef]
  20. Casanova, S.; Ahrens, B. On the weighting of multimodel ensembles in seasonal and short-range weather forecasting. Mon. Weather Rev. 2009, 137, 3811–3822. [Google Scholar] [CrossRef]
  21. Miao, C.; Duan, Q.; Sun, Q.; Huang, Y.; Kong, D.; Yang, T.; Ye, A.; Di, Z.; Gong, W. Assessment of CMIP5 climate models and projected temperature changes over northern Eurasia. Environ. Res. Lett. 2014, 9, 055007. [Google Scholar] [CrossRef]
  22. Raftery, A.E.; Gneiting, T.; Balabdaoui, F.; Polakowski, M. Using bayesian model averaging to calibrate forecast ensembles. Mon. Weather Rev. 2005, 133, 1155–1174. [Google Scholar] [CrossRef]
  23. Taylor, K.E. Summarizing multiple aspects of model performance in a single diagram. J. Geophys. Res.: Atmos. 2001, 106, 7183–7192. [Google Scholar] [CrossRef]
  24. Mohammat, A.; Wang, X.; Xu, X.; Peng, L.; Yang, Y.; Zhang, X.; Myneni, R.B.; Piao, S. Drought and spring cooling induced recent decrease in vegetation growth in inner asia. Agric. For. Meteorol. 2013, 178–179, 21–30. [Google Scholar] [CrossRef]
  25. Fang, J.; Piao, S.; Zhou, L.; He, J.; Wei, F.; Myneni, R.B.; Tucker, C.J.; Tan, K. Precipitation patterns alter growth of temperate vegetation. Geophys. Res. Lett. 2005, 32, 21411. [Google Scholar] [CrossRef]
  26. Wang, J.; Price, K.; Rich, P. Spatial patterns of NDVI in response to precipitation and temperature in the central Great Plains. Int. J. Remote Sens. 2001, 22, 3827–3844. [Google Scholar] [CrossRef]
  27. Kawabata, A.; Ichii, K.; Yamaguchi, Y. Global monitoring of interannual changes in vegetation activities using NDVI and its relationships to temperature and precipitation. Int. J. Remote Sens. 2001, 22, 1377–1382. [Google Scholar] [CrossRef]
  28. Herrmann, S.M.; Anyamba, A.; Tucker, C.J. Recent trends in vegetation dynamics in the African Sahel and their relationship to climate. Glob. Environ. Chang. 2005, 15, 394–404. [Google Scholar] [CrossRef]
  29. Shi, Y.F.; Shen, Y.P.; Li, D.L.; Zhang, G.W.; Ding, Y.J.; HU, R.J.; Kang, E.S. Discussion on the present climate change from warm dry to warm wet in northwest China. Quat. Sci. 2003, 23, 152–164. [Google Scholar]
  30. Karnieli, A.; Bayasgalan, M.; Bayarjargal, Y.; Agam, N.; Khudulmur, S.; Tucker, C. Comments on the use of the vegetation health index over Mongolia. Int. J. Remote Sens. 2006, 27, 2017–2024. [Google Scholar] [CrossRef]
  31. Karnieli, A.; Agam, N.; Pinker, R.T.; Anderson, M.; Imhoff, M.L.; Gutman, G.G.; Panov, N.; Goldberg, A. Use of NDVI and land surface temperature for drought assessment: Merits and limitations. J. Clim. 2010, 23, 618–633. [Google Scholar] [CrossRef]
  32. Park, H.-S.; Sohn, B.J. Recent trends in changes of vegetation over east asia coupled with temperature and rainfall variations. J. Geophys. Res.: Atmos. 2010, 115, D14101. [Google Scholar] [CrossRef]
  33. Propastin, P.; Kappas, M.; Muratova, N. Inter-annual changes in vegetation activities and their relationship to temperature and precipitation in central Asia from 1982 to 2003. J. Environ. Inform. 2008, 12, 75–87. [Google Scholar] [CrossRef]
  34. Qi, J.; Chen, J.; Wan, S.; Ai, L. Understanding the coupled natural and human systems in dryland east Asia. Environ. Res. Lett. 2012, 7, 015202. [Google Scholar] [CrossRef]
  35. Greve, P.; Orlowsky, B.; Mueller, B.; Sheffield, J.; Reichstein, M.; Seneviratne, S.I. Global assessment of trends in wetting and drying over land. Nat. Geosci. 2014, 7, 716–721. [Google Scholar] [CrossRef]

