Article

Validation of MODIS 3 km Resolution Aerosol Optical Depth Retrievals Over Asia

Department of Land Surveying and Geo-Informatics, The Hong Kong Polytechnic University, Hung Hom, Kowloon 999077, Hong Kong
*
Author to whom correspondence should be addressed.
Remote Sens. 2016, 8(4), 328; https://doi.org/10.3390/rs8040328
Submission received: 19 February 2016 / Revised: 1 April 2016 / Accepted: 6 April 2016 / Published: 14 April 2016

Abstract

:
This study evaluates the new Aqua MODIS Dark Target (DT) Collection 6 (C6) Aerosol Optical Depth (AOD) (MYD04_3K) retrieval algorithm at 3 km resolution over Asian countries that have recently experienced severe and increasing air pollution. Retrievals showed generally low accuracy compared with the AErosol RObotic NETwork (AERONET), with only 55% of retrievals within the expected error (EE). The uncertainty appears mainly due to systematic overestimation at both low and high AOD levels. This is attributed to under-prediction of surface reflectance, similar to, but more severe than, the C6 DT product at 10-km resolution. This is because MYD04_3K observes more noise in the surface reflectance computations, due to retention of some bright pixels in the retrieval window which would be discarded at 10 km. Greatest uncertainty was observed at urban sites, especially those dominated by coarse aerosols. Results suggest that the DT at 3 km is less reliable than MODIS C6 AOD products at 10 km.

Graphical Abstract

1. Introduction

Atmospheric aerosols are small particles from both natural and human sources suspended in the atmosphere. Since they have wide ranging impacts on climate forcing [1], visibility [2], and human health [3], their unprecedented increase over Asian countries in recent decades is a cause for concern. Asia is the largest source of aerosols and their precursor gases, with China, India, and Pakistan’s mean AOD measured at AErosol RObotic NETwork (AERONET) sites exceeding global background levels [4] by 4–5 times. The pollutant gases are involved in smog formation and are known to penetrate the lungs and circulatory system and act as precursors to fine particulates. Satellite remote sensing has been used to quantify and monitor aerosol distributions over much larger areas than can be covered by ground stations, and their optical properties including aerosol optical depth (AOD) can be derived from image visible wavebands.
MODIS on board the Terra and Aqua satellites has observed the earth since 1999 and 2002, respectively, creating an extensive geophysical dataset with 36 spectral channels, good temporal resolution of 1 to 2 days and moderate spatial resolutions of 250 m, 500 m, and 1000 m. MODIS has provided regular observations of AOD which have aided the understanding of the effects of anthropogenic aerosols at both local and global scales [5,6]. The current operational MODIS AOD product over land is known as Collection 6 (C6), which replaces Collection 5 (C5) and is based on two algorithms, namely the Dark Target (DT) [7,8,9] and Deep Blue (DB) [10,11] algorithms. The DT algorithm over land utilizes the generally bright appearance of aerosols over dark surfaces such as vegetation in the visible wavebands. If the surface reflectance is known, the residual image signal at the Top of Atmosphere (TOA) is due to atmospheric reflectance, including aerosol. The DB algorithm was introduced with C5 to retrieve AOD over bright surfaces using blue spectral bands which are not bright in this region. In C6 from 2013 onwards, it was expanded to retrieve over vegetated sites as well.
In recent years, many Asian cities have suffered severe deterioration in air quality with significant contributions from both natural and anthropogenic particulate sources. Thus, Asian aerosols are complex mixtures of coarse and fine particulates, of both light-absorbing and scattering types. The three main light-absorbing species are iron oxides in mineral dust, black carbon or soot (BC), and brown carbon (BrC), which is spectrally dependent. Light-scattering aerosols are mostly from anthropogenic sources, including sulphate, nitrate, and ammonium from coal and biomass burning, industrial, and vehicular sources [12]. As MODIS DT and DB algorithms at 10-km resolution are unable to resolve local aerosol gradients and city level features, an effective and higher resolution satellite aerosol retrieval is required. Therefore, in 2013, a global DT AOD product at a nominal resolution of 3 km (MYD04_3K) [13] was introduced in the operational C6 AOD product. This is in addition to the DT [14] and DB [15] AOD products at the standard 10-km resolution. Initially, the C6 product was available only for the Aqua satellite; therefore, in the current study, we only consider the Aqua–MODIS DT (3 km) product over land. Additionally, in a previous study [16], Terra-MODIS yielded similar results to Aqua-MODIS, with similar uncertainty. The MODIS C5 DT, and C6 DT and DB algorithms have been extensively evaluated over land [9,16,17,18,19], but the new MODIS C6 DT 3-km algorithm has not.
Therefore, this study evaluates the Aqua–MODIS C6 DT AOD algorithm at 3-km resolution over a period of 13 years—2002–2014—including low to very high aerosol loadings over seven Asian countries (China, Hong Kong, India, Japan, Pakistan, Taiwan, and Thailand) and 16 AERONET sites (Table 1). All are situated in the Asian monsoon region experiencing summer rainfall and cool dry winters; thus, most MODIS and AERONET collocations are in winter due to lower cloud cover. All five sites in Thailand as well as Gandhi College in India could be considered rural, and the rest urban or suburban, and all sites have moderate to high aerosol loading. For a comparison of MYD04_3K with areas experiencing significantly lower aerosol loadings, the Paris AERONET site, which has average AOD at 0.55 µm below 0.2 (Table 1), is additionally included.

2. Datasets

2.1. AErosol RObotic NETwork (AERONET)

AERONET is a worldwide network of calibrated ground-based Sun photometers [4,20], which provide cloud-screened and quality assured spectral AOD [21] in the range 0.340–1.060 µm with low uncertainty (0.01–0.02) and high temporal resolution (every 15 min). For validation of MYD04_3K, this study used cloud-screened and quality controlled level 2.0 AOD measurements from 16 AERONET stations for blocks of years between 2002 and 2014 (Table 1). Since AERONET AOD data at 0.55 µm are not available, AOD is interpolated into 0.55 µm using Equation (1) based on the Angström exponent (440–675α):
AOD0.55µm = AOD0.50µm (0.55/0.50)-440–675α

2.2. The MODIS DT 3 km Resolution Aerosol Retrieval Algorithm

For the development of the MODIS Dark Target (DT) aerosol retrieval algorithm over land [8,16,22,23], reflectance at the top of the atmosphere (TOA) in the 2.11 μ m channel is calculated and corrected for gas absorption. The 1.38 μ m channel at 1000 m resolution is used to mask clouds and snow/ice pixels, and other very bright surfaces are avoided using reflectance at 2.11 μ m > 0.25. The 0.66 μ m and 0.86 μ m channels at 250 m are used to mask inland water bodies. The remaining pixels are aggregated at 500 m for further processing, and the only difference between the 10-km and 3-km product is in the selection of pixels in the retrieval window [13]. For retrievals at 3-km resolution, pixels are organized into retrieval windows of 6 × 6 (36 pixels). The darkest 20% and brightest 50% of the remaining pixels for the 0.66 μ m channel are deselected with, at most, 11 pixels remaining to perform aerosol retrieval. If there are at least five pixels remaining (13%), the spectral reflectance at 0.66 μ m is calculated for that window. The 10-km DT algorithm, on the other hand, uses a retrieval box of 20 × 20 (400 pixels) at 500 m, of which at most, 120 and a minimum of 51 (14%) remain after deselection. The DT AOD product at 3 km is then developed from the spectral reflectance using a similar look-up-table (LUT) and inversion based on the ratio of visible and shortwave infrared (VISvs2.1), as the 10-km product [13,14]. The MYD04_3K is expected to resolve aerosol gradients and pollution sources such as smoke plumes, which are missed at 10 km. However, since there are more pixels to select from in the deselection process at 10 km, dark or bright pixels discarded at 10 km might be retained at 3 km, which makes the DT 3 km potentially noisier than the 10-km product. Accordingly, the expected error (EE) over land for the DT algorithm at 3 km is ± (0.05% + 20%), which is slightly less stringent than the ± (0.05% +15%) for the 10-km product [13,14,24,25]. In general, the quality of the MODIS aerosol retrievals depends on accuracy of the surface reflectance and of the aerosol model, and over- or underestimation during both clear and polluted conditions is normally caused by error in these two factors [26,27,28,29]. The MODIS C6 DT 10-km AOD product has been observed to significantly and systematically overestimate AOD over Asian cities [19,30,31,32,33].

3. Methods

In this study, the DT C6 AOD product at 3 km (MYD04_3K) was generated from the MODIS Level-1 and Atmosphere Archive and Distribution System (http://ladsweb.nascom.nasa.gov) for the years 2002–2014 (Table 1). Only the highest quality flag (QF = 3) AOD observations [14] were utilized. Retrievals were validated using collocated MYD04_3K and level 2.0 AOD from AERONET sites. To increase the number of statistical samples for validation, collocation was defined as the average of at least two AERONET AOD measurements between 12:00 and 14:00 local time and at least two pixels of MODIS AOD observations within a sampling window of 3 × 3 pixels (average of 9 pixels) centered on the AERONET site, i.e., the average of a 9 km × 9 km spatial region for the MYD04_3K. The total collocated observations over all AERONET sites amount to 5522 observations. Deming regression, an orthogonal regression technique was used to estimate the slope and intercept of the datasets, and the accuracy of retrievals was evaluated using root mean square error (RMSE), mean absolute error (MAE), expected error (EE), and relative mean bias (RMB). For comparison purposes, the MODIS DT C6 AOD product at 10-km resolution was also downloaded and evaluated for all stations, with a total of 6487 collocations over all AERONET sites.

4. Results and Discussion

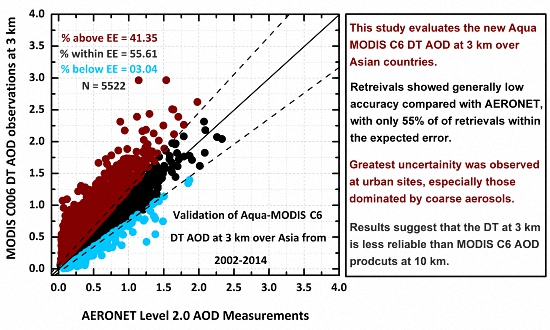
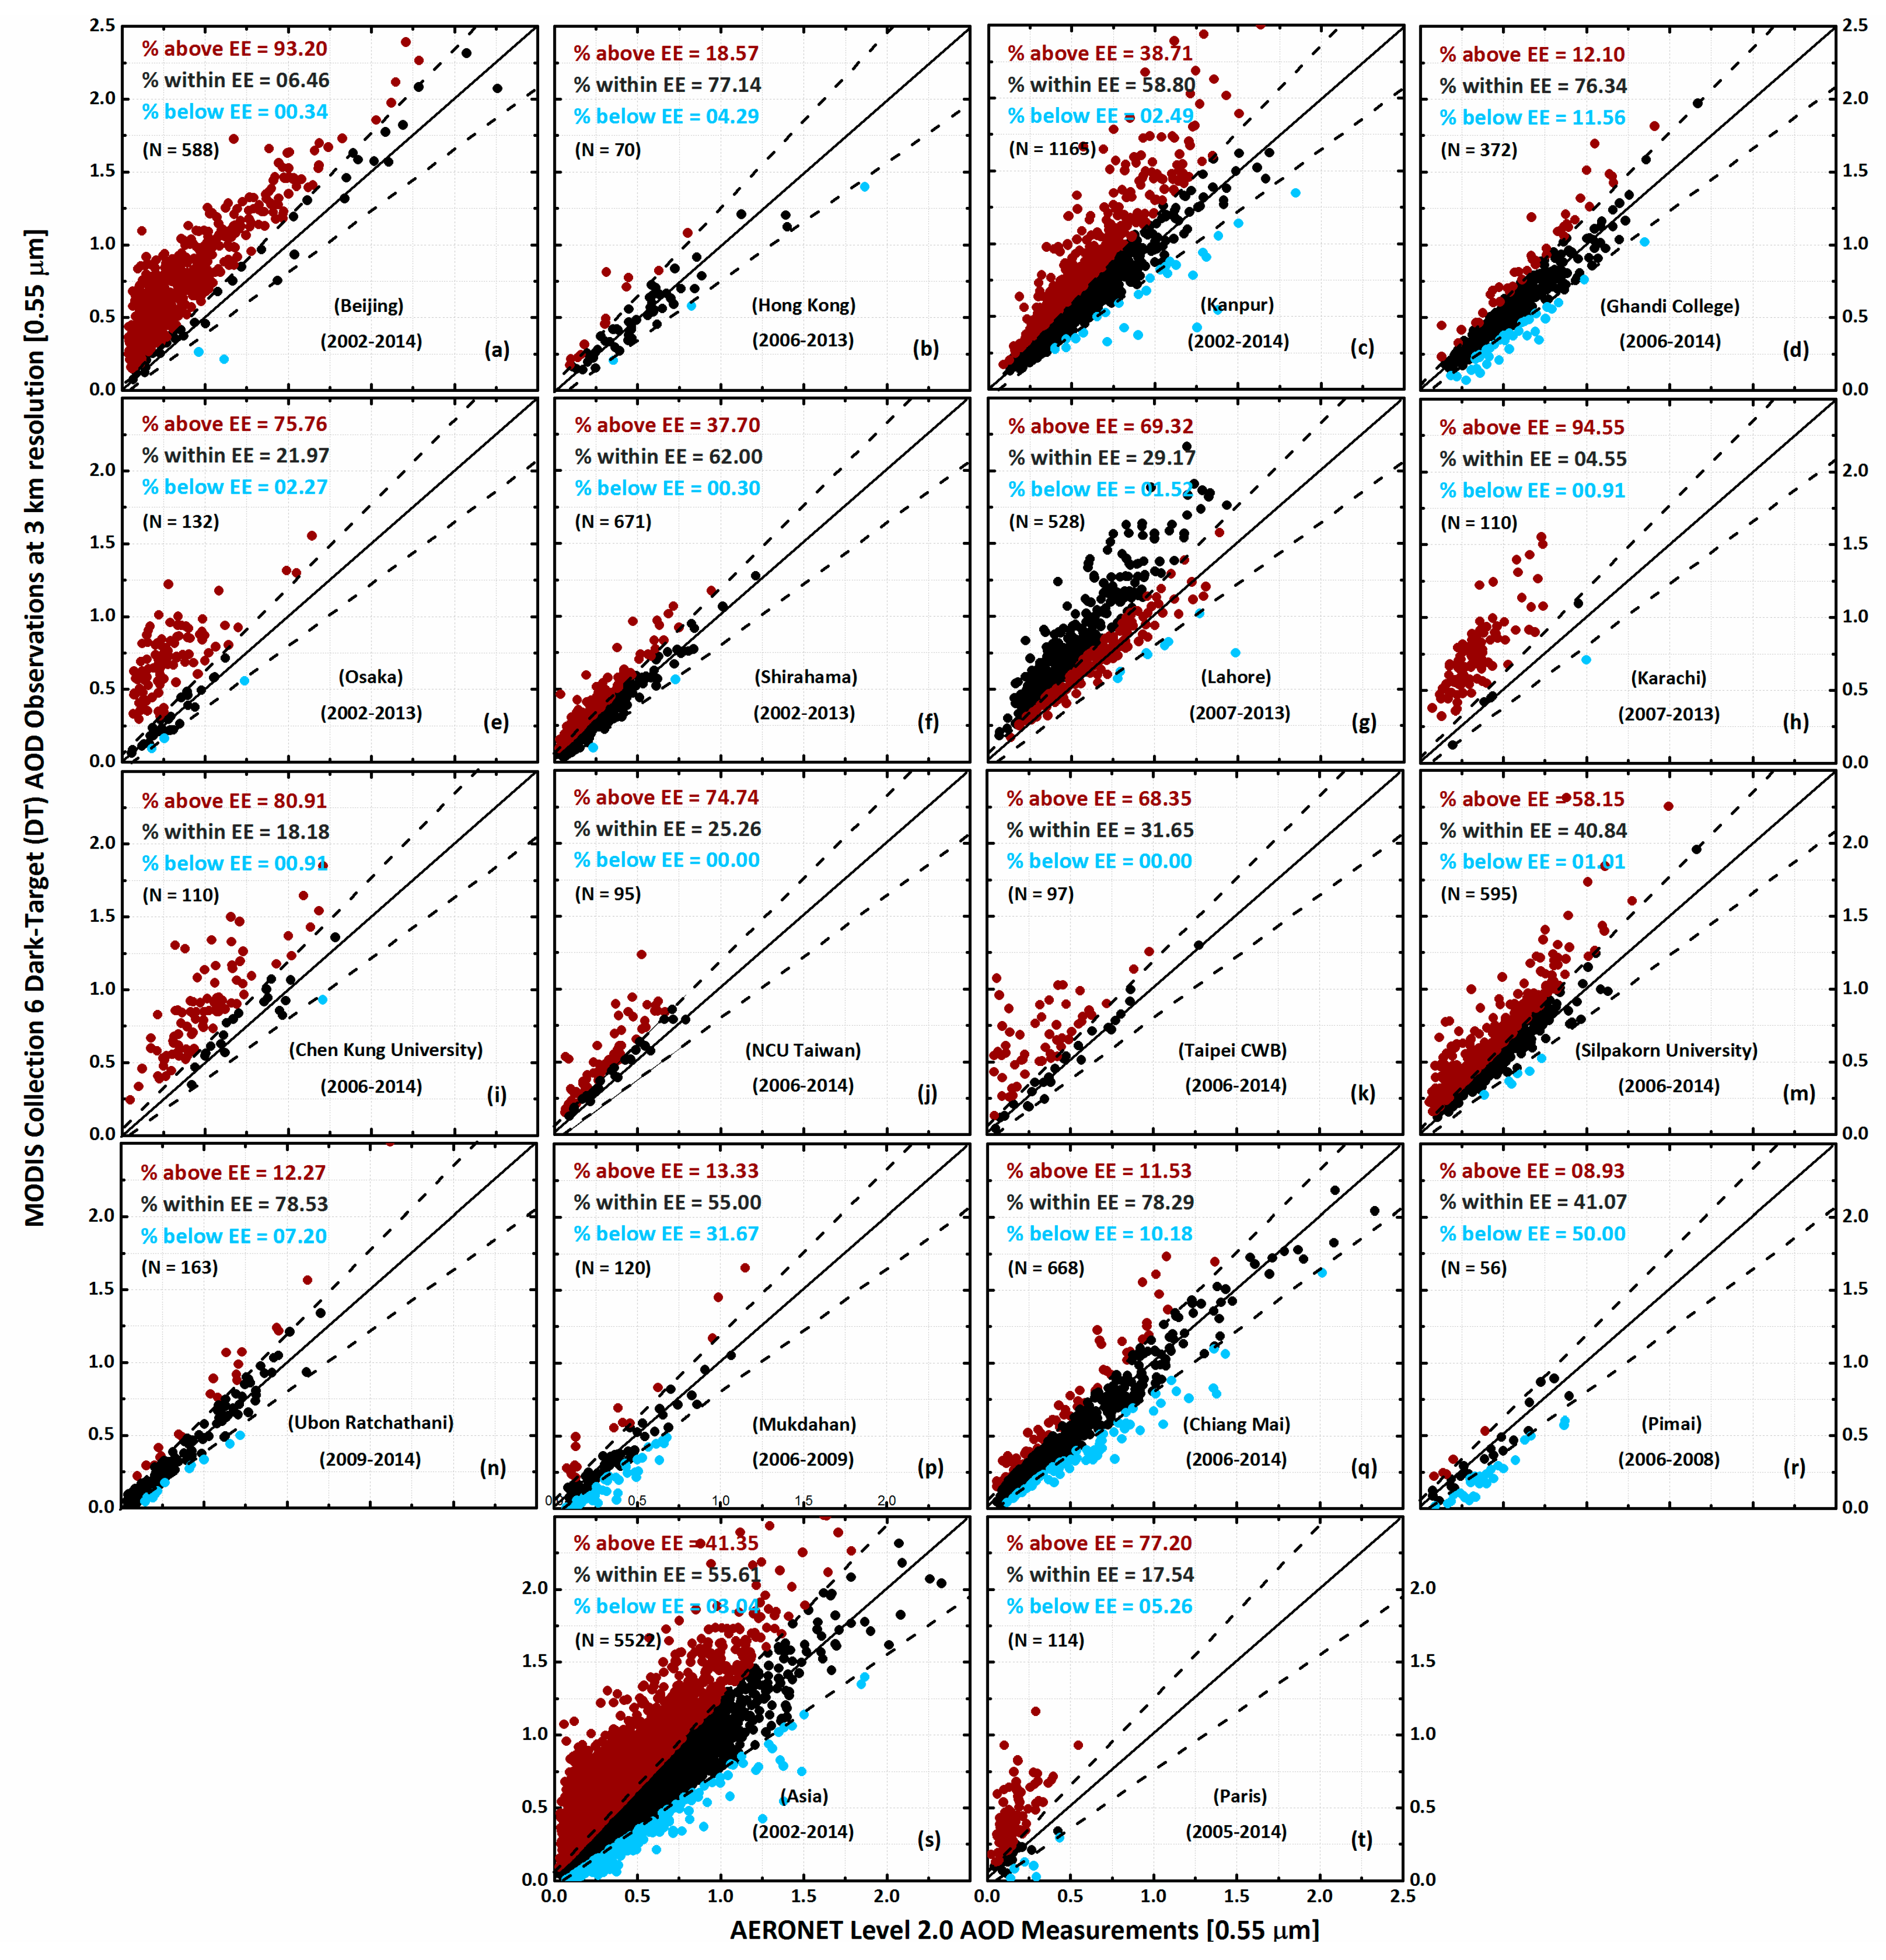
4.1. Performance of the DT 3-km AOD Algorithm

AOD retrieved from MYD04_3K is compared with AERONET AOD measurements (Figure 1 and Table 2). Of the total of 5522 collocations at Asian AERONET sites, only 55% fall within the EE, but there is wide variation between sites (Table 2). The greatest uncertainty is observed at urban sites dominated by coarse aerosols including Beijing, Karachi, and Osaka, with only 6.5%, 4.5%, and 22% of observations, respectively, falling within the EE. These sites show a large positive offset from AERONET observations during both low and high aerosol loadings, indicating underestimation of the surface reflectance by the VISvs2.1 relationship. This is similar to the C6 DT algorithm at 10 km, which was also found to overestimate over cities in China and Pakistan, with a constant offset against AERONET [19,32], which was attributed to a large negative bias in surface reflectance estimation. This overestimation of AOD by the DT 3-km product was observed at 14 out of the 16 sites examined, the exceptions being the rural sites, which showed either underestimates (Mukdahan and Pimai) or no significant low or high bias (Gandhi College, Chiang Mai, and Ubon Ratchathani). Combining all sites shows a large and significant overestimation, with 41.3% above the EE. For Beijing and Karachi in particular, with only 4% and 6%, respectively, within the EE, both have high aerosol loadings; thus, using a correct aerosol model is important [14]. For both, the slope between MOD04_3K and AERONET is significantly greater than one, suggesting that there is too much absorption in the model [34]. These are cities downwind of large deserts, for which a coarse mode aerosol model, which is considered weakly absorbing, is used [14]. Mixing with non-absorbing fine mode aerosols from urban pollution would result in over-prediction of absorption, causing overestimation of AOD. This may also be true for Osaka, an urban site where coarse aerosols from Chinese dust also dominate, and the large offset and steep slope (1.49) between MYD04_3K and AERONET result in only 22% of observations within the EE. Levy et al. [14] also noted this potential problem in such areas.
The more rural vegetated sites—Gandhi College, Ubon_Ratchathani, Chiang Mai, and Mukdahan—show better retrievals, with 76%, 78%, 78%, and 55% within the EE, which is not surprising, as the DT algorithm is tuned to vegetated targets. However, at these sites, in addition to overestimation at high AOD levels, there is significant underestimation at low AOD levels, suggesting that there is too little absorption in the model, possibly because these sites are situated in rural areas, where carbon particles are released year-round from domestic fires, whereas the DT algorithm uses a strongly absorbing aerosol model only in the December–February biomass burning season [14]. The rural site of Pimai in Thailand is an exception, being a rural site with poor quality of retrievals with only 41% within the EE. Most retrievals for this site were in the dry season when agricultural fields are bare, giving a relatively bright surface, which is not ideal for the DT AOD algorithm.
The urban coastal site of Hong Kong shows the best results, having 77% of observations within the EE. The very dense and high rise environment around the AERONET site creates much shadow on images especially in winter, with a low sun angle, when most clear sky images are obtained. The relatively few collocations available for this site (only 70 over a 7-year period) is due to cloud cover in summer when the sun is overhead. The long shadows, which may remain in the pixel averages, even after DT’s elimination of the 20% darkest pixels, may result in less underestimation of the surface reflectance than at other urban sites, as the error in the VISvs2.1 relationship is greater for brighter surfaces.
Surprisingly, the Paris site where AOD levels are 2 to 5 times lower than the Asian sites shows the lowest correlation (R = 0.44) as well as very low accuracy, having only 17% within the EE. Overestimation is especially apparent at higher AOD levels above 0.5, which exceed AERONET by a factor of 2 or more. This site also has the highest RMB and steepest slope (2.38) among all sites, suggesting that the weakly absorbing fine mode aerosol model used may be inappropriate.

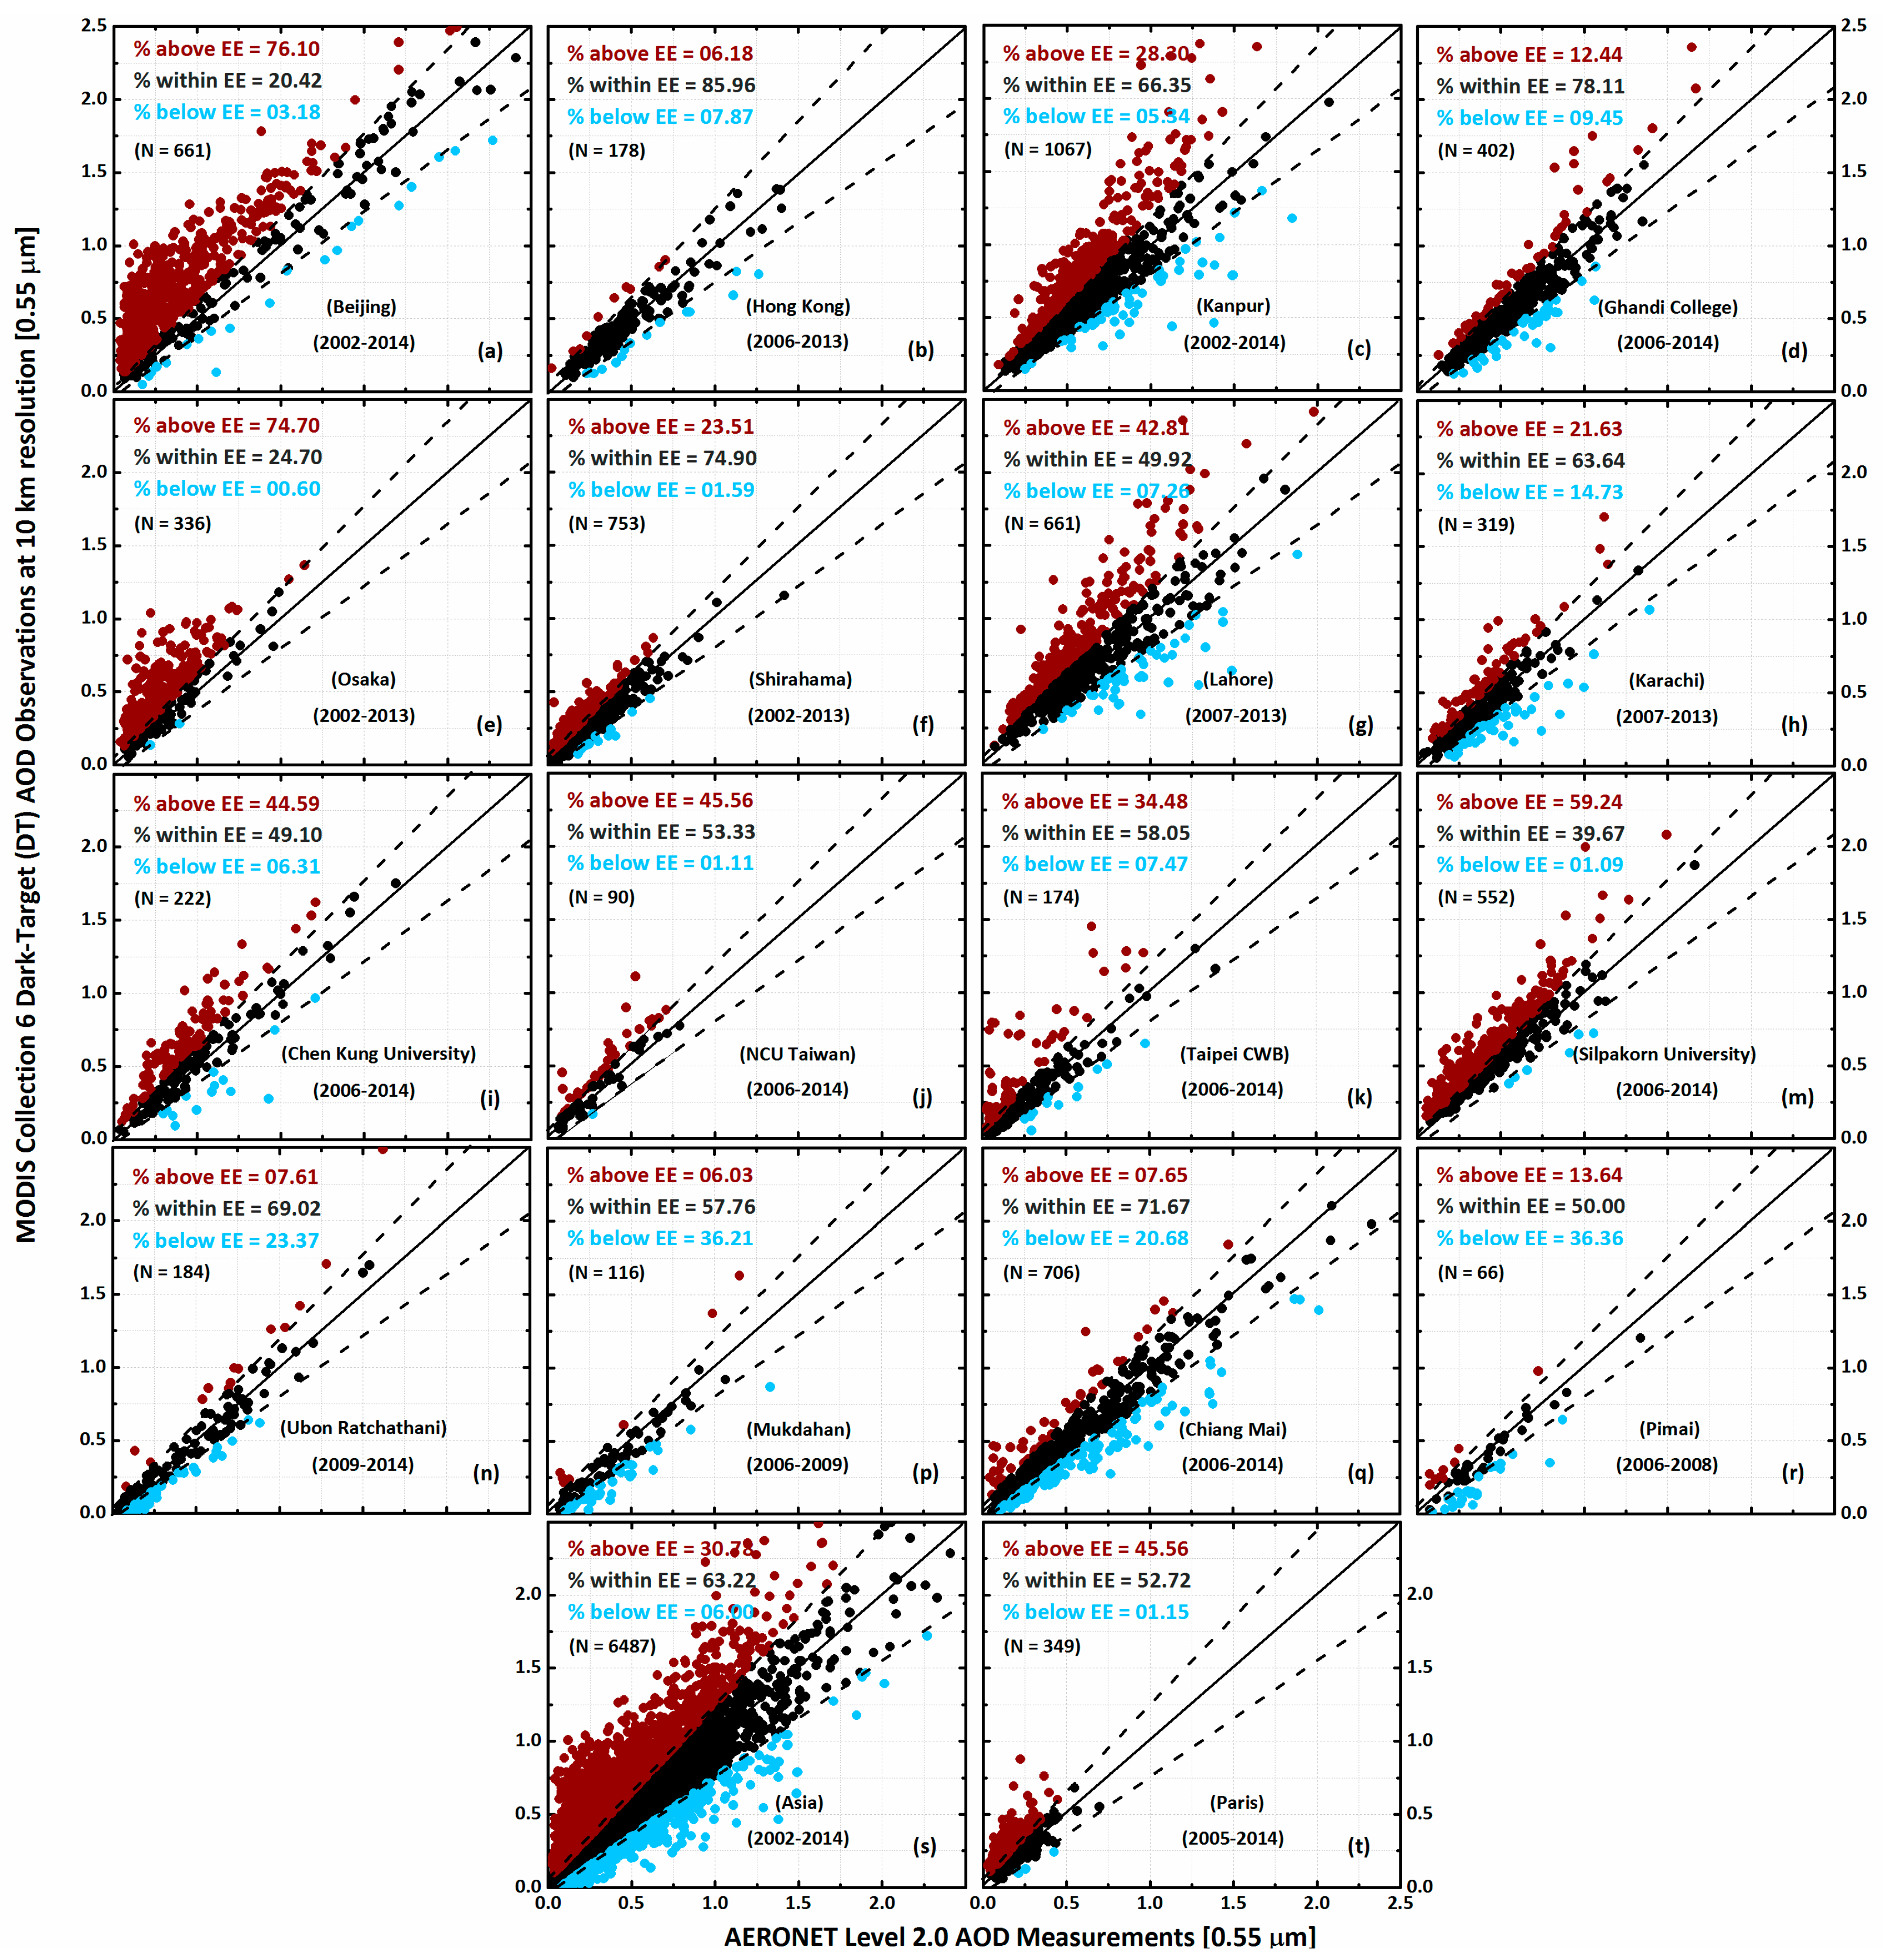
4.2. Performance of the DT 10-km AOD Algorithm

Reports of the performance of the 10-km DT algorithm (MYD04) suggest approximately four times greater confidence in the retrievals over Beijing and Karachi (Figure 2 and Table 3) than for the 3-km results presented here. Munchak et al. [24] also attributed an observed positive error for the DT product at 3 km, to incorrect estimation of the surface reflectance. This effect appears more at 3 km than at 10 km, because, in the latter, most of the bright urban surfaces at 0.66 μ m in the DT retrieval box are discarded during the pixel selection process [24]. The 10-km retrievals for the 16 Asian sites support these observations, as overall 63% of retrievals fall within the EE, compared with 55% for the AOD product at 3 km. Similar to the 3-km product, uncertainties for most sites were due to overestimation of AOD (31% of total retrievals were overestimates), whereas rural stations were either unbiased or biased towards underestimation.

5. Conclusions

The objective of this study was to evaluate the new MODIS C6 AOD at 3 km, over Asia, including both bright urban surfaces and dark vegetated sites. Results indicate that the new MODIS DT C6 product at 3 km is not promising at a regional scale and is less reliable over Asian sites than our observed results for DT C6 at 10-km resolution. Only 55% of retrievals fell within the EE, compared to 63% within the EE for our testing of C6 DT at 10 km, and 69% reported by Levy et al. (2013) for global testing of C6 DT at 10 km over land [14]. Similar to DT 10 km, the error is mainly due to an underestimation of surface reflectance, especially over urban sites, leading to high AOD estimates for both low and high aerosol loading situations. Furthermore, only 4 out of 16 sites have above 67% accuracy, or approximately 1 SD within the EE, the standard test for the DT algorithm. The poorest results at Beijing, Karachi, and Osaka are urban sites dominated by coarse aerosols where uncertainty arises from both underestimation of surface reflectance and use of an absorbing aerosol model, which may not adequately represent both coarse dust and urban aerosols. The 10-km algorithm also performed poorly over Beijing and Osaka, with less than 25% of retrievals within the EE. The observed poor performance of MYD04_3K over Paris, an urban site with relatively low aerosol loadings, confirms the deficiency of DT’s surface reflectance assumptions when applied at 3-km resolution. Therefore, the MYD04_3K, which was devised mainly for finer detail of AOD retrieval over urban regions, appears unsuited to this task, as it has very poor retrieval quality over bright surfaces. An alternative may be to develop the DB algorithm at the finer 3-km resolution, as it is specifically targeted for retrieval over bright surfaces.

Acknowledgments

The data used are available at Level 1 and Atmosphere Archive and Distribution System (http://ladsweb.nascom.nasa.gov) and AERONET Web (http://aeronet.gsfc.nasa.gov). We would like to thank Principal Investigators of the AERONET stations in Table 1, and Brent Holben for helping with the AERONET stations. We are thankful to Devin White (Oak Ridge National Laboratory) for MODIS Conversion Tool Kit (MCTK), which is available at https://github.com/dawhite/MCTK/releases. Grant PolyU153020/14P from the Hong Kong Research Grants Council sponsored this research.

Author Contributions

Janet E. Nichol designed and wrote the manuscript, and Muhammad Bilal performed all the analyses.

Conflicts of Interest

The authors declare no conflict of interest.

References

  1. Kaufman, Y.J.; Tanré, D.; Boucher, O. A satellite view of aerosols in the climate system. Nature 2002, 419, 215–223. [Google Scholar] [CrossRef] [PubMed]
  2. Cheung, H.-C.; Wang, T.; Baumann, K.; Guo, H. Influence of regional pollution outflow on the concentrations of fine particulate matter and visibility in the coastal area of southern China. Atmos. Environ. 2005, 39, 6463–6474. [Google Scholar] [CrossRef]
  3. Pope, C.A.; Ezzati, M.; Dockery, D.W. Fine-particulate air pollution and life expectancy in the United States. N. Engl. J. Med. 2009, 360, 376–386. [Google Scholar] [CrossRef] [PubMed]
  4. Holben, B.N.; Eck, T.F.; Slutsker, I.; Tanré, D.; Buis, J.P.; Setzer, A.; Vermote, E.; Reagan, J.A.; Kaufman, Y.J.; Nakajima, T.; et al. AERONET—A Federated Instrument Network and Data Archive for Aerosol Characterization. Remote Sens. Environ. 1998, 66, 1–16. [Google Scholar] [CrossRef]
  5. Christopher, S.A.; Zhang, J.; Kaufman, Y.J.; Remer, L.A. Satellite-based assessment of top of atmosphere anthropogenic aerosol radiative forcing over cloud-free oceans. Geophys. Res. Lett. 2006, 33. [Google Scholar] [CrossRef]
  6. Kaufman, Y.J.; Boucher, O.; Tanré, D.; Chin, M.; Remer, L.A.; Takemura, T. Aerosol anthropogenic component estimated from satellite data. Geophys. Res. Lett. 2005, 32. [Google Scholar] [CrossRef]
  7. Kaufman, Y.J.; Tanr, D.; Remer, L.A.; Vermote, E.F.; Chu, A. Operational remote sensing of tropospheric aerosol over land from EOS moderate resolution imaging spectroradiometer After the launch of MODIS the distribution. J. Geophys. Res. Atmos. 1997, 102, 51–67. [Google Scholar] [CrossRef]
  8. Levy, R.C.; Remer, L.A.; Mattoo, S.; Vermote, E.F.; Kaufman, Y.J. Second-generation operational algorithm: Retrieval of aerosol properties over land from inversion of Moderate Resolution Imaging Spectroradiometer spectral reflectance. J. Geophys. Res. 2007, 112. [Google Scholar] [CrossRef]
  9. Levy, R.C.; Remer, L.A.; Kleidman, R.G.; Mattoo, S.; Ichoku, C.; Kahn, R.; Eck, T.F. Global evaluation of the Collection 5 MODIS dark-target aerosol products over land. Atmos. Chem. Phys. 2010, 10, 10399–10420. [Google Scholar] [CrossRef] [Green Version]
  10. Hsu, N.C.; Tsay, S.-C.; King, M.D.; Herman, J.R. Aerosol Properties Over Bright-Reflecting Source Regions. IEEE Trans. Geosci. Remote Sens. 2004, 42, 557–569. [Google Scholar] [CrossRef]
  11. Hsu, N.C.; Tsay, S.-C.; King, M.D.; Herman, J.R. Deep Blue Retrievals of Asian Aerosol Properties During ACE-Asia. IEEE Trans. Geosci. Remote Sens. 2006, 44, 3180–3195. [Google Scholar] [CrossRef]
  12. Yang, M.; Howell, S.G.; Zhuang, J.; Huebert, B.J. Attribution of aerosol light absorption to black carbon, brown carbon, and dust in China—Interpretations of atmospheric measurements during EAST-AIRE. Atmos. Chem. Phys. 2009, 9, 2035–2050. [Google Scholar] [CrossRef]
  13. Remer, L.A.; Mattoo, S.; Levy, R.C.; Munchak, L.A. MODIS 3 km aerosol product: Algorithm and global perspective. Atmos. Meas. Tech. 2013, 6, 1829–1844. [Google Scholar] [CrossRef]
  14. Levy, R.C.; Mattoo, S.; Munchak, L.A.; Remer, L.A.; Sayer, A.M.; Patadia, F.; Hsu, N.C. The Collection 6 MODIS aerosol products over land and ocean. Atmos. Meas. Tech. 2013, 6, 2989–3034. [Google Scholar] [CrossRef]
  15. Hsu, N.C.; Jeong, M.-J.; Bettenhausen, C.; Sayer, A.M.; Hansell, R.; Seftor, C.S.; Huang, J.; Tsay, S.-C. Enhanced Deep Blue aerosol retrieval algorithm: The second generation. J. Geophys. Res. Atmos. 2013, 118, 9296–9315. [Google Scholar] [CrossRef]
  16. Bilal, M.; Nichol, J.E. Evaluation of MODIS aerosol retrieval algorithms over the Beijing-Tianjin-Hebei region during low to very high pollution events. J. Geophys. Res. Atmos. 2015. [Google Scholar] [CrossRef]
  17. Shi, Y.; Zhang, J.; Reid, J.S.; Hyer, E.J.; Hsu, N.C. Critical evaluation of the MODIS Deep Blue aerosol optical depth product for data assimilation over North Africa. Atmos. Meas. Tech. 2013, 6, 949–969. [Google Scholar] [CrossRef]
  18. Hyer, E.J.; Reid, J.S.; Zhang, J. An over-land aerosol optical depth data set for data assimilation by filtering, correction, and aggregation of MODIS Collection 5 optical depth retrievals. Atmos. Meas. Tech. 2011, 4, 379–408. [Google Scholar] [CrossRef]
  19. Remer, L.A.; Kleidman, R.G.; Levy, R.C.; Kaufman, Y.J.; Tanré, D.; Mattoo, S.; Martins, J.V.; Ichoku, C.; Koren, I.; Yu, H.; et al. Global aerosol climatology from the MODIS satellite sensors. J. Geophys. Res. 2008, 113. [Google Scholar] [CrossRef]
  20. Holben, N.; Tanr, D.; Smirnov, A.; Eck, T.F.; Slutsker, I.; Newcomb, W.W.; Schafer, J.S.; Chatenet, B.; Lavenu, F.; Kaufman, J.; et al. An emerging ground-based aerosol climatology: Aerosol optical depth from AERONET. J. Geophys. Res. Atmos. 2001. [Google Scholar] [CrossRef]
  21. Smirnov, A.; Holben, B.N.; Eck, T.F.; Dubovik, O.; Slutsker, I. Cloud-Screening and Quality Control Algorithms for the AERONET Database. Remote Sens. Environ. 2000, 73, 337–349. [Google Scholar] [CrossRef]
  22. Remer, L.A.; Kaufman, Y.J.; Tanré, D.; Mattoo, S.; Chu, D.A.; Martins, J.V.; Li, R.-R.; Ichoku, C.; Levy, R.C.; Kleidman, R.G.; et al. The MODIS Aerosol Algorithm, Products, and Validation. J. Atmos. Sci. 2005, 62, 947–973. [Google Scholar] [CrossRef]
  23. Levy, R.C.; Remer, L.A.; Dubovik, O. Global aerosol optical properties and application to Moderate Resolution Imaging Spectroradiometer aerosol retrieval over land. J. Geophys. Res. 2007, 112. [Google Scholar] [CrossRef]
  24. Munchak, L.A.; Levy, R.C.; Mattoo, S.; Remer, L.A.; Holben, B.N.; Schafer, J.S.; Hostetler, C.A.; Ferrare, R.A. MODIS 3 km aerosol product: Applications over land in an urban/suburban region. Atmos. Meas. Tech. 2013, 6, 1747–1759. [Google Scholar] [CrossRef]
  25. Livingston, J.M.; Redemann, J.; Shinozuka, Y.; Johnson, R.; Russell, P.B.; Zhang, Q.; Mattoo, S.; Remer, L.; Levy, R.; Munchak, L.; et al. Comparison of MODIS 3 km and 10 km resolution aerosol optical depth retrievals over land with airborne sunphotometer measurements during ARCTAS summer 2008. Atmos. Chem. Phys. 2014, 14, 2015–2038. [Google Scholar] [CrossRef]
  26. Chu, D.A.; Kaufman, Y.J.; Ichoku, C.; Remer, L.A.; Tanré, D.; Holben, B.N. Validation of MODIS aerosol optical depth retrieval over land. Geophys. Res. Lett. 2002, 29. [Google Scholar] [CrossRef]
  27. Xie, Y.; Zhang, Y.; Xiong, X.; Qu, J.J.; Che, H. Validation of MODIS aerosol optical depth product over China using CARSNET measurements. Atmos. Environ. 2011, 45, 5970–5978. [Google Scholar] [CrossRef]
  28. He, Q.; Li, C.; Tang, X.; Li, H.; Geng, F.; Wu, Y. Validation of MODIS derived aerosol optical depth over the Yangtze River Delta in China. Remote Sens. Environ. 2010, 114, 1649–1661. [Google Scholar] [CrossRef]
  29. Li, Z.; Niu, F.; Lee, K.-H.; Xin, J.; Hao, W.M.; Nordgren, B.L.; Wang, Y.; Wang, P. Validation and understanding of Moderate Resolution Imaging Spectroradiometer aerosol products (C5) using ground-based measurements from the handheld Sun photometer network in China. J. Geophys. Res. 2007. [Google Scholar] [CrossRef]
  30. Bilal, M.; Nichol, J.E.; Bleiweiss, M.P.; Dubois, D. A Simplified high resolution MODIS Aerosol Retrieval Algorithm (SARA) for use over mixed surfaces. Remote Sens. Environ. 2013, 136, 135–145. [Google Scholar] [CrossRef]
  31. Bilal, M.; Nichol, J.E.; Chan, P.W. Validation and accuracy assessment of a Simplified Aerosol Retrieval Algorithm (SARA) over Beijing under low and high aerosol loadings and dust storms. Remote Sens. Environ. 2014, 153, 50–60. [Google Scholar] [CrossRef]
  32. Bilal, M.; Nichol, J.E.; Nazeer, M. Validation of Aqua-MODIS C051 and C006 Operational Aerosol Products Using AERONET Measurements Over Pakistan. IEEE J. Sel. Top. Appl. Earth Obs. Remote Sens. 2015. [Google Scholar] [CrossRef]
  33. Tao, M.; Chen, L.; Wang, Z.; Tao, J.; Che, H.; Wang, X.; Wang, Y. Comparison and evaluation of the MODIS Collection 6 aerosol data in China. J. Geophys. Res. Atmos. 2015, 120, 6992–7005. [Google Scholar] [CrossRef]
  34. Ichoku, C.; Remer, L.A.; Kaufman, Y.J.; Levy, R.C.; Chu, D.A.; Tanré, D.; Holben, B.N. MODIS observation of aerosols and estimation of aerosol radiative forcing over southern Africa during SAFARI 2000. J. Geophys. Res. 2003, 108. [Google Scholar] [CrossRef]
Figure 1. Validation of MYD04_3K AOD observations against AERONET measurements over (a) Beijing; (b) Hong Kong; (c,d) India; (e,f) Japan; (g,h) Pakistan; (ik) Taiwan, (m-r) Thailand; (s) sites a to rcombined; and (t) Paris. The dashed lines = EE lines and black solid line = 1:1 line. Retrievals are selected using a sampling window of 3 × 3 pixels (average of 81 km2 spatial region for the MYD04_3K AOD at 3 km) centered on the AERONET site.
Remotesensing 08 00328 g001
Figure 2. Validation of MYD04_10K AOD observations against AERONET measurements over (a) Beijing; (b) Hong Kong; (c,d) India; (e,f) Japan; (g,h) Pakistan; (ik) Taiwan; (mr) Thailand; (s) combined a to r sites; and (t) Paris. The dashed lines = EE lines and black solid line = 1:1 line. Retrievals are selected using a sampling window of 3 × 3 pixels (average of 900 km2 spatial region for the MYD04_10K AOD at 3 km) centered on the AERONET site.
Remotesensing 08 00328 g002
Table 1. AErosol RObotic NETwork (AERONET) Level 2.0 data used in this study.
CountryAERONETLat/LongTime PeriodAverage AOD (2007–2013)
ChinaBeijing39.97/116.382002–20140.48
Hong KongHong_Kong_PolyU22.30/114.182006–20130.42
IndiaKanpur26.61/80.232002–20140.65
Gandhi College25.87/84.130.64
JapanOsaka34.65/135.592002–20130.23
Shirahama33.69/135.360.20
PakistanLahore31.54/74.332007–20130.67
Karachi24.87/67.030.42
TaiwanChen Kung Uni.23.00/120.222006–20140.42
NCU Taiwan24.97/121.19 0.27
Taipei CWB25.03/121.50 0.30
ThailandSilpakorn Uni.13.82/100.042006–20140.45
Ubon Ratchathani15.21/104.87 0.36
Mukdahan16.61/104.68 0.36
Chiang Mai Met Sta.18.77/98.97 0.47
Pimai15.18/102.56 0.45
FranceParis48.87/2.332005–20140.16
Table 2. Statistical summary for validation of MYD04_3K AOD observations over Asia.
AERONET SitesAverage (M – A) aSlopeN b% Above/Within/Below EE c
Beijing0.71 – 0.37 = +0.341.1458893.20/06.46/00.34
Hong Kong0.51 – 0.50 = +0.010.877018.57/77.14/04.29
Kanpur0.70 – 0.58 = +0.121.35116538.71/58.80/02.49
Gandhi College0.60 – 0.59 = +0.011.4137212.10/76.34/11.56
Osaka0.61 – 0.29 = +0.311.4913275.76/21.97/02.27
Shirahama0.29 – 0.22 = +0.071.1367137.70/62.00/00.30
Lahore0.78 – 0.57 = +0.211.2652869.32/29.17/01.52
Karachi0.73 – 0.35 = +0.381.5011094.55/04.55/00.91
Chen Kung Uni.0.86 – 0.55 = +0.311.1711080.91/18.18/00.91
NCU Taiwan0.49 – 0.32 = +0.171.309574.74/25.26/00.00
Taipei CWB0.61 – 0.37 = +0.241.089768.35/31.65/00.00
Silpakorn Uni.0.58 – 0.44 = +0.141.2459558.15/40.84/01.01
Ubon Ratchathani0.41 – 0.39 = +0.021.2716312.27/78.53/07.20
Mukdahan0.33 – 0.37 = −0.041.2012013.33/55.00/31.67
Chiang Mai Met Sta.0.48 – 0.48 = 0.001.0866811.53/78.29/10.18
Pimai0.28 – 0.37 = −0.091.005608.93/41.07/50.00
Asia0.59 – 0.45 = +0.141.24552241.35/55.61/03.06
Paris0.38 – 0.17 = +0.212.3811477.20/17.54/05.26
a M = MYD04_3K and A = AERONET site; b N = Total collocations of MYD04_3K and AERONET AOD; c EE = ± (0.05% + 20%).
Table 3. Statistical summary for validation of MYD04_10K AOD observations over Asia.
AERONET SitesAverage (M – A) aSlopeN b% Above/Within/Below EE c
Beijing0.72 – 0.47 = +0.250.9766176.10/20.42/03.18
Hong Kong0.47 – 0.48 = −0.010.9417806.18/85.96/07.87
Kanpur0.65 – 0.58 = +0.071.22106728.31/66.35/05.34
Gandhi College0.61 – 0.60 = +0.011.3440212.44/78.11/09.45
Osaka0.49 – 0.30 = +0.191.3133674.70/24.70/00.60
Shirahama0.25 – 0.22 = +0.031.0175323.51/74.90/01.59
Lahore0.72 – 0.61 = +0.111.4566142.81/49.92/07.20
Karachi0.42 – 0.41 = +0.011.1531921.63/63.64/14.73
Chen Kung Uni.0.57 – 0.47 = +0.101.1522244.59/49.10/06.31
NCU Taiwan0.39 – 0.30 = +0.091.319045.56/53.33/01.11
Taipei CWB0.40 – 0.32 = +0.081.1517434.48/58.05/07.47
Silpakorn Uni.0.58 – 0.44 = +0.141.1555259.24/39.67/01.09
Ubon Ratchathani0.38 – 0.40 = −0.021.2018407.61/69.02/23.37
Mukdahan0.32 – 0.38 = −0.061.0811606.03/57.76/36.21
Chiang Mai Met Sta.0.44 – 0.48 = −0.040.9870607.65/71.67/20.68
Pimai0.32 – 0.37 = −0.051.006613.64/50.00/36.36
Asia0.53 – 0.46 = +0.071.12648730.78/63.22/06.00
Paris0.26 – 0.17 = +0.091.2934945.56/52.72/01.15
a M = MYD04_10K and A = AERONET site; b N = Total collocations of MYD04_3K and AERONET AOD; c EE = ± (0.05% + 20%).

