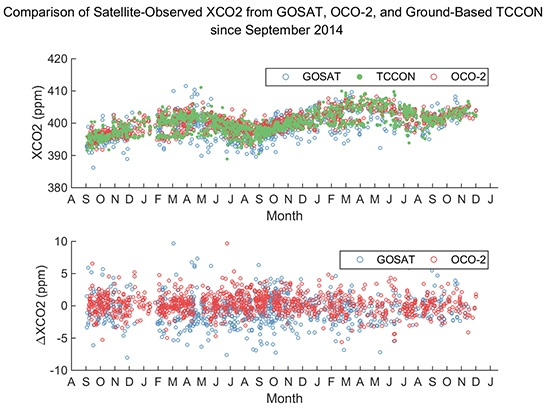
Comparison of Satellite-Observed XCO2 from GOSAT, OCO-2, and Ground-Based TCCON


1
State Key Laboratory of Information Engineering in Surveying, Mapping and Remote Sensing, Wuhan University, Wuhan 430079, China
2
Collaborative Innovation Center of Geospatial Technology, 129 Luoyu Road, Wuhan 430079, China
3
International School of Software, Wuhan University, Wuhan 430079, China
4
School of Geography and Remote Sensing, Nanjing University of Information Science and Technology, Nanjing 210044, China
*
Authors to whom correspondence should be addressed.
Remote Sens. 2017, 9(10), 1033; https://doi.org/10.3390/rs9101033
Submission received: 19 July 2017
/
Revised: 29 September 2017
/
Accepted: 8 October 2017
/
Published: 10 October 2017
(This article belongs to the Special Issue Remote Sensing of Greenhouse Gases)
Abstract
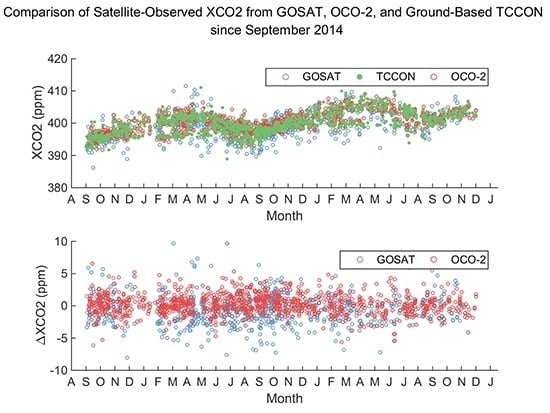
:CO2 is one of the most important greenhouse gases. Its concentration and distribution in the atmosphere have always been important in studying the carbon cycle and the greenhouse effect. This study is the first to validate the XCO2 of satellite observations with total carbon column observing network (TCCON) data and to compare the global XCO2 distribution for the passive satellites Orbiting Carbon Observatory-2 (OCO-2) and Greenhouse Gases Observing Satellite (GOSAT), which are on-orbit greenhouse gas satellites. Results show that since GOSAT was launched in 2009, its mean measurement accuracy was −0.4107 ppm with an error standard deviation of 2.216 ppm since 2009, and has since decreased to −0.62 ppm with an error standard deviation of 2.3 ppm during the past two more years (2014–2016), while the mean measurement accuracy of the OCO-2 was 0.2671 ppm with an error standard deviation of 1.56 ppm from September 2014 to December 2016. GOSAT observations have recently decreased and lagged behind OCO-2 on the ability to monitor the global distribution and monthly detection of XCO2. Furthermore, the XCO2 values gathered by OCO-2 are higher by an average of 1.765 ppm than those by GOSAT. Comparison of the latitude gradient characteristics, seasonal fluctuation amplitude, and annual growth trend of the monthly mean XCO2 distribution also showed differences in values but similar line shapes between OCO-2 and GOSAT. When compared with the NOAA statistics, both satellites’ measurements reflect the growth trend of the global XCO2 at a low and smooth level, and reflect the seasonal fluctuation with an absolutely different line shape.
1. Introduction
For decades, human activities have led to a dramatic increase in greenhouse gas (GHG) and pollutant concentrations in the atmosphere, and a significant increase in GHGs, especially CO2, has had a significant impact on global climate. Therefore, major scientific research has focused on accurately measuring changes in atmospheric carbon dioxide concentration. At present, atmospheric CO2 observation mainly relies on passive detection technology, especially passive satellite remote sensing technology. Representative systems include Japan’s Greenhouse Gases Observing Satellite (GOSAT) [1], NASA’s Orbiting Carbon Observatory-2 (OCO-2) [2,3], and China’s carbon satellite [4,5], which all have wide detection ranges, large monitoring areas, and large sampling data. Since the successful launch of GOSAT in January 2009, several teams of scholars from more than 10 countries have been working on independent retrievals of XCO2 and XCH4 with errors of less than 2 ppm (0.5%) and 13 ppb (0.7%), respectively, over most of the globe [6,7,8,9]. Other scholars validated and compared the data retrieval accuracy of GOSAT with the total carbon column observing network (TCCON), Scanning Imaging Absorption spectrometer for Atmospheric Chartography (SCIAMACHY), and GEOS-Chem model calculations [10,11,12,13,14,15,16,17,18]. In July 2014, NASA successfully launched OCO-2, a dedicated CO2 detection satellite. As compared with its precursors [13,19,20,21], OCO-2 exhibits evident improvements in spatial resolution and measurement accuracy, which enables it to supplement the data on XCO2, detect surface fluxes of CO2, and better understand the global carbon cycle [2,22,23,24]. However, few studies on OCO-2 validation have been published due to the short on-orbit time. Wunch compared OCO-2 V7r product with TCCON [25]. Significant research is still needed.
As the present on-orbit GHG satellites, GOSAT and OCO-2 have different observation strategies. The thermal and near-infrared sensor for carbon observations, Fourier transform spectrometer (TANSO–FTS), installed on GOSAT has a wide spectral coverage ranging from short-wave infrared (SWIR) to thermal infrared (TIR), and an agile pointing system at the expense of spatial context, whereas OCO-2 measures CO2 with high spatial resolution using imaging grating spectrometers. OCO-2 and TANSO–FTS infer CO2 concentration from high-resolution measurements of reflected sunlight and use similar inversion algorithms to retrieve CO2 concentrations at SWIR [12,14]. Therefore, both satellites can complement each other in time and space and enrich the distribution data of CO2 concentration. This complementary relationship will not only reduce uncertainty in global CO2 flux estimates, but also monitor CO2 emitted by megacities and absorbed by forests [26,27]. However, these two satellites have so far not yet been compared. In this study, we validate XCO2 data retrieved from the two satellites with TCCON data and compare the global distribution of XCO2 between them.
The rest of this paper is organized as follows. Section 2 introduces the data and the method for validation and comparison. Section 3 presents the results and provides a discussion. Section 4 presents our conclusion on the XCO2 data retrieved from OCO-2 and GOSAT and provides suggestions for future work.
2. Materials and Methods
2.1. GOSAT
GOSAT, which is the first full-time artificial satellite for GHG measurement, has been running well since its successful launch in January 2009. The observation instrument on-board the satellite is the TANSO, which comprises of two subunits, namely, the FTS and cloud and aerosol imager (CAI). FTS measures the solar radiation reflected from the ground by three SWIR bands (0.76, 1.6, and 2.0 μm) and the ground and atmospheric radiation at a wide TIR band (5.5–14.3 μm). Among all spectra obtained with the FTS, only those measured without cloud interference within the FTS field of view are selected for further processing. This screening process uses the images from the CAI. The FTS SWIR Level 2 data products store XCO2 retrieved from the radiance spectra in bands 1–3 of the FTS. The column averaged CO2 dry air mole fraction, XCO2, is the ratio of the CO2 concentration and dry air concentration in a vertical unit column stretching from the ground surface to the top of the atmosphere. The FTS SWIR Level 3 data products are monthly averages of global concentration distribution (2.5 × 2.5 degrees of grid as a unit) of GHGs generated from SWIR Level 2 products by applying the kriging method. This study used the FTS SWIR Level 2 and Level 3 data products generated from 1 June 2009 to 28 February 2017, downloaded from the GOSAT Data Archive Service (GDAS), which was operated by the GOSAT Project of National Institute for Environmental Studies (NIES). GOSAT Level 2 does not have data for January 2015, and GOSAT Level 3 does not have data for June and December 2014 and January and September 2015.
2.2. OCO-2
In July 2014, NASA successfully launched the OCO-2 as the second satellite for full-time CO2 measurement after GOSAT. Partial information of measurement properties of GOSAT and OCO-2 are shown in Table 1. The OCO-2 carries a single instrument that incorporates three bore-sighted, high-resolution spectrometers designed to measure reflected sunlight in the 0.76 μm O2 A-band and in the CO2 bands at 1.61 μm and 2.06 μm. Soundings recorded in these three bands are used to retrieve XCO2. Among the three XCO2 products of OCO-2 (i.e., V7, V7r, and Lite File Product), Lite File Product has the highest amount of data with bias corrections [28]. The filtration of Lite File Product (xco2_quality_flag) combines warn level and several quality filters by identifying thresholds for some variables associated with meteorological, aerosol, and surface properties. In this study, we validated and compared the filtrated XCO2 from OCO-2 Lite File Product by filtering data with an “xco2_quality_flag” equal to 1 from September 2014 to March 2017. These data were produced by the OCO-2 project in the Jet Propulsion Laboratory, California Institute of Technology, and obtained from the OCO-2 data archive maintained at the NASA Goddard Earth Science Data and Information Services Center.
2.3. TCCON
The TCCON is a terrestrial FTS network that records direct solar spectra in near-infrared spectral regions [29]. Twenty-six sites are used for data gathering; however, three of these sites, including Four Corners (FC), Indianapolis (IF), and Jet Propulsion Laboratory have stopped operating. Jet Propulsion Laboratory comprises two datasets, JC and JF, with different missions. Another site, Lauder, also has two datasets, LH and LL, which have different spectrometers. Five sites will soon join the TCCON observation network. Since 2004, Park Falls, WI, USA, which is the first TCCON site, has been recording the column-averaged abundances of CO2, CH4, N2O, HF, CO, H2O, and HDO. The observed XCO2 data product has been confirmed as a validation standard and has been compared with multiple satellite observations of XCO2 data. In this study, the XCO2 data gathered from TCCON ground observation from June 2009 to December 2016 were used to validate XCO2 data retrieved from GOSAT and OCO-2. The official site ID, longitude and latitude, and start and end times of data collection of each site are shown in Table 2. TCCON data were obtained from the TCCON Data Archive (http://TCCON.ornl.gov), which is hosted by the Carbon Dioxide Information Analysis Center. We filtered out the data with an ‘fvsi’ (fractional variation in solar intensity) higher than 5%.
2.4. Method
In this study, we directly compared the output of the NIES SWIR of GOSAT, OCO-2 data, and no smoothing was applied to either dataset. Rodgers and Connor (2003) pointed out that it is not reasonable to directly compare the measurements made by different remote sounders due to their different a priori profiles and averaging kernels [56]. However, it is demonstrated that direct comparison is also applicable in the validation of satellite’s measurements in the latest researches about the validation of satellites’ measurements. Zhou M et al. did not deal with the impact of the difference between the averaging kernels of TCCON and GOSAT data when considering the true atmospheric variability as unavailable [17]. It is demonstrated that the TCCON stations located at low-latitudes with small the solar zenith angle, during the ±2 h when GOSAT pass the TCCON sites, and GOSAT and TCCON averaging kernels look very similar. Besides, Inoue et al. compared the NIES SWIR XCO2 retrievals to aircraft data with and without applying GOSAT averaging kernels to the higher-resolution aircraft data and did not find a significant difference for XCO2. The differences between aircraft-based XCO2 with and without the application of GOSAT column averaging kernels were evaluated to be less than ±0.4 ppm at most, and less than ±0.1 ppm on average [57]. The effect of column averaging kernels on GOSAT XCO2 is relatively negligible when compared with its measurement accuracy. For OCO-2, we adjusted the XCO2 measurements of OCO-2 from Jan 2015 to March 2016 with column averaging kernels in each TCCON site. Figure 1 shows the difference between the adjusted XCO2 and retrieved XCO2 from Jan 2015 to March 2016. Figure 2 shows the statistics about the effect of the chice of a priori profile and the effect of smoothing by the averagein kernels for data measured by OCO-2 over each TCCON site, including the minimum, median, mean, maximum, the 1st and 5th percentiles, and 95th and 99th percentiles. We found that the effect with applying OCO-2 averaging kernels could be neglected with the difference less than ±0.36 ppm at most, and less than ±0.021 ppm on average.
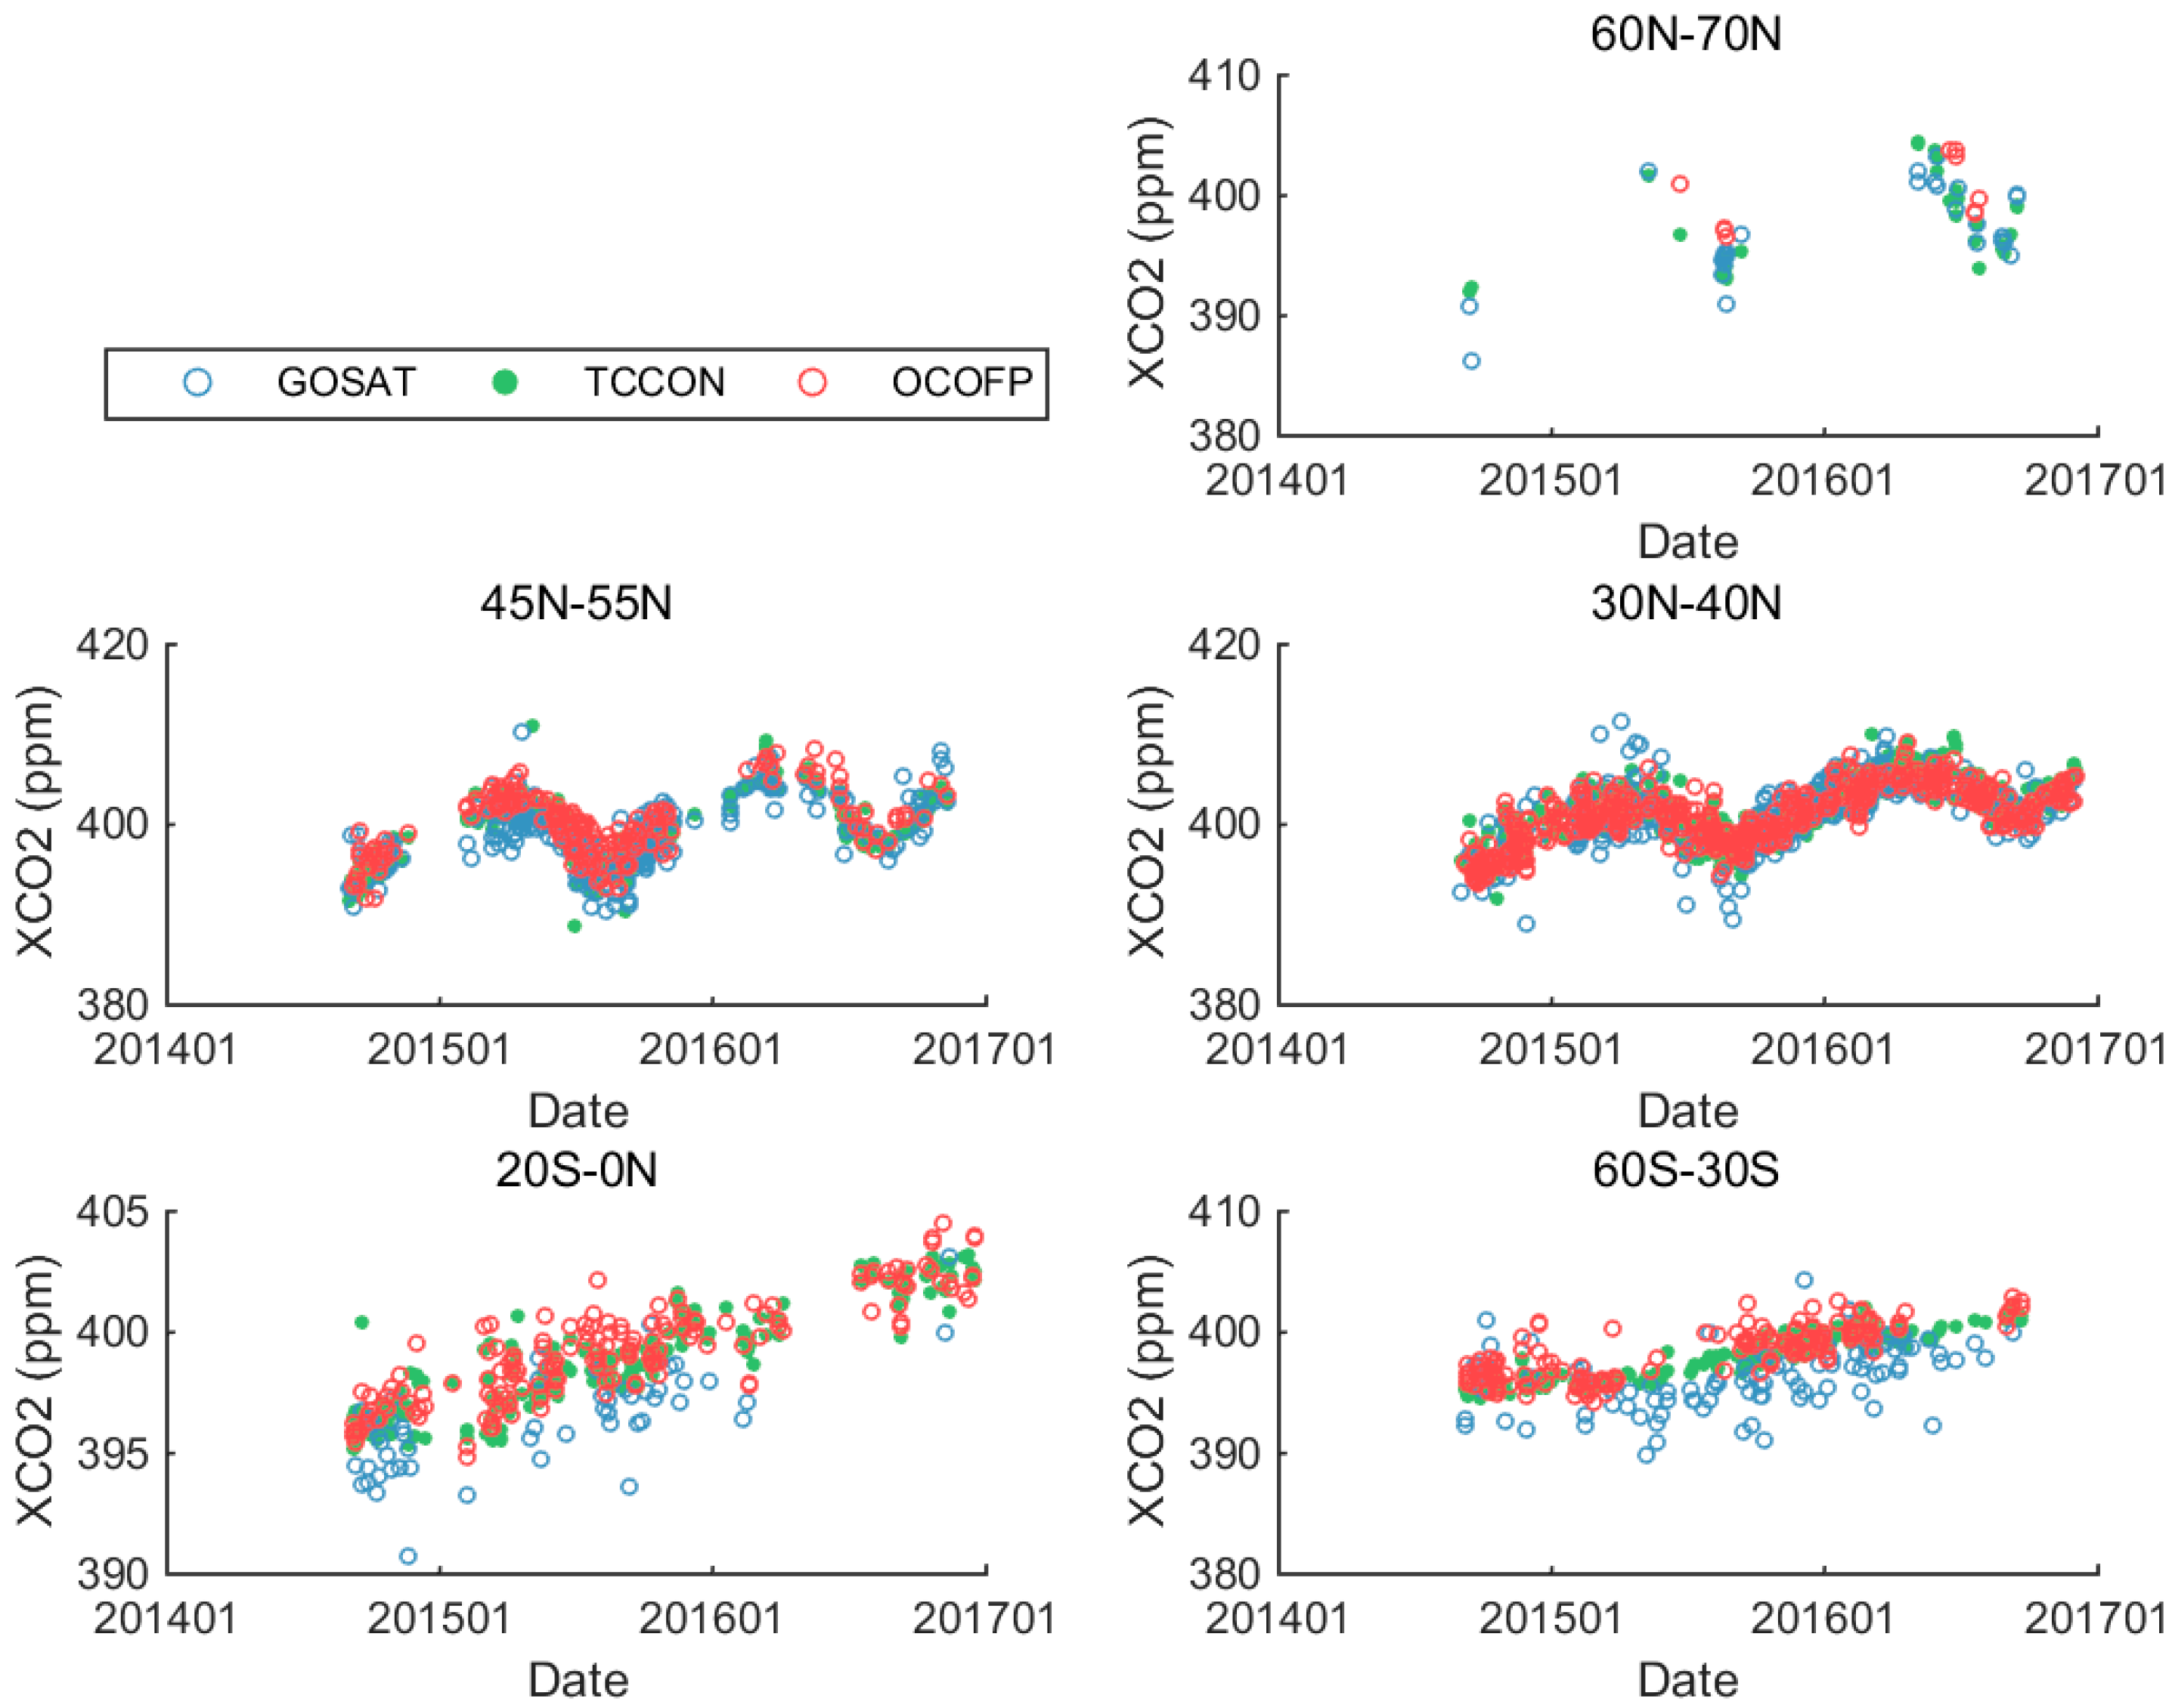
XCO2 data from OCO-2 were validated with TCCON from September 2014 to December 2016, when 23 TCCON sites had the XCO2 data that corresponded with OCO-2 measurements. XCO2 data from GOSAT were validated with TCCON from April 2009 to December 2016, when 25 sites had the XCO2 data that corresponded with GOSAT measurements; and from September 2014 to December 2016, when 19 TCCON sites had the XCO2 data that corresponded with GOSAT measurements. Given the different geographical environments of the TCCON sites and the large differences in data volume and XCO2 distribution characteristics in the northern and southern hemispheres, we decided to categorize the sites into different latitude zones to evaluate measurement accuracy. In the following analysis, we divided these TCCON sites into six latitude zones, namely, 75°N–85°N, 60°N–70°N, 45°N–55°N, 30°N–40°N, 20°S–0, and 60°S–30°S, based on the work of Wunch [11].
For our coincidence criteria, we filtered XCO2 measurements from the satellites within an hour of measurement and within ±2° latitude and ±2.5° longitude of the TCCON sites, thereby obtaining sufficient data and guaranteeing time-space coherence. Then, we selected the TCCON data that were closest to the data from the satellites in measurement time. The XCO2 measurements were then validated in terms of observation modes based on the coincidence criteria. The TANSO–FTS in GOSAT works in observation mode 1 (OB1D) or specific observation mode (SPOD) and calibrates itself in calibration modes. SPOD is used to observe specific places, such as sites, for verification and points along a pipeline, including sun glint points. In this study, the data from the SWIR Level 2 product were observed under OB1D and SPOD. For OCO-2, we considered four modes, namely, land target, land nadir, land glint, and sea glint, which combined the OCO-2 operation modes (i.e., nadir, glint, and target) and surface types (i.e., land and sea). The target mode was designed to measure considerable data at ground validation stations, typically TCCON sites, to evaluate the bias of OCO-2 XCO2 measurements, which are generally within ±0.2° latitude and ±0.2° longitude of validation stations in target mode. The maximum geographical range that OCO-2 satellites observe under target mode are ±0.5° latitude and ±0.5° longitude. Thus, we limited the XCO2 measurements under target mode within ±0.5° latitude and ±0.5° longitude of TCCON sites. The grid was set within ±2° latitude and ±2.5° longitude of the TCCON sites for other observation modes.
We compared mean XCO2 from satellites from each observation with TCCON data. Usually, more than 100 measurements of OCO-2 and 1–4 measurements of GOSAT are obtained during one observation. The comparisons of XCO2 measurements are shown in Table 3 and Table 4. We analyzed the linear relationship between satellite measurements and TCCON data, including all of the validated data, and individually studied the measurements in terms of latitude zones and observation modes. The results of linear fitting between satellite measurements and TCCON data mainly include parameters, linear correlation coefficient k, and goodness of fit R2. Parameter k describes the dependence of the variability of the satellite measurement at each TCCON value in the regression and R2 describes the ability of satellites to interpret TCCON data. R2 is closer to 1, the better the linear relationship between satellite measurements and TCCON data. In addition, we compared satellites’ measurements and TCCON data throughout the observation period. We also calculated the XCO2 data accuracy of satellites, which represents the degree to which the measured value matches the true value. Accuracy is usually expressed by the error; a minimal error indicates high accuracy and that the measured value is close to the true value. The formulas are as follows:
where represents the XCO2 measurements of the satellites, and is the average XCO2 value in one observation. represents the TCCON data. Ea is the average of absolute error, and is the standard deviation of the XCO2 measurement error of the satellites. Ea represents the overall error; if it is positive, then most of the XCO2 measurements of the satellites are higher than the TCCON data; if it is negative, then most of the XCO2 measurements of the satellites are lower than the TCCON data. represents the degree of dispersion of the error distribution and the measurement precision of satellites. A large standard deviation of the XCO2 measurement error of the satellites indicates a large degree of dispersion of the error distribution and poor observation accuracy of the satellites. Due to the significant graded distribution of XCO2 in latitude, the difference of XCO2 in northern hemisphere and southern hemisphere cannot be neglected. Sometimes, this percentage accuracy may be of more persuasion than that in ppm. Therefore, the measurement accuracy of the XCO2 measurements of the satellites are not only calculated in unit of ppm but also in unit of percentage for the evaluation of OCO-2 and GOSAT data. The required measurement bias margin for OCO-2 and GOSAT is 0.3%. Therefore, we calculated the overall accuracy of OCO-2 and GOSAT, the formulas of which are as follows:
The comparison of XCO2 data from OCO-2 and GOSAT was based on the same spatial resolution mean-monthly dataset. We used GOSAT SWIR Level 3 products and reproduced OCO-2 monthly global XCO2 distributions (2.5 × 2.5 degrees of grid as a unit). The reproduced OCO-2 monthly global XCO2 distributions are generated from OCO-2 Lite File Products by averaging all of the measurements in each grid each month. We used GOSAT SWIR Level 3 products mainly because the spatial coverage of the reproduced monthly global XCO2 distributions from GOSAT Level 2 (using the same method as OCO-2) was lower to compare with that of OCO-2, as shown in Figure 3. Furthermore, the XCO2 spatial coverage of GOSAT Level 3 is similar to that of OCO-2. Therefore, we resampled the XCO2 data from OCO-2 Lite File Product to monthly XCO2 distribution (2.5 × 2.5 degrees of grid as a unit). We analyzed the characteristics of the latitude distribution and the latitude gradient of XCO2. Then, we calculated the monthly average XCO2 measurements of GOSAT and OCO-2 in different geographical spaces, including the globe, global land, global ocean, the northern hemisphere and its land or ocean, and the southern hemisphere and its land or ocean. We then analyzed the trend and seasonal variation using the STL method in R language and compared the results with the statistics from National Oceanic and Atmospheric Administration’s Earth System Research Laboratory (NOAA/ESRL), Mauna Loa CO2 monthly mean data, which was provided by Ed Dlugokencky and Pieter Tans, NOAA/ESRL (www.esrl.noaa.gov/gmd/ccgg/trends/). In according to NOAA, there are good reasons to believe that the CO2 measurements made at the Mauna Loa Observatory reflect truth about our global atmosphere. The main reasons for that confidence are: (1) The Observatory near the summit of Mauna Loa, at an altitude of 3400 m, is well situated to measure air masses that are representative of very large areas. (2) All of the measurements are rigorously and very frequently calibrated. (3) Ongoing comparisons of independent measurements at the same site allow an estimate of the accuracy, which is generally better than 0.2 ppm. Therefore, we used the statistical CO2 data at Mauna Loa by NOAA as the background CO2 levels to compare with the statistical values of satellites. In addition, we analyzed the difference in XCO2 variation trend between GOSAT and OCO-2 combined with land use types provided by ISLSCP II MODIS (Collection 4) IGBP Land Cover, 2000–2001 [58].
3. Results and Discussion
3.1. Validation of XCO2 from Satellites with TCCON Data
Based on the coincidence criteria of data selection, Table 3 and Table 4 display the quantity statistics of the XCO2 data of the satellites from each TCCON site under different observation modes at different latitudes zones. The numbers before “\” represent the quantity of XCO2 measurements by satellite, and the numbers after “\” represent the quantity of corresponding TCCON measurements. Their quotient are the average numbers of XCO2 measurements in one observation at one time in a 4 × 5 grid near each TCCON site. The GOSAT data were divided into two parts, that is, those gathered from September 2014 to December 2016 and those gathered from June 2009 to December 2016. The figures in Table 3 and Table 4 confirm the advantages of OCO-2 on spatial resolution and imaging capability.
Noteworthy results from the validation with TCCON data are shown in Table 5, Table 6, Table 7, Table 8 and Table 9. Table 5 shows the results of linear fitting (linear correlation coefficient k and goodness of fit R2) between OCO-2 measurements and TCCON data in each latitude zone and observation mode and overall statistics. Table 6 shows the same statistics on GOSAT measurements as Table 5. Table 7 shows a comparison of linear fitting results between GOSAT and OCO-2 on each TCCON site. As indicated by the comparison in Table 6, the correlation between TCCON XCO2 and GOSAT XCO2 from 2009 (k = 0.866 and R2 = 0.851) is higher than that between TCCON XCO2 and GOSAT XCO2 from 2014 (k = 0.673 and R2 = 0.651), which shows that the quality of GOSAT observations, in terms of accuracy, has been declining recently. Figure 4 shows the correlation between TCCON XCO2 and OCO-2 XCO2 from 2014 (k = 0.937 and R2 = 0.773), which indicates that OCO-2 had indeed better ability to observe global atmospheric CO2 due to advanced spectrum measurement than GOSAT. The correlation between the XCO2 observations of the satellites and TCCON data since September 2014 follow a significant trend related to latitude zones; the correlation gradually weakens as the latitude zone moves southward, as shown by parameters R2 in Table 5 and Table 6. Although OCO-2 data also exhibits this pattern, the lowest degree of correlation in the southern hemisphere is still relatively high, and the difference between the latitude zones is insignificant. The GOSAT data (since 2014) shows a large latitude difference; meanwhile, the degree of correlation in the southern hemisphere decreases significantly. However, this feature is not reflected by the GOSAT data from June 2009 to September 2014. The quality of GOSAT observations seems to have dropped more in the southern hemisphere recently. In terms of observation modes, the GOSAT XCO2 measurements under OB1D better reflect the XCO2 at TCCON sites, and the correlation between GOSAT observations under OB1D and the TCCON data has decreased, from a correlation with k = 0.792, R2 = 0.791 to a correlation with k = 0.66, R2 = 0.63 than recent GOSAT observations under SPOD in recent years. OCO-2 XCO2 measurements under land target mode appear to the best in reflecting the true XCO2 value and is followed by sea glint, land nadir, and land glint. Figure 4, Figure 5 and Figure 6 show the comparison between TCCON XCO2 data and satellites’ XCO2 measurements in observation period from September 2014 to December 2016. Over the past two more years (2014–2016), the detection of OCO-2 in the northern hemisphere was a good reflection of the XCO2 concentration at each TCCON site, having almost the same amplitude and period of the XCO2 season and annual changes. In the southern hemisphere, XCO2 shows a linear growth trend, and OCO-2 observations show a linear growth trend with a barely noticeable season change as the XCO2 of TCCON show; however, the error between OCO-2 and TCCON is greater than that in the northern hemisphere, especially in July and August, when the OCO-2’s XCO2 data were considerably much higher than TCCON XCO2 data. GOSAT XCO2 data in the mid-latitudes of the northern hemisphere are sensitive to changes in season. The GOSAT XCO2 measurements are considerably larger than those of TCCON at the highest and lowest concentrations of TCCON XCO2. In the southern hemisphere, the variation trend of GOSAT XCO2 data was consistent with that of TCCON but smaller than TCCON-measured XCO2 (2–3 ppm). Figure 6 demonstrated that OCO-2 is superior to GOSAT in observing XCO2. The advantages of OCO-2 lie in the number of repeat observation points and its high accuracy, especially in the southern hemisphere TCCON sites, where GOSAT observations show a larger deviation than OCO-2.
Table 8 lists the accuracy of the XCO2 measurements of the satellites under different observation modes in each TCCON site. The numbers before “±” represent the averages of measurement errors, and the numbers after “±” represent the standard deviations of the measurement errors. All of the values in Table 8 are reserved for four significant digits. The first four columns show values calculated from OCO-2 XCO2 measurements from September 2014 to December 2016; the next two columns have values calculated from GOSAT XCO2 measurements from September 2014 to December 2016; and the values in the last two columns are calculated from GOSAT XCO2 measurements from June 2009 to December 2016. The last row of Table 8 shows the overall accuracy under the different observation modes; for OCO-2, XCO2 measurements under sea glint mode show the best accuracy with −0.03313 ppm error and 1.288 ppm standard deviation of measurement error; the sea glint mode is followed by land target, land nadir, and land glint, with 0.3795 ppm error and 1.873 ppm standard deviation of measurement error. For GOSAT, XCO2 measurements under OB1D show good accuracy regardless of the date range in which they were gathered; the accuracy of the XCO2 measurement from September 2014 is lower than that from June 2009. In most TCCON sites, OCO-2 was more accurate than GOSAT. Table 9 lists the overall accuracy of the XCO2 measurements of the satellites, which also confirms the advantage of OCO-2 over GOSAT in measurement accuracy and the decline of GOSAT measurement quality in recent years. Results show that since GOSAT was launched in 2009, its mean measurement accuracy was −0.4107 ppm (−0.1038%) with an error standard deviation of 2.216 ppm (0.5615%) since 2009, and decreased to −0.62 ppm (−0.1549%) with an error standard deviation of 2.3 ppm (0.5753%) during the past two more years (2014–2016), while the mean measurement accuracy of the OCO-2 was 0.2671 ppm (0.06797) with an error standard deviation of 1.56 ppm (0.3903%) from September 2014 to December 2016. GOSAT observations have recently decreased and lagged behind OCO-2 on the ability to monitor the global distribution and monthly detection of XCO2.
When compared with superior study on the validation of GOSAT and OCO-2 XCO2 data, there are some consistence and differences. Preliminary validation of the NIES/JAXA/MOE GOSAT products is reported in Morino et al. (2011). They validated the GOSAT SWIR XCO2 (Version 01.xx) from January 2009 to November 2010, and they found that the bias was −8.85 ± 4.75 ppm (−2.3 ± 1.2%). The second important validation on GOSAT is reported by D. Wunch et al. (2011), they have detailed the complete approach to correcting the GOSAT XCO2 measurements and compared against the TCCON data. The average bias in the northern hemisphere obtained by them was 1.25 ± 2.44 ppm. Cogan et al. (2012) validated over two years of XCO2 retrievals from GOSAT and found an average bias between all GOSAT and TCCON XCO2 of −0.20 ppm with a standard deviation of 2.26 ppm and a correlation coefficient of 0.75. The advanced retrieval algorithm gradually corrected the XCO2 measurements. In our validation study on the GOSAT SWIR XCO2 (Version 02.xx) from September 2014 to December 2016, it is demonstrated that the bias was decreased to −0.62 ± 2.3 ppm (−0.1549 ± 0.5753% ppm) and a correlation coefficient of 0.649. On the other hand, Jiang et al. (2015) found that the average bias of GOSAT was lower in the southern hemisphere than in the northern hemisphere, which has also been verified in our study. Besides, they found that there was no distinct trend in the correlation coefficients as the latitude changes from south to north. However, in our study we found that the correlation coefficients between GOSAT and TCCON generally decreased as the latitude changes from south to north.
So far, the first validation of the OCO-2 products is reported in Wunch et al. (2016). They evaluated the measurement accuracy of Version 7r of OCO-2 in terms of three operation modes, Target, Nadir, and Glint. The results they found were median differences less than 0.5 ppm and RMS differences typically below 1.5 ppm. In our study, we validated OCO-2 in latitude zones, surface types and operation modes. The overall bias of 0.2671 ± 1.56 ppm in our study was consistent with Wunch et al. (2016). Besides, Wunch found that target observations over TCCON stations correlate best with the TCCON data (R2 = 0.83) on a global scale, which also have been verified in our study. The XCO2 measurements under land target observation mode had the best correlation coefficient of 0.84 among four kinds of observation modes and the overall correlation coefficient was 0.773 from September 2014 to December 2016.
3.2. Comparison of XCO2 Data between GOSAT and OCO-2
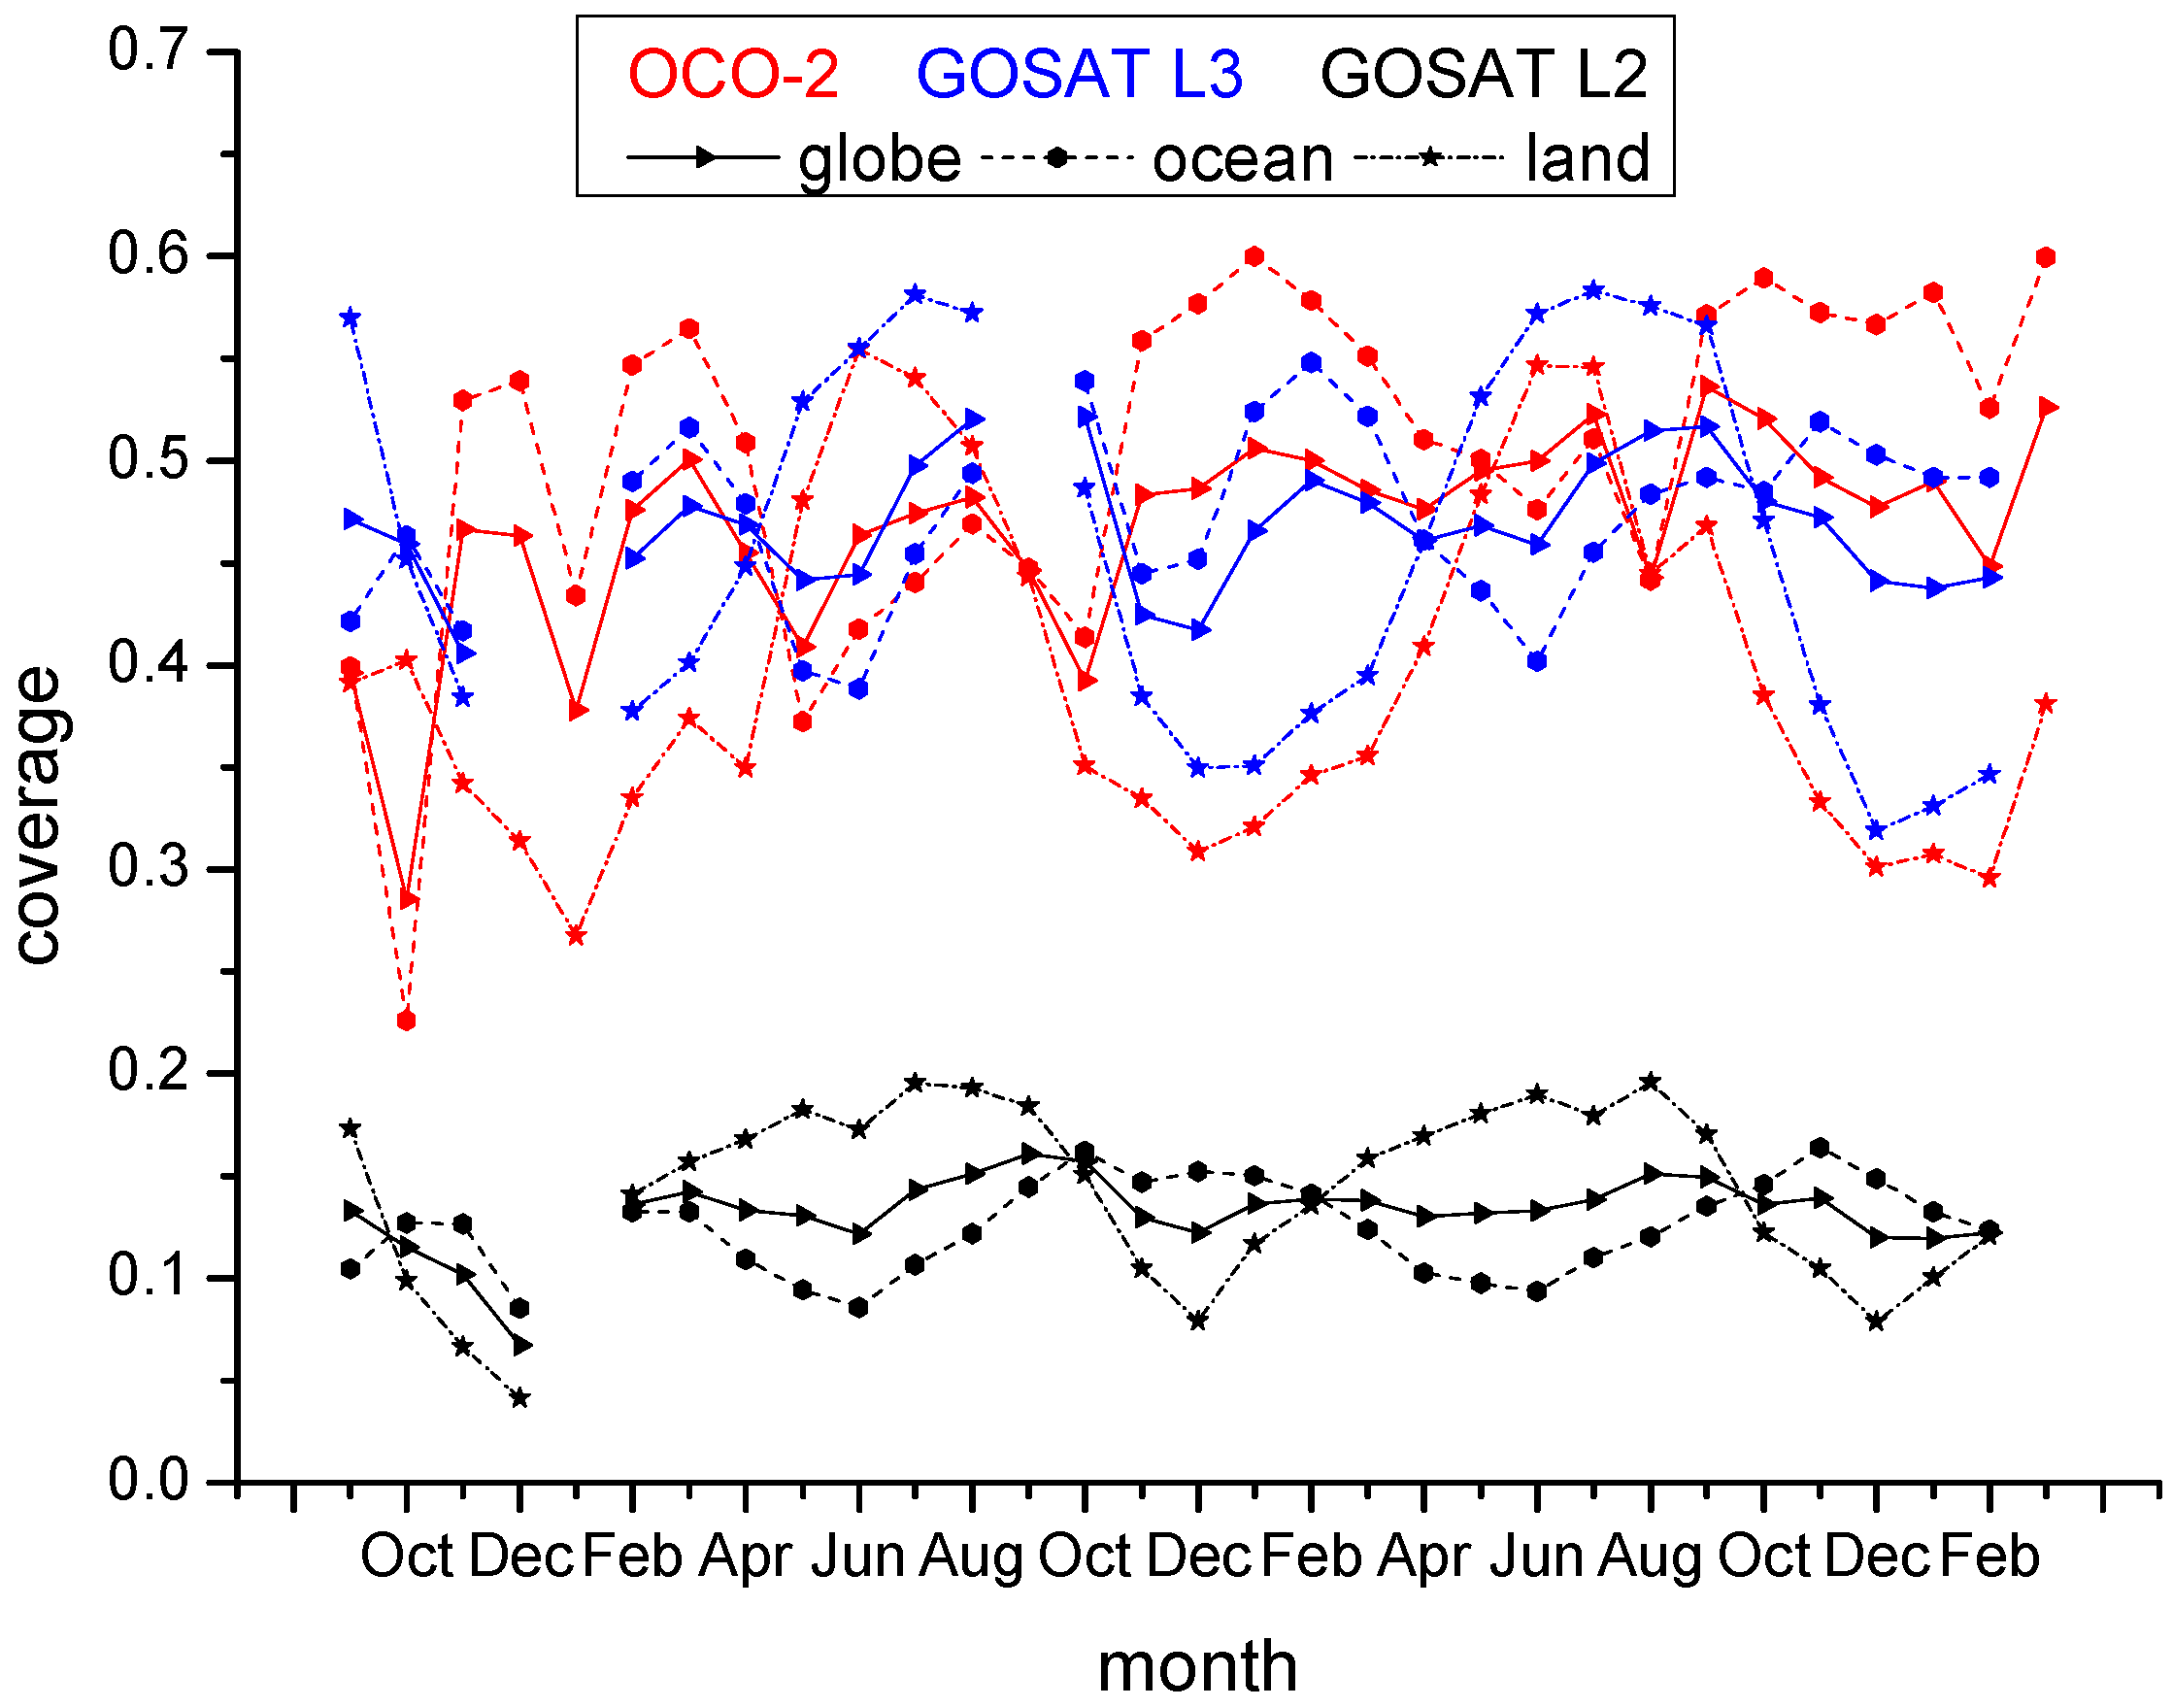
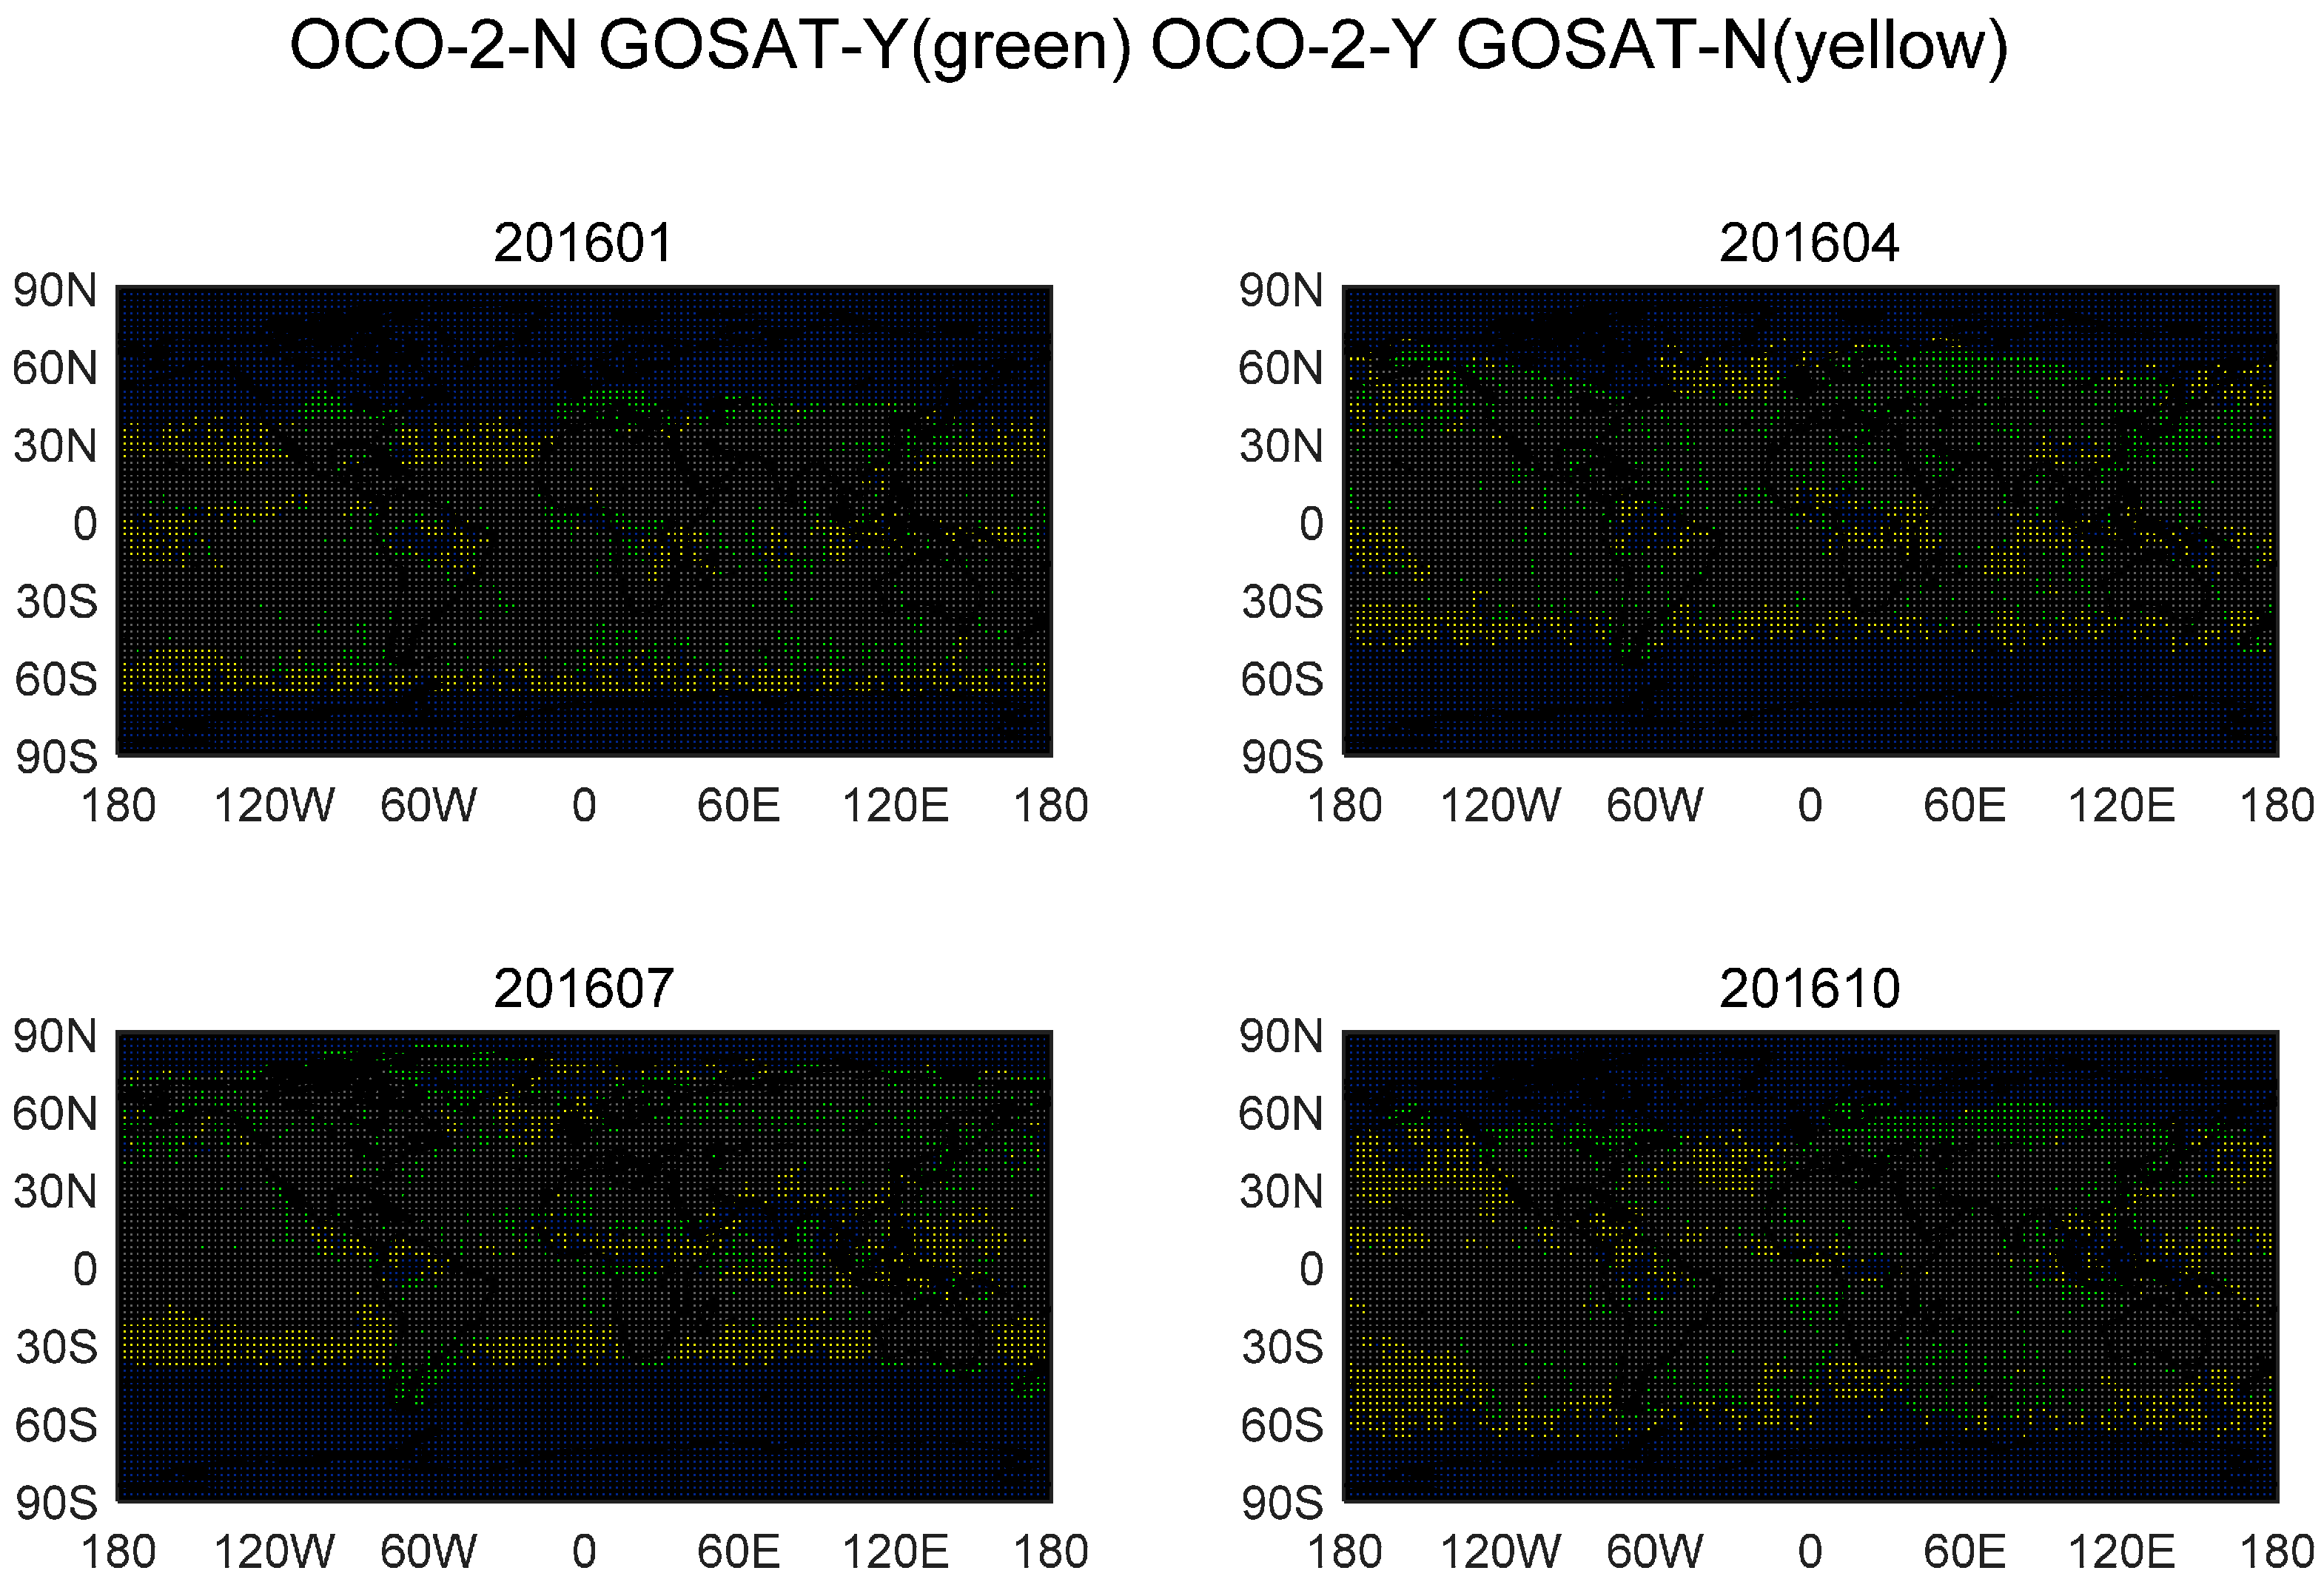
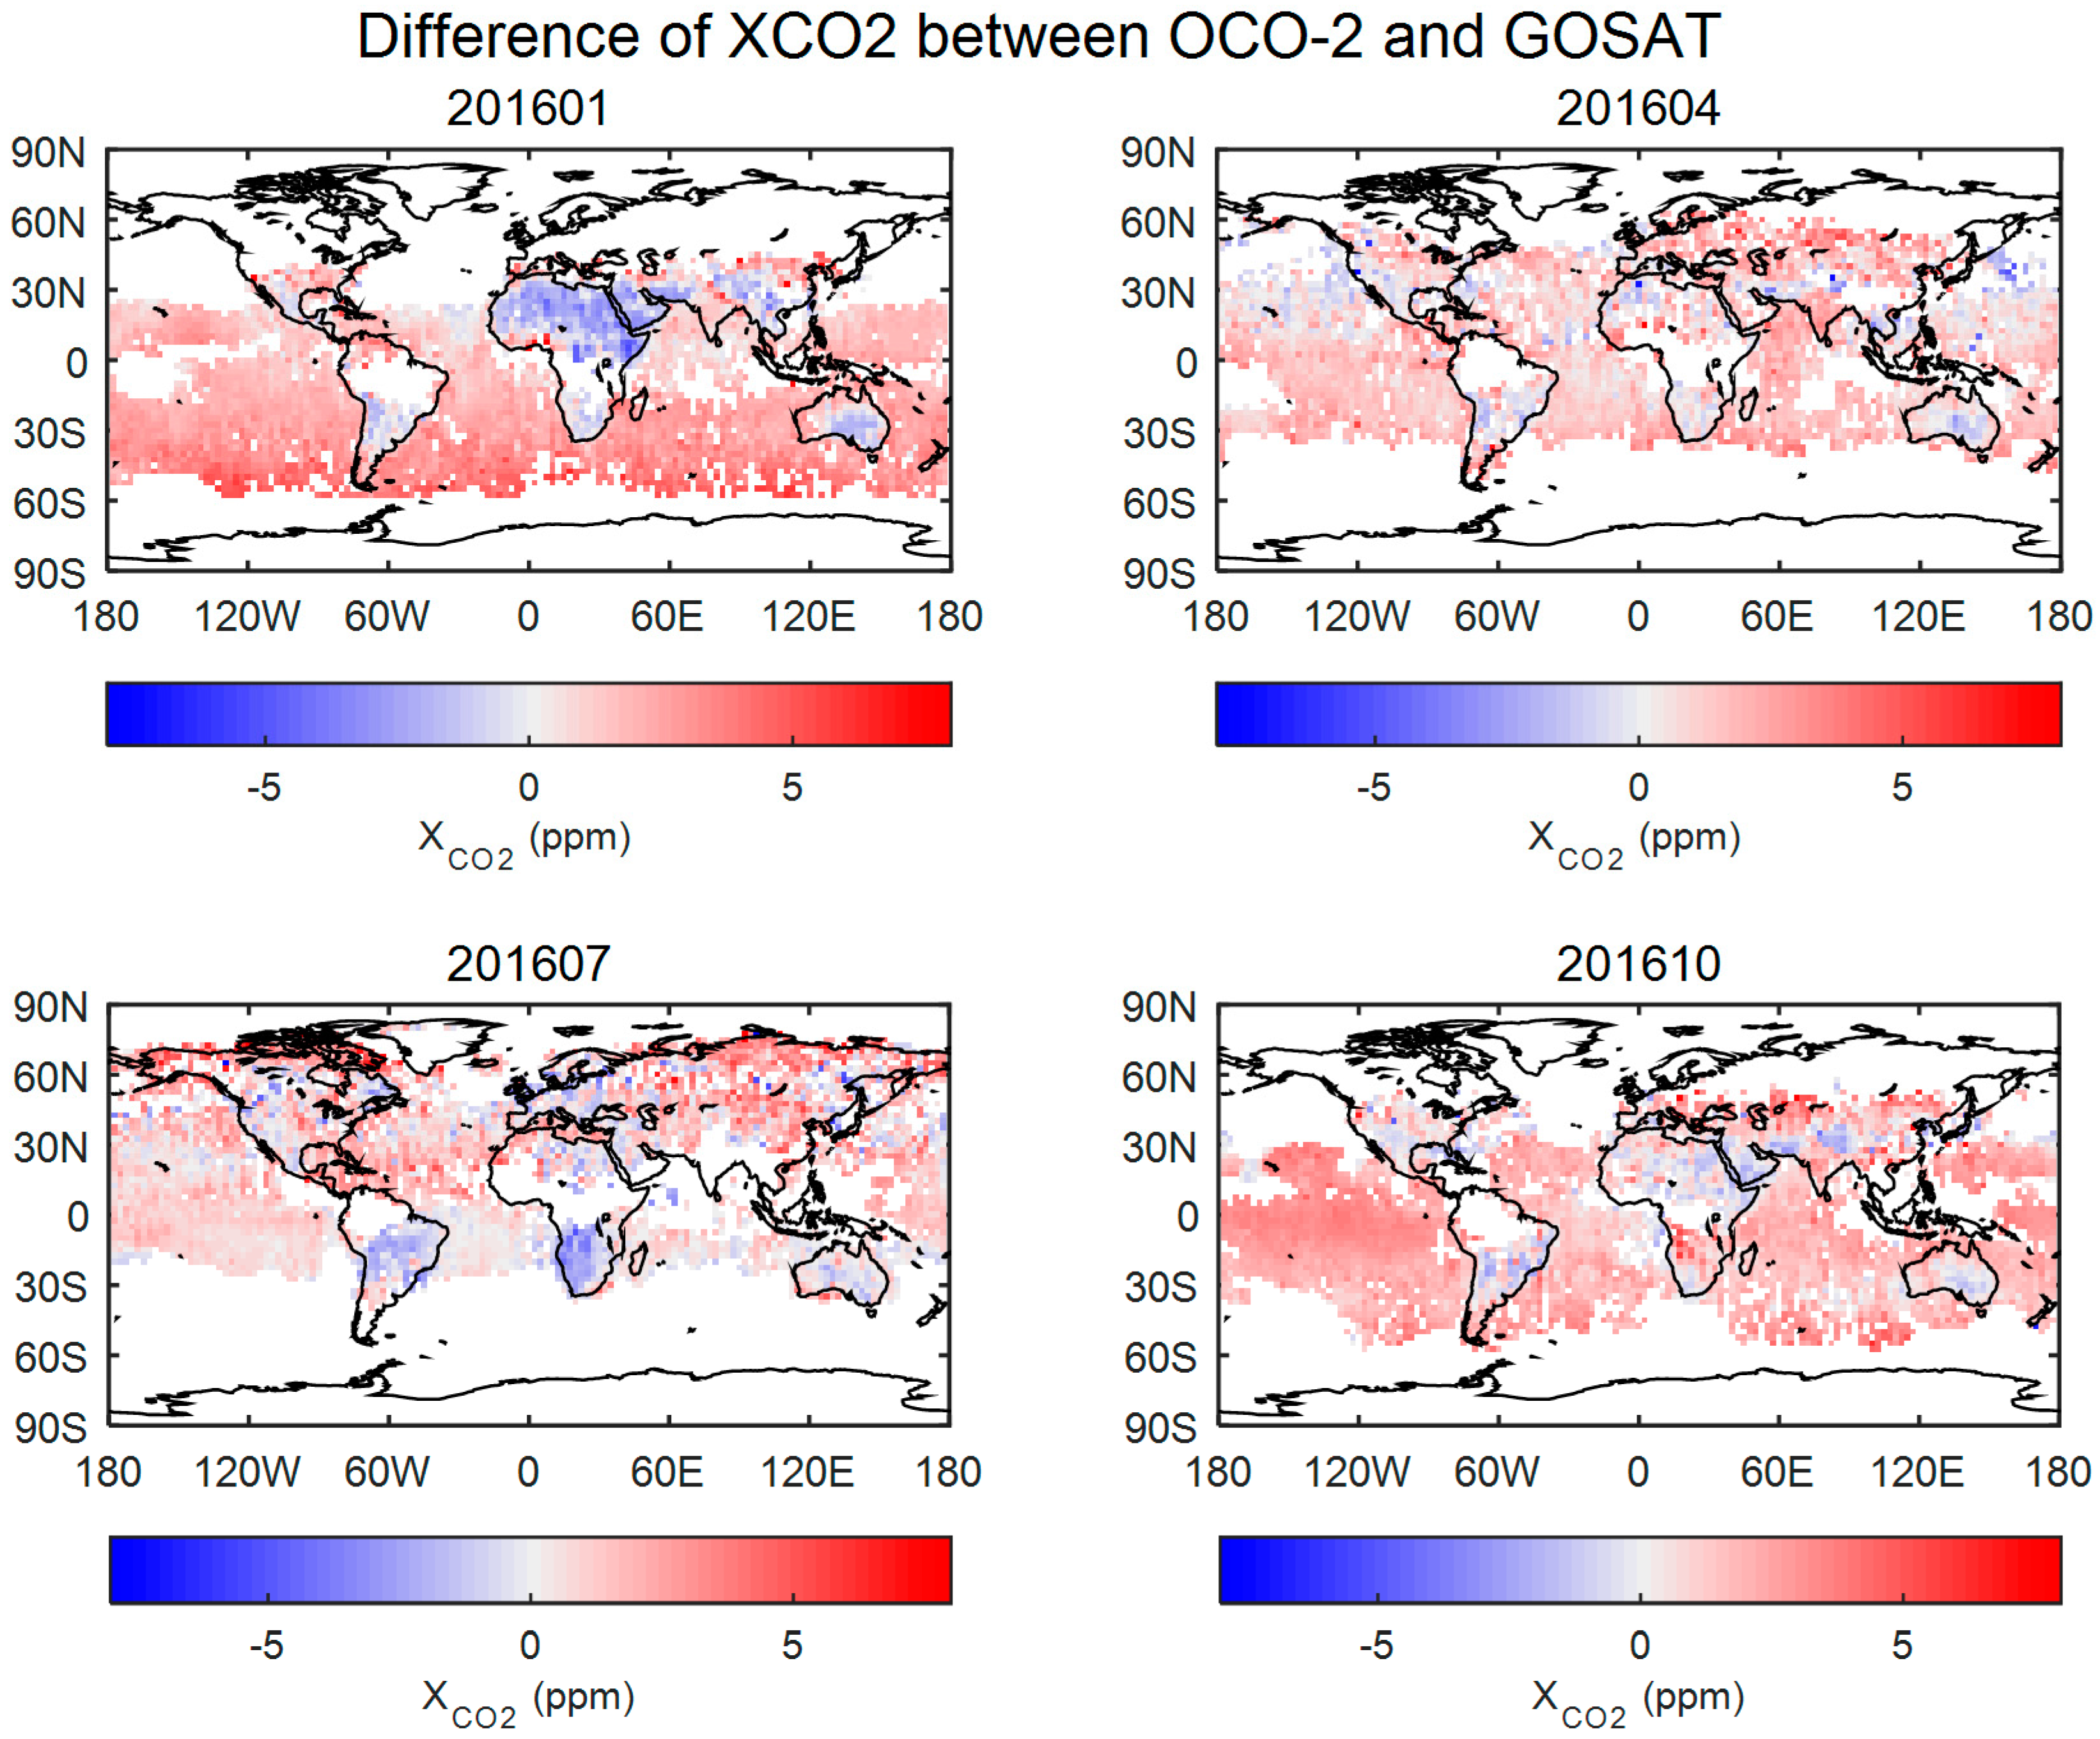
Figure 6 shows the spatial coverage of XCO2 from OCO-2 Lite File Product, GOSAT Level 3, and GOSAT Level 2, in globe, land, and ocean, respectively. The monthly coverage of terrestrial and marine XCO2 concentrations demonstrate strong variations in seasons, and the global coverage changed slightly. By applying the kriging method on GOSAT Level 2, GOSAT Level 3 was found to have a spatial coverage similar to that of OCO-2 in the spatial resolution of 2.5 latitude × 2.5 longitude. The coverage of OCO-2 XCO2 data is slightly larger than that of GOSAT Level 3 in globe, and considerably larger than GOSAT Level 3 in ocean, but lower than GOSAT Level 3 in land. The main reason behind this pattern is the effect of clouds and thick layers of aerosol on the observations of OCO-2, which would be screened by the filtering mechanism. Therefore, we analyzed the spatial variation of XCO2 distribution between OCO-2 and GOSAT Level 3. Figure 7 shows the comparison of spatial XCO2 distribution between OCO-2 and GOSAT. GOSAT can observe more north as compared with OCO-2 in the northern hemisphere and OCO-2 can observe more south when compared with GOSAT in the southern hemisphere, especially in July and October. The XCO2 retrievals were scattered near the equator except for the north and south ends of the observation area. The satellites were unable to gather XCO2 measurements over tropical rainforests, such as the Amazon basin and the Southeast Asia and Congo River basins. Figure 8 shows the difference in XCO2 measurements between OCO-2 and GOSAT. By comparing data gathered over four months in 2016, the range of biases between OCO-2 and GOSAT was found at the minimum in April, followed by July, October, and January. In these four months, the OCO-2 XCO2 values were generally higher than those of GOSAT in ocean but lower than those of GOSAT in some land regions, such as the North African Sahara, the Arabian Desert, and Southeast Australia. This characteristic is especially pronounced in winter and summer. In January, the OCO-2 XCO2 values were significantly higher than those of GOSAT in the ocean of the southern hemisphere and lower than those of GOSAT in the North African Sahara and the Arabian Desert. In July, the OCO-2 XCO2 values were significantly higher than those of GOSAT in the high latitudes of the northern hemisphere and lower in Central South America and Southern Africa.
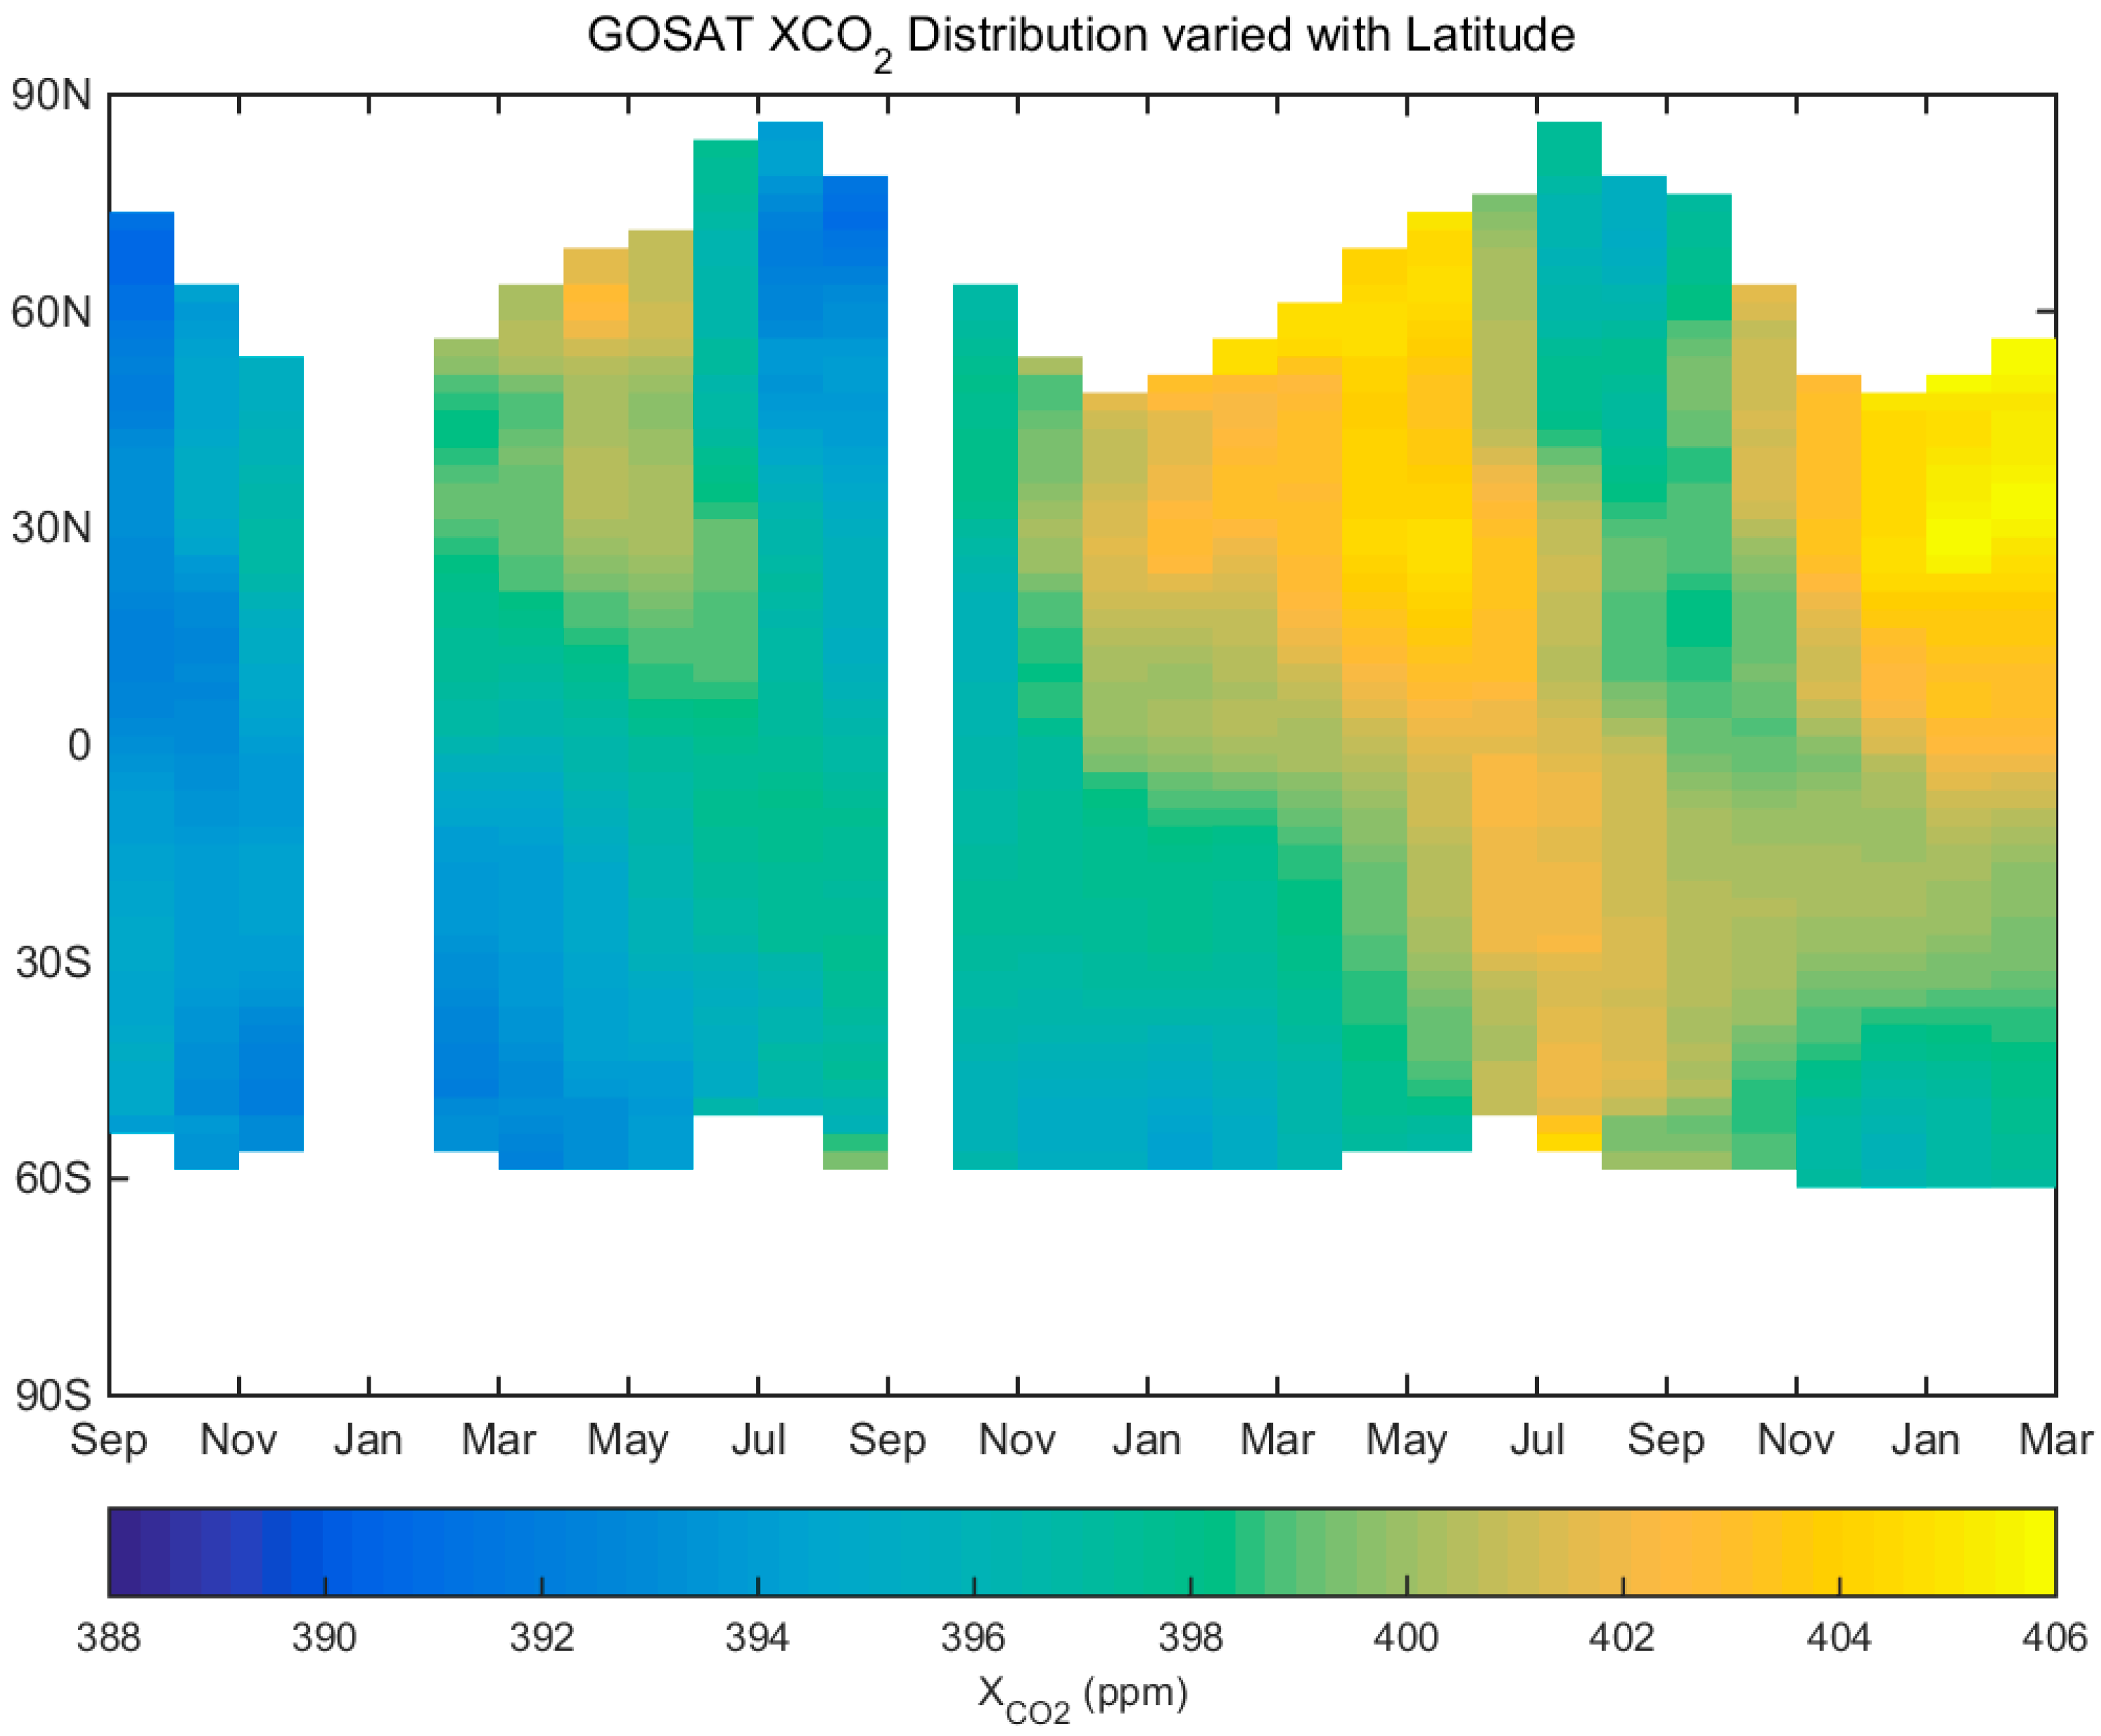
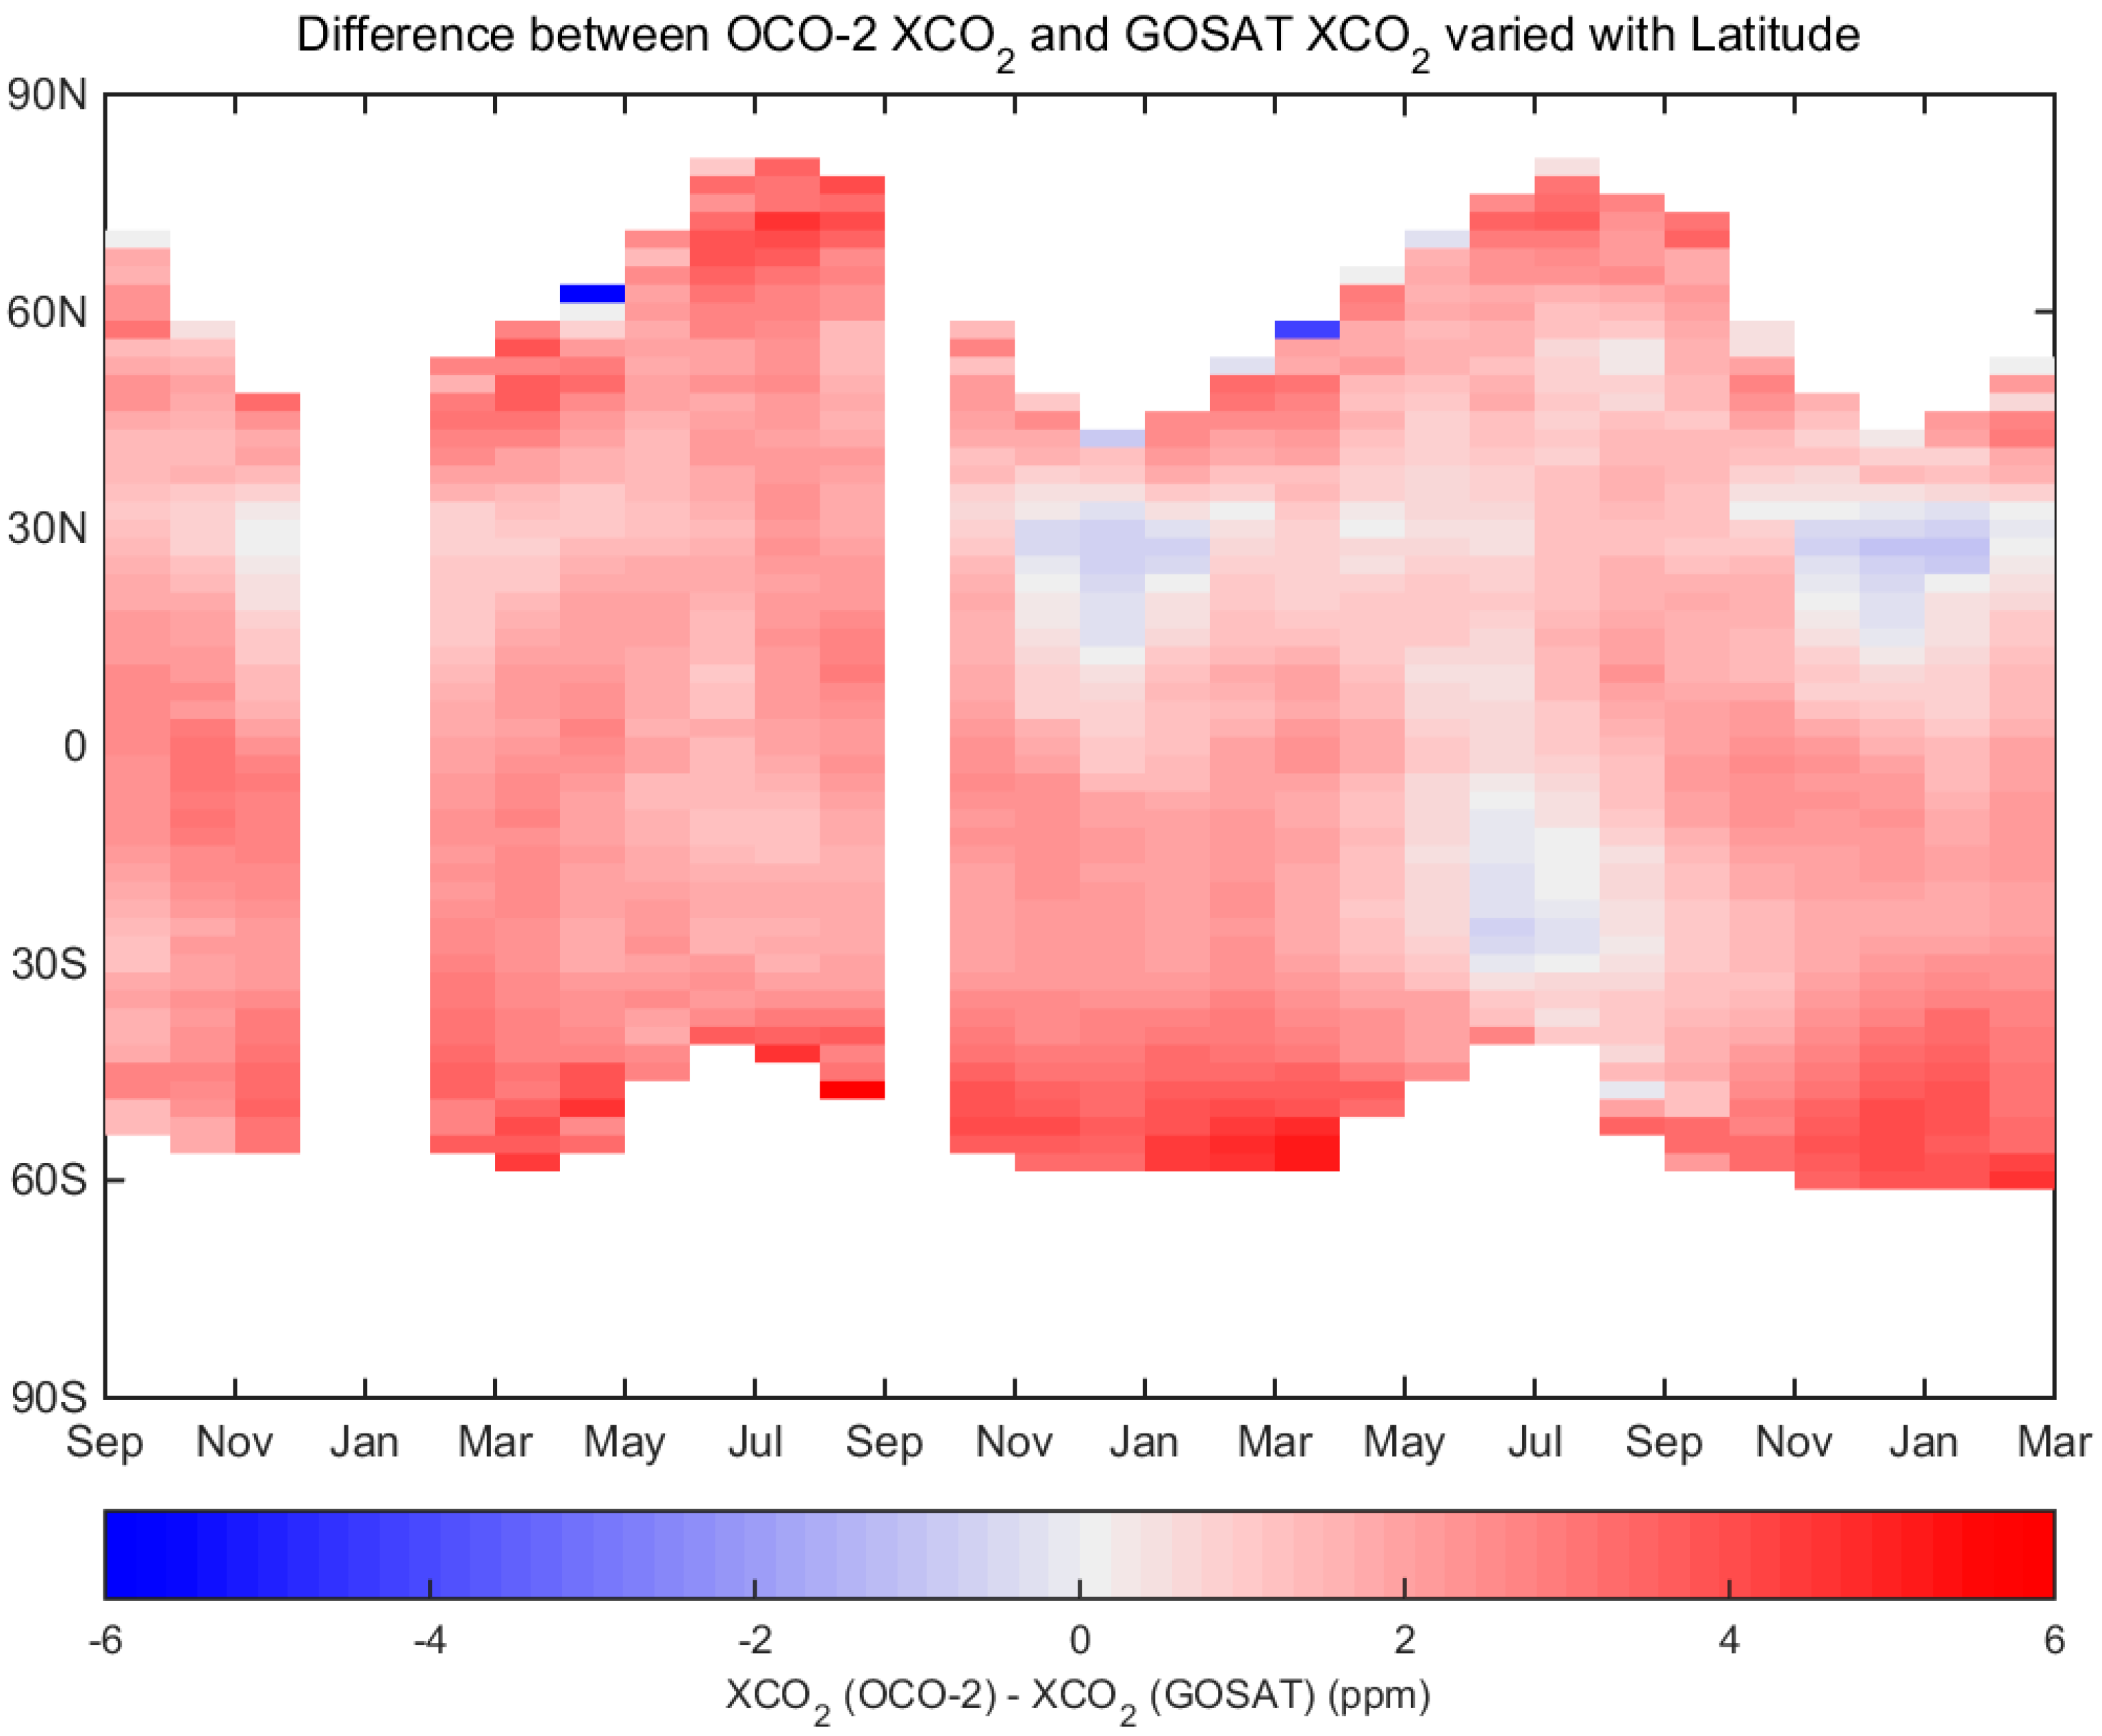
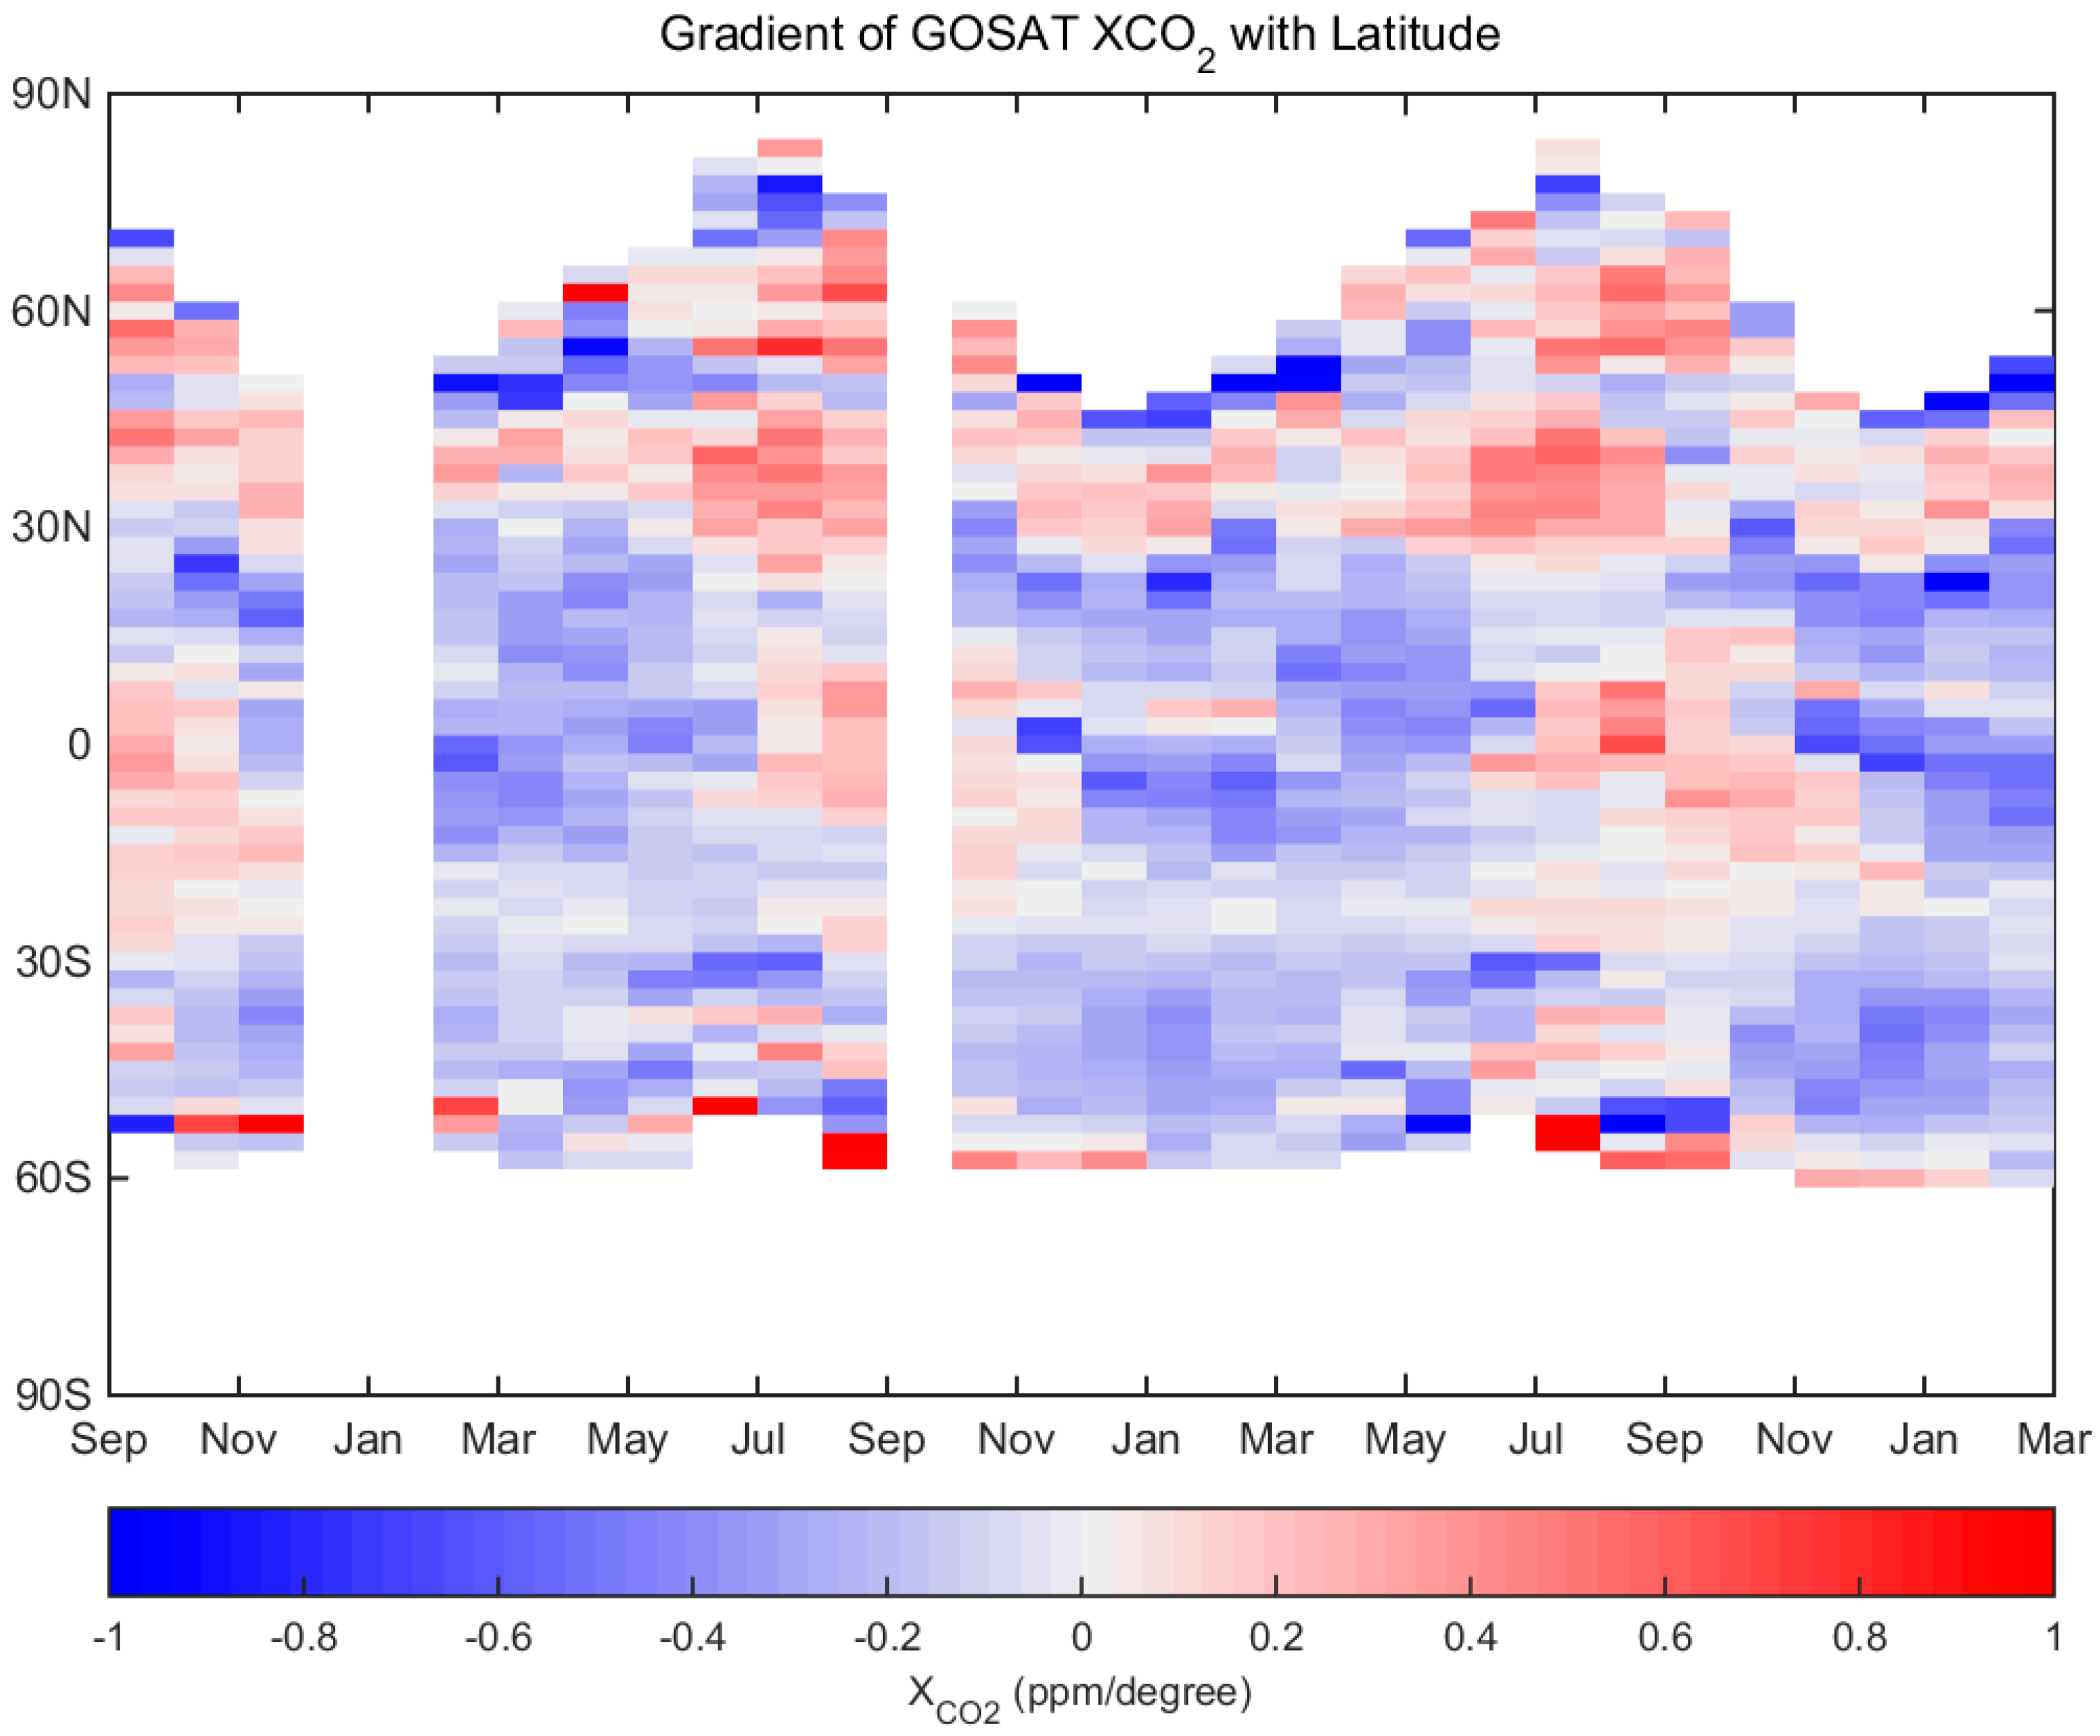
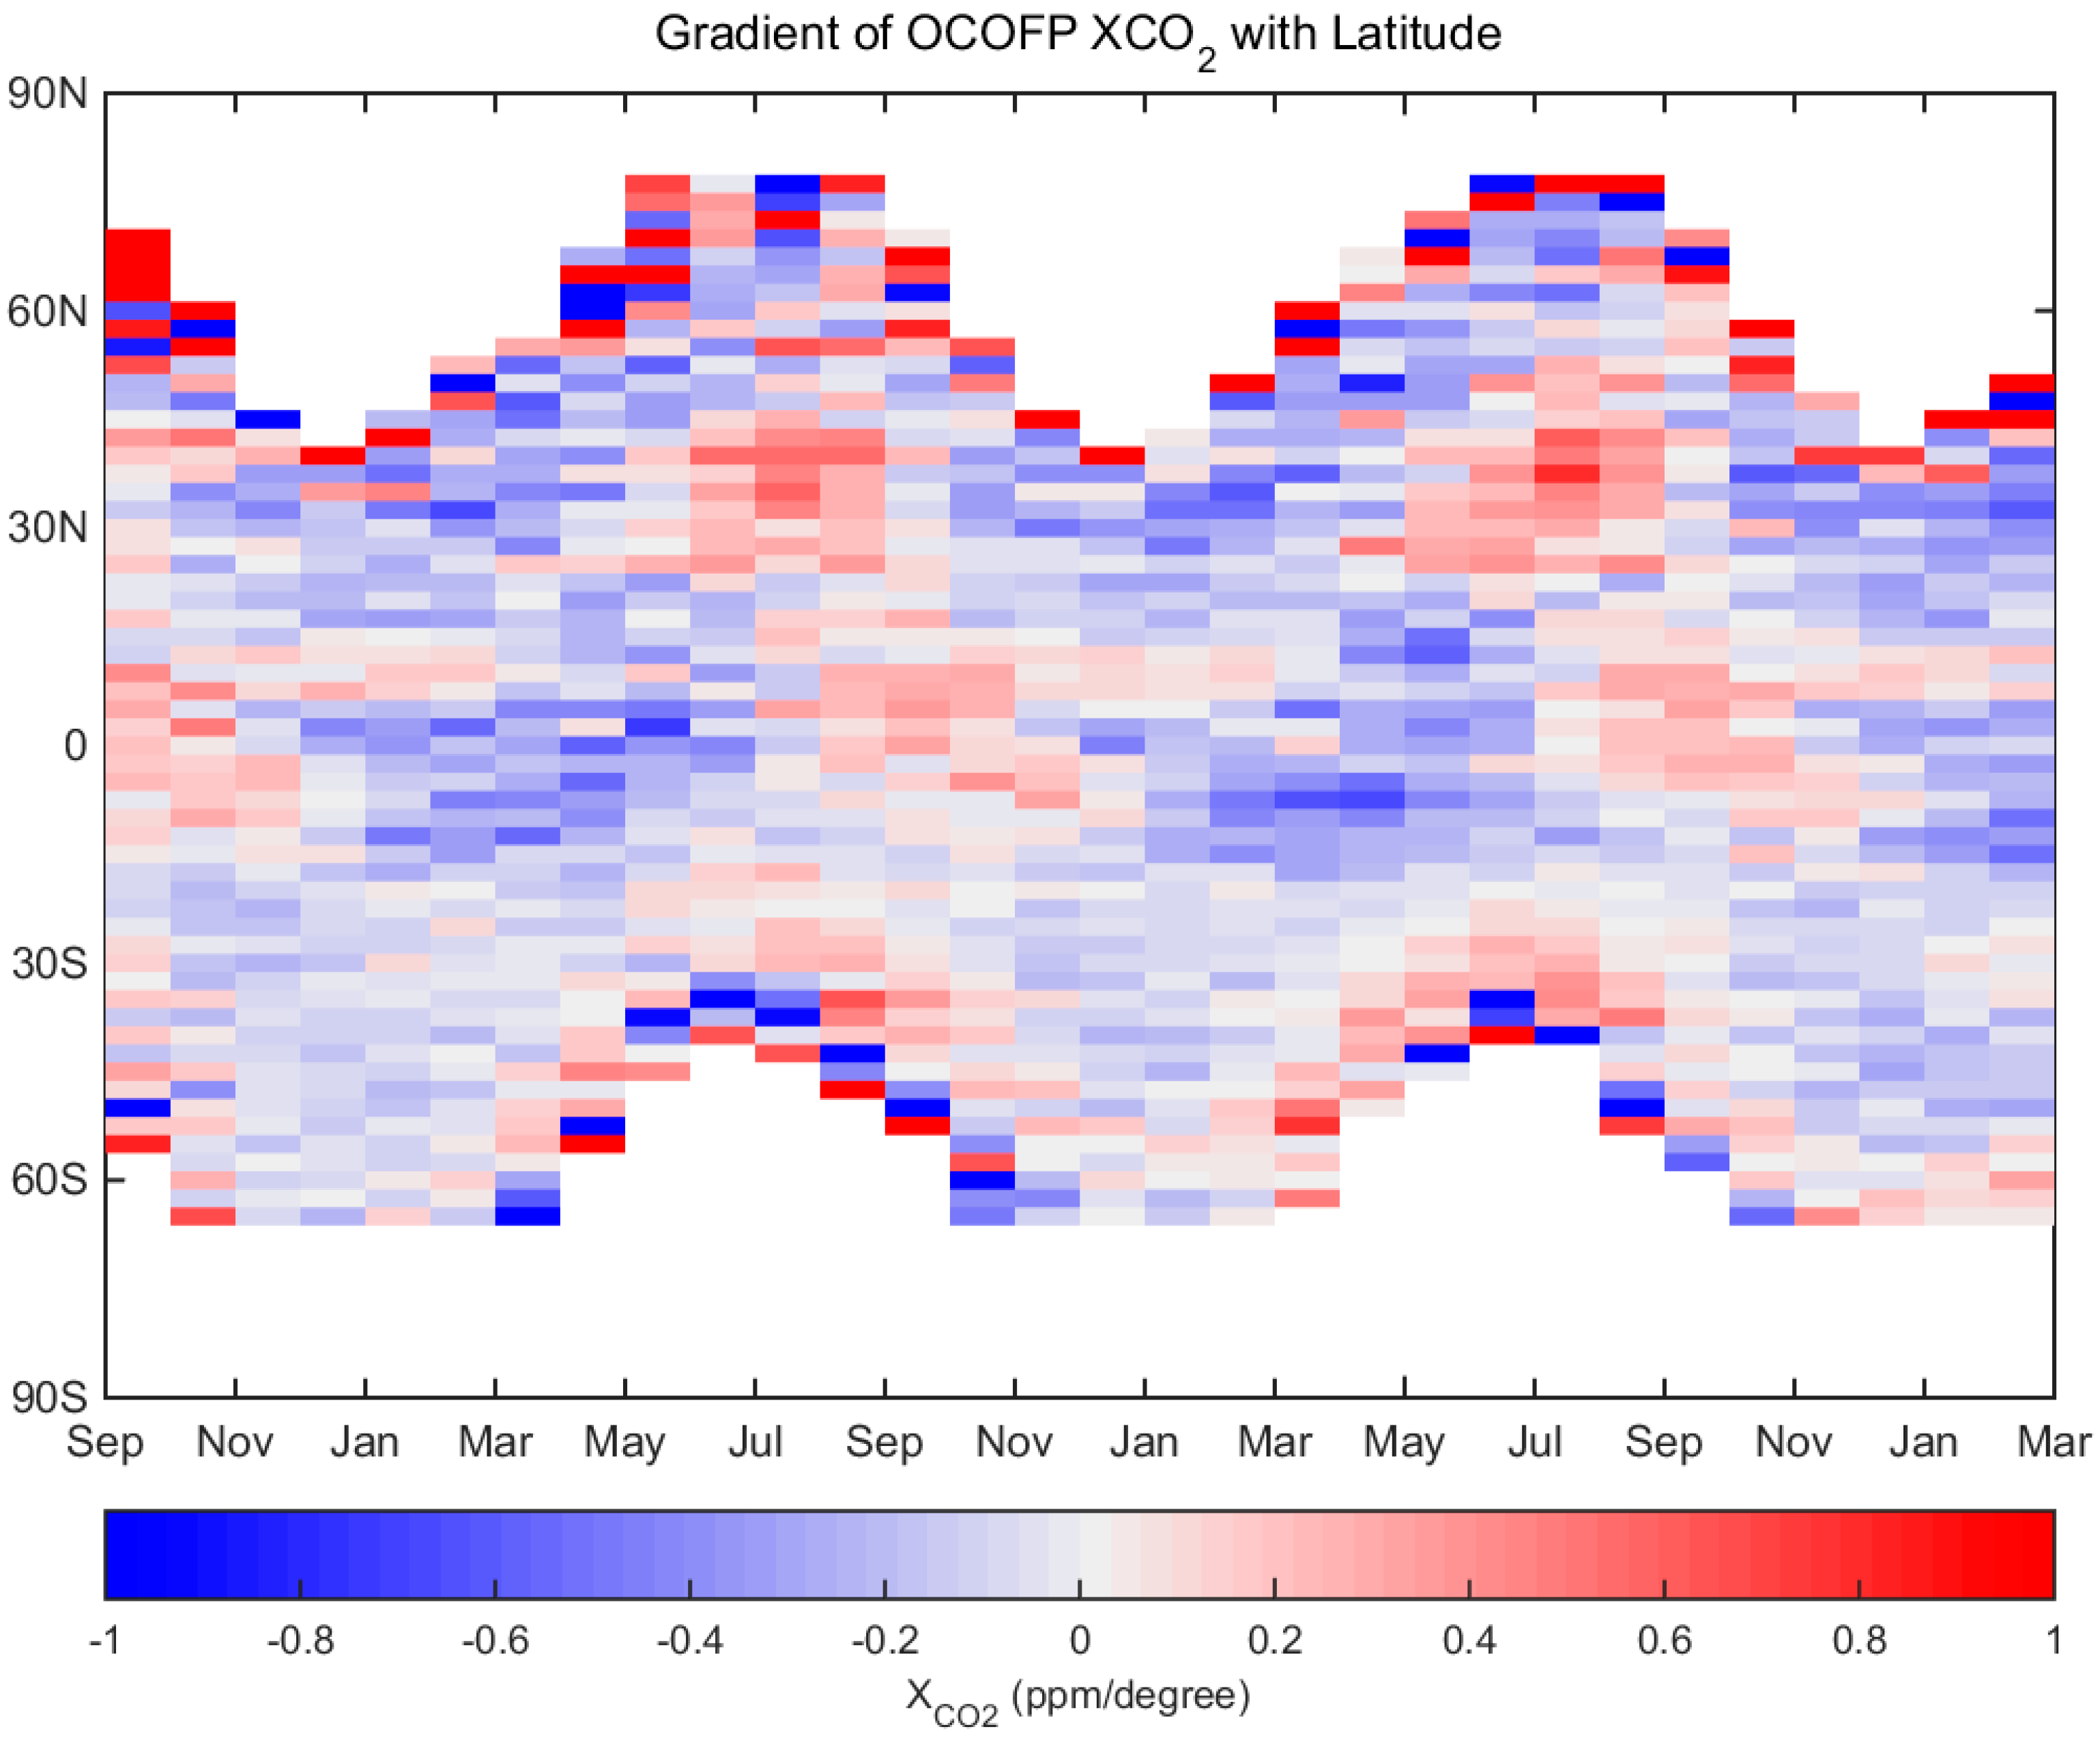
We calculated the monthly mean distribution of global average XCO2 in a 2.5-latitude resolution because the distribution of XCO2 has a distinct latitude change. From Figure 9, Figure 10 and Figure 11, the monthly XCO2 concentration distribution of GOSAT and OCO-2 was consistent in the latitudinal direction; however, the degree of change was related to the season. From November to January, the XCO2 data of OCO-2 was lower than those of GOSAT in the vicinity of 30°N and higher than those of GOSAT in the vicinity of 50°S, mainly because of the low XCO2 measurements that OCO-2 observed over the Sahara Desert at 30°N and the high marine measurements observed at 50°S in the three months. Moreover, in the northern and southern hemispheres, the monthly OCO-2 and GOSAT XCO2 change in peak–valley had the same two-to-three-month dislocation but with a large difference in the peak and valley values. In the later analysis, we focused on the trend of XCO2 distribution and seasonal cycle fluctuations from different data of the satellites in the northern and southern hemispheres. In addition, we calculated the difference in XCO2 latitude gradient between OCO-2 and GOSAT. Figure 12 and Figure 13 show that OCO-2 XCO2 data vary more intensely than those of GOSAT in latitude at the equatorial region and at both ends of the measurable geographical locations in the northern and southern hemispheres, where the data might be influenced by the large biases. Moreover, the latitudinal gradient has a relatively stable periodicity. From June to August, and between 50°N and 30°N, XCO2 gradually increased southward. From January to May and between 10°N and 10°S near the equator, XCO2 gradually decreased southward. However, between 30°S and 60°S, the latitudinal gradient of GOSAT and OCO-2 XCO2 data was slightly different. The latitudinal gradient of the XCO2 distribution of GOSAT was similar to that in the vicinity of the equator, which decreases southward from October to May. OCO-2 did not show the same trend of change and exhibited a relatively uniform distribution of XCO2.
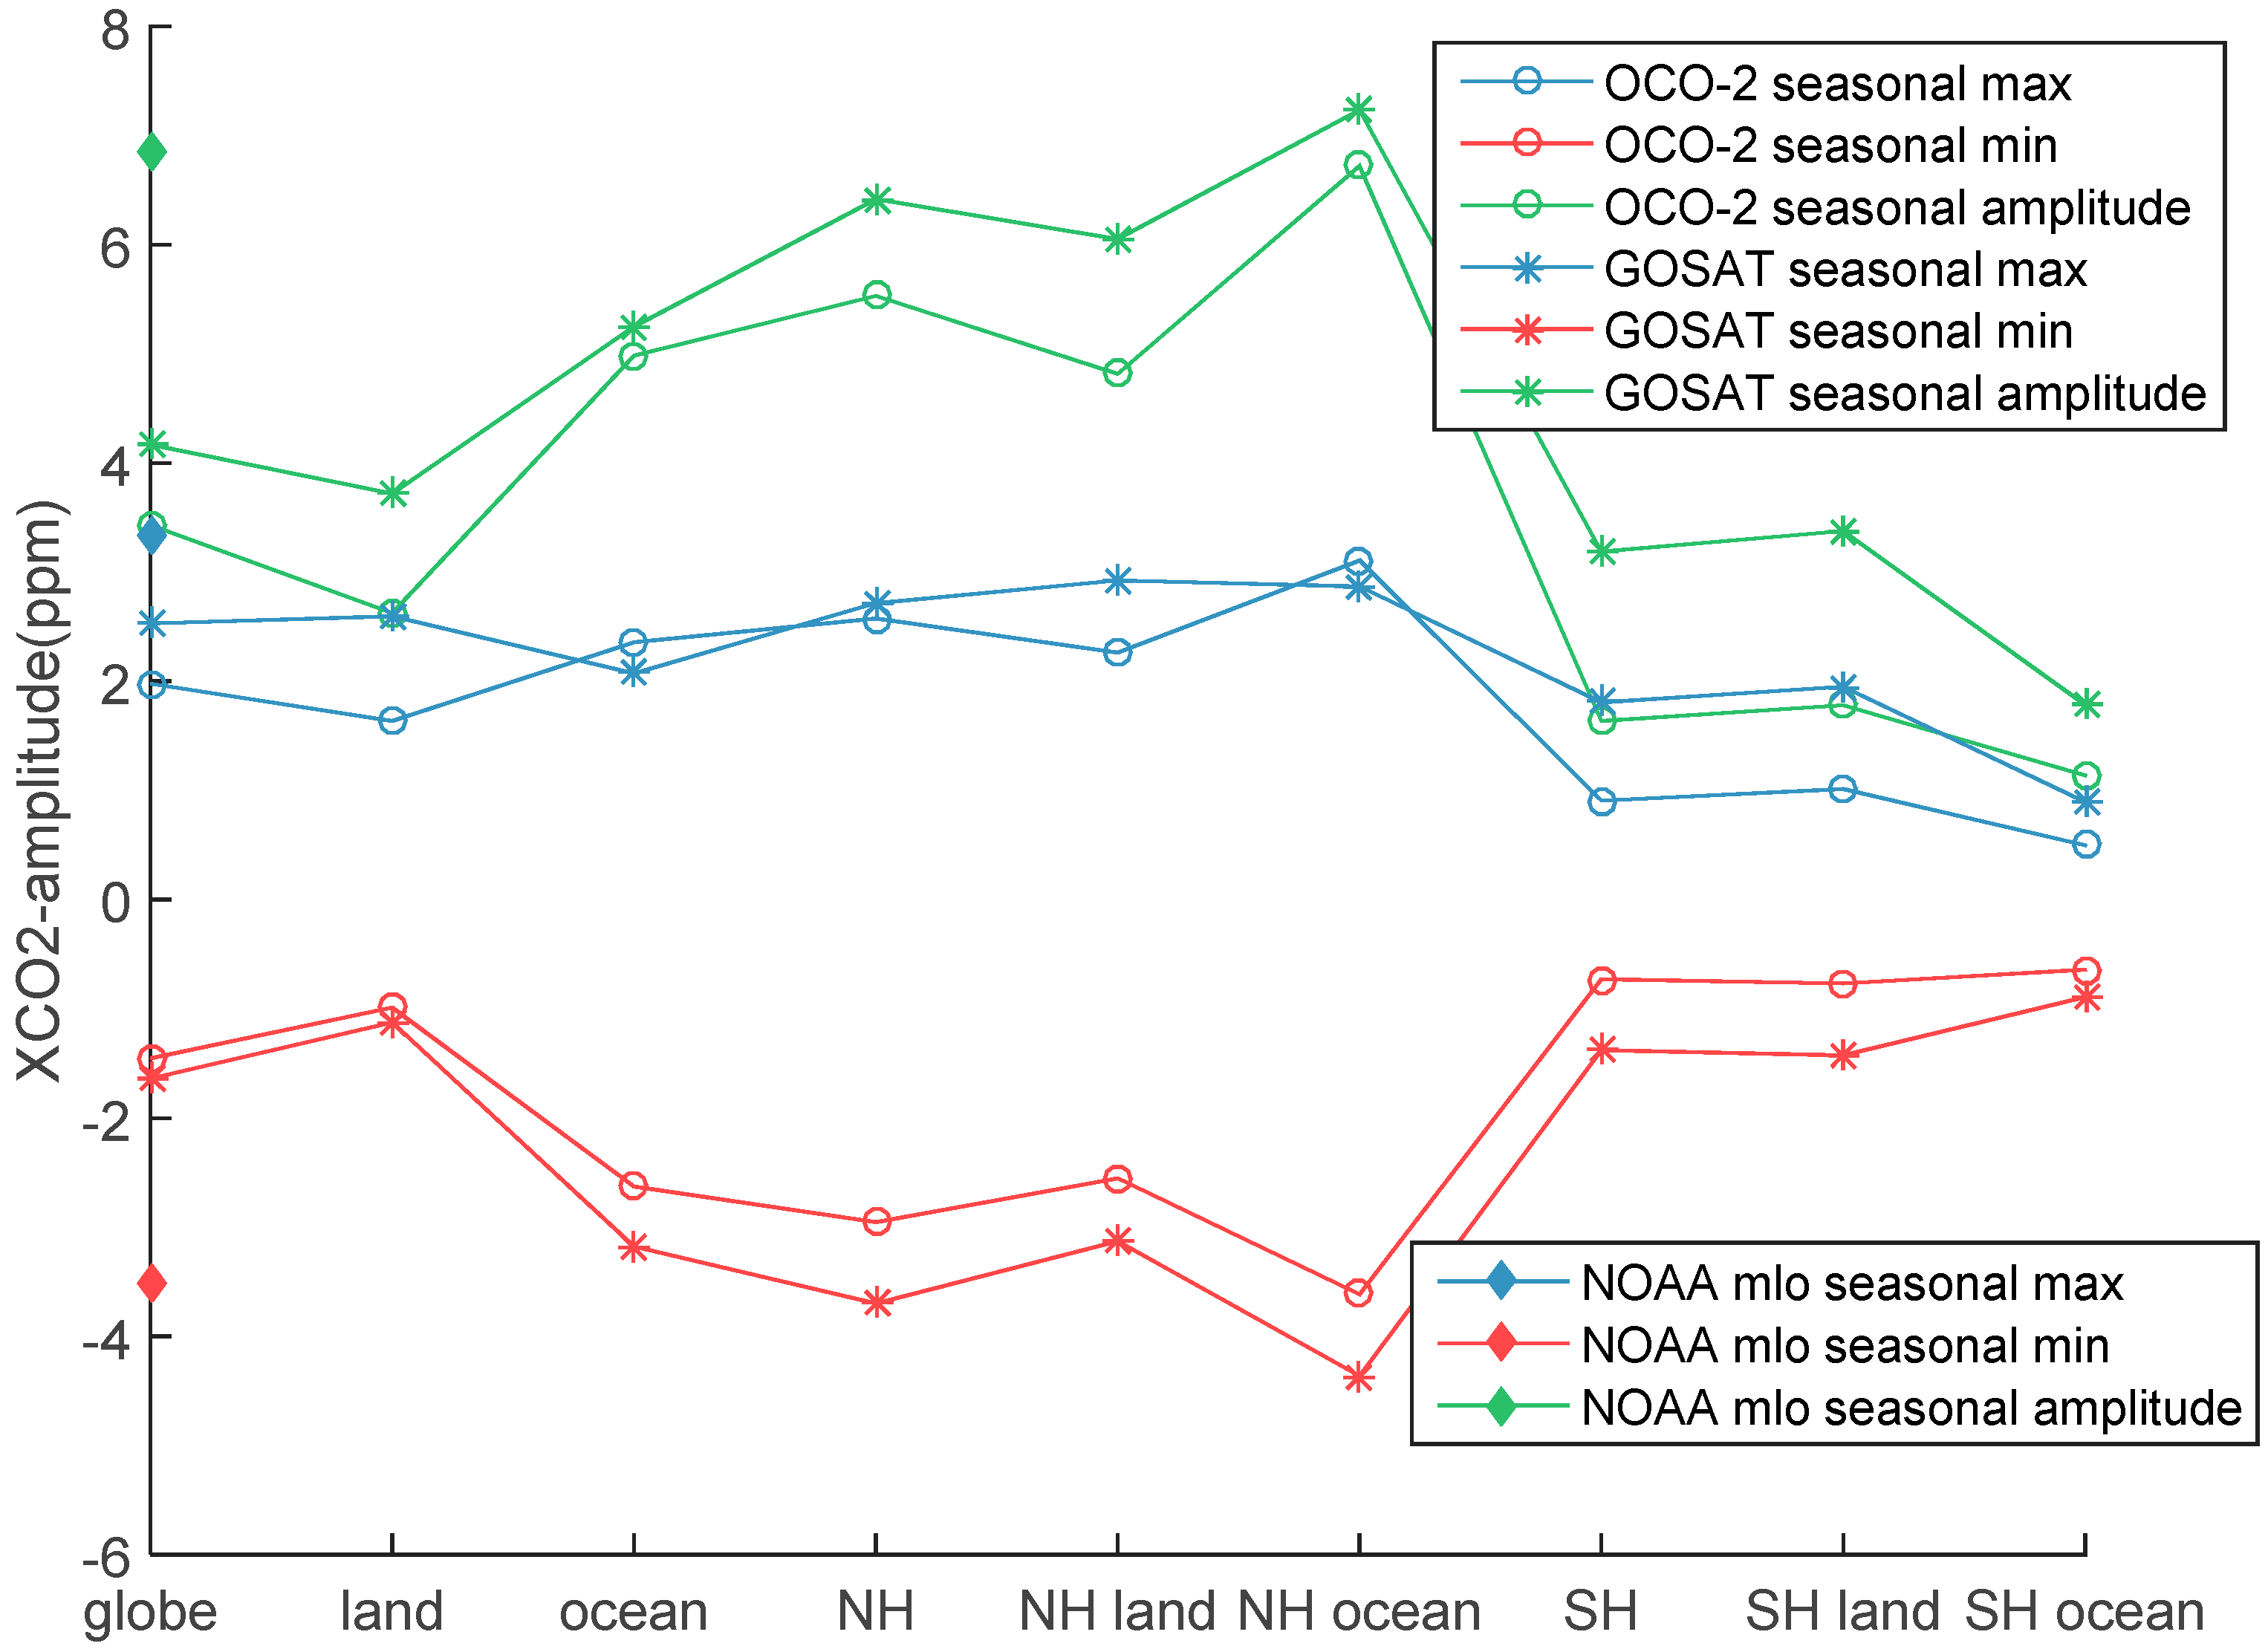
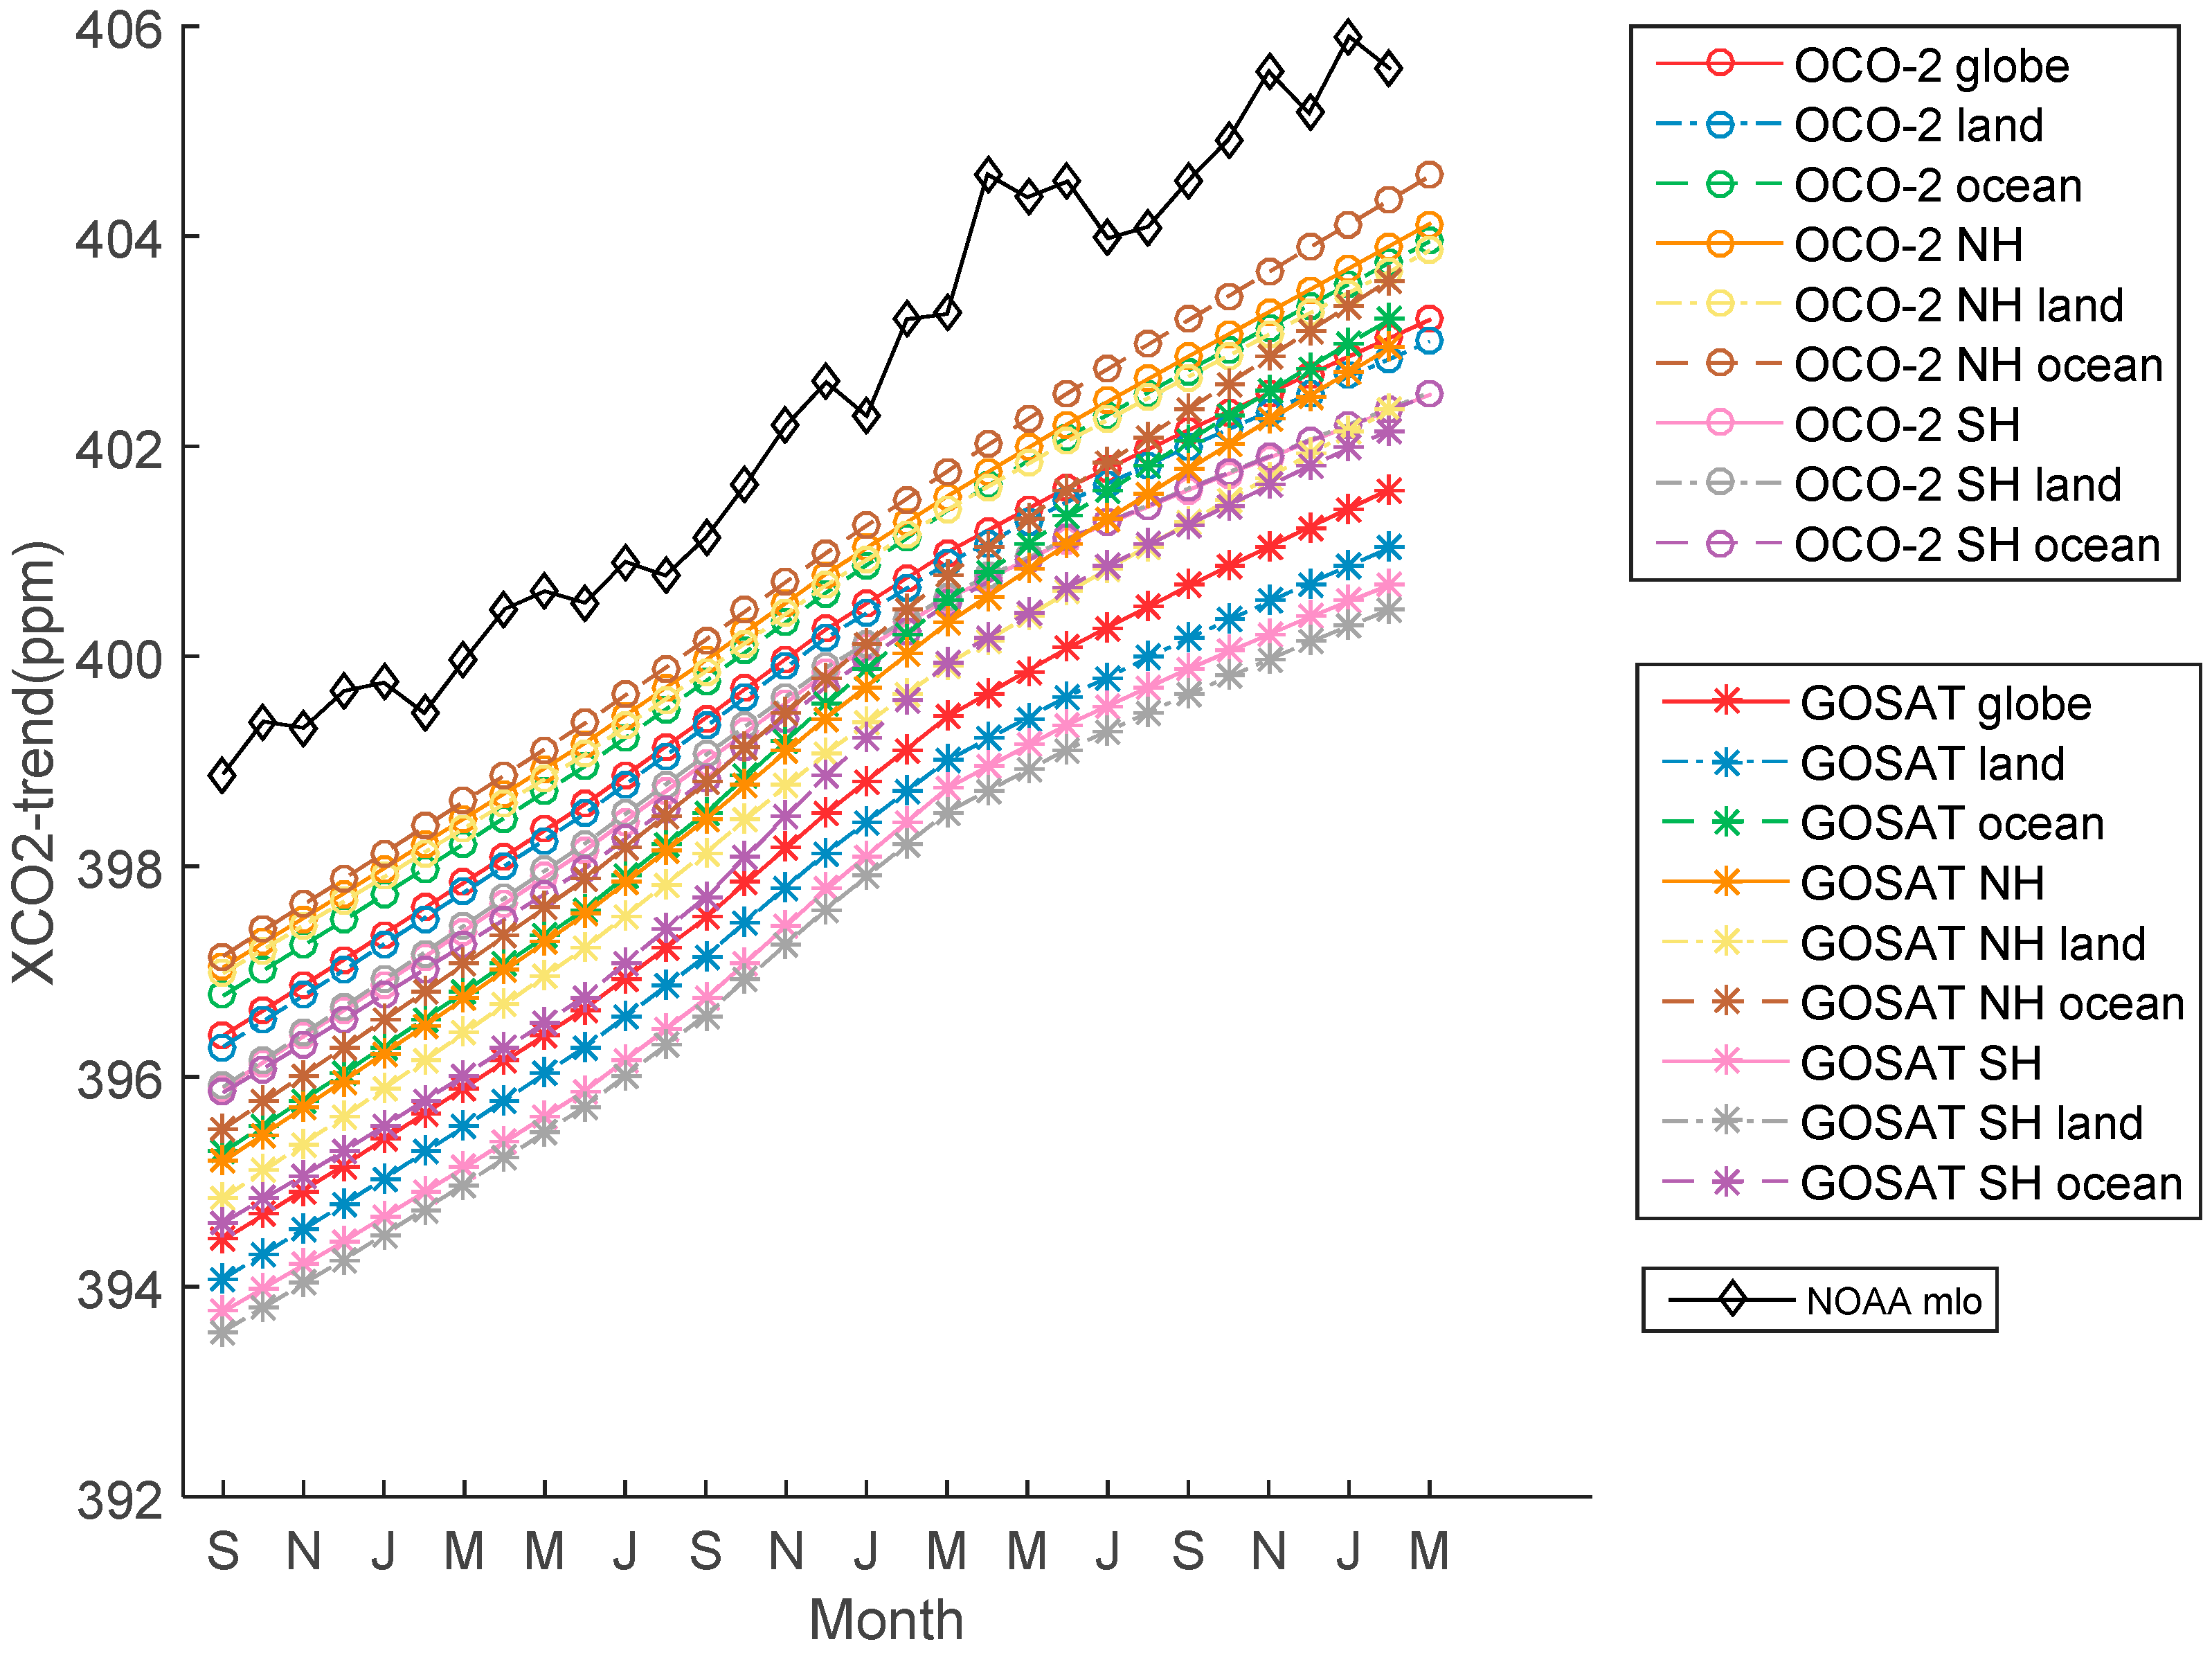
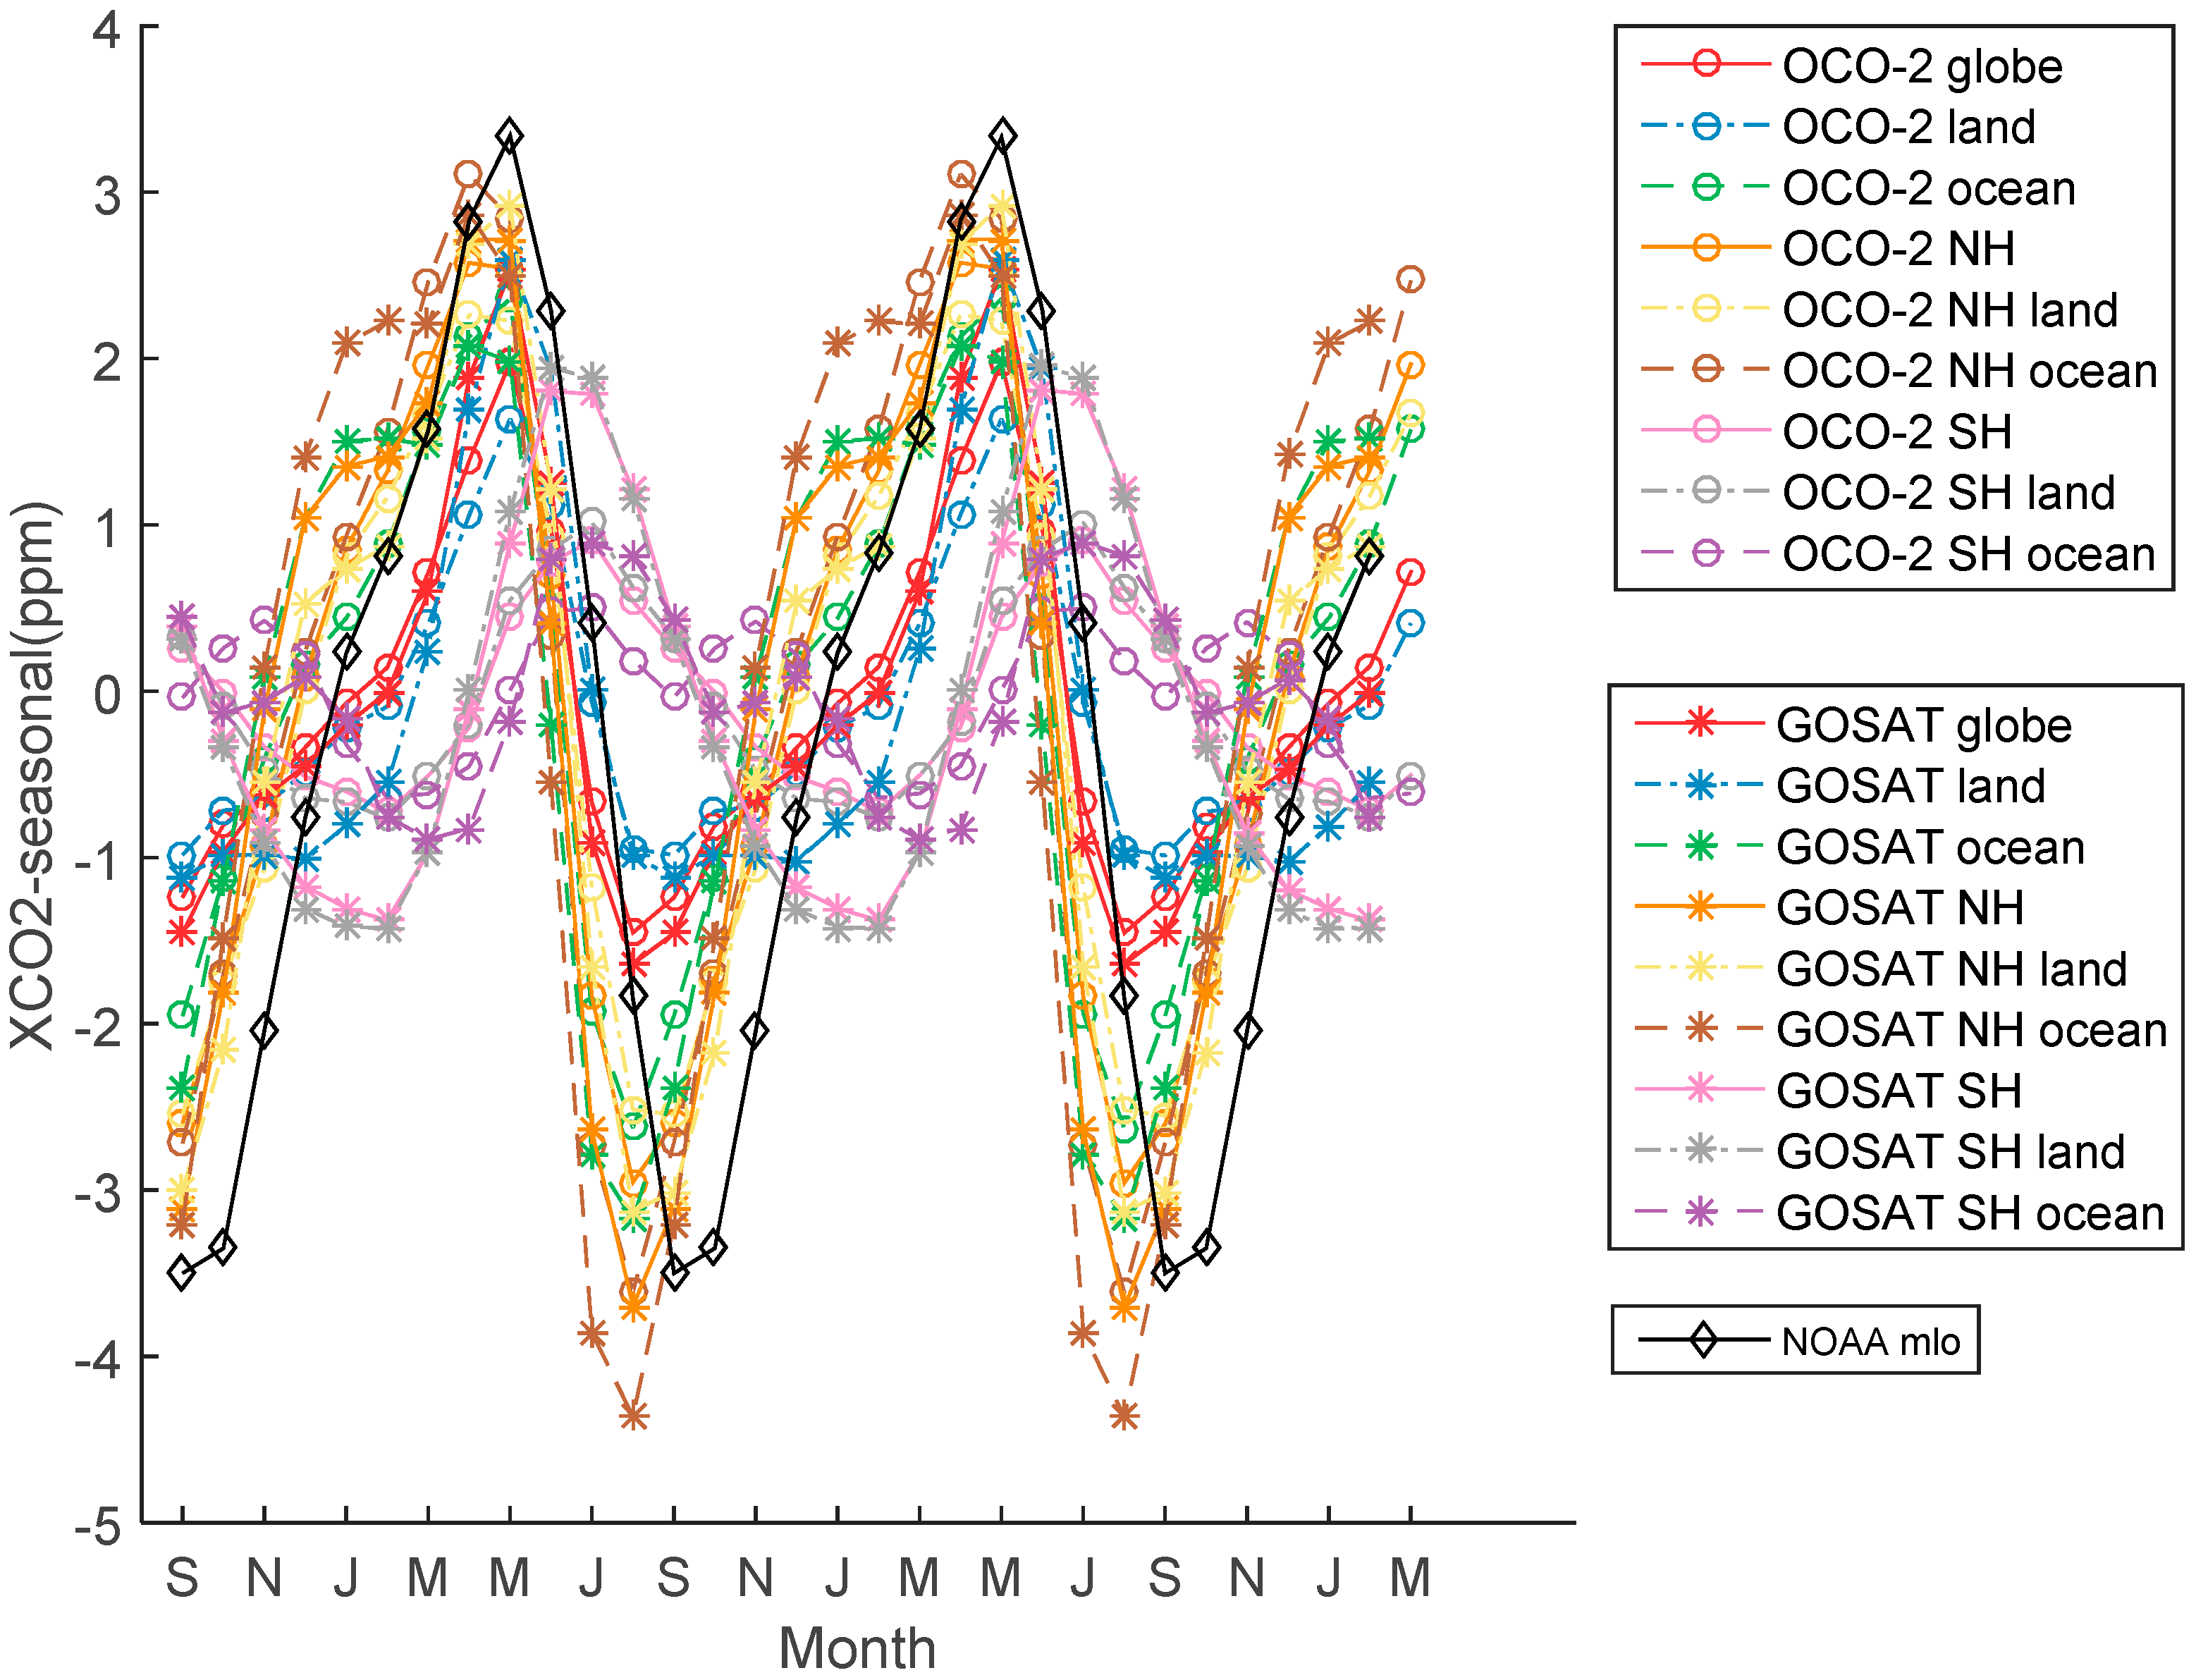
Therefore, we assumed that a difference between the observations of GOSAT and OCO-2 exist in the northern and southern hemisphere or in land and ocean, thereby resulting in significant seasonal and latitudinal differences in the global XCO2 latitude gradient. Therefore, we compared the monthly XCO2 distribution trend of OCO-2 for more than two years with that of GOSAT. The selected region types were divided into global, global land, global ocean, northern hemisphere, northern hemisphere land, northern hemisphere ocean, southern hemisphere, southern hemisphere land, and southern hemisphere ocean. Based on loess decomposition, we analyzed the annual growth trends and seasonal fluctuations in the different regions. The results are shown in Figure 14, Figure 15 and Figure 16. OCO-2 and GOSAT were consistent in terms of annual XCO2 growth trend; however, the GOSAT retrievals showed a higher XCO2 growth rate from November 2015 to April 2016 than other months, while OCO-2 reflected a relative stable XCO2 growth rate over the same time period. Moreover, OCO-2 data were approximately 1 ppm to 2 ppm higher than those of GOSAT overall in XCO2 trend values. As compared with the NOAA statistics of the monthly average CO2 on Mauna Loa at an altitude of 3400 m, which be believed to reflect truth about our global atmosphere, both the XCO2 trend values of OCO-2 and GOSAT were lower and smooth. When considering the seasonal fluctuation, GOSAT has a greater seasonal fluctuation amplitude than OCO-2, with greater amplitude in the northern hemisphere than the southern hemisphere, greater amplitude of ocean measurements than land measurements in the northern hemisphere, and lower amplitude of ocean measurements than land measurements in the southern hemisphere. The largest difference in seasonal amplitudes between GOSAT and OCO-2 occurred in the southern hemisphere. The differences in land measurements were larger than those in ocean measurements. When compared with the NOAA statistics of the seasonal values, the line shape of seasonal fluctuation is significantly different from satellites’ global XCO2 values, but similar to the XCO2 values of the northern hemisphere land statistics. Besides, the turning point in time of satellites’ XCO2 seasonal fluctuation was one month earlier than NOAA. It is demonstrated that satellites’ XCO2 better reflect truth about the global atmosphere. The NOAA statistics of CO2 on Mauna Loa seemed reflect the CO2 levels in the northern hemisphere land not global CO2.
4. Conclusions
This study is the first to compare the XCO2 data of two on-orbit GHG detection satellites, GOSAT and OCO-2. The comparison was divided into two aspects. We compared their accuracy in measuring atmospheric carbon dioxide column concentration with TCCON XCO2 measurements at all of the sites around the world since their launch. Then, we compared the global distribution of the XCO2 measurements of the two satellites. In the validation experiment, we settled for a spatial size of ±2 latitude and ±2.5 longitude of the TCCON site and a time range of ±0.5 h. Then, we compared the XCO2 data observed by the satellites with the TCCON data. Because of their different instrument designs, the spatial resolution of GOSAT was lower than that of OCO-2, and OCO-2 had significantly more verifiable XCO2 observation points than GOSAT. The verification results also show that the standard deviation of GOSAT observations were larger than that of OCO-2 at TCCON sites. In addition, given the long observation period of GOSAT, we compared the observation data gathered by GOSAT since it launched in 2009 with the observation data gathered in the past two years. The GOSAT observations of XCO2 in the past two years were not as accurate as when GOSAT was newly launched. Given the uneven distribution of TCCON ground observation sites, we divided each site into latitude zones and verified XCO2 based on these zones. Based on the comparison of site data from different latitude zones, the linear relationship from the north to the south, between the XCO2 observed by the satellite, and the XCO2 observed by ground-based TCCON were observed to have weakened and the linear coefficient had decreased. This characteristic is important for the correction of XCO2 for satellite observations. Satellites have multi-mode observation design features to adapt to different observation environments. Therefore, we also analyzed the detection accuracy of XCO2 satellite observation in different observation modes for both satellites. OCO-2 XCO2 measurement accuracy under the target mode was the highest among the four observation modes, which was consistent with the work of Wunch [25]. In the comparative experiment, we selected the GOSAT Level 3 data instead of the GOSAT Level 2 data due to the spatial coverage of GOSAT Level 2 data for comparison with the OCO-2 XCO2 data for the spatiotemporal resampling of 2.5 latitude × 2.5 longitude for a grid of monthly data in several aspects, such as the comparison of the XCO2 spatial distributions, the spatial and temporal contrast of the XCO2 latitude gradients, and the annual growth trend and fluctuation contrast of XCO2 in different spaces (i.e., land, ocean, northern hemisphere, and southern hemisphere). Results show that GOSAT and OCO-2 generally lacked good observations in tropical rainforest areas. Moreover, GOSAT XCO2 observation values were generally lower than those of OCO-2 by approximately 2 ppm, except in Northern and Southern Africa, Southeast Australia, and Central and Southern South America, where seasonal fluctuation was in low degree. In addition, GOSAT and OCO-2 in the distribution of latitude characteristics also exist at different seasonal fluctuations, which occurred mainly in the past one and a half years. Furthermore, the analysis of the annual growth trend and seasonal fluctuation of XCO2 reveals that the growth trends of GOSAT and OCO-2 were identical, and the seasonal fluctuation degree of GOSAT was higher than that of OCO-2, especially in the northern hemisphere ocean. Contrary to the trend values and seasonal values calculated by NOAA for global monthly XCO2, our findings indicate that the trend values of both satellites’ observations were low and smooth, and that the GOSAT values resembled the NOAA statistics less closely than those of OCO-2; seasonal values calculated by satellites’ observations in the northern hemisphere land were generally similar to those by NOAA.
Overall, as the two on-orbit GHG exploration satellites, OCO-2 and GOSAT have atmospheric CO2 detection capabilities. However, OCO-2 is better at obtaining accurate and more XCO2 measurements than GOSAT and can reflect changes in regional CO2 concentration at moderate and small scales. Moreover, OCO-2 has a wider detection coverage and higher spatial resolution. It is more likely to realize a more accurate calculation of carbon-source carbon sink data source because of the contribution of both satellites for sensing atmospheric carbon fraction. In the future, the improvement of the retrieval algorithm for OCO-2 will advanced corrected the measurement biases and OCO-2 will be a good and stable supplement instrument for the study of carbon cycle.
Acknowledgments
This work was supported by the National Key Research and Development Program of China (2017YFC0212600), the National Natural Science Foundation of China (Grant No. 41627804 and No. 41601351), the China Postdoctoral Science Foundation funded project (Grant No. 2016M592389, No. 2017T100580 and No. 2016M602362) and the Fundamental Research Funds for the Central Universities (Grant No. 2042016kf0032 and No. 2042017kf0006). OCO-2 data were collected by the OCO-2 Project at the Jet Propulsion Laboratory, California Institute of Technology, and obtained from the OCO-2 data archive maintained at the NASA Goddard Earth Science Data and Information Services Center. TCCON data were obtained from the TCCON Data Archive hosted by the Carbon Dioxide Information Analysis Center (TCCON.onrl.gov). Operation of the TCCON station on Ascension Island has been funded by the Max Planck Institute for Biogeochemistry, Jena, Germany. The TCCON site at Ile de la Réunion is operated by the Royal Belgian Institute for Space Aeronomy with financial support in 2014 and 2015 under the EU project ICOS_Inwire and the ministerial decree for ICOS (FR/35/IC2) and local activities supported by LACy/UMR8105—Université de La Réunion. Operation of TCCON sites at Tsukuba and Rikubetsu is supported in part by the GOSAT project. The operation of the Izaña FTIR instrument has been very importantly supported by O. E. García and E. Sepúlveda, which are contracted by the Meteorological State Agency of Spain (AEMET). Measurements at Darwin and Wollongong are supported by Australian Research Council grants DP0879468, DP110103118 & DP140101552. Darwin TCCON is also supported by the Australian Bureau of Meteorology and NASA’s Orbiting Carbon Observatory Project. The ACOS/GOSAT retrievals were developed and carried out at the NASA Jet Propulsion Laboratory and Colorado State University, with funding from the NASA ACOS project. The SRON/GOSAT has been supported by the ESA Climate Change Initiative-Greenhouse Gases project. The authors also thank David Griffith and Rigel Kivi for useful comments to this article.
Author Contributions
A.L. designed the study, performed the experimental work and wrote the manuscript. G.H. supervised the project. C.X. corrected the manuscript and collected necessary data and parameters. W.G. funded this research. All authors discussed the results and contributed to the manuscript. Correspondence and requests for materials should be addressed to A.L. (email: [email protected]).
Conflicts of Interest
The authors declare no conflict of interest.
References
- Kuze, A.; Suto, H.; Nakajima, M.; Hamazaki, T. Thermal and near infrared sensor for carbon observation fourier-transform spectrometer on the Greenhouse Gases Observing Satellite for greenhouse gases monitoring. Appl. Opt. 2009, 48, 6716–6733. [Google Scholar] [CrossRef] [PubMed]
- Crisp, D.; Atlas, R.M.; Breon, F.M.; Brown, L.R.; Burrows, J.P.; Ciais, P.; Connor, B.J.; Doney, S.C.; Fung, I.Y.; Jacob, D.J.; et al. The Orbiting Carbon Observatory (OCO) mission. Adv. Space Res. 2004, 34, 700–709. [Google Scholar] [CrossRef]
- Hammerling, D.M.; Michalak, A.M.; Kawa, S.R. Mapping of CO2 at high spatiotemporal resolution using satellite observations: Global distributions from OCO-2. J. Geophys. Res. Atmos. 2012, 117. [Google Scholar] [CrossRef]
- Liao, M. Long duo rocket successfully launched china’s first carbon satellite. China Aerosp. 2017, 21. [Google Scholar]
- Han, G.; Ma, X.; Liang, A.; Zhang, T.; Zhao, Y.; Zhang, M.; Gong, W. Performance Evaluation for China’s Planned CO2-IPDA. Remote Sens. 2017, 9, 768. [Google Scholar] [CrossRef]
- Guerlet, S.; Butz, A.; Schepers, D.; Basu, S.; Hasekamp, O.P.; Kuze, A.; Yokota, T.; Blavier, J.F.; Deutscher, N.M.; Griffith, D.W.T. Impact of aerosol and thin cirrus on retrieving and validating XCO2 from GOSAT shortwave infrared measurements. J. Geophys. Res. Atmos. 2013, 118, 4887–4905. [Google Scholar] [CrossRef]
- Yoshida, J.; Kuze, A.; Suto, H.; Shiomi, K.; Fukagawa, S.; Nakajima, M. GOSAT/TANSO Level 1 Algorithms—Toward 1ppm Accuracy of XCO2 from a Space-borne FTS. In Fourier Transform Spectroscopy; Optical Society of America: Washington, DC, USA, 2013. [Google Scholar]
- Parker, R.; Boesch, H.; Somkuti, P.; Palmer, P.; Feng, L.; Bergamaschi, P.; Chevallier, F. Assessing 5 years of GOSAT Proxy XCH4 data and associated uncertainties. Atmos. Meas. Tech. Discuss. 2015, 8, 5937–5972. [Google Scholar] [CrossRef]
- Kikuchi, N.; Yoshida, Y.; Uchino, O.; Morino, I.; Yokota, T. An advanced retrieval algorithm for greenhouse gases using polarization information measured by GOSAT TANSO-FTS SWIR I: Simulation study. J. Geophys. Res. Atmos. 2016, 121. [Google Scholar] [CrossRef]
- Morino, I.; Uchino, O.; Inoue, M.; Yoshida, Y.; Yokota, T.; Wennberg, P.O.; Toon, G.C.; Wunch, D.; Roehl, C.M.; Notholt, J.; et al. Preliminary validation of column-averaged volume mixing ratios of carbon dioxide and methane retrieved from GOSAT short-wavelength infrared spectra. Atmos. Meas. Tech. 2011, 4, 1061–1076. [Google Scholar] [CrossRef]
- Wunch, D.; Wennberg, P.O.; Toon, G.C.; Connor, B.J. A method for evaluating bias in global measurements of CO2 total columns from space. Atmos. Chem. Phys. Discuss. 2011, 11, 12317–12337. [Google Scholar] [CrossRef]
- O’Dell, C.W.; Connor, B.; Bösch, H.; O’Brien, D.; Frankenberg, C.; Castano, R.; Christi, M.; Eldering, D.; Fisher, B.; Gunson, M.; et al. The ACOS CO2 retrieval algorithm—Part 1: Description and validation against synthetic observations. Atmos. Meas. Tech. 2012, 5, 99–121. [Google Scholar] [CrossRef]
- Cogan, A.J.; Boesch, H.; Parker, R.J.; Feng, L.; Palmer, P.I.; Blavier, J.F.L.; Deutscher, N.M.; Macatangay, R.; Notholt, J.; Roehl, C.; et al. Atmospheric carbon dioxide retrieved from The Greenhouse gases Observing Satellite (GOSAT): Comparison with ground-based TCCON observations and GEOS-Chem model calculations. J. Geophys. Res. Atmos. 2012, 117. [Google Scholar] [CrossRef]
- Crisp, D.; Fisher, B.M.; O’Dell, C.; Frankenberg, C.; Basilio, R.; Bösch, H.; Brown, L.R.; Castano, R.; Connor, B.; Deutscher, N.M.; et al. The ACOS CO2 retrieval algorithm—Part II: Global XCO2 data characterization. Atmos. Meas. Tech. 2012, 5, 687–707. [Google Scholar] [CrossRef]
- Yoshida, Y.; Kikuchi, N.; Morino, I.; Uchino, O. Improvement of the retrieval algorithm for GOSAT SWIR XCO2 and XCH4 and their validation using TCCON data. Atmos. Meas. Tech. 2013, 6, 1533–1547. [Google Scholar] [CrossRef]
- Jiang, H. Comparison analysis of the global carbon dioxide concentration column derived from SCIAMACHY, AIRS, and GOSAT with surface station measurements. Int. J. Remote Sens. 2015, 36, 1406–1423. [Google Scholar]
- Zhou, M.; Dils, B.; Wang, P.; Detmers, R.G.; Yoshida, Y.; O’Dell, C.W.; Feist, D.G.; Velazco, V.; Schneider, M.; De Mazière, M. Validation of TANSO-FTS/GOSAT XCO2 and XCH4 glint mode retrievals using TCCON data from near-ocean sites. Atmos. Meas. Tech. 2016, 9, 1415–1430. [Google Scholar] [CrossRef]
- Jiang, X.; Crisp, D.; Olsen, E.T.; Kulawik, S.S.; Miller, C.E.; Pagano, T.S.; Liang, M.; Yung, Y.L. CO2 annual and semiannual cycles from multiple satellite retrievals and models. Earth Space Sci. 2016, 3, 78–87. [Google Scholar] [CrossRef]
- Bovensmann, H.; Burrows, J.P.; Buchwitz, M.; Frerick, J.; Noel, S.; Rozanov, V.; Chance, K.; Goede, A.P.H. SCIAMACHY: Mission objectives and measurement modes. J. Atmos. Sci. 1999, 56, 125–150. [Google Scholar] [CrossRef]
- Buchwitz, M.; Schneising, O.; Burrows, J.P.; Bovensmann, H.; Notholt, J. First direct observation of the atmospheric CO2 year-to-year increase from space. Atmos. Chem. Phys. 2007, 7, 4249–4256. [Google Scholar] [CrossRef]
- Yokota, T.; Yoshida, Y.; Eguchi, N.; Ota, Y.; Tanaka, T.; Watanabe, H.; Maksyutov, S. Global concentrations of CO2 and CH4 retrieved from GOSAT: First preliminary results. Sci. Online Lett. Atmos. Sola 2009, 5, 160–163. [Google Scholar] [CrossRef]
- Rayner, P.; O’Brien, D. The utility of remotely sensed CO2 concentration data in surface source inversions. Geophys. Res. Lett. 2001, 28, 175–178. [Google Scholar] [CrossRef]
- Frankenberg, C.; Pollock, R.; Lee, R.A.M.; Rosenberg, R.; Blavier, J.F.; Crisp, D.; O’Dell, C.W.; Osterman, G.B.; Roehl, C.; Wennberg, P.O. The Orbiting Carbon Observatory (OCO-2): Spectrometer performance evaluation using pre-launch direct sun measurements. Atmos. Meas. Tech. 2015, 7, 301–313. [Google Scholar] [CrossRef]
- Eldering, A.; O’Dell, C.W.; Wennberg, P.O.; Crisp, D.; Gunson, M.R.; Viatte, C.; Avis, C.; Braverman, A.; Castano, R.; Chang, A.; et al. The Orbiting Carbon Observatory-2: First 18 months of science data products. Atmos. Meas. Tech. 2017, 10, 549–563. [Google Scholar] [CrossRef]
- Wunch, D.; Wennberg, P.O.; Osterman, G.; Fisher, B.; Naylor, B.; Roehl, C.M.; O’Dell, C.; Mandrake, L.; Viatte, C.; et al. Comparisons of the Orbiting Carbon Observatory-2 (OCO-2) XCO2 measurements with TCCON. Atmos. Meas. Tech. Discuss. 2017, 10, 2209–2238. [Google Scholar] [CrossRef]
- Kort, E.A.; Patra, P.K.; Ishijima, K.; Daube, B.C.; Jiménez, R.; Elkins, J.; Hurst, D.; Moore, F.L.; Sweeney, C.; Wofsy, S.C. Tropospheric distribution and variability of N2O: Evidence for strong tropical emissions. Geophys. Res. Lett. 2011, 38, L15806. [Google Scholar] [CrossRef]
- Turner, A.J.; Jacob, D.J.; Wecht, K.J.; Maasakkers, J.D.; Lundgren, E.; Andrews, A.E.; Biraud, S.C.; Boesch, H.; Bowman, K.W.; Deutscher, N.M. Estimating global and north american methane emissions with high spatial resolution using GOSAT satellite data. Atmos. Chem. Phys. 2015, 15, 4495–4536. [Google Scholar] [CrossRef]
- Liang, A.; Han, G.; Gong, W.; Yang, J.; Xiang, C. Comparison of global XCO2 concentrations from OCO-2 with TCCON data in terms of latitude zones. IEEE J. Sel. Top. Appl. Earth Obs. Remote Sens. 2017, 10, 2491–2498. [Google Scholar] [CrossRef]
- Wunch, D.; Toon, G.C.; Blavier, J.-F.L.; Washenfelder, R.A.; Notholt, J.; Connor, B.J.; Griffith, D.W.T.; Sherlock, V.; Wennberg, P.O. The total carbon column observing network. Philos. Trans. R. Soc. Lond. A Math. Phys. Eng. Sci. 2011, 369, 2087–2112. [Google Scholar] [CrossRef] [PubMed]
- Feist, D.G.; Arnold, S.G.; John, N.; Geibel, M.C. TCCON Data from Ascension Island, Saint Helena, Ascension and Tristan da Cunha, Release ggg2014r0. TCCON Data Archive, Hosted by the Carbon Dioxide Information Analysis Center, Oak Ridge National Laboratory, Oak Ridge, TN, USA. 2014. Available online: http://dx.doi.org/10.14291/tccon.ggg2014.ascension01.R0/1149285 (accessed on 1 April 2017).
- Deutscher, N.; Notholt, J.; Messerschmidt, J.; Weinzierl, C.; Warneke, T.; Petri, C.; Grupe, P.; Katrynski, K. TCCON Data from Bialystok, Poland, Release ggg2014r1. TCCON Data Archive, Hosted by the Carbon Dioxide Information Analysis Center, Oak Ridge National Laboratory, Oak Ridge, TN, USA. 2014. Available online: http://dx.doi.org/10.14291/tccon.ggg2014.bialystok01.R1/1183984 (accessed on 1 April 2017).
- Notholt, J.; Petri, C.; Warneke, T.; Deutscher, N.; Buschmann, M.; Weinzierl, C.; Macatangay, R.; Grupe, P. TCCON Data from Bremen, Germany, Release ggg2014r0. TCCON Data Archive, Hosted by the Carbon Dioxide Information Analysis Center, Oak Ridge National Laboratory, Oak Ridge, TN, USA. 2014. Available online: http://dx.doi.org/10.14291/tccon.ggg2014.bremen01.R0/1149275 (accessed on 1 April 2017).
- Wennberg, P.O.; Wunch, D.; Roehl, C.; Blavier, J.-F.L.; Toon, G.C.; Allen, N. TCCON Data from California Institute of Technology, Pasadena, CA, USA, Release ggg2014r1. TCCON Data Archive, Hosted by the Carbon Dioxide Information Analysis Center, Oak Ridge National Laboratory, Oak Ridge, TN, USA. 2014. Available online: http://dx.doi.org/10.14291/tccon.ggg2014.pasadena01.R1/1182415 (accessed on 1 April 2017).
- Griffith, D.W.T.; Deutscher, N.; Velazco, V.A.; Wennberg, P.O.; Yavin, Y.; Aleks, G.K.; Washenfelder, R.; Toon, G.C.; Blavier, J.F.; Murphy, C.; et al. TCCON Data from Darwin, Australia, Release ggg2014r0. TCCON Data Archive, Hosted by the Carbon Dioxide Information Analysis Center, Oak Ridge National Laboratory, Oak Ridge, TN, USA. 2014. Available online: http://dx.doi.org/10.14291/tccon.ggg2014.darwin01.R0/1149290 (accessed on 1 April 2017).
- Iraci, L.; Podolske, J.; Hillyard, P.; Roehl, C.; Wennberg, P.O.; Blavier, J.F.; Landeros, J.; Allen, N.; Wunch, D.; Zavaleta, J.; et al. TCCON Data from Armstrong Flight Research Center, Edwards, ca, USA, Release ggg2014r0. TCCON Data Archive, Hosted by the Carbon Dioxide Information Analysis Center, Oak Ridge National Laboratory, Oak Ridge, TN, USA. 2014. Available online: http://dx.doi.org/10.14291/tccon.ggg2014.edwards01.R1/1255068 (accessed on 1 April 2017).
- Strong, K.; Mendonca, J.; Weaver, D.; Fogal, P.; Drummond, J.R.; Batchelor, R.; Lindenmaier, R. TCCON Data from Eureka, Canada, Release ggg2014r0. TCCON Data Archive, Hosted by the Carbon Dioxide Information Analysis Center, Oak Ridge National Laboratory, Oak Ridge, TN, USA. 2014. Available online: http://dx.doi.org/10.14291/tccon.ggg2014.eureka01.R0/1149271 (accessed on 1 April 2017).
- Dubey, M.; Lindenmaier, R.; Henderson, B.; Green, D.; Allen, N.; Roehl, C.; Blavier, J.F.; Butterfield, Z.; Love, S.; Hamelmann, J.; et al. TCCON Data from Four Corners, nm, USA, Release ggg2014r0. TCCON Data Archive, Hosted by the Carbon Dioxide Information Analysis Center, Oak Ridge National Laboratory, Oak Ridge, TN, USA. 2014. Available online: http://dx.doi.org/10.14291/tccon.ggg2014.fourcorners01.R0/1149272 (accessed on 1 April 2017).
- Sussmann, R.; Rettinger, M. TCCON Data from Garmisch, Germany, Release ggg2014r0. TCCON Data Archive, Hosted by the Carbon Dioxide Information Analysis Center, Oak Ridge National Laboratory, Oak Ridge, TN, USA. 2014. Available online: http://dx.doi.org/10.14291/tccon.ggg2014.garmisch01.R0/1149299 (accessed on 1 April 2017).
- Iraci, L.; Podolske, J.; Hillyard, P.; Roehl, C.; Wennberg, P.O.; Blavier, J.F.; Landeros, J.; Allen, N.; Wunch, D.; Zavaleta, J.; et al. TCCON Data from Indianapolis, Indiana, USA, Release ggg2014r0. TCCON Data Archive, Hosted by the Carbon Dioxide Information Analysis Center, Oak Ridge National Laboratory, Oak Ridge, TN, USA. 2014. Available online: http://dx.doi.org/10.14291/tccon.ggg2014.indianapolis01.R0/1149164 (accessed on 1 April 2017).
- Blumenstock, T.; Hase, F.; Schneider, M.; Garcia, O.E.; Sepulveda, E. TCCON data from izana, tenerife, spain, release ggg2014r0. TCCON Data Archive, Hosted by the Carbon Dioxide Information Analysis Center, Oak Ridge National Laboratory, Oak Ridge, TN, USA. 2014. Available online: http://dx.doi.org/10.14291/tccon.ggg2014.izana01.R0/1149295 (accessed on 1 April 2017).
- Wennberg, P.O.; Roehl, C.; Blavier, J.F.; Wunch, D.; Landeros, J.; Allen, N. TCCON Data from jet Propulsion laboratory, pasadena, california, USA, release ggg2014r0. TCCON Data Archive, Hosted by the Carbon Dioxide Information Analysis Center, Oak Ridge National Laboratory, Oak Ridge, TN, USA. 2014. Available online: http://dx.doi.org/10.14291/tccon.ggg2014.jpl02.R0/1149297 (accessed on 1 April 2017).
- Kawakami, S.; Ohyama, H.; Arai, K.; Okumura, H.; Taura, C.; Fukamachi, T.; Sakashita, M. TCCON Data from Saga, Japan, Release ggg2014r0. TCCON Data Archive, Hosted by the Carbon Dioxide Information Analysis Center, Oak Ridge National Laboratory, Oak Ridge, TN, USA. 2014. Available online: http://dx.doi.org/10.14291/tccon.ggg2014.saga01.R0/1149283 (accessed on 1 April 2017).
- Hase, F.; Blumenstock, T.; Dohe, S.; Gross, J.; Kiel, M. TCCON Data from Karlsruhe, Germany, Release ggg2014r1. TCCON Data Archive, Hosted by the Carbon Dioxide Information Analysis Center, Oak Ridge National Laboratory, Oak Ridge, TN, USA. 2014. Available online: http://dx.doi.org/10.14291/tccon.ggg2014.karlsruhe01.R1/1182416 (accessed on 1 April 2017).
- Sherlock, V.; Connor, B.; Robinson, J.; Shiona, H.; Smale, D.; Pollard, D. TCCON Data from Lauder, New Zealand, 125hr, Release ggg2014r0. TCCON Data Archive, Hosted by the Carbon Dioxide Information Analysis Center, Oak Ridge National Laboratory, Oak Ridge, TN, USA. 2014. Available online: http://dx.doi.org/10.14291/tccon.ggg2014.lauder02.R0/1149298 (accessed on 1 April 2017).
- Dubey, M.; Henderson, B.; Green, D.; Butterfield, Z.; Keppel-Aleks, G.; Allen, N.; Blavier, J.F.; Roehl, C.; Wunch, D.; Lindenmaier, R. TCCON Data from Manaus, Brazil, Release ggg2014r0. TCCON Data Archive, Hosted by the Carbon Dioxide Information Analysis Center, Oak Ridge National Laboratory, Oak Ridge, TN, USA. 2014. Available online: http://dx.doi.org/10.14291/tccon.ggg2014.manaus01.R0/1149274 (accessed on 1 April 2017).
- Wennberg, P.O.; Wunch, D.; Roehl, C.; Blavier, J.F.; Toon, G.C.; Allen, N.; Dowell, P.; Teske, K.; Martin, C.; Martin, J. TCCON Data from Lamont, Oklahoma, USA, Release ggg2014r0. TCCON Data Archive, Hosted by the Carbon Dioxide Information Analysis Center, Oak Ridge National Laboratory, Oak Ridge, TN, USA. 2014. Available online: http://dx.doi.org/10.14291/TCCON.ggg2014.lamont01.R0/1149159 (accessed on 1 April 2017).
- Warneke, T.; Messerschmidt, J.; Notholt, J.; Weinzierl, C.; Deutscher, N.; Petri, C.; Grupe, P.; Vuillemin, C.; Truong, F.; Schmidt, M.; et al. TCCON Data from Orleans, France, Release ggg2014r0. TCCON Data Archive, Hosted by the Carbon Dioxide Information Analysis Center, Oak Ridge National Laboratory, Oak Ridge, TN, USA. 2014. Available online: http://dx.doi.org/10.14291/tccon.ggg2014.orleans01.R0/1149276 (accessed on 1 April 2017).
- Wennberg, P.O.; Roehl, C.; Wunch, D.; Toon, G.C.; Blavier, J.F.; Washenfelder, R.; Keppel-Aleks, G.; Allen, N.; Ayers, J. TCCON Data from Park Falls, Wisconsin, USA, Release ggg2014r0. TCCON Data Archive, Hosted by the Carbon Dioxide Information Analysis Center, Oak Ridge National Laboratory, Oak Ridge, TN, USA. 2014. Available online: http://dx.doi.org/10.14291/tccon.ggg2014.parkfalls01.R0/1149161 (accessed on 1 April 2017).
- Te, Y.; Jeseck, P.; Janssen, C. TCCON Data from Paris, France, Release ggg2014r0. TCCON Data Archive, Hosted by the Carbon Dioxide Information Analysis Center, Oak Ridge National Laboratory, Oak Ridge, TN, USA. 2014. Available online: http://dx.doi.org/10.14291/tccon.ggg2014.paris01.R0/1149279 (accessed on 1 April 2017).
- De Maziere, M.; Sha, M.K.; Desmet, F.; Hermans, C.; Scolas, F.; Kumps, N.; Metzger, J.M.; Duflot, V.; Cammas, J.P. TCCON Data from Reunion Island (La Reunion), France, release ggg2014r0. TCCON Data Archive, Hosted by the Carbon Dioxide Information Analysis Center, Oak Ridge National Laboratory, Oak Ridge, TN, USA. 2014. Available online: http://dx.doi.org/10.14291/tccon.ggg2014.reunion01.R0/1149288 (accessed on 1 April 2017).
- Morino, I.; Yokozeki, N.; Matzuzaki, T.; Shishime, A. TCCON Data from Rikubetsu, Hokkaido, Japan, Release ggg2014r1. TCCON Data Archive, Hosted by the Carbon Dioxide Information Analysis Center, Oak Ridge National Laboratory, Oak Ridge, TN, USA. 2014. Available online: http://dx.doi.org/10.14291/tccon.ggg2014.rikubetsu01.R1/1242265 (accessed on 1 April 2017).
- Morino, I.; Matsuzaki, T.; Shishime, A. TCCON Data from Tsukuba, Ibaraki, Japan, 125hr, Release ggg2014r1. TCCON Data Archive, Hosted by the Carbon Dioxide Information Analysis Center, Oak Ridge National Laboratory, Oak Ridge, TN, USA. 2014. Available online: http://dx.doi.org/10.14291/tccon.ggg2014.tsukuba02.R1/1241486 (accessed on 1 April 2017).
- Kivi, R.; Heikkinen, P.; Kyro, E. TCCON Data from Sodankylä (fi), Release ggg2014.R0. TCCON Data Archive, Hosted by the Carbon Dioxide Information Analysis Center, Oak Ridge National Laboratory, Oak Ridge, TN, USA. 2014. Available online: http://dx.doi.org/10.14291/tccon.ggg2014.sodankyla01.R0/1149280 (accessed on 1 April 2017).
- Kivi, R.; Heikkinen, P. Fourier transform spectrometer measurements of column CO2 at Sodankylä, Finland. Geosci. Instrum. Method. Data Syst. 2016, 5, 271–279. [Google Scholar] [CrossRef]
- Griffith, D.W.T.; Velazco, V.A.; Deutscher, N.; Murphy, C.; Jones, N.; Wilson, S.; Macatangay, R.; Kettlewell, G.; Buchholz, R.R.; Riggenbach, M. TCCON Data from Wollongong, Australia, Release ggg2014r0. TCCON Data Archive, Hosted by the Carbon Dioxide Information Analysis Center, Oak Ridge National Laboratory, Oak Ridge, TN, USA. 2014. Available online: http://dx.doi.org/10.14291/tccon.ggg2014.wollongong01.R0/1149291 (accessed on 1 April 2017).
- Rodgers, C.D.; Connor, B.J. Intercomparison of Remote Sounding Instruments; Wiley: New York, NY, USA, 2003; pp. 1–40. [Google Scholar]
- Inoue, M.; Morino, I.; Uchino, O.; Miyamoto, Y. Validation of XCO2 derived from swir spectra of GOSAT TANSO-FTS with aircraft measurement data. Atmos. Chem. Phys. 2014, 13, 9771–9788. [Google Scholar] [CrossRef]
- Gurney, K.R.; Romero-Lankao, P.; Seto, K.C.; Hutyra, L.R.; Duren, R.; Kennedy, C.; Grimm, N.B.; Ehleringer, J.R.; Marcotullio, P.; Hughes, S.; et al. Climate change: Track urban emissions on a human scale. Nature 2015, 525, 179. [Google Scholar] [CrossRef] [PubMed]
Figure 1.
The scatters in this figure show the effect of the chice of a priori profile and the effect of smoothing by the averagein kernels for data measured by OCO-2 over each TCCON site shown by different colors.
Figure 1.
The scatters in this figure show the effect of the chice of a priori profile and the effect of smoothing by the averagein kernels for data measured by OCO-2 over each TCCON site shown by different colors.
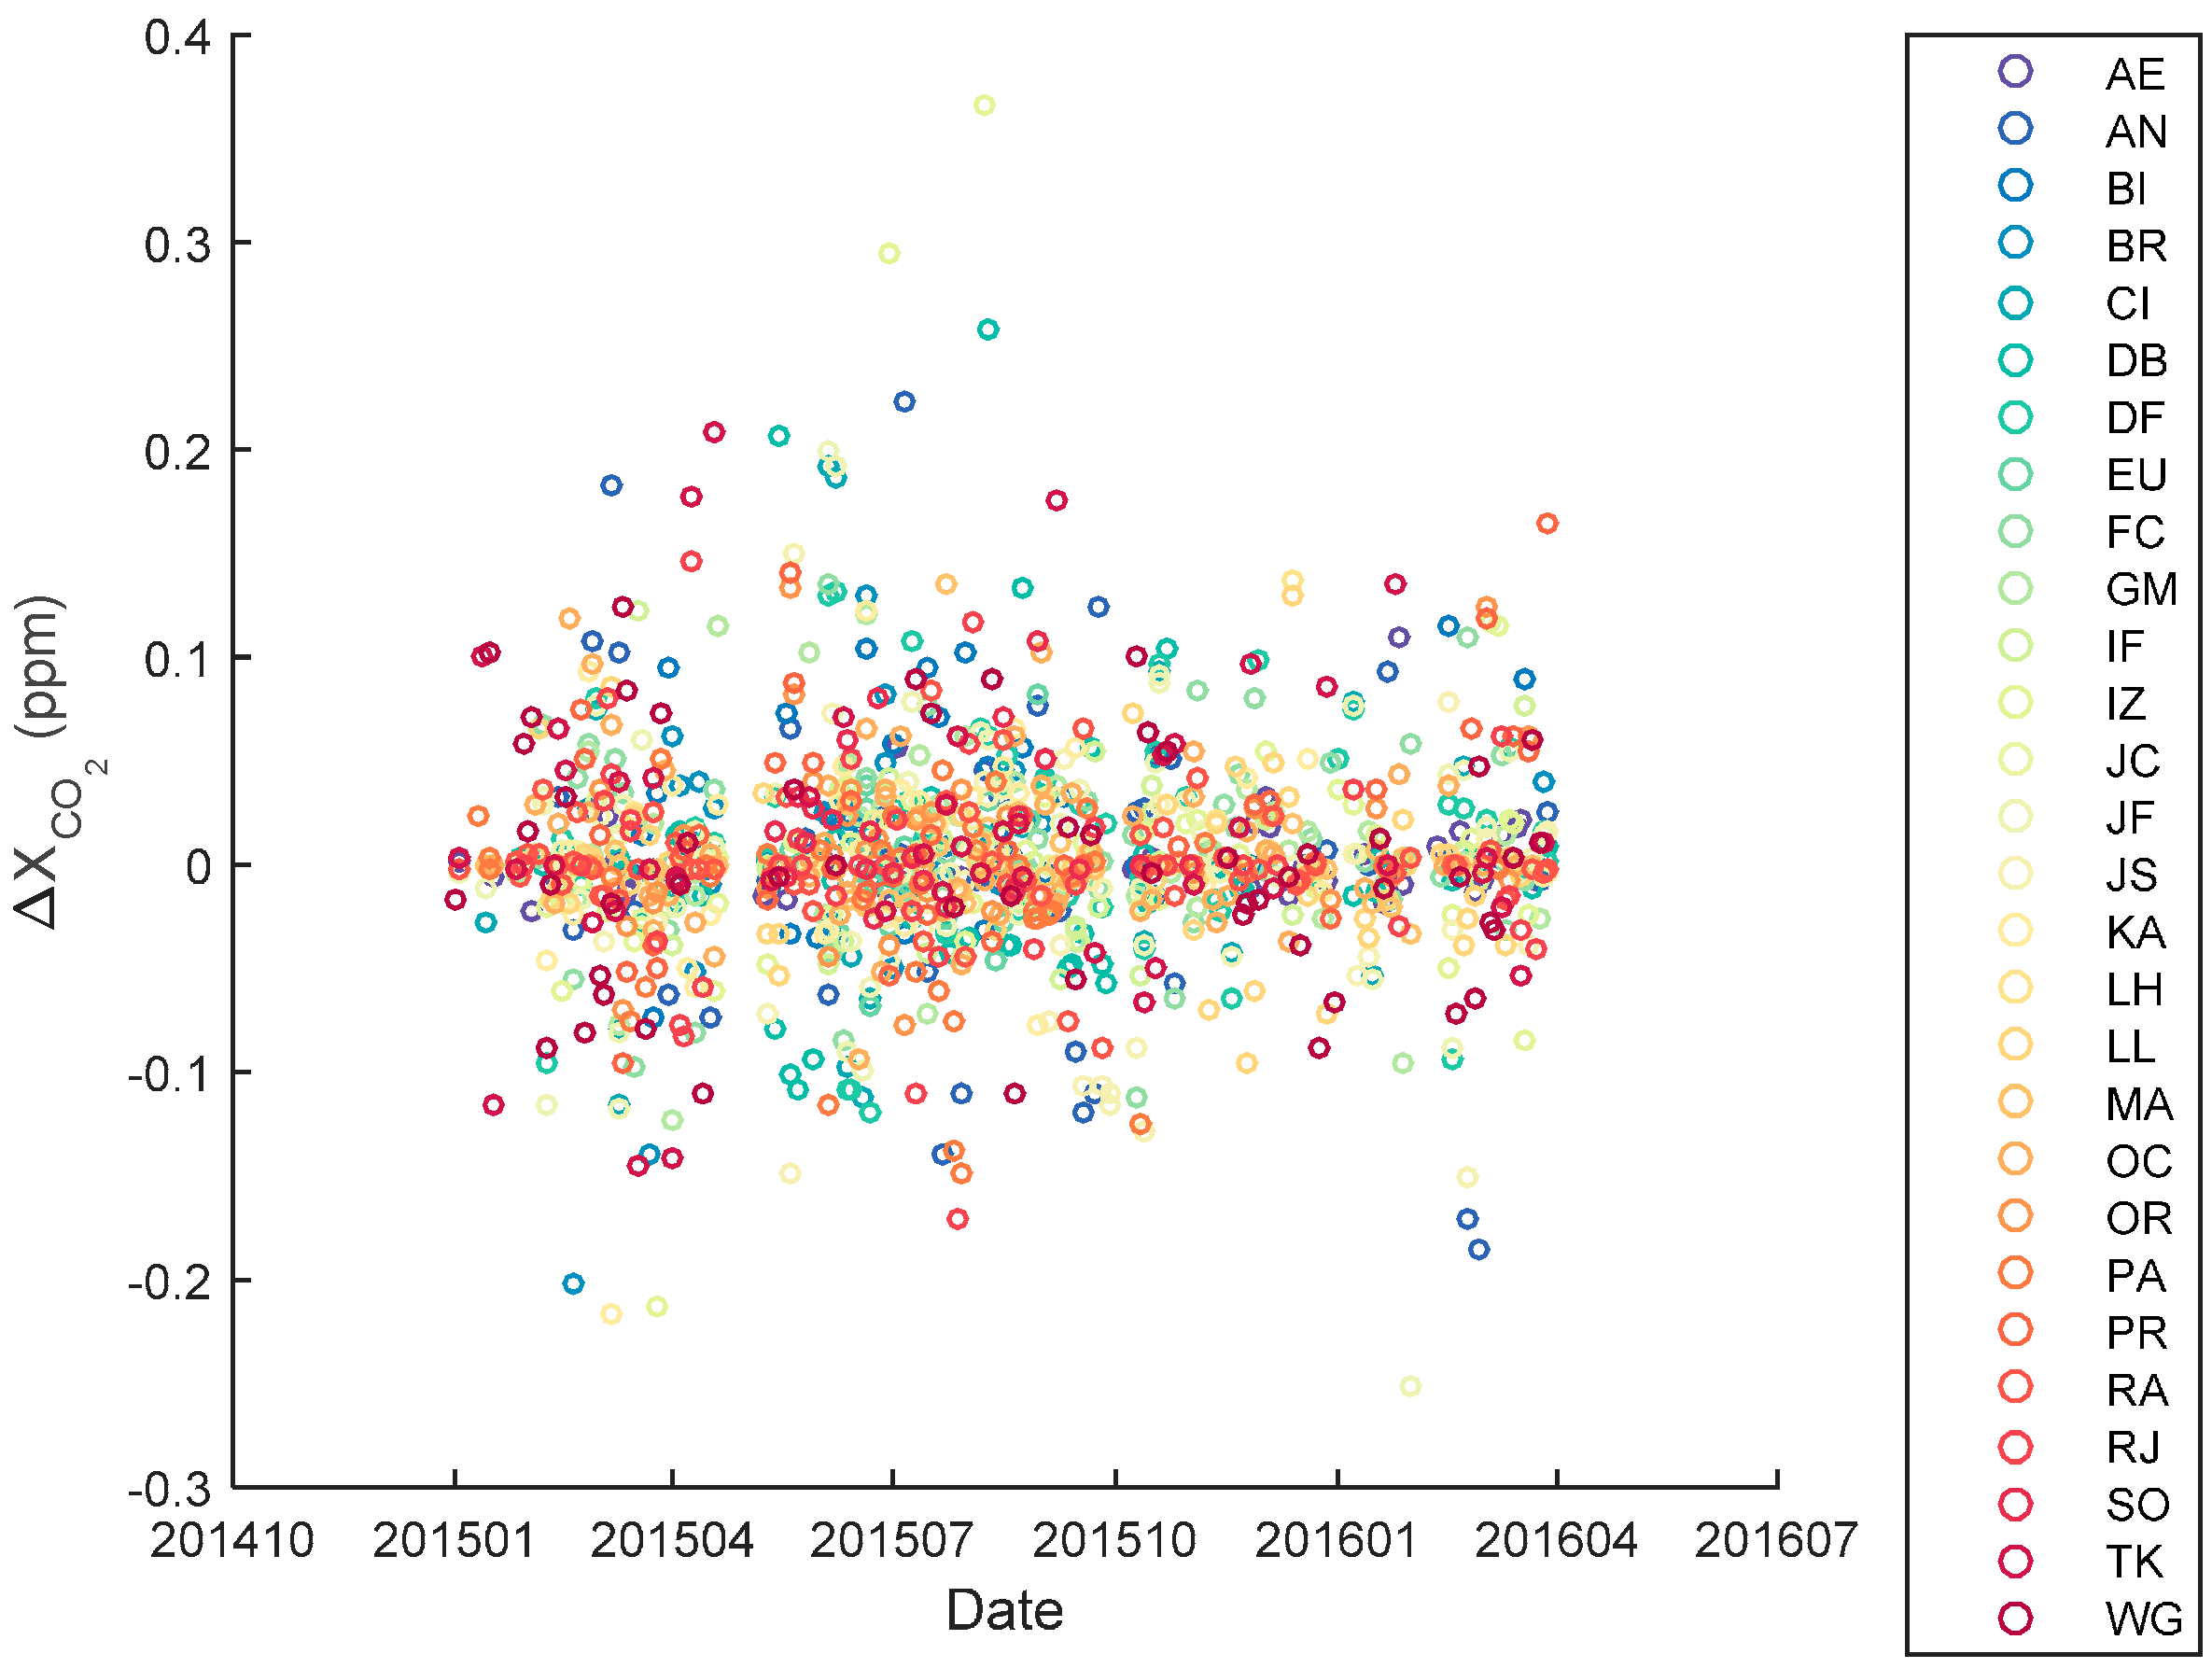
Figure 2.
The bars in this figure show the effect of the chice of a priori profile and the effect of smoothing by the averagein kernels for data measured by OCO-2 over each TCCON site shown by different colors. The statistics in each bar include the minimum, median, mean, maximum, the 1st and 5th percentiles, and 95th and 99th percentiles.
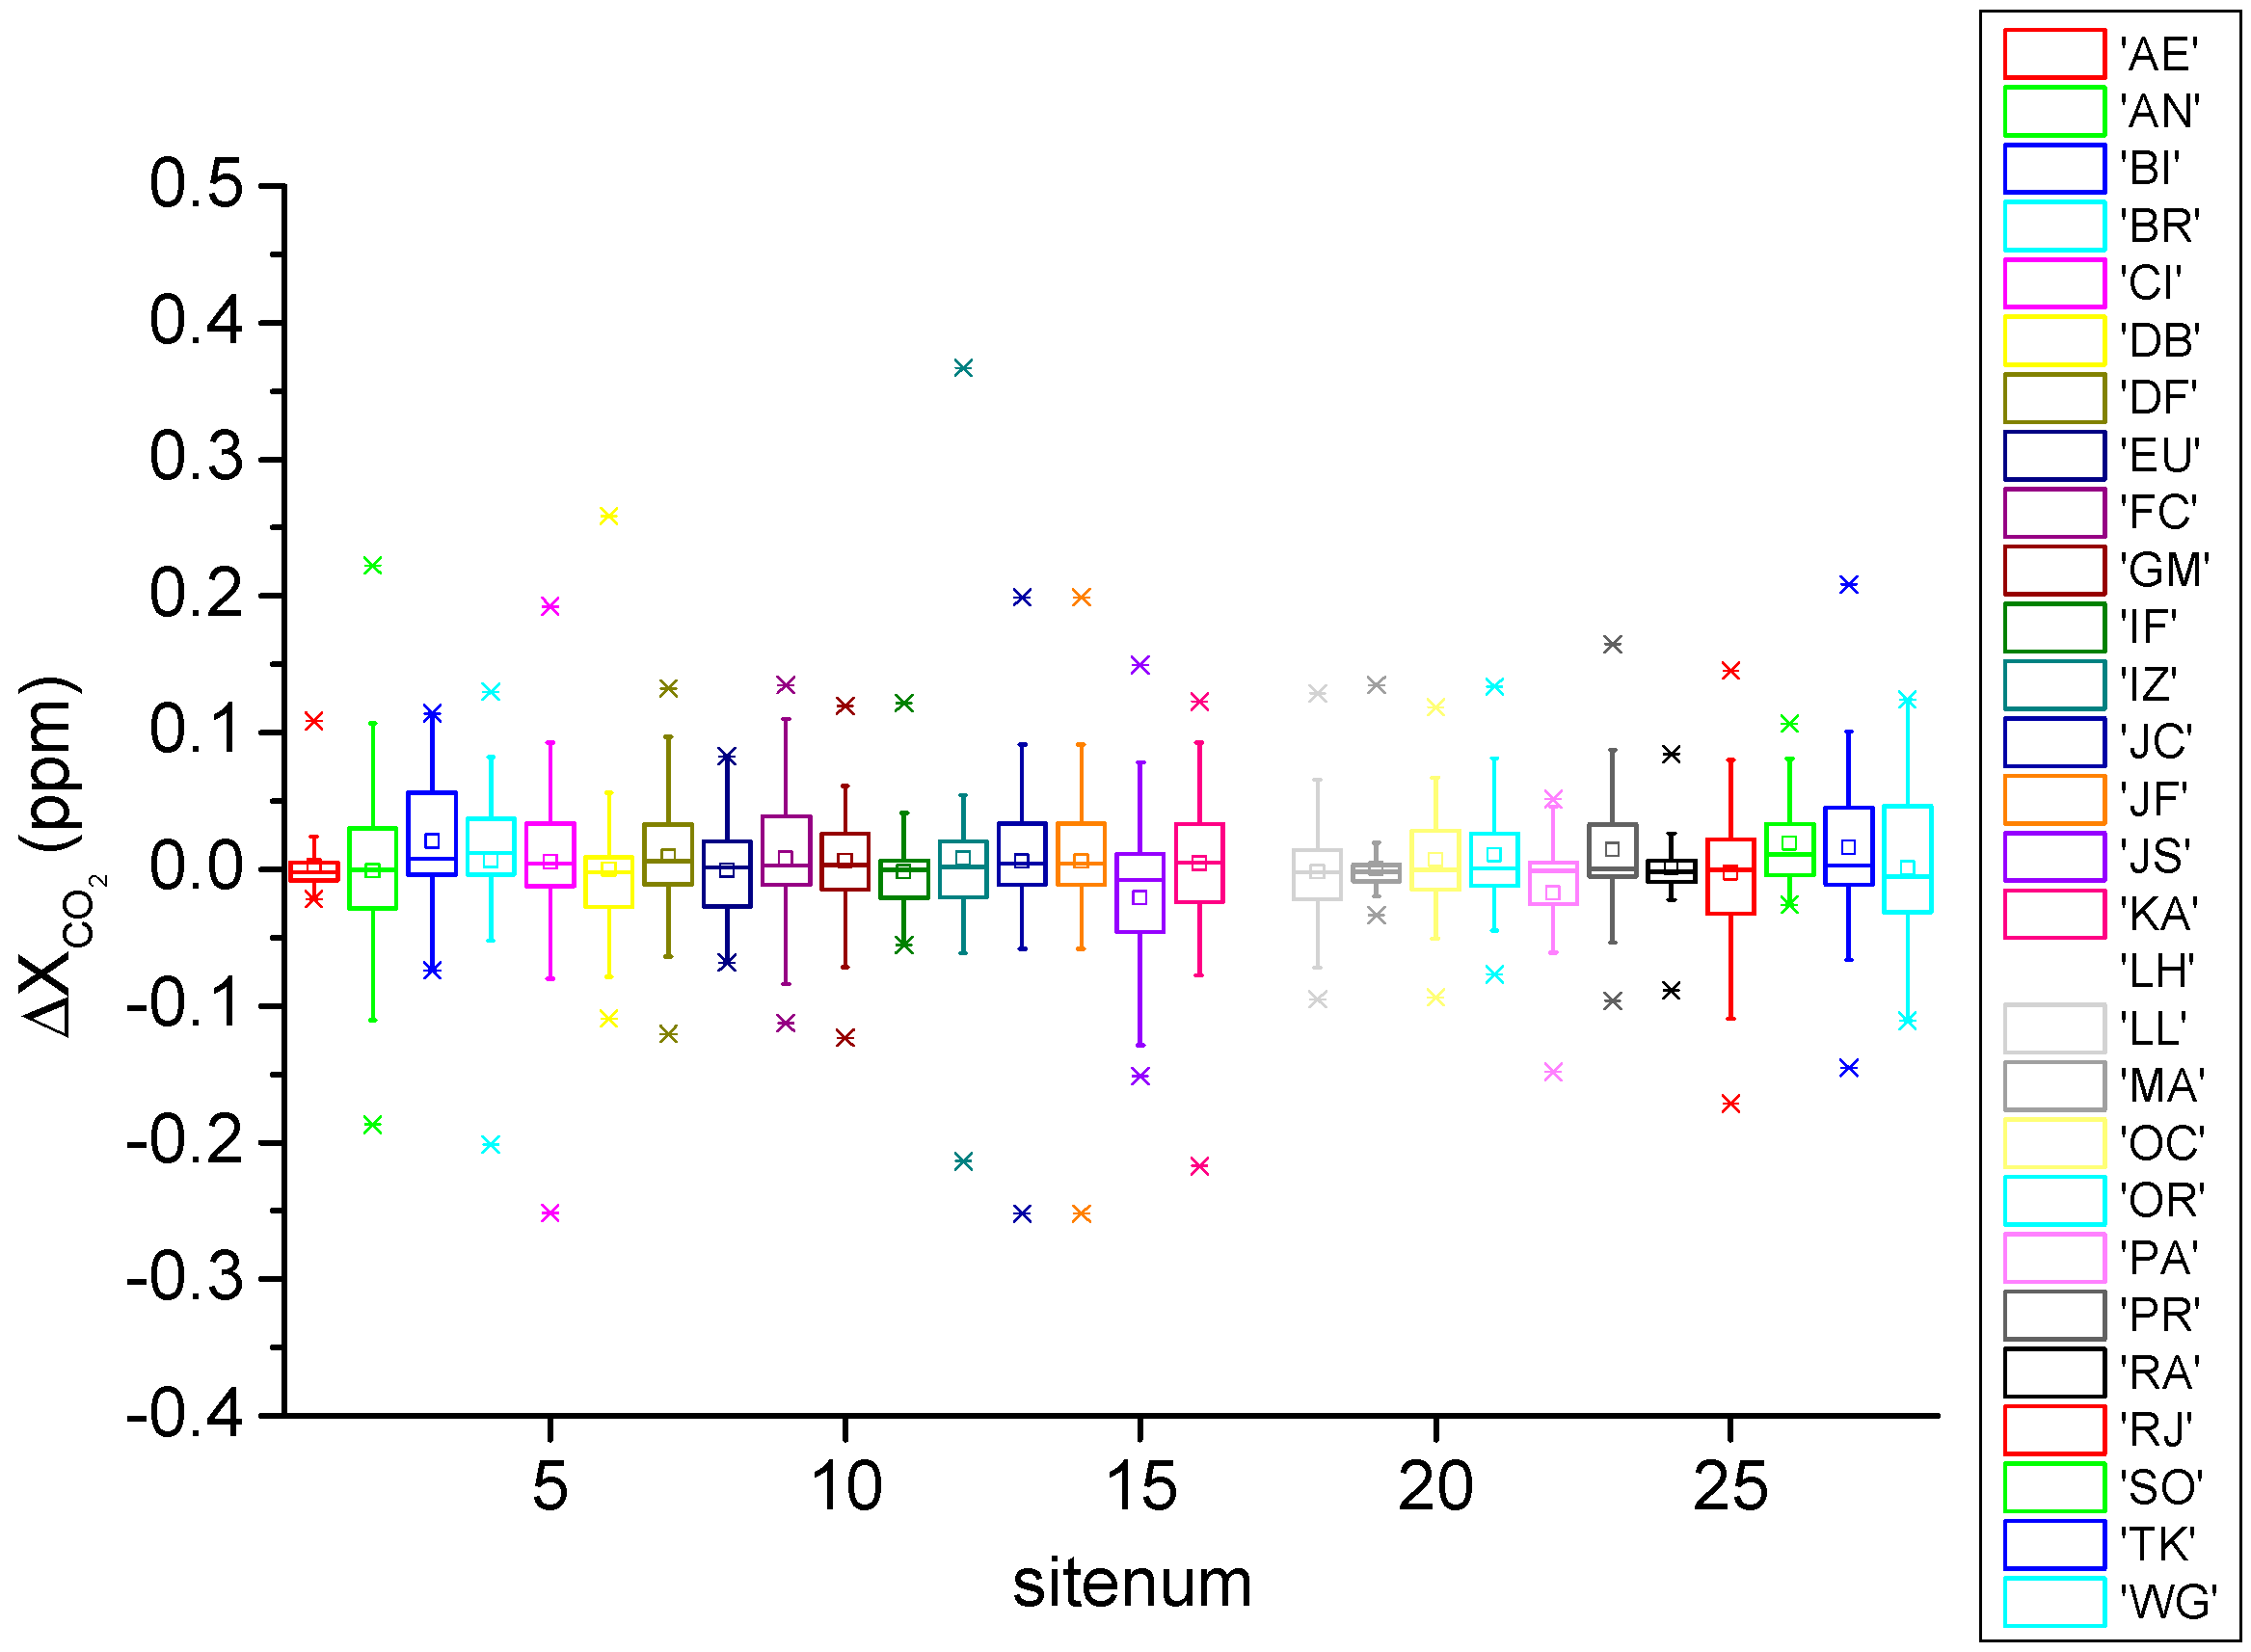
Figure 3.
Comparison of spatial coverage of resampled monthly XCO2 of OCO-2 and GOSAT (2.5 × 2.5 degrees of grid as a unit) from September 2014 to March 2017. The red lines represent the coverage of XCO2 measurements from OCO-2 Lite File Product. The blue lines represent the coverage of XCO2 measurements from GOSAT Level 3. The black lines represent the coverage of XCO2 measurements from GOSAT Level 2. The coverage of XCO2 measurements was calculated in three spatial area, respectively in globe, land, and ocean, as shown in three kinds of symbol.

Figure 4.
Comparison of XCO2 measurements of OCO-2 since September 2014 with TCCON data for a long observation in terms of six latitude zones, 75°N–85°N, 60°N–70°N, 45°N–55°N, 30°N–40°N, 20°S–0°, 60°S–30°S and four observation modes, land nadir, land glint, land target, and sea glint.
Figure 4.
Comparison of XCO2 measurements of OCO-2 since September 2014 with TCCON data for a long observation in terms of six latitude zones, 75°N–85°N, 60°N–70°N, 45°N–55°N, 30°N–40°N, 20°S–0°, 60°S–30°S and four observation modes, land nadir, land glint, land target, and sea glint.
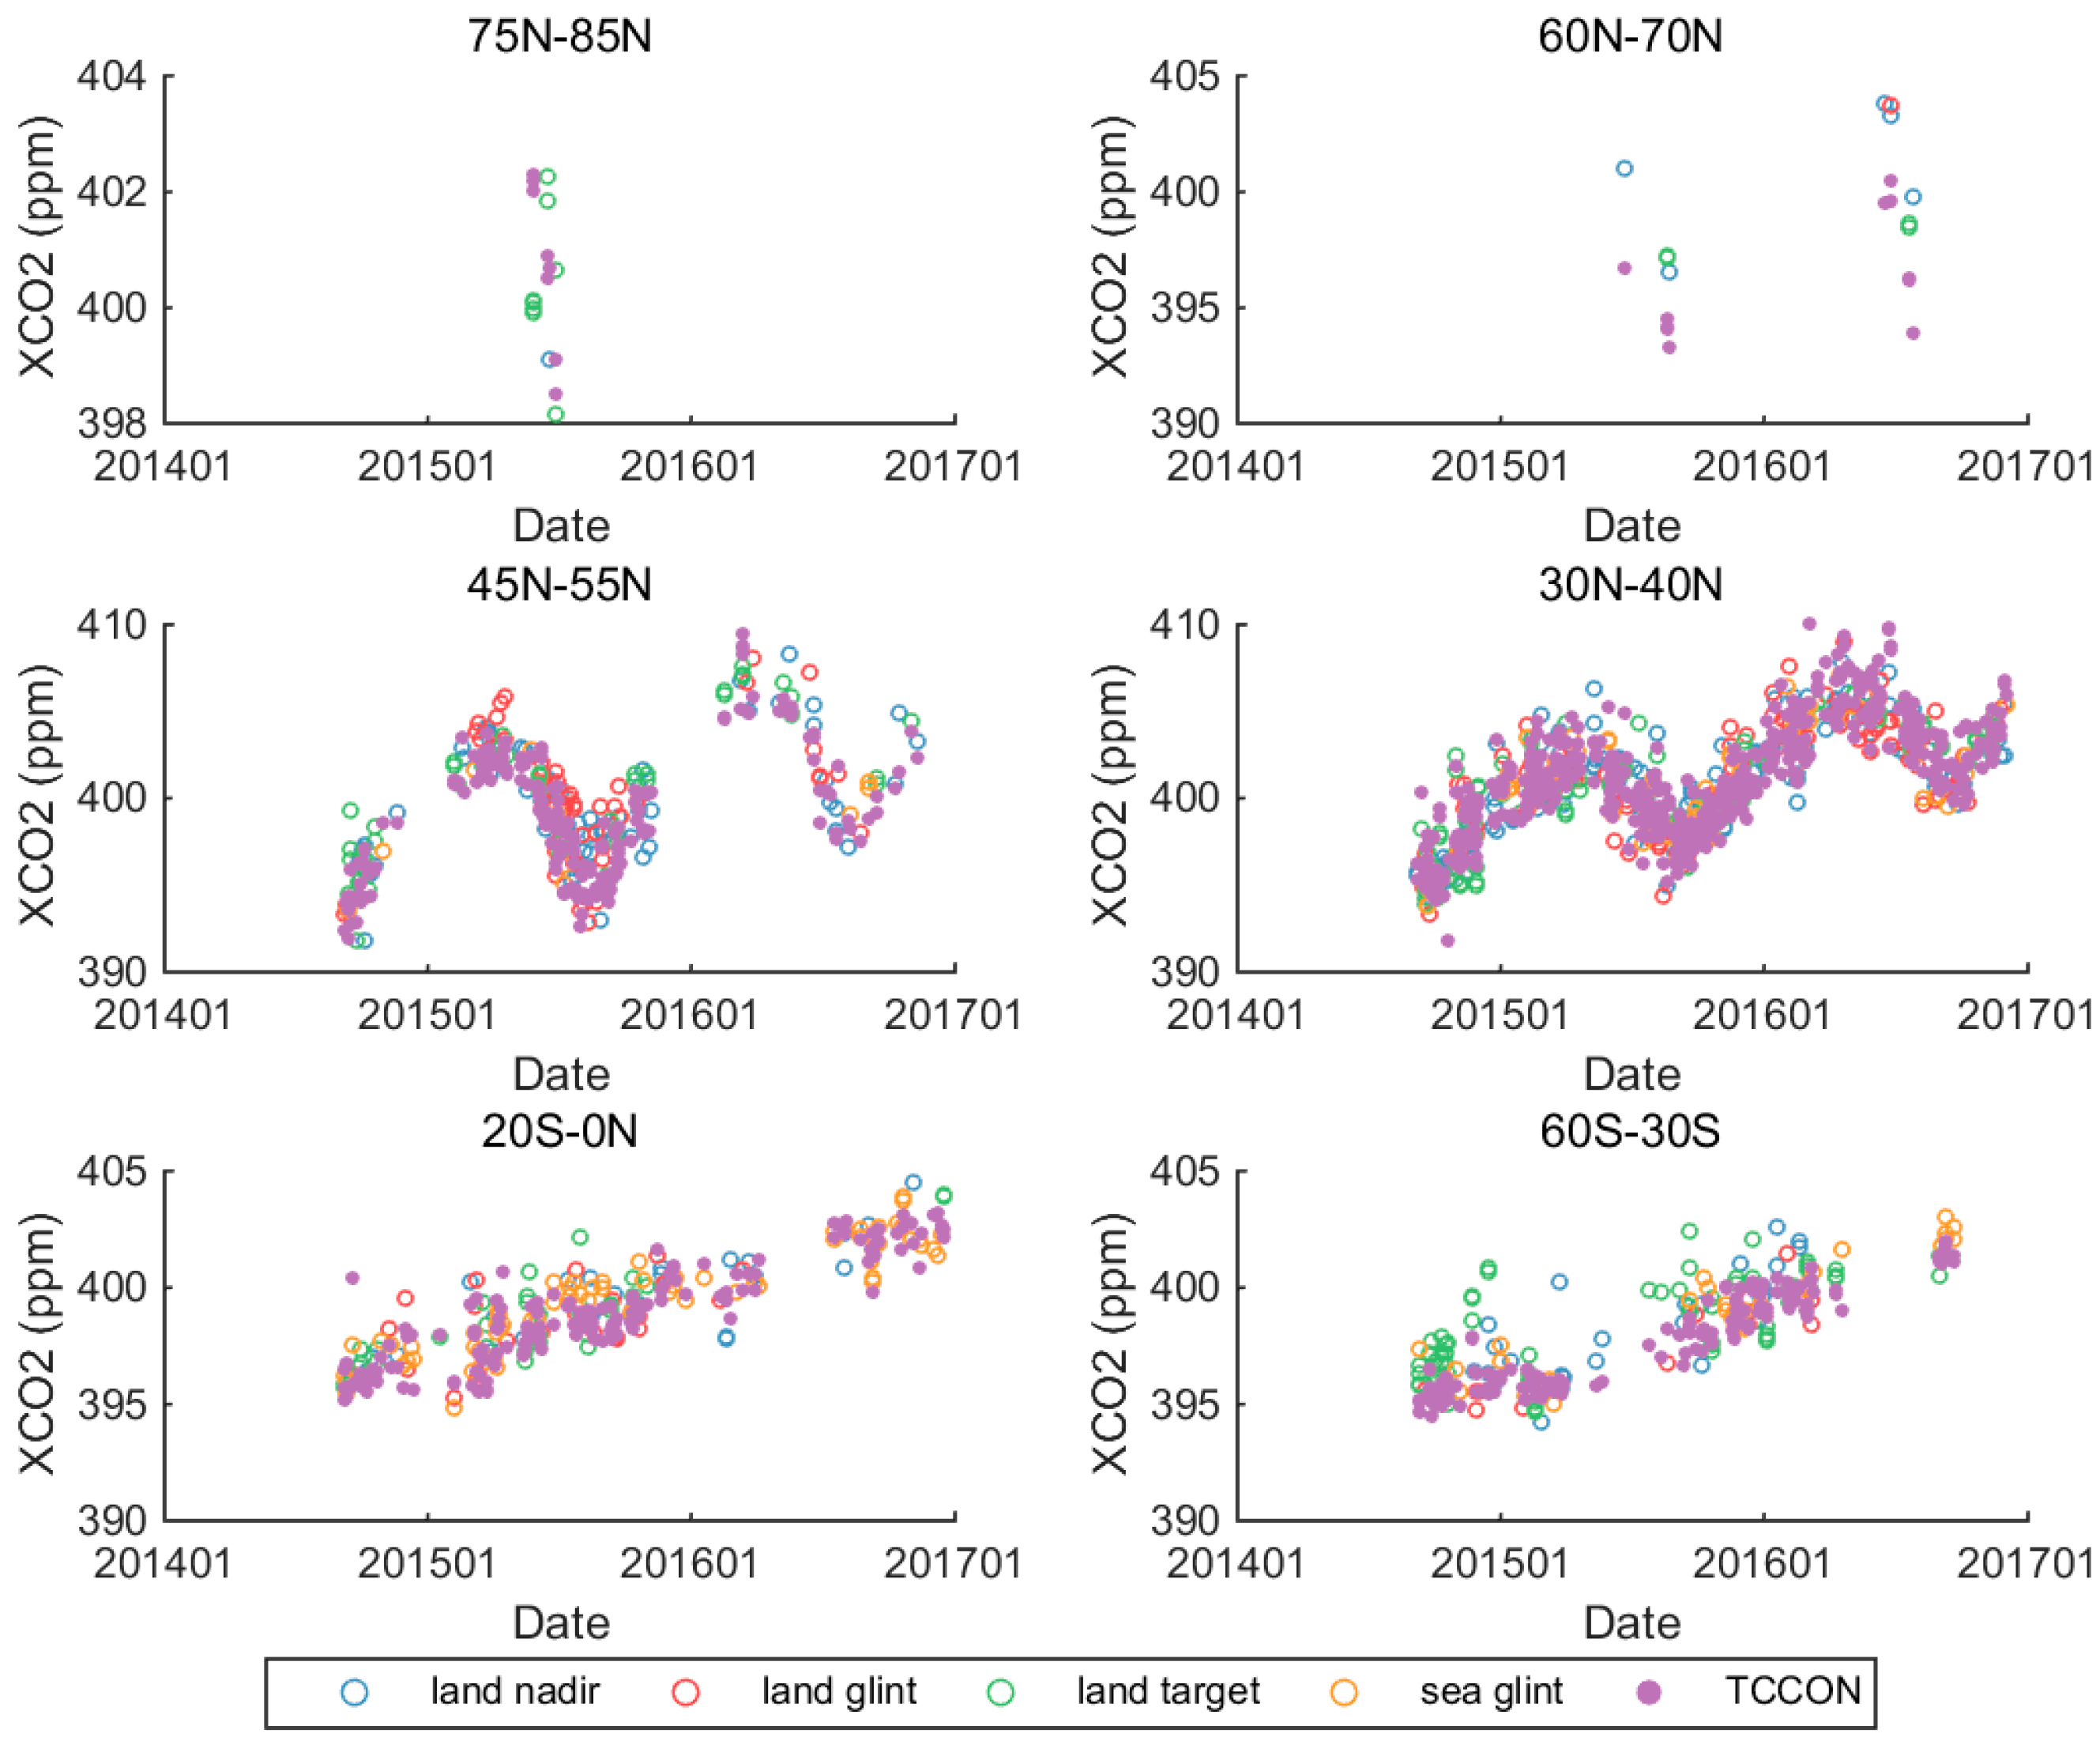
Figure 5.
Comparison of XCO2 measurements of GOSAT since September 2014 with TCCON data for a long observation in terms of six latitude zones, 75°N–85°N, 60°N–70°N, 45°N–55°N, 30°N–40°N, 20°S–0°, 60°S–30°S and two observation modes, OB1D and SPOD.
Figure 5.
Comparison of XCO2 measurements of GOSAT since September 2014 with TCCON data for a long observation in terms of six latitude zones, 75°N–85°N, 60°N–70°N, 45°N–55°N, 30°N–40°N, 20°S–0°, 60°S–30°S and two observation modes, OB1D and SPOD.
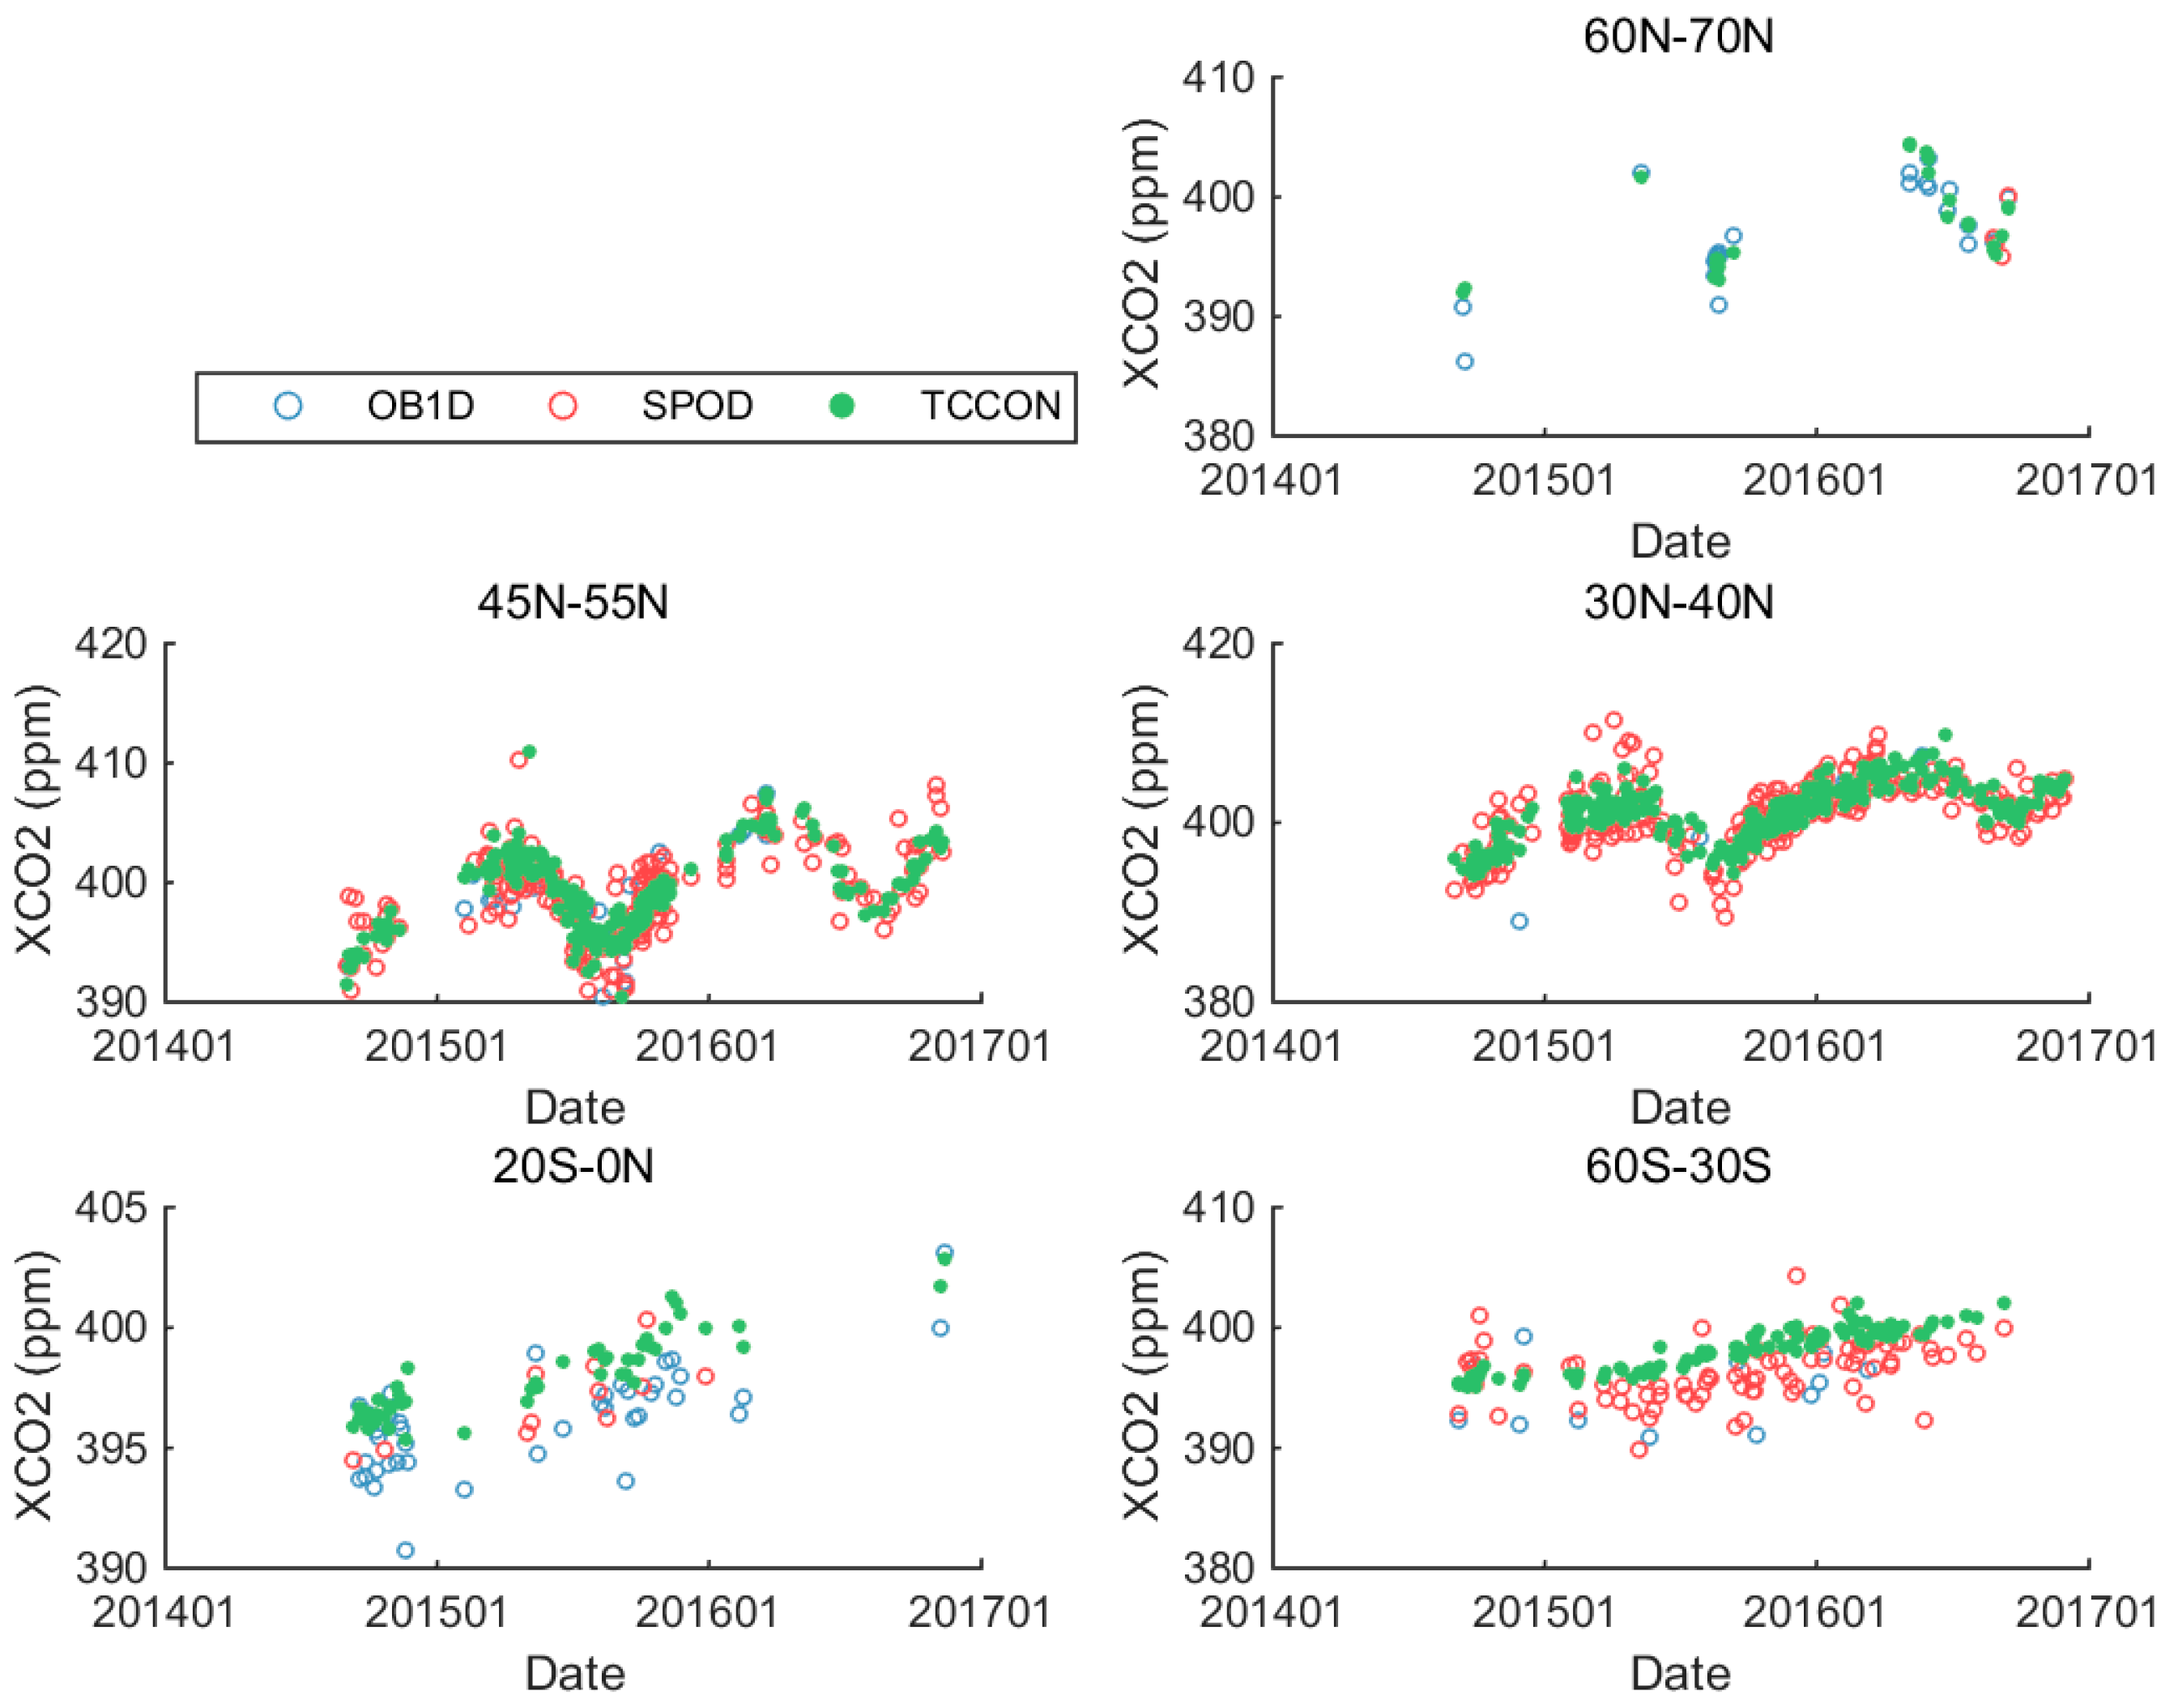
Figure 6.
Comparison of XCO2 measurements of OCO-2 and GOSAT since September 2014 with TCCON data for a long observation in terms of six latitude zones, 75°N–85°N, 60°N–70°N, 45°N–55°N, 30°N–40°N, 20°S–0°, 60°S–30°S.
Figure 6.
Comparison of XCO2 measurements of OCO-2 and GOSAT since September 2014 with TCCON data for a long observation in terms of six latitude zones, 75°N–85°N, 60°N–70°N, 45°N–55°N, 30°N–40°N, 20°S–0°, 60°S–30°S.

Figure 7.
Comparison of XCO2 spatial distribution in January, April, July and October 2016. The yellow grids indicated there was no data of GOSAT but existed data of OCO-2. The green grids indicated there was no data of OCO-2 but existed data of GOSAT. The gray grids indicated there existed data of GOSAT and OCO-2. The blue grids indicated there was no data of GOSAT and OCO-2.

Figure 8.
Difference of XCO2 measurements between OCO-2 and GOSAT in January, April, July and October 2016. The colorbars represent the degree of the difference. Red grids indicated the XCO2 measurements of OCO-2 were higher than that of GOSAT. Blue grids indicated the XCO2 measurements of OCO-2 were lower than that of GOSAT.

Figure 9.
Mean XCO2 distribution of GOSAT in latitudes in each month since September 2014.

Figure 10.
Mean XCO2 distribution of OCO-2 in latitudes in each month since September 2014.
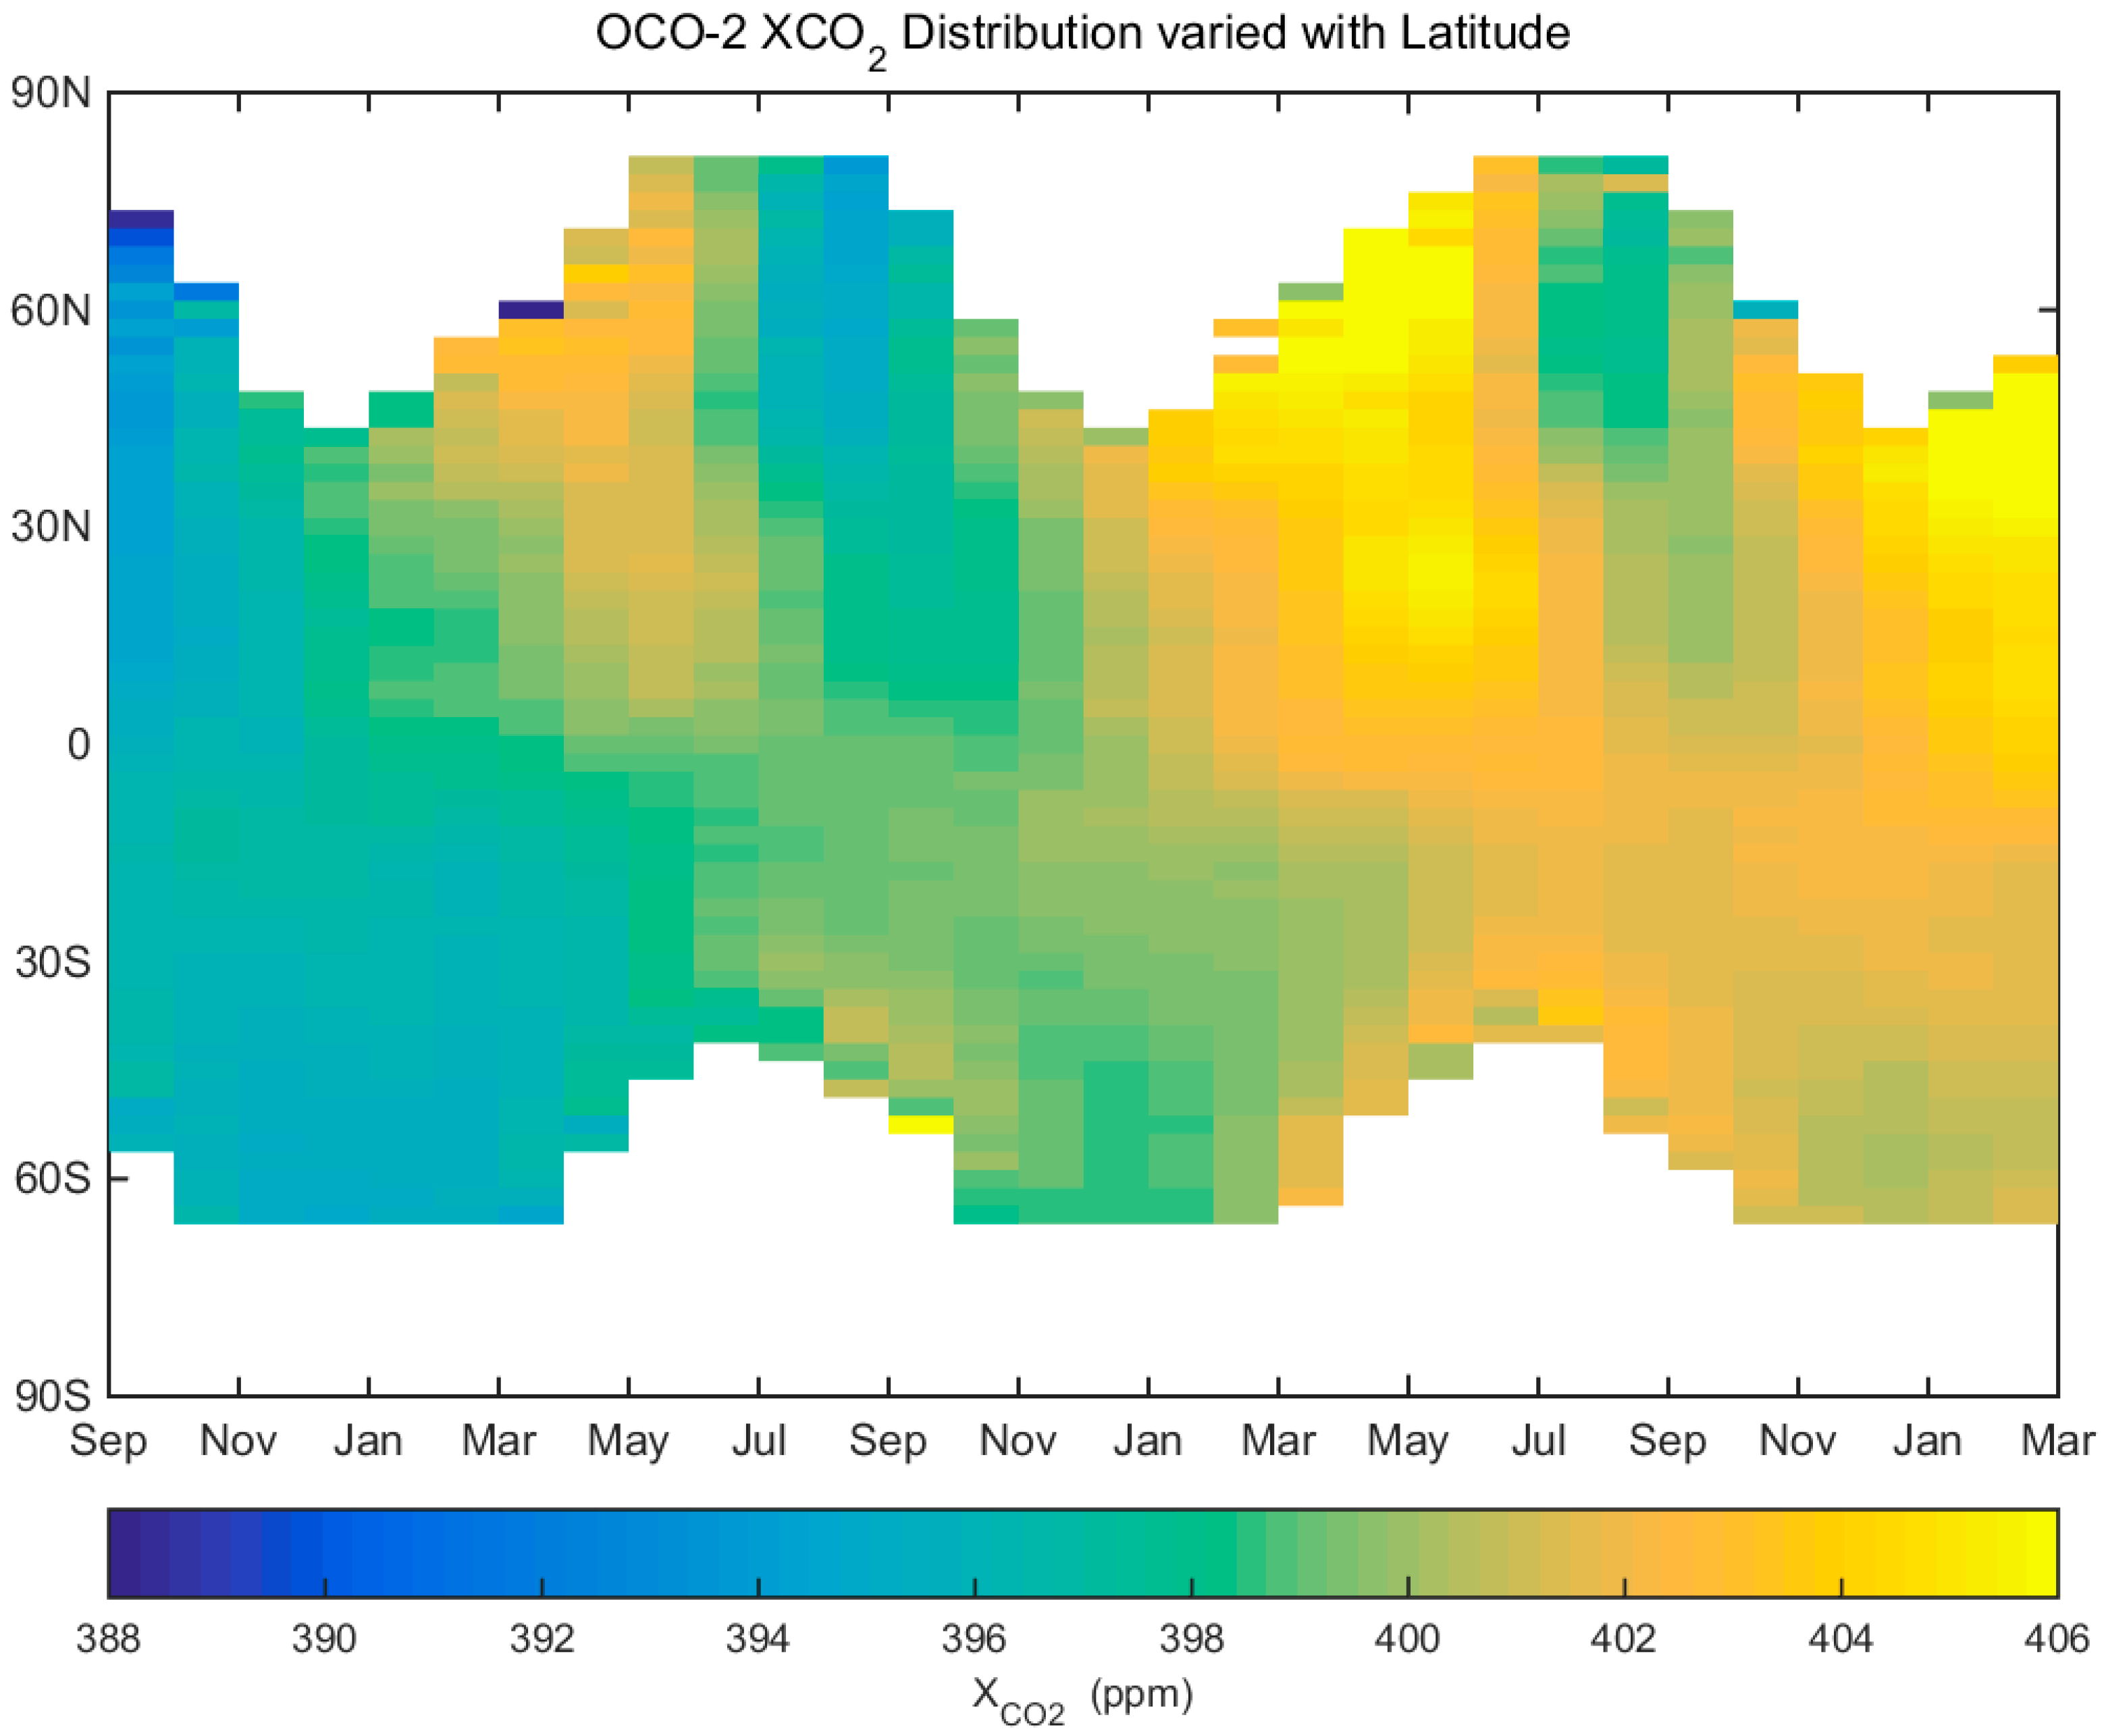
Figure 11.
Difference between mean XCO2 distribution of OCO-2 and GOSAT in latitudes in each month since September 2014.
Figure 11.
Difference between mean XCO2 distribution of OCO-2 and GOSAT in latitudes in each month since September 2014.

Figure 12.
Gradient of GOSAT XCO2 with latitudes in each month since September 2014.

Figure 13.
Gradient of OCO-2 XCO2 with latitudes in each month since September 2014.

Figure 14.
Trend values of monthly mean XCO2 of GOSAT and OCO-2 in multiple regions since September 2014. The black line represent the statistical trend values of background CO2 levels on Mauna Loa at an altitude of 3400 m which can reflect truth about our global atmosphere by NOAA.
Figure 14.
Trend values of monthly mean XCO2 of GOSAT and OCO-2 in multiple regions since September 2014. The black line represent the statistical trend values of background CO2 levels on Mauna Loa at an altitude of 3400 m which can reflect truth about our global atmosphere by NOAA.

Figure 15.
Seasonal values of monthly mean XCO2 of GOSAT and OCO-2 in multiple regions since September 2014. The black line represent the statistical seasonal values of background CO2 levels on Mauna Loa at an altitude of 3400 m which can reflect truth about our global atmosphere by NOAA.
Figure 15.
Seasonal values of monthly mean XCO2 of GOSAT and OCO-2 in multiple regions since September 2014. The black line represent the statistical seasonal values of background CO2 levels on Mauna Loa at an altitude of 3400 m which can reflect truth about our global atmosphere by NOAA.

Figure 16.
Related statistics of seasonal values of monthly mean XCO2 of GOSAT and OCO-2 in multiple regions, including the maximums, minimums and the amplitudes of seasonal values. The filled diamonds represent the corresponding statistics of background CO2 levels on Mauna Loa by NOAA.
Figure 16.
Related statistics of seasonal values of monthly mean XCO2 of GOSAT and OCO-2 in multiple regions, including the maximums, minimums and the amplitudes of seasonal values. The filled diamonds represent the corresponding statistics of background CO2 levels on Mauna Loa by NOAA.

Table 1.
Partial information of Greenhouse Gases Observing Satellite (GOSAT) and Orbiting Carbon Observatory-2 (OCO-2).
Table 1.
Partial information of Greenhouse Gases Observing Satellite (GOSAT) and Orbiting Carbon Observatory-2 (OCO-2).
| OCO-2 | GOSAT | |
|---|---|---|
| Launch time | July 2014 | January 2009 |
| Orbit altitude | 705 km | 675 km |
| Spatial resolution | 1.29 km × 2.25 km | 10.5 km |
| Period | 98.8 min, 16 days/233 orbits | 98.1 min, 3 days/44 orbits |
| Equator crossing time | 1:36 pm | 1:00 pm |
Table 2.
Information from total carbon column observing network (TCCON) sites (the numbers in [] in the first column are the references to the data citations).
Table 2.
Information from total carbon column observing network (TCCON) sites (the numbers in [] in the first column are the references to the data citations).
| Site ID | Longitude | Latitude | Start Time | End Time | |
|---|---|---|---|---|---|
| AE [30] | Ascension Island, Saint Helena, Ascension and Tristan da Cunha | −14.33 | −7.92 | [2012, 5, 22] | [2016, 12, 21] |
| AN | Anmeyondo, South Korea | 126.33 | 36.54 | [2015, 2, 2] | [2015, 12, 8] |
| BI [31] | Bialystok, Poland | 23.02 | 53.23 | [2009, 3, 13] | [2016, 3, 30] |
| BR [32] | Bremen, Germany | 8.85 | 53.1 | [2007, 1, 15] | [2015, 12, 9] |
| CI [33] | California Institute of Technology, Pasadena, California, USA | −118.13 | 34.14 | [2012, 9, 20] | [2016, 12, 1] |
| DB [34] | Darwin, Australia | 130.89 | −12.43 | [2005, 8, 28] | [2016, 3, 30] |
| DF [35] | Armstrong Flight Research Center, Edwards, California, USA | −117.88 | 34.96 | [2013, 7, 20] | [2016, 8, 30] |
| EU [36] | Eureka, Canada | −86.42 | 80.05 | [2010, 3, 16] | [2016, 3, 29] |
| FC [37] | Four Corners, NM, USA | −108.48 | 36.8 | [2013, 3, 16] | [2013, 10, 4] |
| GM [38] | Garmisch, Germany | 11.06 | 47.48 | [2007, 7, 16] | [2016, 3, 29] |
| IF [39] | Indianapolis, Indiana, USA | −86 | 39.86 | [2012, 8, 23] | [2012, 12, 1] |
| IZ [40] | Izana, Tenerife, Spain | −16.48 | 28.3 | [2007, 5, 18] | [2016, 3, 18] |
| JC [41] | Jet Propulsion Laboratory, Pasadena, California, USA | −118.18 | 34.2 | [2007, 7, 31] | [2008, 6, 23] |
| JF [41] | Jet Propulsion Laboratory, Pasadena, California, USA | −118.18 | 34.2 | [2011, 5, 19] | [2013, 7, 1] |
| JS [42] | Saga, Japan | 130.29 | 33.24 | [2011, 7, 28] | [2016, 9, 27] |
| KA [43] | Karlsruhe, Germany | 8.44 | 49.1 | [2010, 4, 19] | [2016, 3, 22] |
| LH [44] | Lauder, New Zealand, 120HR | 169.68 | −45.05 | [2004, 6, 28] | [2010, 12, 8] |
| LL [44] | Lauder, New Zealand, 125HR | 169.68 | −45.04 | [2010, 2, 2] | [2016, 10, 1] |
| MA [45] | Manaus, Brazil | −60.6 | −3.21 | [2014, 10, 1] | [2015, 6, 24] |
| OC [46] | Lamont, Oklahoma, USA | −97.49 | 36.6 | [2008, 7, 6] | [2016, 12, 1] |
| OR [47] | Orleans, France | 2.11 | 47.97 | [2009, 8, 29] | [2016, 3, 29] |
| PA [48] | Park Falls, Wisconsin, USA | −90.27 | 45.94 | [2004, 6, 2] | [2016, 11, 26] |
| PR [49] | Paris, France | 2.36 | 48.85 | [2014, 9, 23] | [2016, 3, 22] |
| RA [50] | Reunion Island (Ile de La Reunion), France | 55.49 | −20.9 | [2011, 9, 16] | [2016, 12, 31] |
| RJ [51,52] | Rikubetsu, Hokkaido, Japan | 143.77 | 43.46 | [2013, 11, 16] | [2016, 3, 29] |
| SO [53,54] | Sodankyla, Finland | 26.63 | 67.37 | [2009, 5, 16] | [2016, 10, 22] |
| TK [52] | Tsukuba, Ibaraki, Japan, 125HR | 140.12 | 36.05 | [2011, 8, 4] | [2016, 3, 30] |
| WG [55] | Wollongong, Australia | 150.88 | −34.41 | [2008, 6, 25] | [2016, 3, 30] |
Table 3.
Numbers of validated XCO2 measurements of the satellites compared with TCCON (Number of measurements /Number of observation times).
Table 3.
Numbers of validated XCO2 measurements of the satellites compared with TCCON (Number of measurements /Number of observation times).
| OCO-2 | GOSAT | |||||||
|---|---|---|---|---|---|---|---|---|
| Volume | Land Nadir | Land Glint | Land Target | Sea Glint | OB1D (Since 2014) | SPOD (Since 2014) | OB1D (Since 2009) | SPOD (Since 2009) |
| 75°N–85°N | 3/1 | 0/0 | 226/8 | 0/0 | 0/0 | 0/0 | 3/1 | 0/0 |
| 60°N–70°N | 7/5 | 1/1 | 2002/5 | 0/0 | 53/23 | 4/4 | 205/89 | 6/6 |
| 45°N–55°N | 10,184/72 | 7855/59 | 27,525/51 | 1313/10 | 108/34 | 713/225 | 381/152 | 1545/569 |
| 30°N–40°N | 60,419/191 | 47,456/131 | 135,180/127 | 8580/69 | 18/7 | 805/267 | 239/94 | 2655/899 |
| 20°S–0° | 4093/26 | 4223/26 | 14,464/36 | 29,520/73 | 96/40 | 12/12 | 299/120 | 45/38 |
| 60°S–30°S | 2917/32 | 3334/16 | 28,948/76 | 8080/36 | 47/13 | 130/86 | 201/59 | 748/378 |
| ALL | 77,623/327 | 62,869/233 | 208,345/303 | 47,493/188 | 322/117 | 1664/594 | 1328/515 | 4999/1890 |
Table 4.
Numbers of validated XCO2 measurements of the satellites at each TCCON site (Number of measurements /Number of observation times).
Table 4.
Numbers of validated XCO2 measurements of the satellites at each TCCON site (Number of measurements /Number of observation times).
| OCO-2 | GOSAT | |||||||
|---|---|---|---|---|---|---|---|---|
| Site ID | Land Nadir | Land Glint | Land Target | Sea Glint | OB1D (Since 2014) | SPOD (Since 2014) | OB1D (Since 2009) | SPOD (Since 2009) |
| AE | 0/0 | 2/0 | 173/2 | 14,023/33 | 0/0 | 0/0 | 0/0 | 0/0 |
| AN | 421/8 | 200/0 | 0/0 | 1/1 | 1/0 | 30/12 | 1/0 | 30/12 |
| BI | 1287/11 | 654/6 | 5359/15 | 1/0 | 3/1 | 71/24 | 30/13 | 158/60 |
| BR | 577/2 | 95/4 | 0/0 | 404/1 | 2/1 | 7/3 | 7/4 | 66/23 |
| CI | 16,377/54 | 13,625/26 | 32,201/26 | 4143/22 | 4/3 | 25/24 | 13/6 | 134/105 |
| DB | 4044/19 | 4138/21 | 13,030/19 | 5274/6 | 90/35 | 11/11 | 289/113 | 42/35 |
| DF | 13,788/51 | 11,875/32 | 26,941/22 | 1601/15 | 3/2 | 17/16 | 12/5 | 84/62 |
| EU | 3/1 | 0/0 | 226/8 | 0/0 | 0/0 | 0/0 | 3/1 | 0/0 |
| FC | 0/0 | 0/0 | 0/0 | 0/0 | 0/0 | 0/0 | 7/3 | 6/2 |
| GM | 1519/11 | 1656/8 | 0/0 | 0/0 | 26/7 | 50/24 | 54/17 | 205/100 |
| IF | 0/0 | 0/0 | 0/0 | 0/0 | 0/0 | 0/0 | 54/15 | 20/9 |
| IZ | 3/1 | 43/0 | 0/0 | 450/1 | 0/0 | 0/0 | 3/2 | 20/10 |
| JC | 0/0 | 0/0 | 0/0 | 0/0 | 0/0 | 0/0 | 0/0 | 0/0 |
| JF | 0/0 | 0/0 | 0/0 | 0/0 | 0/0 | 0/0 | 114/48 | 20/19 |
| JS | 86/4 | 564/4 | 3367/3 | 1945/18 | 1/0 | 71/32 | 1/0 | 202/84 |
| KA | 1060/7 | 907/8 | 3159/7 | 1/0 | 0/0 | 61/26 | 12/2 | 174/84 |
| LH | 0/0 | 0/0 | 0/0 | 0/0 | 0/0 | 0/0 | 17/7 | 12/12 |
| LL | 727/13 | 1252/6 | 19,899/47 | 4530/25 | 44/12 | 78/55 | 159/44 | 155/131 |
| MA | 2/1 | 66/5 | 0/0 | 7/0 | 0/0 | 0/0 | 0/0 | 0/0 |
| OC | 29,224/62 | 20,874/69 | 61,310/58 | 7/0 | 9/2 | 474/128 | 34/15 | 1479/388 |
| OR | 2470/9 | 1338/7 | 7961/7 | 0/0 | 36/12 | 88/31 | 115/45 | 256/87 |
| PA | 2028/25 | 1669/18 | 10,556/18 | 275/5 | 4/2 | 315/76 | 118/58 | 544/170 |
| PR | 1096/4 | 1280/6 | 490/4 | 324/0 | 37/13 | 49/20 | 37/13 | 49/20 |
| RA | 47/6 | 17/0 | 1261/15 | 10,216/34 | 6/5 | 1/1 | 10/7 | 3/3 |
| RJ | 147/3 | 256/2 | 0/0 | 308/4 | 0/0 | 72/22 | 8/2 | 93/26 |
| SO | 7/5 | 1/1 | 2002/5 | 0/0 | 53/23 | 4/4 | 205/89 | 6/6 |
| TK | 520/11 | 275/0 | 11,361/18 | 433/12 | 0/0 | 188/55 | 0/0 | 660/208 |
| WG | 2190/19 | 2082/10 | 9049/29 | 3550/11 | 3/1 | 52/31 | 25/9 | 581/235 |
Table 5.
Linear fitting of OCO-2 and TCCON data (parameter: k (R2)).
| Latitude Zone | Land Nadir | Land Glint | Land Target | Sea Glint | OCO-2 |
|---|---|---|---|---|---|
| 75°N–85°N | 0.0665(0.00317) | 0.0823(0.00546) | |||
| 60°N–70°N | 1.02(0.864) | 1.42(0.985) | 0.839(0.851) | ||
| 45°N–55°N | 0.84(0.822) | 0.844(0.731) | 1.07(0.896) | 1.04(0.874) | 0.923(0.815) |
| 30°N–40°N | 0.967(0.754) | 0.799(0.634) | 0.918(0.902) | 0.931(0.754) | 0.905(0.759) |
| 20°S–0° | 0.775(0.693) | 0.765(0.783) | 0.698(0.683) | 0.92(0.792) | 0.87(0.755) |
| 60°S–30°S | 0.716(0.713) | 0.772(0.722) | 0.727(0.602) | 0.875(0.861) | 0.759(0.692) |
| All | 0.947(0.758) | 0.855(0.701) | 0.982(0.84) | 0.977(0.795) | 0.937(0.773) |
Table 6.
Linear fitting of GOSAT and TCCON data (parameter: k (R2)).
| Latitude Zone | OB1D (Since 2014) | SPOD (Since 2014) | GOSAT (Since 2014) | OB1D (Since 2009) | SPOD (Since 2009) | GOSAT (Since 2009) |
|---|---|---|---|---|---|---|
| 75°N–85°N | ||||||
| 60°N–70°N | 0.887(0.82) | 0.597(0.628) | 0.876(0.809) | 0.947(0.918) | 0.845(0.943) | 0.945(0.92) |
| 45°N–55°N | 0.76(0.721) | 0.738(0.631) | 0.737(0.641) | 0.925(0.881) | 0.894(0.849) | 0.902(0.866) |
| 30°N–40°N | 0.459(0.507) | 0.637(0.592) | 0.629(0.585) | 0.726(0.776) | 0.83(0.811) | 0.815(0.816) |
| 20°S–0° | 0.646(0.576) | 0.808(0.722) | 0.619(0.554) | 0.911(0.873) | 0.802(0.901) | 0.865(0.863) |
| 60°S–30°S | 0.19(0.067) | 0.34(0.23) | 0.316(0.21) | 0.943(0.798) | 0.892(0.793) | 0.897(0.793) |
| All | 0.657(0.626) | 0.676(0.635) | 0.67(0.649) | 0.904(0.855) | 0.859(0.84) | 0.865(0.851) |
Table 7.
Linear fitting of GOSAT and TCCON data (parameter: k (R2)).
| OCO-2 | GOSAT | |||||||
|---|---|---|---|---|---|---|---|---|
| Site ID | Land Nadir | Land Glint | Land Target | Sea Glint | OB1D (Since 2014) | SPOD (Since 2014) | OB1D (Since 2009) | SPOD (Since 2009) |
| AE | 0.842(0.723) | |||||||
| AN | 0.827(0.92) | 0.657(0.677) | 0.657(0.677) | |||||
| BI | 0.931(0.803) | 1.37(0.717) | 1.21(0.834) | 0.719(0.474) | 0.958(0.876) | 0.92(0.805) | ||
| BR | 0.591(0.767) | 1.11(0.883) | 0.775(0.891) | |||||
| CI | 0.962(0.73) | 0.878(0.567) | 0.77(0.882) | 0.915(0.611) | 0.691(0.405) | 0.671(0.941) | 0.87(0.773) | |
| DB | 0.774(0.595) | 0.832(0.838) | 0.644(0.509) | 0.973(0.911) | 0.58(0.397) | 0.774(0.801) | 0.905(0.872) | 0.837(0.933) |
| DF | 0.81(0.806) | 0.683(0.636) | 0.968(0.937) | 0.863(0.775) | 0.365(0.494) | 0.708(0.947) | 0.519(0.7) | |
| EU | 0.0665(0.00317) | |||||||
| FC | ||||||||
| GM | 0.724(0.7) | 0.822(0.9) | 0.763(0.776) | 0.735(0.695) | 0.851(0.837) | 0.84(0.811) | ||
| IF | 0.593(0.47) | 0.614(0.71) | ||||||
| IZ | 1.13(0.912) | |||||||
| JC | ||||||||
| JF | 0.487(0.457) | 0.571(0.628) | ||||||
| JS | 0.949(0.986) | 0.992(0.915) | 0.952(0.912) | 0.93(0.691) | 0.851(0.761) | |||
| KA | 0.804(0.773) | 1.06(0.827) | 0.868(0.934) | 0.721(0.561) | 0.884(0.818) | |||
| LH | 0.691(0.524) | 0.918(0.503) | ||||||
| LL | 0.364(0.368) | 0.747(0.908) | 0.735(0.684) | 0.847(0.942) | 0.182(0.0583) | 0.434(0.374) | 0.961(0.751) | 0.958(0.876) |
| MA | 0.317(0.387) | |||||||
| OC | 1.07(0.885) | 0.818(0.765) | 0.99(0.883) | 0.763(0.782) | 0.945(0.856) | 0.941(0.918) | ||
| OR | 0.89(0.721) | 0.715(0.896) | 0.991(0.981) | 0.788(0.874) | 0.848(0.809) | 0.921(0.94) | 0.946(0.894) | |
| PA | 0.768(0.908) | 0.771(0.902) | 0.924(0.936) | 1.11(0.915) | 0.753(0.657) | 0.74(0.79) | 0.919(0.883) | |
| PR | 0.977(0.978) | 0.779(0.284) | 1.57(0.848) | 0.803(0.804) | 0.694(0.584) | 0.803(0.804) | 0.694(0.584) | |
| RA | 0.583(0.357) | 0.862(0.817) | 1.03(0.843) | 0.622(0.933) | 0.744(0.888) | |||
| RJ | 1.02(0.873) | 0.704(0.706) | 0.721(0.773) | |||||
| SO | 1.02(0.864) | 1.42(0.985) | 0.887(0.82) | 0.597(0.628) | 0.947(0.918) | 0.845(0.943) | ||
| TK | 0.952(0.53) | 0.876(0.944) | 0.763(0.877) | 0.653(0.599) | 0.942(0.809) | |||
| WG | 0.787(0.831) | 0.785(0.701) | 0.774(0.555) | 1.18(0.588) | 0.201(0.081) | 1.07(0.911) | 0.83(0.693) | |
Table 8.
Measurement accuracy of XCO2 of OCO-2 and GOSAT at each TCCON site in terms of observation modes (ppm).
Table 8.
Measurement accuracy of XCO2 of OCO-2 and GOSAT at each TCCON site in terms of observation modes (ppm).
| OCO−2 | GOSAT | |||||||
|---|---|---|---|---|---|---|---|---|
| Site ID | Land Nadir | Land Glint | Land Target | Sea Glint | OB1D (Since 2014) | SPOD (Since 2014) | OB1D (Since 2009) | SPOD (Since 2009) |
| AE | - | - | 0.3122 ± 0.6173 | −0.2081 ± 1.054 | - | - | - | - |
| AN | 2.205 ± 0.9559 | - | - | 1.254 ± 0 | - | 0.06877 ± 1.873 | - | 0.06877 ± 1.873 |
| BI | 1.069 ± 0.9757 | 3.835 ± 3.269 | 1.622 ± 1.723 | - | 2.112 ± 0 | −0.2381 ± 2.109 | 0.2359 ± 1.865 | 0.01919 ± 1.927 |
| BR | 1.728 ± 0.5042 | 0.9189 ± 0.8093 | - | −0.0171 ± 0 | 1.024 ± 0 | 1.36 ± 3.02 | 0.5418 ± 2.735 | 0.2102 ± 2.079 |
| CI | −1.339 ± 1.583 | −1.3 ± 2.363 | −0.006131 ± 1.019 | −1.311 ± 1.885 | 0.4945 ± 1.427 | −0.345 ± 2.186 | −0.6119 ± 1.773 | −0.1519 ± 2.037 |
| DB | 0.4452 ± 1.077 | 0.2 ± 0.7112 | 0.2301 ± 0.8956 | −0.4211 ± 0.7246 | −1.724 ± 1.352 | −0.9812 ± 1.039 | −1.305 ± 1.479 | −0.4357 ± 1.492 |
| DF | 0.5121 ± 1.248 | 0.8969 ± 1.923 | −0.9662 ± 0.7063 | 0.4714 ± 1.338 | 2.339 ± 0.7834 | 3.909 ± 3.474 | 1.345 ± 1.174 | 1.459 ± 2.908 |
| EU | −1.582 ± 0 | - | −0.5762 ± 1.906 | - | - | - | −2.085 ± 0 | - |
| FC | - | - | - | - | - | - | −1.068 ± 0.6567 | −0.9305 ± 0.2116 |
| GM | 0.3139 ± 2.207 | 1.321 ± 0.9766 | - | - | 0.7737 ± 1.775 | −0.04457 ± 1.77 | 0.2142 ± 2.193 | 0.03482 ± 2.359 |
| IF | - | - | - | - | - | - | −0.6978 ± 1.91 | 0.3259 ± 1.388 |
| IZ | 0.07387 ± 0 | - | - | −0.7374 ± 0 | - | - | −1.687 ± 0.3916 | −1.641 ± 1.148 |
| JC | - | - | - | - | - | - | - | - |
| JF | - | - | - | - | - | - | −1.969 ± 2.401 | 1.891 ± 1.737 |
| JS | 0.579 ± 0.6802 | −1.391 ± 0.6425 | −1.302 ± 0.6986 | −0.5398 ± 1.021 | - | 0.6149 ± 2.158 | - | 0.5001 ± 2.212 |
| KA | 1.625 ± 0.8358 | 2.277 ± 1.056 | 1.019 ± 1.051 | - | - | 0.4475 ± 2.193 | 0.8617 ± 0.8142 | 0.6267 ± 2.076 |
| LH | - | - | - | - | - | - | −2.313 ± 1.473 | −2.051 ± 1.422 |
| LL | 0.9835 ± 1.48 | 0.1363 ± 0.6523 | 0.4665 ± 1.224 | 0.4967 ± 0.6683 | −2.473 ± 2.987 | −1.82 ± 1.925 | −0.906 ± 2.162 | −1.156 ± 1.713 |
| MA | 0.9727 ± 0 | 0.4654 ± 1.161 | - | - | - | - | - | - |
| OC | −0.09046 ± 1.173 | 0.1603 ± 1.409 | −0.3063 ± 1.043 | - | −4.841 ± 4.542 | −1.271 ± 1.632 | −2.625 ± 1.995 | −1.421 ± 1.584 |
| OR | 1.16 ± 1.855 | 1.883 ± 1.219 | 0.4393 ± 0.4621 | - | −1.605 ± 1.274 | −0.5296 ± 1.466 | −1.251 ± 1.699 | −0.51 ± 1.762 |
| PA | 0.6062 ± 1.259 | 0.6962 ± 1.435 | 0.5534 ± 0.971 | 1.078 ± 1.162 | −1.047 ± 5.617 | −0.5276 ± 2.273 | 0.03045 ± 2.412 | −0.3444 ± 2.166 |
| PR | 0.643 ± 0.6813 | −0.8429 ± 1.423 | −1.639 ± 0.2435 | - | −2.206 ± 1.959 | −1.659 ± 2.011 | −2.206 ± 1.959 | −1.659 ± 2.011 |
| RA | 0.9441 ± 1.463 | - | 1.505 ± 0.9771 | 0.3255 ± 0.9726 | −2.47 ± 1.898 | −2.038 ± 0 | −2.438 ± 1.676 | 2.42 ± 3.912 |
| RJ | 0.5894 ± 0.578 | 2.715 ± 0.5235 | - | 0.1922 ± 1.336 | - | 0.7925 ± 2.164 | −0.6846 ± 0.09038 | 0.5172 ± 2.177 |
| SO | 4.119 ± 1.189 | 4.136 ± 0 | 2.664 ± 0.3484 | - | −0.5228 ± 1.83 | 0.2718 ± 1.355 | 0.006901 ± 1.79 | −0.03789 ± 1.17 |
| TK | 0.9581 ± 1.931 | - | 0.5089 ± 0.7652 | −0.3152 ± 1.172 | - | 0.5685 ± 1.896 | - | 1.488 ± 2.098 |
| WG | 0.5702 ± 1.009 | −0.5041 ± 1.273 | 1.374 ± 1.26 | 0.7546 ± 1.125 | −1.229 ± 0 | −1.676 ± 2.845 | −2.122 ± 1.798 | −0.7749 ± 2.292 |
| ALL | 0.2951 ± 1.627 | 0.3795 ± 1.873 | 0.3368 ± 1.345 | −0.03313 ± 1.288 | −1.335 ± 2.162 | −0.4792 ± 2.302 | −0.8862 ± 2.073 | −0.2812 ± 2.237 |
Table 9.
Measurement accuracy of XCO2 of the satellites compared with TCCON data.
| OCO-2 | GOSAT (2014) | GOSAT (2009) | |
|---|---|---|---|
| Accuracy (ppm) | 0.2671 ± 1.56 | −0.62 ± 2.3 | −0.4107 ± 2.216 |
| Accuracy (%) | 0.06797 ± 0.3903 | −0.1549 ± 0.5753 | −0.1038 ± 0.5615 |
© 2017 by the authors. Licensee MDPI, Basel, Switzerland. This article is an open access article distributed under the terms and conditions of the Creative Commons Attribution (CC BY) license (http://creativecommons.org/licenses/by/4.0/).
Share and Cite
MDPI and ACS Style
Liang, A.; Gong, W.; Han, G.; Xiang, C. Comparison of Satellite-Observed XCO2 from GOSAT, OCO-2, and Ground-Based TCCON. Remote Sens. 2017, 9, 1033. https://doi.org/10.3390/rs9101033
AMA Style
Liang A, Gong W, Han G, Xiang C. Comparison of Satellite-Observed XCO2 from GOSAT, OCO-2, and Ground-Based TCCON. Remote Sensing. 2017; 9(10):1033. https://doi.org/10.3390/rs9101033
Chicago/Turabian StyleLiang, Ailin, Wei Gong, Ge Han, and Chengzhi Xiang. 2017. "Comparison of Satellite-Observed XCO2 from GOSAT, OCO-2, and Ground-Based TCCON" Remote Sensing 9, no. 10: 1033. https://doi.org/10.3390/rs9101033
Note that from the first issue of 2016, this journal uses article numbers instead of page numbers. See further details here.