Next Article in Journal
Agricultural Soil Spectral Response and Properties Assessment: Effects of Measurement Protocol and Data Mining Technique
Next Article in Special Issue
Green Spaces as an Indicator of Urban Health: Evaluating Its Changes in 28 Mega-Cities
Previous Article in Journal
Usability Study to Assess the IGBP Land Cover Classification for Singapore
Previous Article in Special Issue
A Remote Sensing Data Based Artificial Neural Network Approach for Predicting Climate-Sensitive Infectious Disease Outbreaks: A Case Study of Human Brucellosis
 
 
Addendum published on 23 December 2017, see Remote Sens. 2018, 10(1), 20.
Article

Using Satellite Data for the Characterization of Local Animal Reservoir Populations of Hantaan Virus on the Weihe Plain, China

by
Pengbo Yu
1,†,
Yidan Li
2,3,†,
Bo Xu
4,
Jing Wei
1,
Shen Li
1,
Jianhua Dong
1,
Jianhui Qu
5,
Jing Xu
1,
Zheng Y.X. Huang
6,
Chaofeng Ma
7,
Jing Yang
2,
Guogang Zhang
8,
Bin Chen
2,
Shanqian Huang
2,
Chunming Shi
2,
Hongwei Gao
9,
Feng Liu
1,
Huaiyu Tian
2,*,
Nils Chr. Stenseth
10,*,
Bing Xu
4,* and
Jingjun Wang
1,*
add Show full author list remove Hide full author list
1
Shaanxi Provincial Centre for Disease Control and Prevention, Xi’an 710054, China
2
State Key Laboratory of Remote Sensing Science, College of Global Change and Earth System Science, Beijing Normal University, Beijing 100875, China
3
College of Resource and Environmental Sciences, Wuhan University, Wuhan 430072, China
4
Ministry of Education Key Laboratory for Earth System Modelling, Department of Earth System Science, School of Environment, Tsinghua University, Beijing 100084, China
5
Hu County Centre for Disease Control and Prevention, Xi’an 710302, China
6
College of Life Sciences, Nanjing Normal University, Nanjing 225300, China
7
Xi’an Centre for Disease Control and Prevention, Xi’an 710054, China
8
Key Laboratory of Forest Protection of State Forestry Administration, National Bird Banding Center of China, Research Institute of Forest Ecology, Environment and Protection, Chinese Academy of Forestry, Beijing 100091, China
9
Institute of Disaster Medicine and Public Health, Affiliated Hospital of Logistics University of Chinese People’s Armed Police Force (PAP), Tianjin 300162, China
10
Centre for Ecological and Evolutionary Synthesis (CEES), Department of Biosciences, University of Oslo, PO Box 1066 Blindern, N-0316 Oslo, Norway
*
Authors to whom correspondence should be addressed.
These authors contributed equally to this work.
Remote Sens. 2017, 9(10), 1076; https://doi.org/10.3390/rs9101076
Submission received: 19 September 2017 / Revised: 15 October 2017 / Accepted: 18 October 2017 / Published: 22 October 2017
(This article belongs to the Special Issue Remote Sensing Applications to Human Health)

Abstract

:
Striped field mice (Apodemus agrarius) are the main host for the Hantaan virus (HTNV), the cause of hemorrhagic fever with renal syndrome (HFRS) in central China. It has been shown that host population density is associated with pathogen dynamics and disease risk. Thus, a higher population density of A. agrarius in an area might indicate a higher risk for an HFRS outbreak. Here, we surveyed the A. agrarius population density between 2005 and 2012 on the Weihe Plain, Shaanxi Province, China, and used this monitoring data to examine the relationships between the dynamics of A. agrarius populations and environmental conditions of crop-land, represented by remote sensing based indicators. These included the normalized difference vegetation index, leaf area index, fraction of photosynthetically active radiation absorbed by vegetation, net photosynthesis (PsnNet), gross primary productivity, and land surface temperature. Structural equation modeling (SEM) was applied to detect the possible causal relationship between PsnNet, A. agrarius population density and HFRS risk. The results showed that A. agrarius was the most frequently captured species with a capture rate of 0.9 individuals per hundred trap-nights, during 96 months of trapping in the study area. The risk of HFRS was highly associated with the abundance of A. agrarius, with a 1–5-month lag. The breeding season of A. agrarius was also found to coincide with agricultural activity and seasons with high PsnNet. The SEM indicated that PsnNet had an indirect positive effect on HFRS incidence via rodents. In conclusion, the remote sensing-based environmental indicator, PsnNet, was highly correlated with HTNV reservoir population dynamics with a 3-month lag (r = 0.46, p < 0.01), and may serve as a predictor of potential HFRS outbreaks.

1. Introduction

In 1984, hemorrhagic fever with renal syndrome (HFRS) broke out in Shaanxi Province, marked by rapidly progressive glomerulonephritis symptoms and a high likelihood of mortality caused by the Hantaan virus (HTNV, family Bunyaviridae, genus Hantavirus): a total of 1439 cases and an incidence of 0.3% occurred in Hu County (Shanxi Province) [1,2]. Although a significant decrease in the number of HFRS cases has been observed over the long-term, the 493 cases reported between 2010 and 2011 reawakened concern about the possible risk of disease.
Hantaviruses are primarily associated with the rodent family, Muridae [3]. Hantaviruses and rodent reservoir species are tightly linked, so that each viral species is primarily associated with a single rodent species, although spillover infections have been reported in other mammals [4,5]. As HFRS is transmitted by contact with rodent urine, feces or saliva [6,7], usually considered as a direct, density-dependent transmission [8,9], the ecology of rodent abundance can largely determine the possibility and magnitude of HFRS [10]. On the Weihe plain, located in central Shaanxi Province, striped field mice (Apodemus agrarius) are the main rodent host of HTNV [11]. Therefore, understanding the factors that lead to changes in A. agrarius abundance is important for better predicting HFRS outbreaks.
In 2002, a trophic cascade hypothesis was proposed by Yates et al. to explain how environmental variation affects the probability of epidemic outbreaks [12]. Trophic cascades are indirect interactions within a food web that can affect the entire ecosystem. Favorable environmental conditions can bring an increase in primary and secondary productivities, which results in a higher rodent population density and thereby an increased risk of hantaviruses transmission to humans [13,14]. At present, remote sensing (RS) has been recognized as an important information source for studying hantaviruses ecology, and it is often used in the study of the relationship between environmental variables and hantavirus transmission. Glass et al. [15,16,17] and Boone et al. [18,19] used remote sensing images to identify environments associated with a risk of hantaviral disease in humans caused by Sin Nombre virus. Wei et al. [20] combined ecologic niche modeling with remote sensing techniques to identify the risk factors for hantavirus infections in rodent hosts. Zhang et al. [10] and Goodin et al. [21] examined the relationship between natural infection rates for hantavirus in rodents and land cover classes. Yan et al. [22] used Landsat TM satellite data to explore the temporal relationship between the number of HFRS cases and a time series of the normalized difference vegetation index (NDVI). These studies highlight the usefulness of RS in anticipating HFRS risk.
Here we carried out a survey of rodent population dynamics, covering the period from 2005 to 2012 on the Weihe Plain, and used HFRS incidence data, together with satellite data, to test the hypothesis that the population dynamics of the animal reservoir of HTNV is led by trophic cascades (measured via remote sensing indicators), and in turn these can serve as possible predictors of HFRS outbreaks. Our analyses will improve the understanding of the risk of HTNV transmission to humans.

2. Materials and Methods

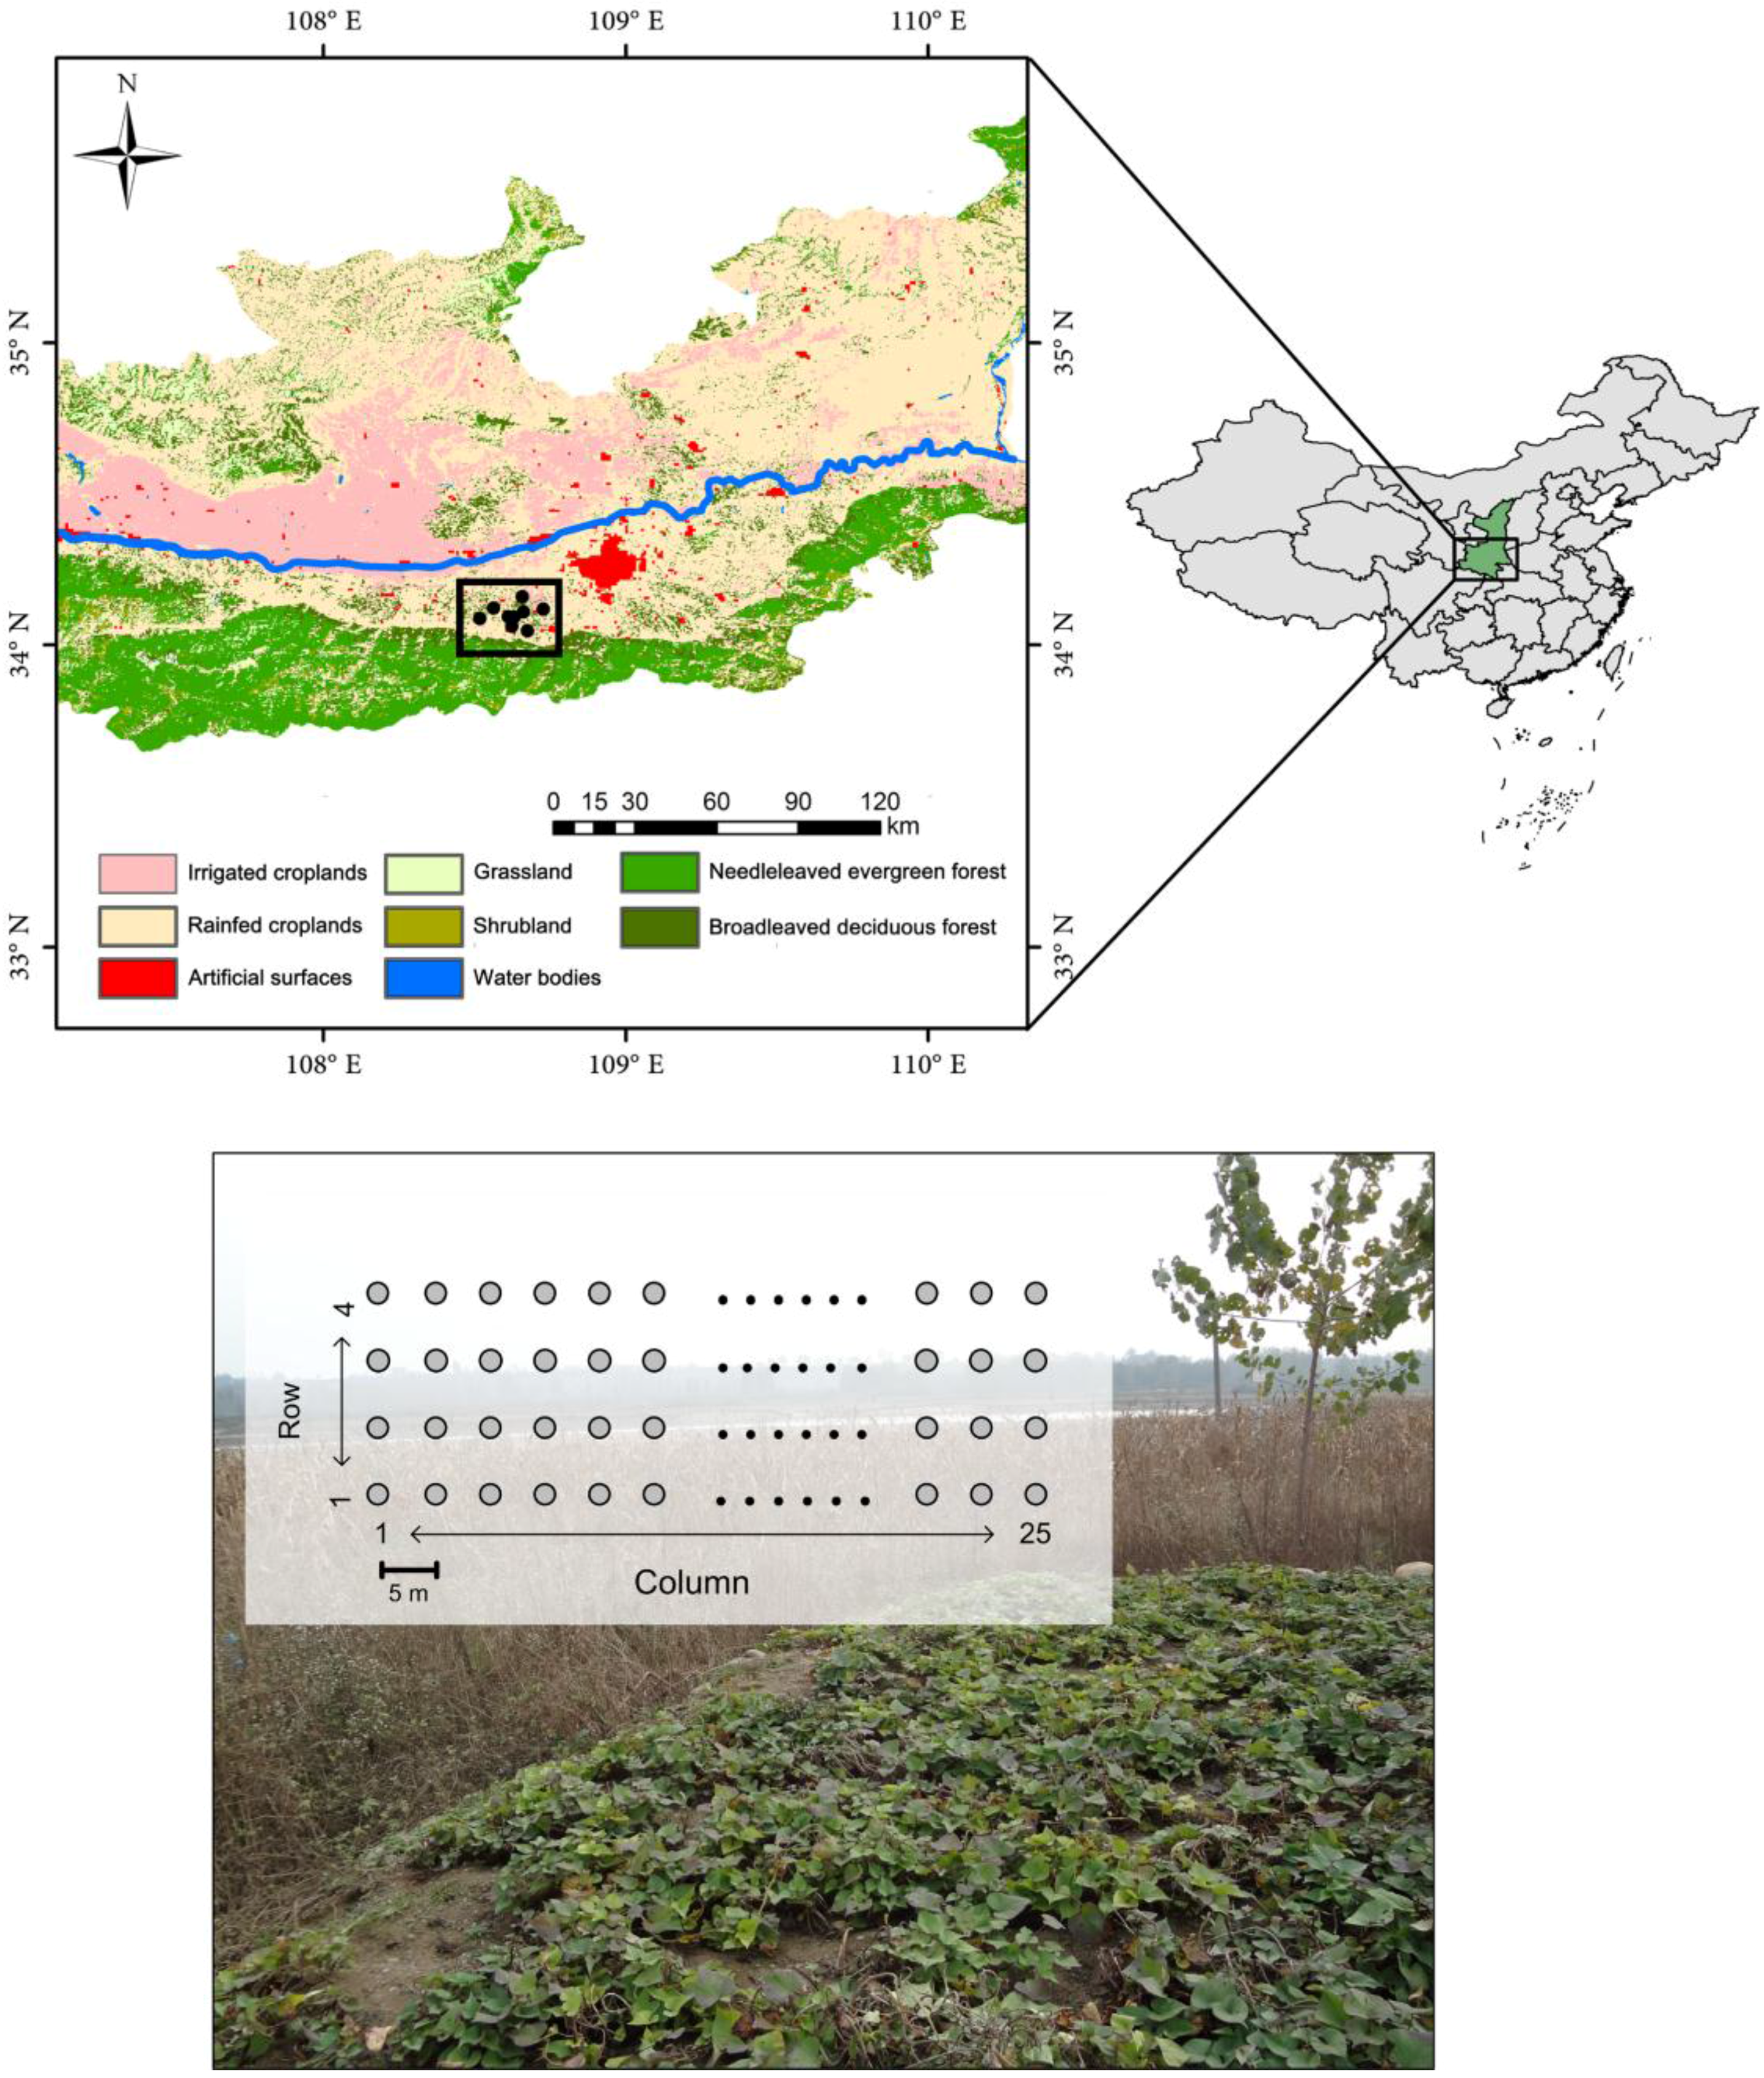
2.1. Rodent Sampling

Our study area was in one of the HFRS focus areas in Hu County (108°E, 34°N), the national HFRS surveillance site on the Loess Plateau of central China. From January 2005 to December 2012, monthly surveys of the local animal reservoir populations of the Hantaan virus were carried out. Rodent trapping was conducted in nine trapping sites, set on farmland with a simple vegetation structure (occupied mostly by the major crops, spring wheat and autumn maize) which are habitats for important rodent reservoirs—3 km away from villages in Hu County. In each trapping site, at least 300 single-capture small mammal traps were set for three nights as four parallel lines of 25 traps each (Figure 1). We put peanuts in each trap as bait at night and recovered small mammals trapped in the morning [1]. Capture rates are expressed as the number of rodents caught per 100 trap-nights. Traps were spaced at approximately 5 m intervals. Snap-traps (Golden Cat, Guixi Mousetrap Factory, Guixi, Jiangxi, China) were set each night, and recovered in the morning. Captured animals were collected each morning and identified to species, according to previously described criteria [23]. All captured rodents were accessioned to the Shaanxi Centers for Disease Control and Prevention [05HX001–16HX129]. Epidemiological data were obtained from the Shaanxi Provincial Center for Disease Control and Prevention.
Data on HFRS cases in Hu County from 2005 to 2012 were obtained from the Shaanxi Notifiable Disease Surveillance System. These cases were confirmed, according to the standard diagnosis set by the Ministry of Health of the People’s Republic of China [24], then confirmed by detecting antibodies against hantavirus in human serum samples.

2.2. Satellite Data

The launch of the Moderate Resolution Imaging Spectroradiometer (MODIS) on board the Terra and Aqua spacecrafts in December 1999 and May 2002, respectively, has greatly contributed to our understanding of Earth’s dynamics. In this study, a group of MODIS Land products were used (Table 1) that were obtained from the National Aeronautics and Space Administration’s Earth Observing System Data and Information System (EOSDIS; http://reverb.echo.nasa.gov/reverb/). Specifically, the NDVI was extracted from the MOD13A2 product, with a 16-day and 1-km resolution. The leaf area index (LAI) and fractional photosynthetically active radiation (FPAR) were extracted from the MOD15A2 product with an 8-day and 1-km resolution. The LAI was used to quantify the amount of foliage area per unit ground surface area [25], and FPAR was used to measure the vegetation-absorbed radiation in the 0.4–0.7 μm spectral region of solar radiation [26].
Note: MODIS, Moderate Resolution Imaging Spectoradiometer; NDVI, normalized difference vegetation index; LAI, leaf area index; FPAR, fractional photosynthetically active radiation; GPP, gross primary production; PsnNet, net photosynthesis; LST, land surface temperature.
Gross primary production (GPP) [27] and net photosynthesis (PsnNet) [28] were derived from the MOD17A2 product with an 8-day and 1-km resolution, and were used in this study. GPP provides an accurate regular measure of the capacity of the vegetation to capture carbon and energy during photosynthesis, and PsnNet is used to measure the net uptake of carbon dioxide into a leaf.
The 8-day land surface temperature (LST) data was derived from the MODIS MOD11A2 product. The time range of the MODIS products used was from 2005 to 2012, and all the datasets were aggregated into monthly values by taking the maximum of all values recorded within the month.

2.3. Statistical Analysis

The relationships between remote sensing-based indicators, HFRS risk and rodent population density were examined by Pearson’s correlation. We applied a cross-correlation analysis, which detects if there are time-lag relationships. Given the time lag in the rodent population response to environmental conditions, we kept the remote sensing-based indicators series still and shifted the rodent population density series backward by one month each time (up to six months). To detect the lag effect of rodent population density on HFRS risk, we shifted the incidence of HFRS backward and kept rodent population density still. A cross-correlation analysis was used to assess the associations, and was calculated as:
ρxy (t) = γxy (t)/(σxσy)  t = 0, ±1, ±2
where ρ (t) is the cross-correlation coefficient at time lag t; σ is the standard deviation for rodent population density, incidence of HFRS and remote sensing-based indicators; and γ is the covariance function.

2.4. Structure Equation Model

Structure equation modeling (SEM) is a general statistical technique, which combines factor analysis and multiple regression, used to examine direct and indirect effects among the interactions between multiple factors [29]. SEM can be used to interpret information on the observed correlations of groups of organisms, to test and evaluate complex causal relationships [30,31]. We constructed SEMs using the R package, lavaan (50), applying the maximum-likelihood method to estimate the model. Among the multiple indexes available to assess the fit of model, we chose a normalized χ2-test (chi-squared/degrees of freedom), comparative fit index (CFI) and root-mean square error of approximation (RMSEA) [32]. The normalized χ2-test is used to test whether the relationship structured in model is reasonable for the data. CFI is used to test if the model fits the data, where >0.9 is good, and RMSEA measures how closely the model reproduces data patterns, where lower values are better [33].
Based on the time-lag relationship found in the correlation analysis, we formulated SEM by setting PsnNet three months prior (t-3) as the predictor, rodent population density (t) as the mediator, and the incidence of HFRS four months later as the dependent variable. Our model tested the hypothesis that the variation between correlated PsnNet and rodent population density could provide plausible explanations for HFRS outbreak.

2.5. Ethical Review

The Animal Ethics Committee of the Shaanxi CDC waived approval for this study. Because the methods did not include animal experimentation, it was not necessary to obtain an animal ethics license. In addition, the species captured in this study are not protected in China and none of the captured species are included in the China Species Red List.

3. Results

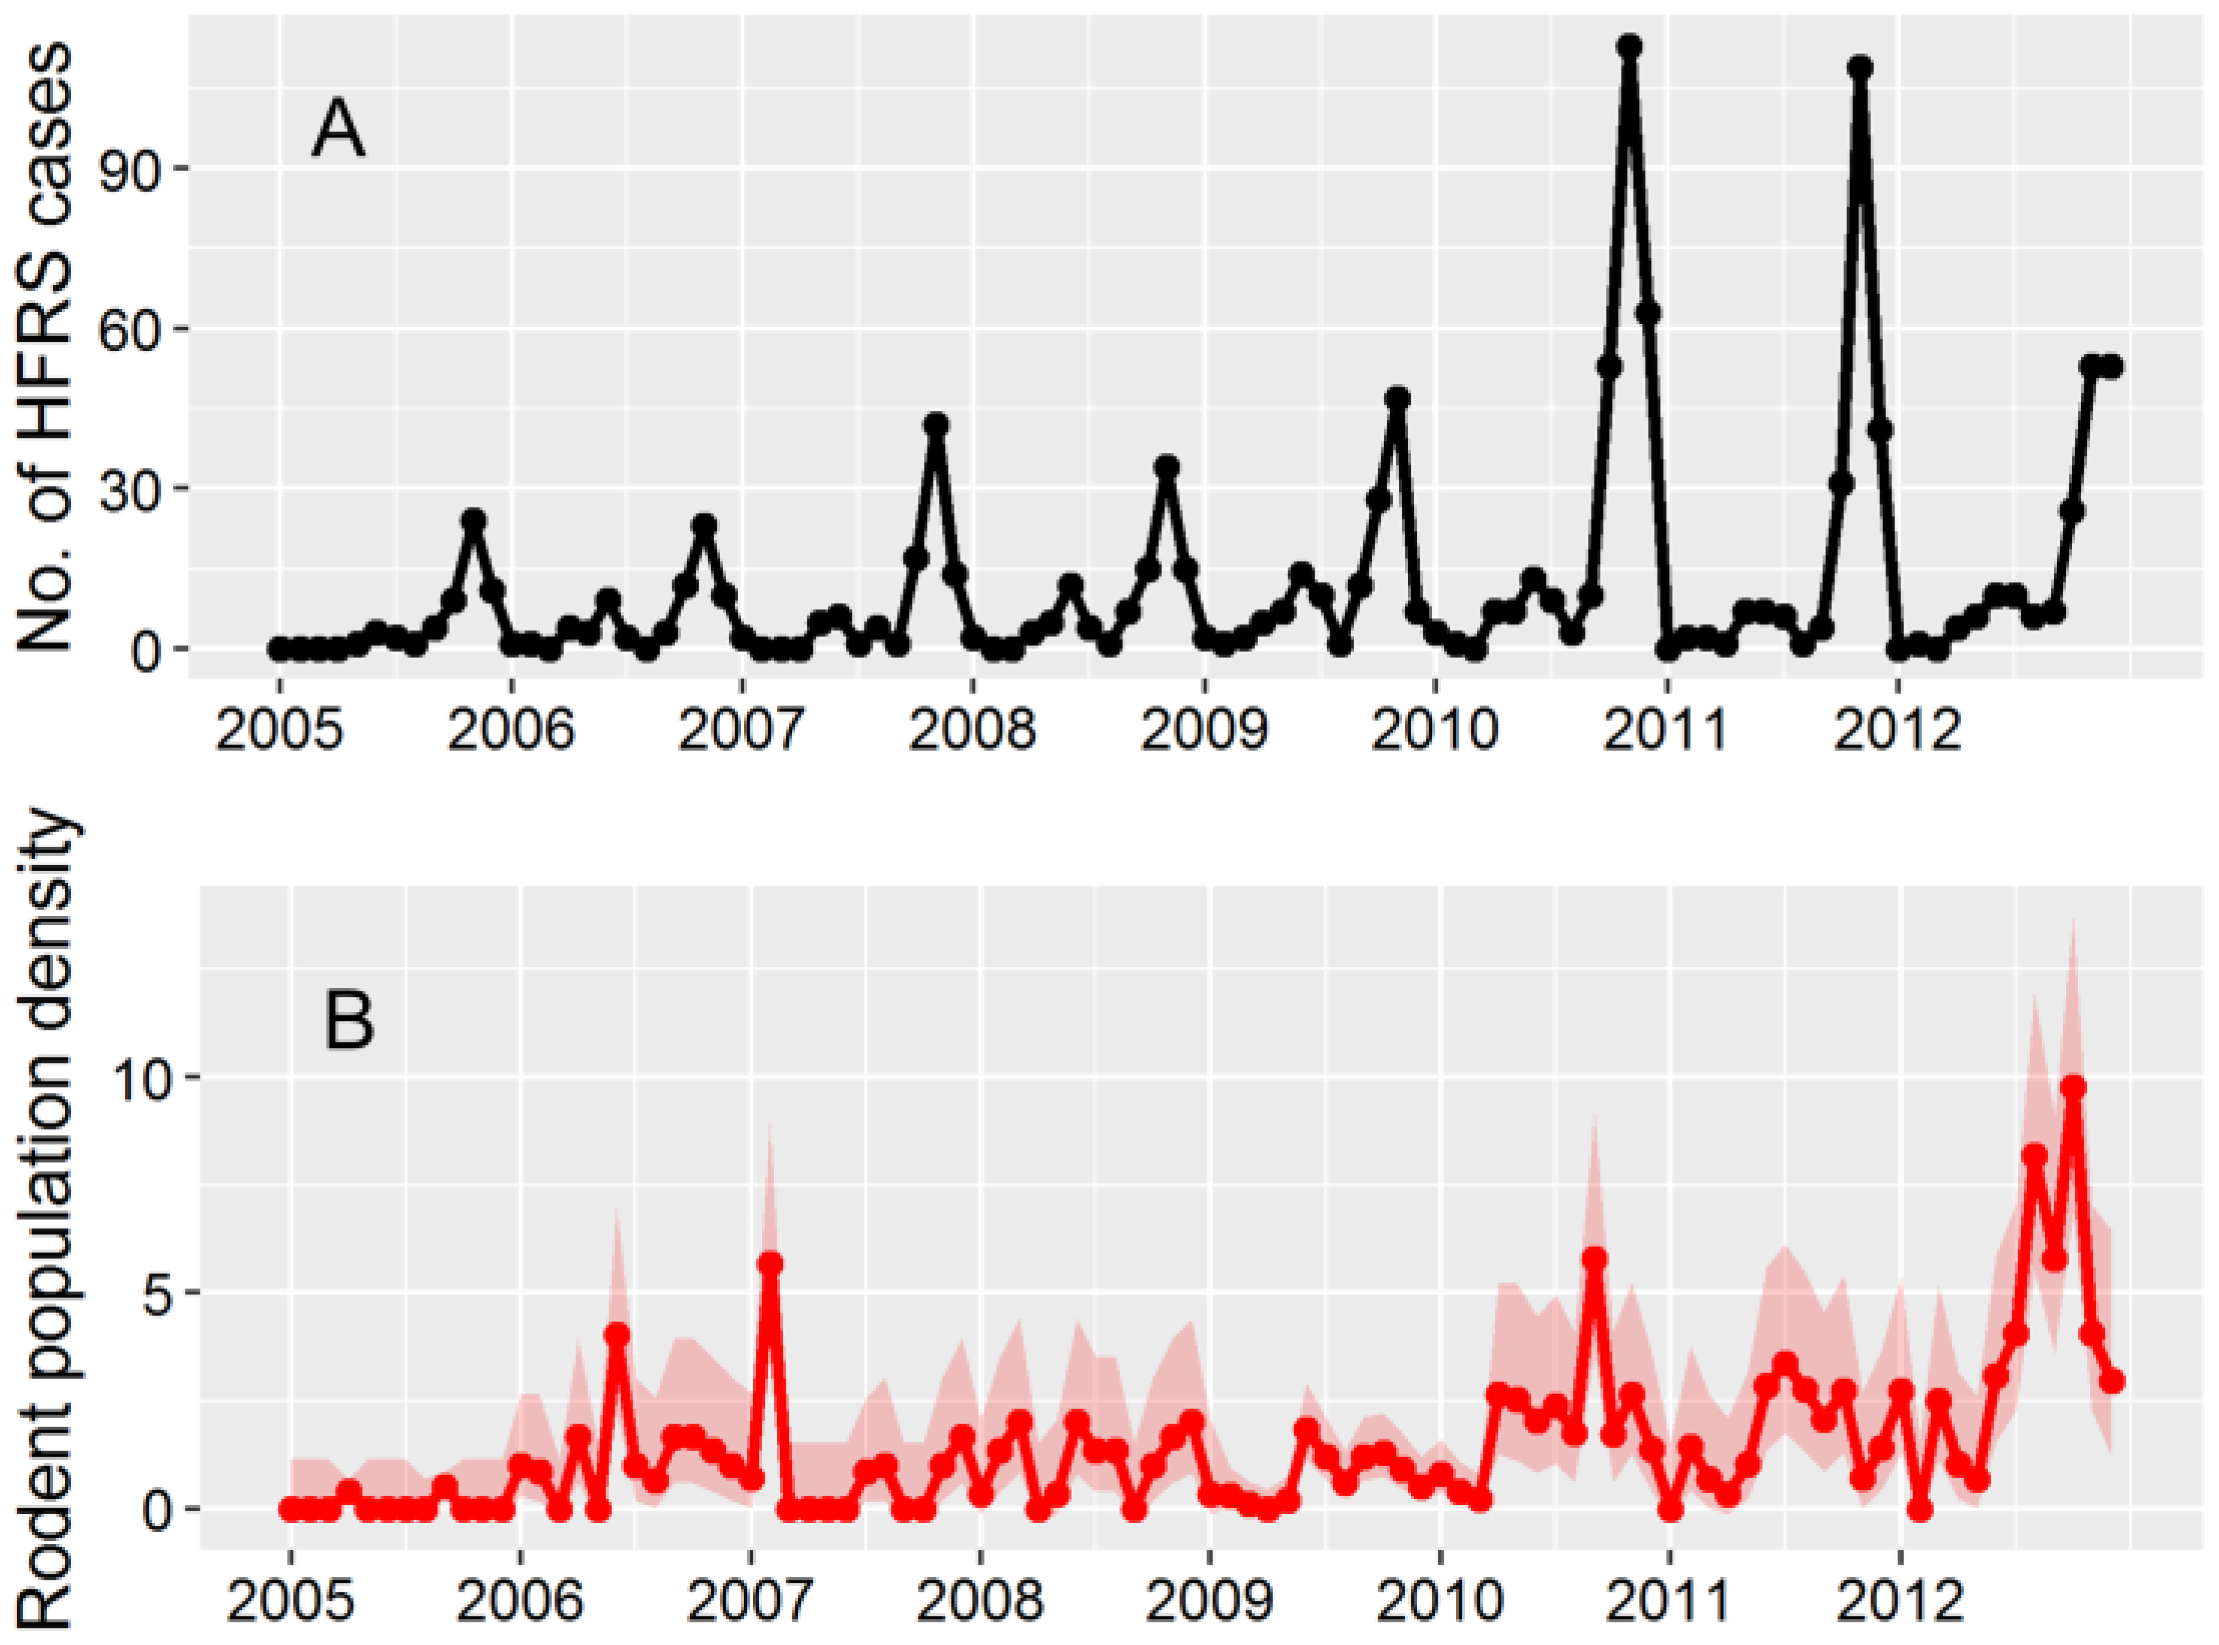
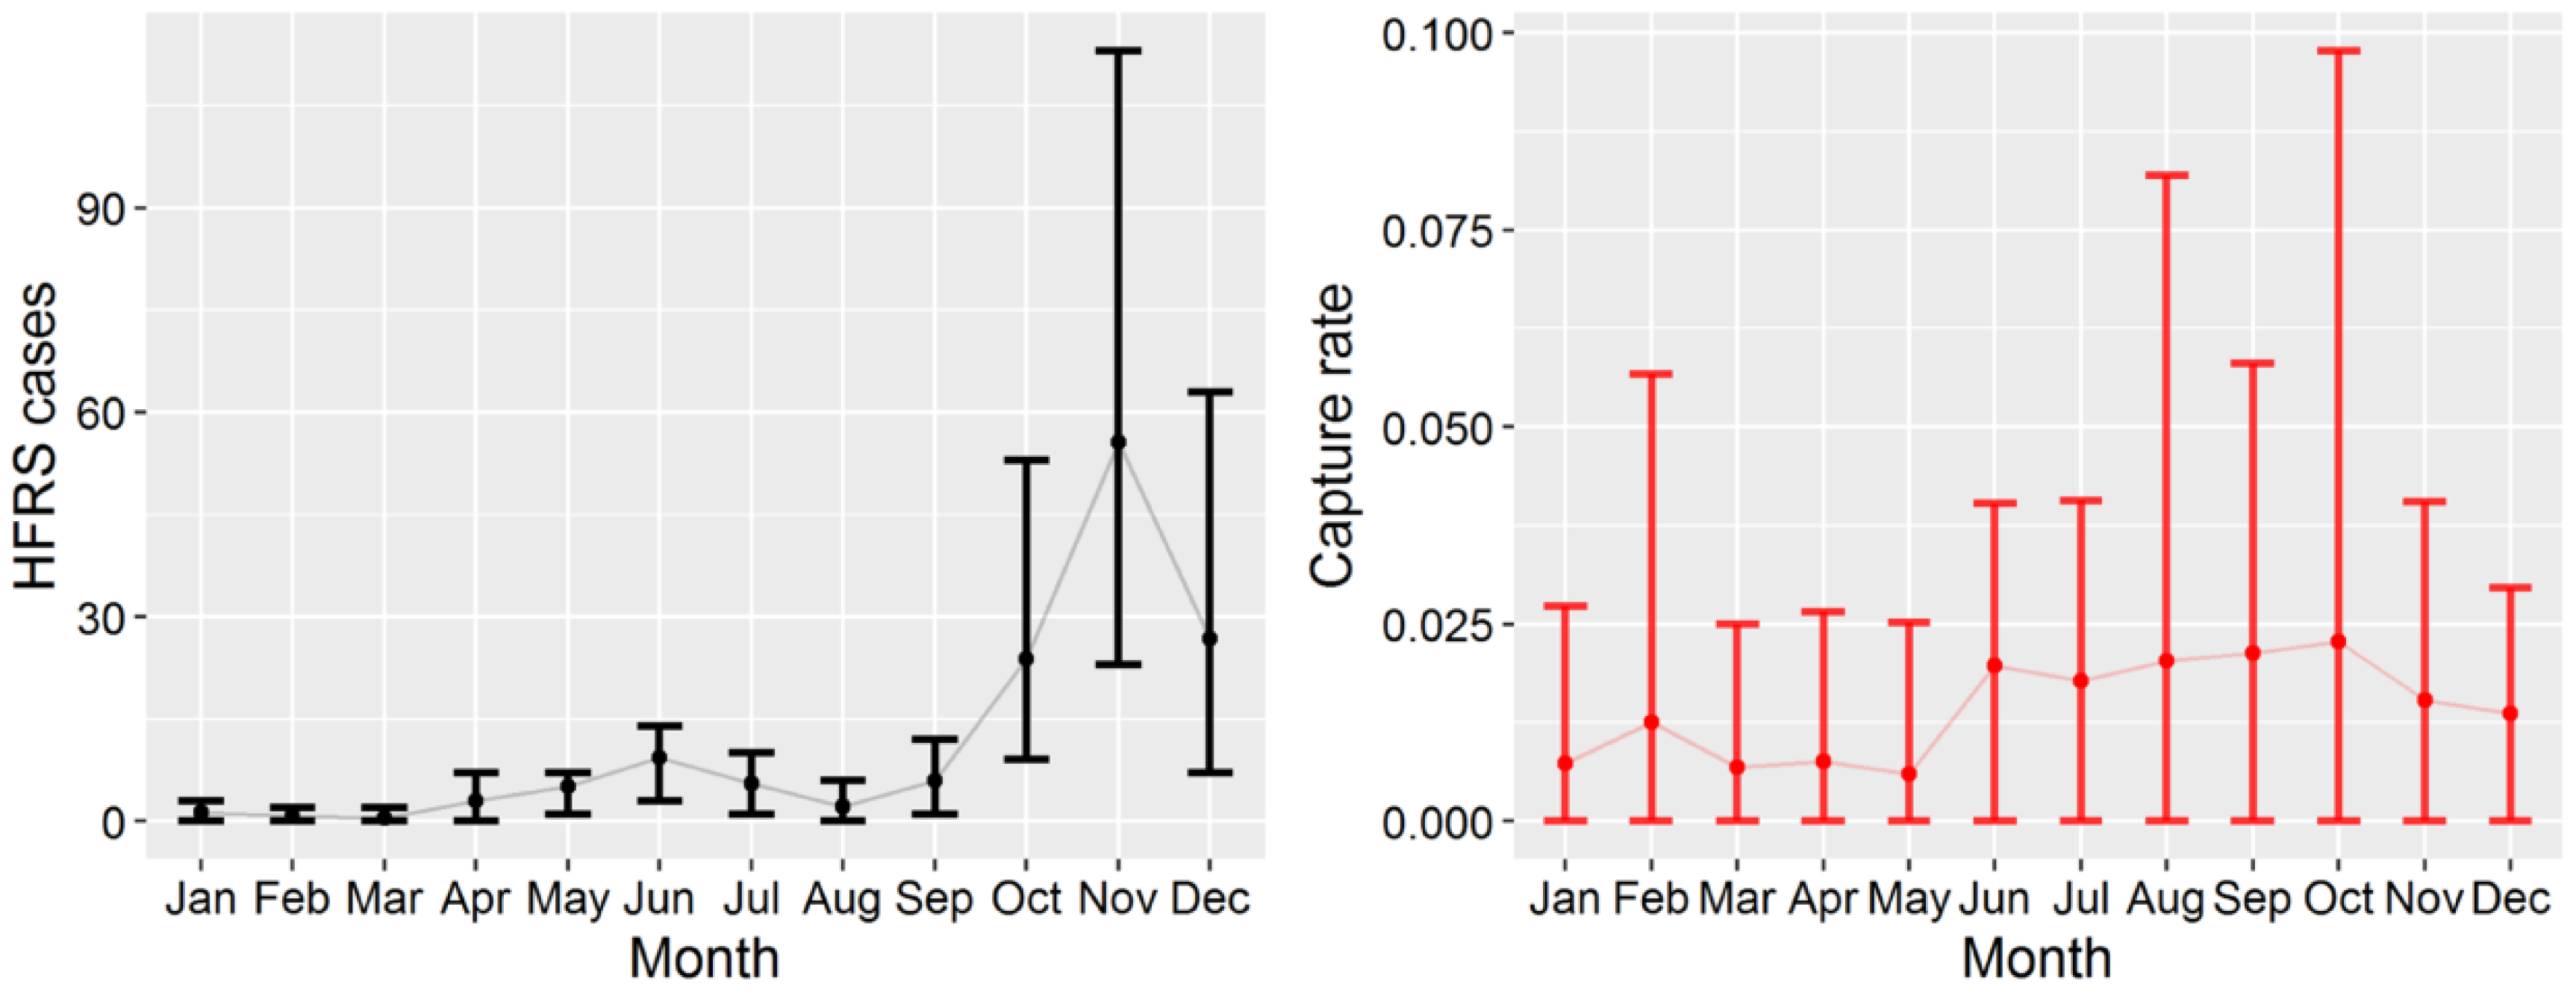
3.1. HFRS Epidemics in Hu County, 2005–2012

Hu County is an area with a high incidence of HFRS and a population of about 0.61 million on the Weihe Plain (Figure 1). HFRS epidemics have occurred every year between 2005 and 2012, with varying magnitude. A total of 1118 HFRS cases were confirmed in Hu County between 2005 and 2012. The annual incidence of HFRS continued to increase (Table 2). Two outbreaks in 2010 and 2011 were larger than usual, with 282 and 211 cases being reported, respectively (Figure 2). The monthly distribution of HFRS cases indicated that HFRS incidence was higher in the second half of the year, and peaked from October to December (Figure 3 and Figure 4).

3.2. Apodemus Agrarius Population Dynamics and Temporal Pattern of HFRS

During the study, 365 A. agrarius were captured on 41,764 trap-nights, with a capture rate of 0.9 individuals per hundred trap-nights. The population density of A. agrarius varied both seasonally and among years. Trap success decreased during the late autumn and winter and increased during the spring and the annual peak of rodent density was from August to October (Figure 3). The seasonal distribution of HFRS cases always showed a relatively high peak in November and a lower peak in June (Figure 3). Both the seasonality and the result of cross-correlation analysis (Table 3) indicated that the monthly number of HFRS cases was positively correlated with rodent density, with a 1–5 month lag.

3.3. Correlations Between Remote Sensing-Based Indicators and Apodemus Agrarius Population Density

Figure 5 shows that the maximum cross-correlation coefficient indicates that PsnNet, at a lag of 3 months, appears to play a role in rodent population density. The results (Figure 6) indicated that the population density of A. agrarius was positively correlated with NDVI, GPP and PsnNet, with a lag of 2 months, 2–3 months and 2–3 months, respectively. The population density of A. agrarius was negatively correlated with LST, with a 6-month lag. The highest correlation coefficient was for the relationship between the capture rate of A. agrarius and PsnNet, with a 3-month lag (r = 0.46, p < 0.01). The PsnNet was high on an annual basis during March to September, which was the breeding season for A. agrarius, although the value of PsnNet in June was low due to the spring harvest. The capture rate of A. agrarius was relatively high in the breeding season and relatively low over the winter period, from December to February. Therefore, the results indicated that the seasonal pattern of PsnNet peaked and coincided with the capture rate of A. agrarius.

3.4. Correlations Between Remote Sensing-Based Indicators and Other Rodent Species

An additional analysis was conducted to test the relationship between the indicators illustrated above and population densities of the brown rat (Rattus norvegicus). This species lives close to humans and does not rely on farm crops. The results indicated that the capture rate of R. norvegicus was not associated with any of the indicators over a 1–6-month lag. (Figure 6), which showed that the relationships between the capture rate of A. agrarius and these indicators were unlikely to occur due to chance alone.

3.5. Structure Equation Model for Incidence of HFRS with Rodent Population Density and PsnNet

The SEM (Figure 7) indicated that PsnNet in the previous months was significantly and positively correlated with the rodent population density and the incidence of HFRS. Similarly, the rodent population density was positively associated with the incidence of HFRS in the following months. This showed the indirect effect of PsnNet on incidences of HFRS.

4. Discussion

The importance of zoonoses is increasingly recognized, and disease early warning-systems are currently receiving considerable research attention [34,35]. Previous work has demonstrated that environmental conditions monitored by satellite imagery, including vegetation cover, landscape structure, soil moisture and water bodies [36,37,38], could be a potential information source for studying the ecology of zoonotic diseases, such as vector-borne and rodent-borne diseases [16,39,40], because the environmental conditions characterized by remote sensing images are considered to be linked to reservoir host habitats or pathogen infection risks.
In this study, we evaluated the environmental conditions of farmland systems at field sites on the Weihe Plain that may be inhabited by HTNV rodent hosts, using MODIS products. We collected data during field campaigns, which provided strong evidence that the apparent time lag between the end of rodent host breeding [41] and subsequent HFRS peaks in humans was related to a biological process. In farmland with a simple vegetation structure, we found a higher correlation between A. agrarius population density and PsnNet than between A. agrarius population density and NDVI. This was not unexpected, because the impact of interannual fluctuations in crop output, which affects population density, is likely to be reflected by PsnNet.
HFRS is still a serious disease in mainland China, which accounts for 90% of the cases reported globally [42]. In mainland China, HTNV and Seoul virus (SEOV), the major causative agents of HFRS, are carried by A. agrarius (which thrives in rural areas) and R. norvegicus (which thrives in urban areas), respectively [43,44]. During the 96 months of trapping in the study area, A. agrarius was the most frequently captured rodent species and the dominant species in the study area [45]. We applied a structure equation model to test the trophic cascade hypothesis in the farmland systems of central China, which supported the finding that primary productivity may affect rodent demography with a time lag. We inferred that the time lags might be due to the time needed for crop growth and rodent breeding activities to be seen in the trappable population. It follows that there would be a further few months after rodent demography was affected until the human-wildlife contact pattern was affected. It was, therefore, seen that the environmental variable, PsnNet, which represented the food availability for small rodents [46,47] would be a useful indicator for natural HTNV infection warnings in this focal area of China.
As climate variability plays an important role in shaping A. agrarius population dynamics (and also those of other rodent species), as has been suggested by several previous studies [48,49,50,51], the complex linkages between farmland conditions, A. agrarius abundance, and climatic conditions should be studied in the future. Also, due to the various types of climate and habitat, further analyses and validation are needed for other endemic areas of China. Finally, we must acknowledge the limitations of this study. As the virus prevalence in rodent hosts affects disease dynamics, the epidemiology of HTNV should also be considered.

5. Conclusions

Our study is an encouraging step towards an early warning approach that can predict the risk of hantavirus infection because fluctuations in the abundance of the rodent reservoir can be estimated from satellite imagery, which provides an effective method for monitoring environmental conditions on a large scale. The trophic cascade hypothesis has been validated in our study area by using satellite and filed surveillance data. Vegetation productivity (farmland land condition, represented by PsnNet) was shown to act as an important driver for increases in the abundance of hantavirus reservoir (A. agrarius), with a 3-month lag.
In conclusion, we have shown that the risk of HFRS is closely related to environmental variability and remote sensing could be critical for effective risk prediction and public health applications. This approach offers a valuable basis to develop a less costly but effective warning system to prevent HFRS outbreaks in our study area, Hu County. Additionally, the utility of remote sensing for real-time environmental condition observation provides health authorities plenty of time to develop targeted strategies for the control and prevention against the risk of HFRS.

Acknowledgments

We thank the hundreds of CDC staff and local health workers in Shaanxi Province who collected data during 2005–2012. Funding has been provided by the National Key Research and Development Program of China (2016YFA0600104), Health industry research special funds for public welfare projects (201502020), the National Natural Science Foundation of China (81673234, 71473264), Shaanxi Provincial Projects for Serious Disease Prevention and Control (0617-15240415), the Science and Technology Project of Shaanxi Province (2014-E1, 2013K12-04-02), and the Fundamental Research Funds for the Central Universities.

Author Contributions

P.Y., Y.L., and H.T. performed analyses, H.T., N.C.S, and B.X. conceived the study, H.T. and Y.L. wrote the paper, B.X. and J.Y. collected and analyzed the remote sensing data, J.Y., Z.H., B.C., C.M., J.W., S.L., J.Q., S.H., C.S, H.G., G.Z., Q.Y., C.S., H.G. and P.Y. contributed materials. C.M., J.W., S.L., J Q., S.H., F.L., J.W., and P.Y. collected field data during 2005–2012. All authors commented on and edited the paper.

Conflicts of interest

The authors declare no conflict of interest. The funders had no role in study design, data collection and analysis, decision to publish, or preparation of the manuscript.

References

  1. Tian, H.; Yu, P.; Bjørnstad, O.N.; Cazelles, B.; Yang, J.; Tan, H.; Huang, S.; Cui, Y.; Dong, L.; Ma, C. Anthropogenically driven environmental changes shift the ecological dynamics of hemorrhagic fever with renal syndrome. PLoS Pathog. 2017, 13, e1006198. [Google Scholar] [CrossRef] [PubMed]
  2. Yu, P.; Tian, H.; Ma, C.; Ma, C.; Wei, J.; Lu, X.; Wang, Z.; Zhou, S.; Li, S.; Dong, J. Hantavirus infection in rodents and haemorrhagic fever with renal syndrome in Shaanxi Province, China, 1984–2012. Epidemiol. Infect. 2015, 143, 405–411. [Google Scholar] [CrossRef] [PubMed]
  3. Jonsson, C.B.; Figueiredo, L.T.M.; Vapalahti, O. A global perspective on Hantavirus ecology, epidemiology, and disease. Clin. Microbiol. Rev. 2010, 23, 412–441. [Google Scholar] [CrossRef] [PubMed]
  4. Khaiboullina, S.F.; Morzunov, S.P.; St Jeor, S.C. Hantaviruses: Molecular biology, evolution and pathogenesis. Curr. Mol. Med. 2005, 5, 773–790. [Google Scholar] [CrossRef] [PubMed]
  5. Childs, J.E.; Glass, G.E.; Korch, G.W.; LeDuc, J.W. Prospective seroepidemiology of Hantaviruses and population dynamics of small mammal communities of Baltimore, Maryland. Am. J. Trop. Med. Hyg. 1987, 37, 648–662. [Google Scholar] [CrossRef] [PubMed]
  6. Lee, P.; Amyx, H.L.; Gibbs, C.; Gajdusek, D.; Lee, H. Propagation of Korean hemorrhagic fever virus in laboratory rats. Infect. Immun. 1981, 31, 334–338. [Google Scholar] [PubMed]
  7. Yang, Z. The research progress of HFRS transmission routes. Pract. J. Med. Pharm. 2005, 22, 69–71. [Google Scholar]
  8. Mills, J.N.; Yates, T.L.; Ksiazek, T.G.; Peters, C.; Childs, J.E. Long-term studies of Hantavirus reservoir populations in the Southwestern United States: Rationale, potential, and methods. Emerg. Infect. Dis. 1999, 5, 95–101. [Google Scholar] [CrossRef] [PubMed]
  9. Luis, A.D.; Douglass, R.J.; Mills, J.N.; Bjørnstad, O.N. Environmental fluctuations lead to predictability in sin Nombre Hantavirus outbreaks. Ecology 2015, 96, 1691–1701. [Google Scholar] [CrossRef]
  10. Zhang, W.Y.; Fang, L.Q.; Jiang, J.F.; Hui, F.M.; Glass, G.E.; Yan, L.; Xu, Y.F.; Zhao, W.J.; Yang, H.; Liu, W.; et al. Predicting the risk of hantavirus infection in Beijing, People's Republic of China. Am. J. Trop. Med. Hyg. 2009, 80, 678–683. [Google Scholar] [PubMed]
  11. Lee, H.W.; Lee, P.W.; Johnson, K.M. Isolation of the etiologic agent of Korean hemorrhagic fever. J. Infect. Dis. 1978, 137, 298–308. [Google Scholar] [CrossRef] [PubMed]
  12. Yates, T.L.; Mills, J.N.; Parmenter, C.A.; Ksiazek, T.G.; Parmenter, R.R.; Vande Castle, J.R.; Calisher, C.H.; Nichol, S.T.; Abbott, K.D.; Young, J.C.; et al. The ecology and evolutionary history of an emergent disease: Hantavirus Pulmonary Syndromeevidence from two el niño episodes in the American southwest suggests that el niño–driven precipitation, the initial catalyst of a trophic cascade that results in a delayed density-dependent rodent response, is sufficient to predict heightened risk for human contraction of Hantavirus Pulmonary Syndrome. BioScience 2002, 52, 989–998. [Google Scholar]
  13. Ken, D.A.; Thomas, G.K.; James, N.M. Long-term Hantavirus persistence in rodent populations in central Arizona. Emerg. Infect. Dis. J. 1999, 5, 102. [Google Scholar]
  14. Mills, J.N.; Ksiazek, T.G.; Ellis, B.A.; Rollin, P.E.; Nichol, S.T.; Yates, T.L.; Gannon, W.L.; Levy, C.E.; Engelthaler, D.M.; Davis, T. Patterns of association with host and habitat: antibody reactive with Sin Nombre virus in small mammals in the major biotic communities of the southwestern United States. Am. J. Trop. Med. Hyg. 1997, 56, 273–284. [Google Scholar] [CrossRef] [PubMed]
  15. Glass, G.E.; Cheek, J.E.; Patz, J.A.; Shields, T.M.; Doyle, T.J.; Thoroughman, D.A.; Hunt, D.K.; Enscore, R.E.; Gage, K.L.; Irland, C. Using remotely sensed data to identify areas at risk for Hantavirus Pulmonary Syndrome. Emerg. Infect. Dis. 2000, 6, 238–247. [Google Scholar] [CrossRef] [PubMed]
  16. Glass, G.E.; Yates, T.L.; Fine, J.B.; Shields, T.M.; Kendall, J.B.; Hope, A.G.; Parmenter, C.A.; Peters, C.; Ksiazek, T.G.; Li, C.H. Satellite imagery characterizes local animal reservoir populations of sin Nombre virus in the Southwestern United States. Proc. Natl. Acad. Sci. USA 2002, 99, 16817–16822. [Google Scholar] [CrossRef] [PubMed]
  17. Glass, G.E.; Shields, T.; Cai, B.; Yates, T.L.; Parmenter, R. Persistently highest risk areas for Hantavirus pulmonary syndrome: Potential sites for Refugia. Ecol. Appl. 2007, 17, 129–139. [Google Scholar] [CrossRef]
  18. Boone, J.D.; McGwire, K.C.; Otteson, E.W.; DeBaca, R.S.; Kuhn, E.A.; Villard, P.; Brussard, P.F.; St Jeor, S. Remote sensing and geographic information systems: Charting sin Nombre virus infections in deer mice. Emerg. Infect. Dis. 2000, 6, 248–258. [Google Scholar] [CrossRef] [PubMed]
  19. Boone, J.D.; Otteson, E.W.; McGwire, K.C.; Villard, P.; Rowe, J.E.; St Jeor, S. Ecology and demographics of Hantavirus infections in rodent populations in the walker river basin of Nevada and California. Am. J. Trop. Med. Hyg. 1998, 59, 445–451. [Google Scholar] [CrossRef] [PubMed]
  20. Wei, L.; Qian, Q.; Wang, Z.Q.; Glass, G.E.; Song, S.X.; Zhang, W.Y.; Li, X.J.; Yang, H.; Wang, X.J.; Fang, L.Q. Using geographic information system-based ecologic niche models to forecast the risk of hantavirus infection in Shandong Province, China. Am. J. Trop. Med. Hyg. 2011, 84, 497–503. [Google Scholar] [CrossRef] [PubMed]
  21. Goodin, D.G.; Koch, D.E.; Owen, R.D.; Chu, Y.K.; Hutchinson, J.; Jonsson, C.B. Land cover associated with Hantavirus presence in Paraguay. Global Ecol. Biogeogr. 2006, 15, 519–527. [Google Scholar] [CrossRef]
  22. Yan, L.; Huang, H.; Zhang, W.; Wang, J.; Ren, Y.; Fang, L.; Huang, X.; Cao, W.; Yan, S.; Wang, S. The relationship between hemorrhagic fever with renal syndrome cases and time series of NDVI in Dayangshu district. J. Remote Sens. 2009, 13, 873–886. [Google Scholar]
  23. Chen, H.; Qiu, F. Epidemiologic surveillance on the hemorrhagic fever with renal syndrome in China. Chin. Med. J. 1993, 106, 857–863. [Google Scholar] [PubMed]
  24. Ministry of Health. Handbook of Epidemic Hemorrhagic Fever Prevention and Control; China People’s Health Publishing House: Beijing, China, 1998. [Google Scholar]
  25. Carlson, T.N.; Ripley, D.A. On the relation between NDVI, fractional vegetation cover, and leaf area index. Remote Sens. Environ. 1997, 62, 241–252. [Google Scholar] [CrossRef]
  26. Wiegand, C.; Richardson, A.; Escobar, D.; Gerbermann, A. Vegetation indices in crop assessments. Remote Sens. Environ. 1991, 35, 105–119. [Google Scholar] [CrossRef]
  27. Zhao, M.; Heinsch, F.A.; Nemani, R.R.; Running, S.W. Improvements of the MODIS terrestrial gross and net primary production global data set. Remote Sens. Environ. 2005, 95, 164–176. [Google Scholar] [CrossRef]
  28. Running, S.W.; Nemani, R.R.; Heinsch, F.A.; Zhao, M.; Reeves, M.; Hashimoto, H. A continuous satellite-derived measure of global terrestrial primary production. Bioscience 2004, 54, 547–560. [Google Scholar] [CrossRef]
  29. Nachtigall, C.; Kroehne, U. (why) should we use SEM?—Pros and cons of Structural Equation Modeling. Methods Psychol. Res. 2003, 8, 1–22. [Google Scholar]
  30. Xu, L.; Schmid, B.V.; Liu, J.; Si, X.; Stenseth, N.C.; Zhang, Z. The trophic responses of two different rodent–vector–plague systems to climate change. Proc. R. Soc. B 2015, 282, 20141846. [Google Scholar] [CrossRef] [PubMed]
  31. Guan, P.; Huang, D.; He, M.; Shen, T.; Guo, J.; Zhou, B. Investigating the effects of climatic variables and reservoir on the incidence of hemorrhagic fever with renal syndrome in Huludao city, China: A 17-year data analysis based on structure equation model. BMC Infect. Dis. 2009, 9, 109. [Google Scholar] [CrossRef] [PubMed]
  32. PM, B. Comparative fit indexes in structural models. Psychol. Bull. 1990, 107, 238–246. [Google Scholar]
  33. Zeier, M.; Handermann, M.; Bahr, U.; Rensch, B.; Müller, S.; Kehm, R.; Muranyi, W.; Darai, G. New ecological aspects of Hantavirus infection: A change of a paradigm and a challenge of prevention—A review. Virus Genes 2005, 30, 157–180. [Google Scholar] [CrossRef] [PubMed]
  34. Kausrud, K.L.; Viljugrein, H.; Frigessi, A.; Begon, M.; Davis, S.; Leirs, H.; Dubyanskiy, V.; Stenseth, N.C. Climatically driven synchrony of gerbil populations allows large-scale plague outbreaks. Proc. Biol. Sci. 2007, 274, 1963–1969. [Google Scholar] [CrossRef] [PubMed]
  35. Morse, S.S.; Mazet, J.A.; Woolhouse, M.; Parrish, C.R.; Carroll, D.; Karesh, W.B.; Zambrana-Torrelio, C.; Lipkin, W.I.; Daszak, P. Prediction and prevention of the next pandemic zoonosis. Lancet 2012, 380, 1956–1965. [Google Scholar] [CrossRef]
  36. Xiao, H.; Huang, R.; Gao, L.-D.; Huang, C.-R.; Lin, X.-L.; Li, N.; Liu, H.-N.; Tong, S.-L.; Tian, H.-Y. Effects of humidity variation on the hantavirus infection and hemorrhagic fever with renal syndrome occurrence in Subtropical China. Am. J. Trop. Med. Hyg. 2016, 94, 420–427. [Google Scholar] [CrossRef] [PubMed]
  37. Tian, H.; Huang, S.; Zhou, S.; Bi, P.; Yang, Z.; Li, X.; Chen, L.; Cazelles, B.; Yang, J.; Luo, L.; et al. Surface water areas significantly impacted 2014 dengue outbreaks in Guangzhou, China. Environ. Res. 2016, 150, 299–305. [Google Scholar] [CrossRef] [PubMed]
  38. Beck, L.R.; Lobitz, B.M.; Wood, B.L. Remote sensing and human health: New sensors and new opportunities. Emerg. Infect. Dis. 2000, 6, 217–227. [Google Scholar] [CrossRef] [PubMed]
  39. Addink, E.; De Jong, S.; Davis, S.; Dubyanskiy, V.; Burdelov, L.; Leirs, H. The use of high-resolution remote sensing for plague surveillance in Kazakhstan. Remote Sens. Environ. 2010, 114, 674–681. [Google Scholar] [CrossRef]
  40. Curran, P.J.; Atkinson, P.M.; Foody, G.M.; Milton, E. Linking remote sensing, land cover and disease. Adv. Parasitol. 2000, 47, 37–80. [Google Scholar] [PubMed]
  41. Ma, Z.C.; Liu, Z.Y.; Yang, Q.Y.; Ma, H.M.; Di, C.; Xie, X.M. Occurrence regularity of apodemus agrarius and its control technique in Guanzhong area, Shaanxi. Chin. Countrys. Well-off Technol. 2008, 14, 51–54. (In Chinese) [Google Scholar]
  42. Luo, C.W.; Chen, H.X. Study on the factors infl uenced epidemic of hemorrhagic fever with renal syndrome. Chin. J. Vector Biol. Control 2003, 14, 4. [Google Scholar]
  43. Yan, L.; Fang, L.Q.; Huang, H.G.; Zhang, L.Q.; Feng, D.; Zhao, W.J.; Zhang, W.Y.; Li, X.W.; Cao, W.C. Landscape elements and Hantaan virus–related hemorrhagic fever with renal syndrome, People’s Republic of China. Emerg. Infect. Dis. 2007, 13, 1301–1306. [Google Scholar] [CrossRef] [PubMed]
  44. Fang, L.; Yan, L.; Liang, S.; de Vlas, S.; Feng, D.; Han, X.; Zhao, W.; Xu, B.; Bian, L.; Yang, H. Spatial analysis of hemorrhagic fever with renal syndrome in China. BMC Infect. Dis. 2006, 6, 77. [Google Scholar] [CrossRef] [PubMed] [Green Version]
  45. Tian, H.; Yu, P.; Luis, A.D.; Bi, P.; Cazelles, B.; Laine, M.; Huang, S.; Ma, C.; Zhou, S.; Wei, J. Changes in rodent abundance and weather conditions potentially drive hemorrhagic fever with renal syndrome outbreaks in Xi'an, China, 2005–2012. PLoS Negl. Trop. Dis. 2015, 9, e0003530. [Google Scholar] [CrossRef] [PubMed]
  46. Chelkowska, H.; Walkowa, W.; Adamczyk, K. Spatial relationships in sympatric populations of the rodents: Clethrionomys glareolus, microtus agrestis and apodemus agrarius. Acta Theriol. 1985, 30, 51–58. [Google Scholar] [CrossRef]
  47. Krebs, M.A. Effects of Understory Vegetation on the Photosynthesis and Leaf Water Potential of Young Douglas Fir Trees on Two Contrasting Sites in Northwestern Montana; The University of Montana: Missoula, MT, USA, 2003. [Google Scholar]
  48. Luis, A.D.; Douglass, R.J.; Mills, J.N.; Bjørnstad, O.N. The effect of seasonality, density and climate on the population dynamics of Montana deer mice, important reservoir hosts for sin Nombre Hantavirus. J. Anim. Ecol. 2010, 79, 462–470. [Google Scholar] [CrossRef] [PubMed]
  49. Stenseth, N.C.; Mysterud, A.; Ottersen, G.; Hurrell, J.W.; Chan, K.S.; Lima, M. Ecological effects of climate fluctuations. Science 2002, 297, 1292–1296. [Google Scholar] [CrossRef] [PubMed]
  50. Kausrud, K.L.; Mysterud, A.; Steen, H.; Vik, J.O.; Østbye, E.; Cazelles, B.; Framstad, E.; Eikeset, A.M.; Mysterud, I.; Solhøy, T. Linking climate change to lemming cycles. Nature 2008, 456, 93–97. [Google Scholar] [CrossRef] [PubMed]
  51. Yan, C.; Xu, L.; Xu, T.; Cao, X.; Wang, F.; Wang, S.; Hao, S.; Yang, H.; Zhang, Z. Agricultural irrigation mediates climatic effects and density dependence in population dynamics of Chinese striped hamster in North China plain. J. Anim. Ecol. 2013, 82, 334–344. [Google Scholar] [CrossRef] [PubMed]
Figure 1. Land cover map of the Weihe Plain, Shaanxi Province, Central China. The black box indicates the study area, Hu County. We obtained this land cover data from GlobCover 2009 v2.3 (ESA Globcover Project; http://due.esrin.esa.int/globcover/). The black circles represent rodent sampling sites. Characteristics of the landscape in Hu County trapping web. Photo courtesy of P. Yu. Schematic representation of the rodent-trapping site. Traps were spaced at ~5-m intervals.
Remotesensing 09 01076 g001
Figure 2. Epidemic pattern of hemorrhagic fever with renal syndrome (HFRS) in Hu County, 2005–2012. (A) Number of monthly reported HFRS cases. (B) The time series of Apodemus agrarius population density (capture rate); the shaded areas indicate binomial 95% confidence intervals using the Agresti-Coull method. Capture rates are expressed as number of rodents caught per 100 trap-nights.
Remotesensing 09 01076 g002
Figure 3. Average seasonal distribution of hemorrhagic fever with renal syndrome (HFRS) cases and capture rate of Apodemus agrarius in Hu County, 2005–2012. Error bars show the maximum and minimum values.
Remotesensing 09 01076 g003
Figure 4. Remote sensing-based indicators of crop-land in Hu County. NDVI, normalized difference vegetation index; FPAR, fraction of photosynthetically active radiation absorbed by vegetation; LAI, leaf area index; GPP, gross primary productivity; PsnNet, net photosynthesis; LST, land surface temperature.
Remotesensing 09 01076 g004
Figure 5. Cross-correlation between rodent population density and net photosynthesis (PsnNet).
Remotesensing 09 01076 g005
Figure 6. Correlation matrix of environmental factors and capture rate of Apodemus agrarius (left) and Rattus norvegicus (right). Every correlation coefficient that matched two variables was calculated with Pearson’s method in R. AA, Apodemus agrarius; RN, Rattus norvegicus; NDVI, normalized difference vegetation index; FPAR, fraction of photosynthetically active radiation absorbed by vegetation; LAI, leaf area index; GPP, gross primary productivity; PsnNet, net photosynthesis; LST, land surface temperature. Numbers ranging from −1 to 1 are Pearson’s correlation coefficients of variables on horizontal and vertical axes. The color and size of circles indicate the correlation significance. Only significant statistics (p < 0.05) are shown.
Remotesensing 09 01076 g006
Figure 7. Structural equation model for net photosynthesis (PsnNet), rodent population density and incidence of hemorrhagic fever with renal syndrome (HFRS). (χ2 = 2.34, CFI = 0.97). * Parameter is significant at the 0.05 level. ** Parameter is significant at the 0.01 level.
Remotesensing 09 01076 g007
Table 1. Satellite data used in this study.
MODIS Land ProductIndicatorSpatial Resolution Temporal ResolutionTemporal Period
MOD13A2NDVI1-km16-day2005–2012
MOD15A2LAI1-km8-day2005–2012
MOD15A2FPAR1-km8-day2005–2012
MOD17A2GPP1-km8-day2005–2012
MOD17A2PsnNet1-km8-day2005–2012
MOD11A2LST1-km8-day2005–2012
Table 2. Annual incidence of hemorrhagic fever with renal syndrome (HFRS) from 2005 to 2012.
Year20052006200720082009201020112012
Incidence of HFRS (1/10, 000)0.901.111.511.612.234.623.462.64
Table 3. Cross-correlations between the number of hemorrhagic fever with renal syndrome (HFRS) cases and the rodent population density.
Lag (month)0123456
r0.190.31 **0.41 **0.42 **0.39 **0.31 **0.13
** p < 0.01.

