Enhanced Resolution of Microwave Sounder Imagery through Fusion with Infrared Sensor Data
by
Igor Yanovsky
1,2,*, 
Ali Behrangi
1,
Yixin Wen
1,
Mathias Schreier
1,
Van Dang
3 and
Bjorn Lambrigtsen
1 1
Jet Propulsion Laboratory, California Institute of Technology, Pasadena, CA 91109, USA
2
Joint Institute for Regional Earth System Science and Engineering, University of California, Los Angeles, CA 90095, USA
3
Remote Sensing Solutions Inc., Monrovia, CA 91016, USA
*
Author to whom correspondence should be addressed.
Remote Sens. 2017, 9(11), 1097; https://doi.org/10.3390/rs9111097
Submission received: 29 August 2017
/
Revised: 10 October 2017
/
Accepted: 24 October 2017
/
Published: 27 October 2017
(This article belongs to the Special Issue Remote Sensing Precipitation Measurement, Validation, and Applications)
Abstract
:The images acquired by microwave sensors are blurry and have low resolution. On the other hand, the images obtained using infrared/visible sensors are often of higher resolution. In this paper, we develop a data fusion methodology and apply it to enhance the resolution of a microwave image using the data from a collocated infrared/visible sensor. Such an approach takes advantage of the spatial resolution of the infrared instrument and the sensing accuracy of the microwave instrument. The model leverages sparsity in signals and is based on current research in sparse optimization and compressed sensing. We tested our method using a precipitation scene captured with the Advanced Microwave Sounding Unit (AMSU-B) microwave instrument and the Advanced Very High Resolution Radiometer (AVHRR) infrared instrument and compared the results to simultaneous radar observations. We show that the data fusion product is better than the original AMSU-B and AVHRR observations across all statistical indicators.

1. Introduction
Microwave sensors are able to penetrate through thick clouds to see the structure of a storm. The images collected are valuable for evaluating the storm’s internal processes and its strength. However, the data (e.g., brightness temperatures) acquired by microwave (MW) sensors are blurry and of low-resolution, and thus all derived products, including rain rates will share that characteristic. On the other hand, the images obtained using infrared/visible sensors (IR/Vis), and their corresponding products can offer higher resolution but with negligible ability to penetrate into clouds. In some cases, we can use the data from a collocated infrared/visible sensor to increase the resolution of a microwave image.
We considered the deconvolution inverse problem in [1], where we deblurred images from the effects of a point spread function. Additionally, in [1], we developed a simultaneous deconvolution and upsampling algorithm in order to enhance the effective spatial resolution of an image. Since the convolution problem in the presence of noise is highly ill-posed, regularization was applied to achieve stability while preserving a priori properties of the solution. We formulated the restoration problem within the variational framework, using the total variation regularization [2]. Total variation (TV) of an image measures the sum of the absolute values of its gradient and increases in the presence of irregularities. By minimizing the TV, we showed that the process significantly reduces the brightness temperature errors in the overall image. These processes were rendered efficiently by employing methodologies based on current research in sparse optimization and compressed sensing. We performed the total variation-based deconvolution within the split Bregman optimization framework to achieve a significant computational time improvement over already robust total-variation gradient descent-based techniques.
The split Bregman method can be derived from the well-known alternating direction method of multipliers (ADMM) [3,4,5], and is very efficient because it can decompose a non-smooth multi-term optimization problem into subproblems with closed-form solutions. This advantage of total variation regularization was first discovered in [6] for image denoising and deblurring, and has been generalized to multichannel problems in [7], the TV-L1 model in [8], TV-based compressed sensing in [9,10], and an edge-guided compressive sensing reconstruction approach for recovering images of higher qualities from fewer measurements in [11].
The fusion of sensor data is a well-established phenomenon, which appears in many different applications. In [12], the authors investigated the multisensor data fusion task. The paper proposed a comprehensive review of the data fusion state of the art, exploring its conceptualizations, benefits, and challenging aspects, as well as existing methodologies. In [13], the existing literature on multimodal fusion research is presented through several classifications based on the fusion methodology and the level of fusion. In [14], a comprehensive survey of the mixture of experts is provided. The authors discuss the fundamental models for regression and classification and also their training with the expectation-maximization algorithm. In [15], the problem of combining classifiers which use different representations of the patterns to be classified was studied. The problem of optimum decision fusion in the presence of statistical dependence among the individual decisions was considered in [16]. The authors in [17] investigated a fuzzy multi-sensor data fusion Kalman filter model for reducing risk in an integrated vehicle health maintenance system. Berliner et al. [18] introduced a hierarchical Bayesian spatio-temporal model with multiresolution wavelet basis functions and two data sources of different support. Wikle et al. [19] developed a hierarchical Bayesian spatio-temporal dynamic model that combines wind data from different sources with background physics to produce realizations of high-resolution surface wind fields. Banerjee et al. [20] proposed a class of models that is based on the idea of a spatial predictive process, which is motivated from kriging ideas. Their approach is in the same spirit as process model approaches using basis functions and kernel convolutions. Cressie and Johannesson [21] introduced fixed rank kriging based on the spatial random effects model, and Cressie et al. [22] introduced fixed rank filtering and fixed ranked smoothing based on the Kalman filter and the spatio-temporal random effects model. Nguyen et al. [23] introduced a spatio-temporal data fusion methodology based on reduced-dimensional Kalman smoothing. Their method is able to combine data captured by two instruments using a Bayesian framework.
In this paper, we consider the simultaneous data fusion, deconvolution, and upsampling problem, where we not only enhance the effective resolution of a microwave image, but further enhance its resolution using the data from an infrared instrument. Such an approach takes advantage of the high spatial resolution of the infrared instrument and the sensing accuracy of the microwave instrument. In our experiments, we used data captured with the infrared Advanced Very High Resolution Radiometer (AVHRR) instrument and the Advanced Microwave Sounding Unit (AMSU-B) microwave instrument, both flying on the NOAA-18 satellite. We tested our method using precipitation scenes captured with AMSU-B and AVHRR both over the ocean and ground, and compared the results to ground radar observations. The purpose of the paper is to provide a preliminary report on methodology. Because ground radar observations are difficult to acquire, only two events are considered in the paper. We apply our novel method to the existing available data.
2. Materials and Methods
2.1. Mathematical Notation
We first introduce notations that will be used throughout this paper. For an image , the value of u at a pixel , with , is denoted as . The norms are defined as:
The gradient of u is denoted as , and its value at pixel as , with . For a vector-valued quantity (e.g., ), the norms are defined as
where . Unless specified otherwise, in the remainder of this paper.
2.2. Data Fusion
Microwave images are inherently of low spatial resolution compared with optical sensors with similar receiving apertures. The pixel size for the Advanced Microwave Sounding Unit-B (AMSU-B) microwave sensor is 15 km at nadir. Thus, for example, a 3000 by 3000 km scene can be represented on a 200 × 200 grid. This limits the scientific analysis of derived data products. Our objective is to simultaneously (i) increase the effective resolution of the observed image, upsampling the resolution by some factor in each dimension, (ii) reduce the effects of noise, (iii) preserve the edges and other features in the image, and (iv) perform fusion of infrared and microwave data in order to increase the resolution of a microwave image.
We first formulate the microwave forward imaging model, which convolves, adds noise to, and downsamples the physical scene as it is being captured by the microwave sensor. That is, the physical scene captured by the microwave sensor is defined at the lower resolution, or at the resolution of the microwave sensor. We assume that the scene has been captured at this lower resolution as a result of applying the downsampling to some unknown high-resolution scene. In order to recover the scene at the higher resolution, we will upsample the scene by inverting the downsampling problem. This would increase the effective resolution of the observed image, which is objective (i) of our method.
The downsampling process is defined by the downsampling operator. Such an operator is a transformation from a fine (high-resolution) grid to a coarse (low-resolution) grid. We denote the downsampling matrix as with , where k is the downsampling (or upsampling) factor. The larger the downsampling factor k is, the coarser the resulting grid would be. We assume that a physical scene , when being captured, is convolved with an antenna kernel K, corrupted with instrument noise , and then downsampled with an operator D, arriving at the microwave observation :
where ∗ denotes convolution.
We note that the assumption that a physical scene is convolved with a non-trivial antenna kernel is not always the case, in which case we can assume that K is a delta function, , in (1).
We assume the sensor model for the infrared sensor satisfies the additive noise model (without convolution):
Hence, Equations (1) and (2) form a pair of equations for the microwave and infrared rain rates and , respectively. To recover an approximation to the true rain rate , we solve the inverse problem.
In [1], by formally solving the deconvolution inverse problem, we sharpened the image while preserving information content. We used the -regularized type norm , which measures the total variation (TV). The minimization of the TV norm does not penalize edges in an image. In this paper, we solve the simultaneous data fusion, deconvolution, and upsampling problem within an efficient multispectral total variation-based split Bregman minimization framework.
Given the microwave observation and infrared observation , we consider the following multisensor data fusion minimization problem:
Non-negative weights and , which may be spatially variant, indicate the plausibility of microwave and infrared rain rates, respectively. Note that the second and third terms in Equation (3) represent residuals of Equations (1) and (2), respectively. The downsampling operator D is modeled to transform the image from a finer IR grid to a coarser MW grid. Our split Bregman-based optimization algorithm will recover the deconvolved and noiseless image u defined on a high-resolution IR grid. The process of deconvolving antenna kernel K, together with applying total variation regularization, would reduce the effects of noise and preserve the edges and other features in the image, which are objectives (ii) and (iii). The presence of the second and third terms in Equation (3) achieve fusion of infrared and microwave data in order to increase the resolution of a microwave image, which is objective (iv).
In order to minimize (3), an additional variable is introduced to transfer out of non-differentiable terms at each pixel, and is penalized. Hence, the split Bregman formulation of problem (3) is
For a fixed u, the minimization problem for is
which can be explicitly solved for , at each pixel, by using a generalized shrinkage formula [26,27]:
For a fixed , the minimization problem (4) is quadratic in u:
and has the optimality condition:
where . We parametrize the descent direction by an artificial time t and solve the Euler–Lagrange equation in using the gradient descent method:
2.3. Data
The cross-track scanning antenna of the Advanced Microwave Sounding Unit-B (AMSU-B) microwave sensor has both a field of view (FoV) and a sampling increment of 1.1 degrees, resulting in 15 km per pixel at nadir. The same antenna is used for all five channels (89, 150, 183+/-1, 183+/-3, and 183+/-7 GHz), and aperture equalization results in the same resolution for all channels and also the retrieved MW rain rate. The Advanced Very High Resolution Radiometer (AVHRR) has a FoV and sampling increment of 0.08 degrees, resulting in ~1.1 km per pixel at nadir. The FoV is the same for all filters of the wheel (0.6, 0.8, 1.6, 3.7, 11, and 12 m), resulting in the same resolution for all channels and the retrieved IR rain rate. However, the 1.1 km resolution—called full-resolution area coverage (FRAC)—is not available on a global scale, and only a reduced dataset of km is available in remote areas—called global area coverage (GAC).
Collocation was done by using latitude and longitude from every pixel and finding the nearest AVHRR pixel to the center of an AMSU-B pixel. The other AVHRR pixels within the FoV of AMSU-B can then be weighted according to the distance from the center. This approach can result in uncertainties for higher scan angles, due to the change in footprint size and blurring due to the movement of the scanning instrument. The data was re-gridded on a constant grid for our purpose.
2.4. Infrared Precipitation Retrieval
IR precipitation retrieval was obtained following the three steps described below:
- (1)
- Collocating IR (~11 m) from the Visible and Infrared Scanner (VIRS) with precipitation rate from Precipitation Radar (PR), both aboard the Tropical Rainfall Measuring Mission (TRMM). The collocation was obtained from the University of Utah TRMM precipitation and cloud feature database [28] and used as our training datasets.
- (2)
- Establishing an empirical relationship between collocated IR brightness temperatures and PR precipitation estimates to map IR imagery to surface rainfall rates. This was performed using probability/histogram matching methods in which the cumulative distribution functions of precipitation rates and IR brightness temperatures are matched to provide IR-rain-rate equations under the general assumption that colder clouds statistically produce more intense rainfall [29,30,31].
- (3)
- The established relationship between IR brightness temperature and precipitation rate was used to retrieve precipitation intensity from AVHRR IR images, providing IR data (~11 m) similar to VIRS.
3. Results
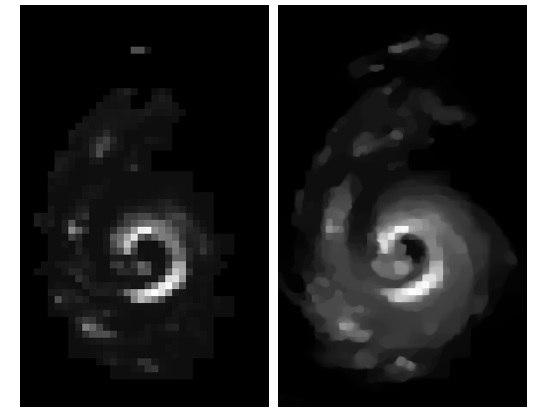
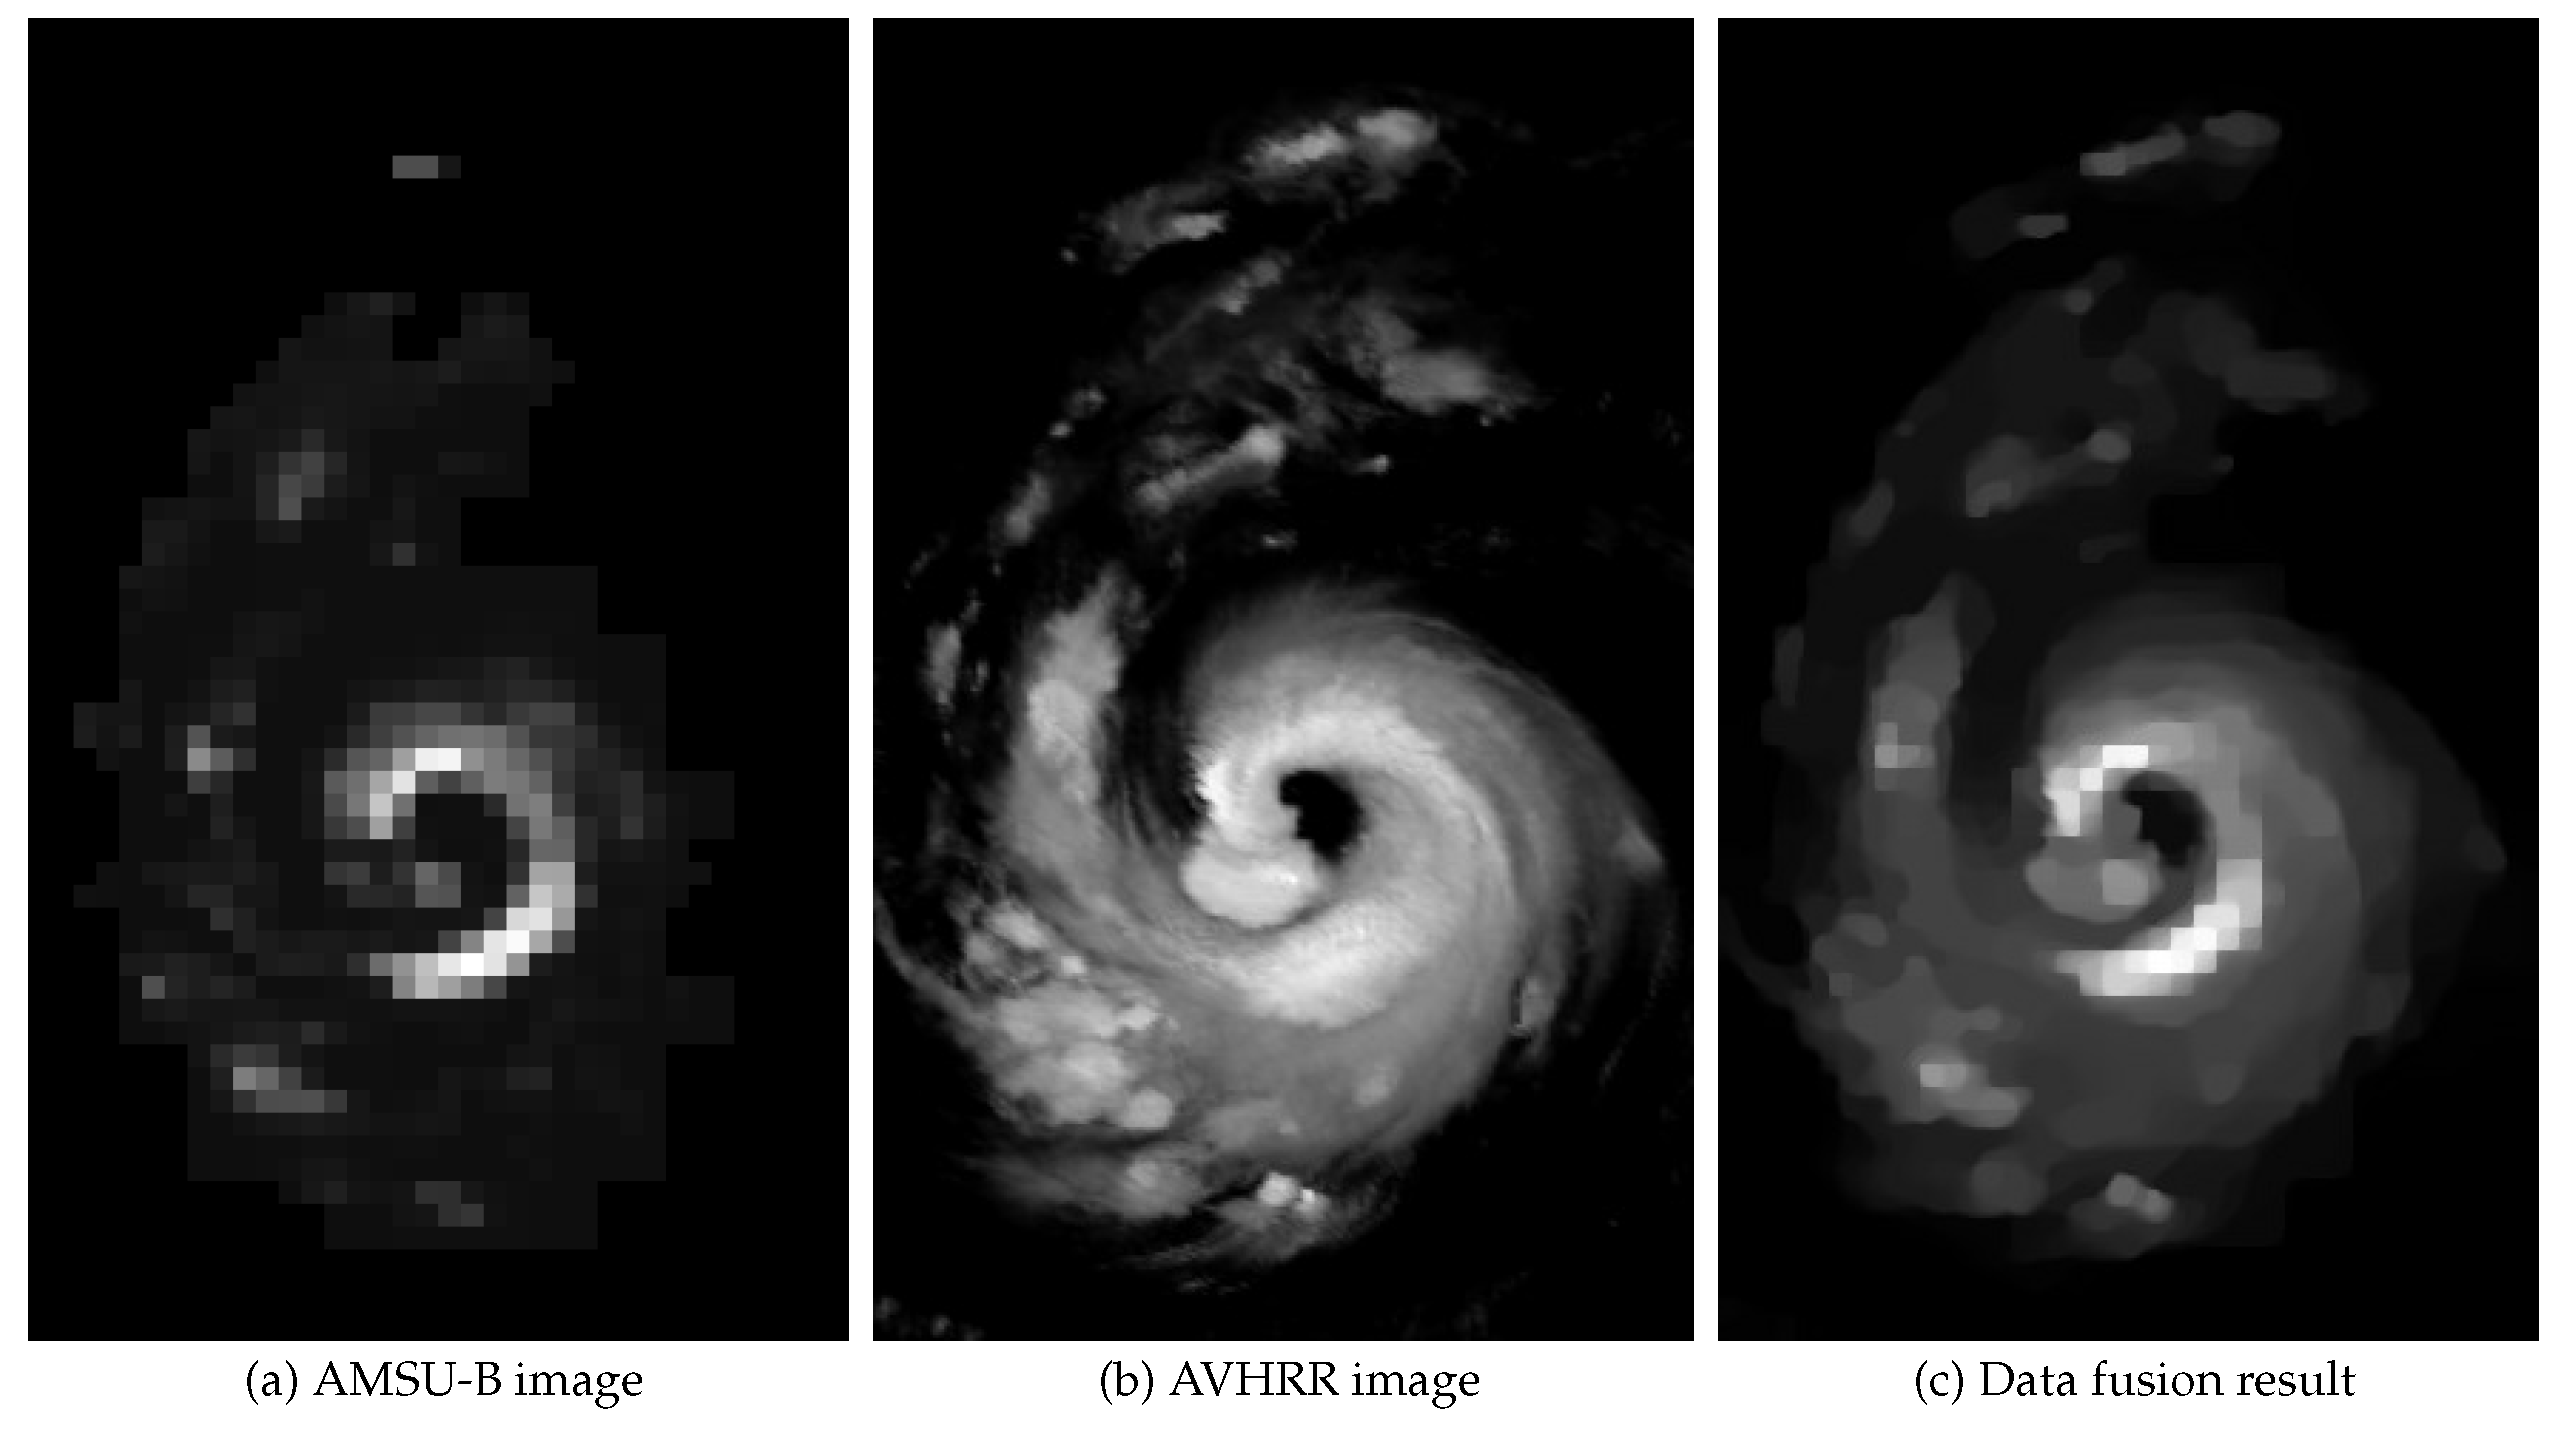
We tested the split Bregman-based data fusion method for increasing resolution of a microwave instrument using a precipitation scene captured with AMSU-B and AVHRR instruments over the ocean (Figure 1). The captured images represent rain rates. In our experiment, the AVHRR measurements had eight times higher spatial resolution than the AMSU-B measurements. Hence, our goal was to recover a high-resolution representation of a scene on a grid (1.9 km resolution) from a low-resolution representation on a grid (15 km resolution). The algorithm generated results using these datasets in 372 s using 2.9 GHz Intel Core i7 processor.
As seen in Figure 1, the data fusion result takes advantage of the spatial resolution of the infrared instrument by defining the result on a finer grid, and also takes advantage of the sensing accuracy of the microwave instrument by representing the features of the AMSU-B rain rates in the data fusion result. The results clearly show the location of the storm eye and the eyewall around it. This is not clear in the AMSU-B image due to its relatively poor spatial resolution. This is also the case for the storm’s rain band—an area of rainfall which is largely elongated. In Figure 2, we show the energy given by Equation (3) per iteration. We see that energy decreases.
We also tested the split Bregman-based data fusion method on a continental storm over the United States and the Gulf of Mexico on 9 January 2013 for enhancing the resolution of microwave observations (Figure 3). The rain event was associated with a strong upper-level storm system moving from northern Mexico across central Texas towards the northeast. The storm collected moisture from the Gulf of Mexico and warmer air from the South, resulting in widespread rain over western Texas during landfall. Rainfall rates between 1 and 2 inches were reported all over Texas during this event. This event was captured as snapshots by AMSU-B (Figure 3a) and AVHRR (Figure 3b) instruments at 3:00 a.m. local time, taken during the overflight of NOAA 18.
Since the AVHRR measurements had eight times higher spatial resolution than the AMSU-B measurements, our goal was to recover a high-resolution image on a grid (1.9 km resolution) from a low-resolution image on a grid (15 km resolution). Instantaneous rain rate measurements from ground weather radar were used to evaluate the recovered high-resolution image. The radar data used in this study is from the Multi-Radar/Multi-Sensor (MRMS) system, which generates automated, seamless national 3D radar mosaic and multisensory precipitation estimates at high resolution (1 km, 2 min) [32]. The radar data from the previous 24 h can be downloaded from http://mrms.ncep.noaa.gov/data. The historic archive is currently not available to the public, but will be available in the future.
As seen in Figure 3, the data fusion result takes advantage of the high spatial resolution of the infrared instrument. Compared to original AMSU-B and AVHRR observations, the data fusion product is closer to weather radar measurements in terms of storm coverage, intensity, and storm center. Table 1 shows the statistics of the original AMSU-B and AVHRR as well as the data fusion product using ground weather radar measurements as reference. The data fusion product outperforms the original microwave and IR observations across all statistical indicators, including relative bias, correlation coefficient (CC), mean absolute error (MAE), and root-mean-square error (RMSE).
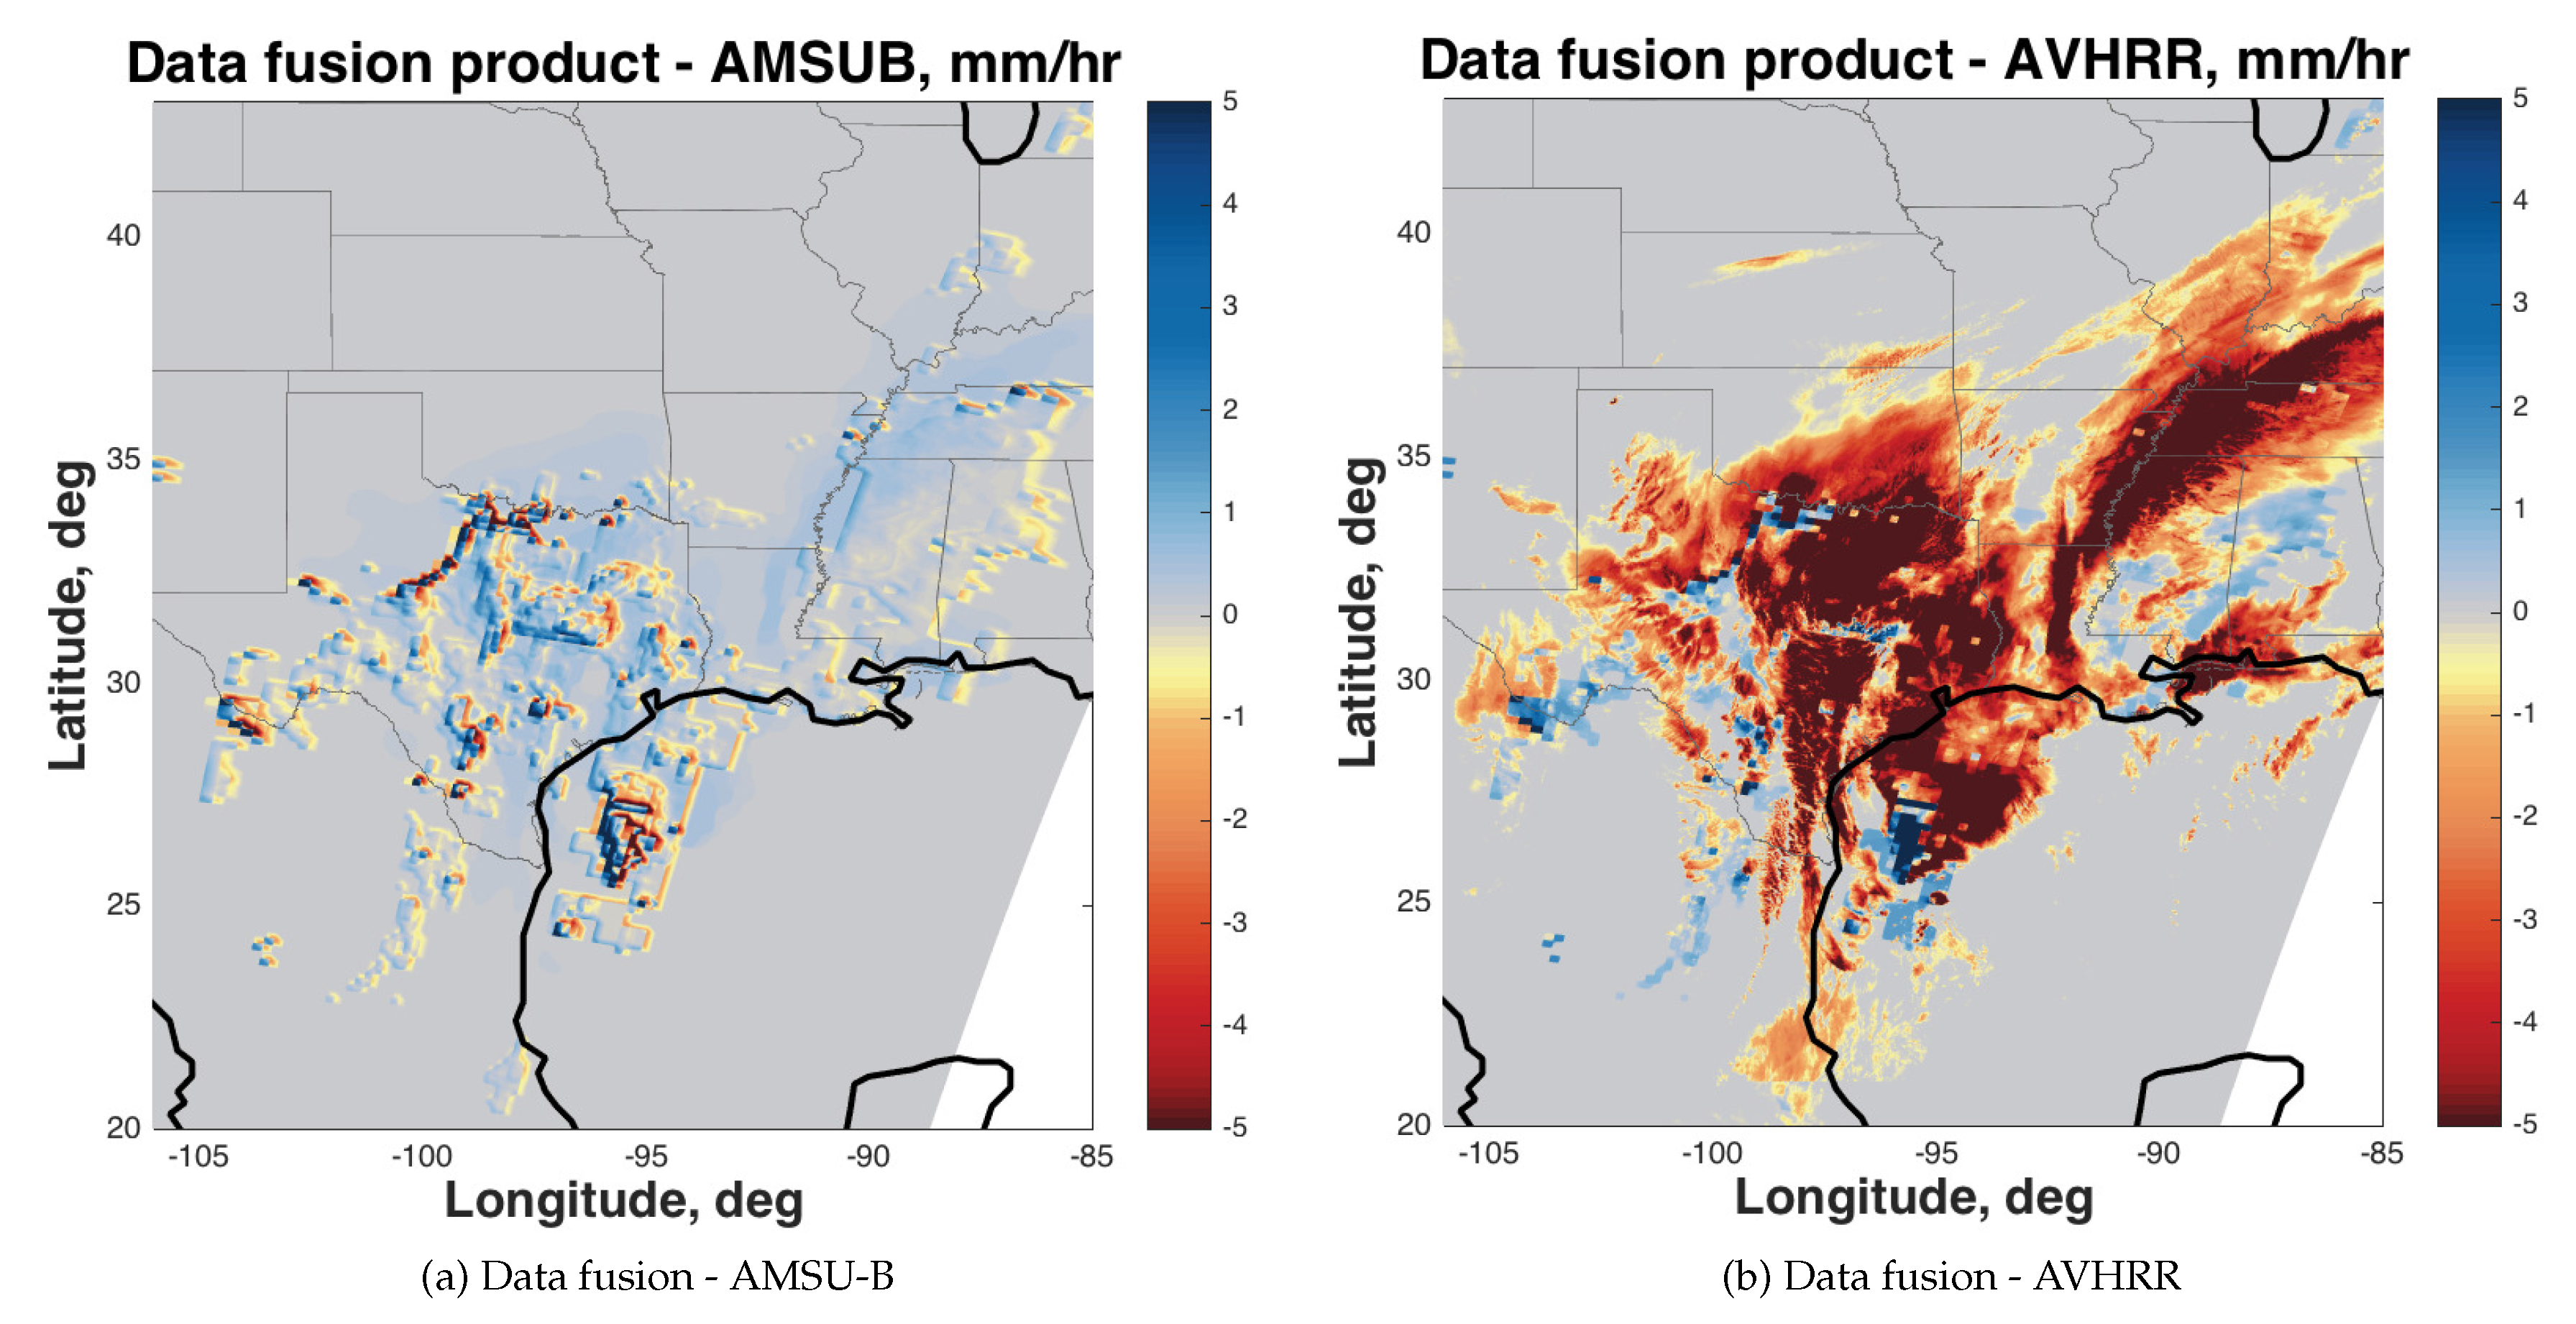
Compared to AVHRR, the data fusion product mitigated the overestimation (Figure 4b). The discrepancy between data fusion product and AMSU-B exists on the edge of the storms (Figure 4a), and is not as significant as the one with AVHRR, indicating the data fusion result takes advantage of the sensing accuracy of the microwave instrument by representing the features of the AMSU-B rain rates.
4. Discussion
There remain a few concerns that we would like to communicate with the readers: (1) Microwave humidity sounders such as AMSU-B do not oversample, and they operate at higher frequencies where the signal is not fully related to surface rainfall but rather correlated to ice aloft. Given that ice aloft is not well correlated to rainfall at the surface due to shear, cloud lifecycle issues, and simple parallax (off nadir), it might be the case that even if an AMSU-B sensor with 4 km resolution existed, the rainfall derived through empirical relations would not yield superior correlations with ground-based radar than rainfall from the coarser resolution footprints currently available. In other words, one can argue that correlations can also improve due to averaging enough cloud processes that ice aloft starts to correlate more strongly with surface precipitation. (2) Undoubtedly, IR data can improve the resolution of precipitation as cloud-free scenes are not likely to rain, and one can also envision the converse where parallax effects from overlying deep cirrus or anvil clouds can shift the convection by a few kilometers from where the dense ice is found by the microwave sounder. (3) Equations (1) and (2) assume that the observed rain rates ( and ) are the true rain rates, , with noise and the appropriate convolution. In reality, however, the noise is some random noise together with very coherent structural errors. A cirrus cloud overlying most of the scene, for instance, could not be characterized as an independent error at each pixel. Instead, it has an edge that may have a relation to the underlying precipitation field.
We note that our work is preliminary. It represents significant progress on a significant topic, namely enhancing spatial resolution of observed variables. Further work will be performed in the future. For instance, we plan to assess several other coincident satellite overpasses, such as GPM radar with AMSU and AVHRR.
5. Conclusions
This paper develops a data fusion methodology and applies it to enhance the resolution of a microwave image using the data from a collocated infrared/visible sensor. The images acquired by microwave sensors are blurry and of low-resolution. On the other hand, the images obtained using infrared/visible sensors are of higher resolution. Our approach takes advantage of the spatial resolution of the infrared instrument and the sensing accuracy of the microwave instrument. The model leverages sparsity in signals and is based on current research in sparse optimization and compressed sensing. We tested our method using a precipitation scene captured with the Advanced Microwave Sounding Unit (AMSU-B) microwave instrument and the Advanced Very High Resolution Radiometer (AVHRR) infrared instrument and compared the results to the radar observations. We showed that the data fusion product has a lower relative bias, higher correlation coefficient (CC), lower mean absolute error (MAE) and root-mean-square error (RMSE) than both AMSU-B and AVHRR observations.
Acknowledgments
This work was supported by the National Aeronautics and Space Administration (NASA), Weather Research program. The work of I. Yanovsky was also supported by the National Science Foundation under Grant DMS 1217239. This research was carried out at the Jet Propulsion Laboratory, California Institute of Technology, under a contract with the National Aeronautics and Space Administration.
Author Contributions
Igor Yanovsky designed the algorithm and wrote the paper. Ali Behrangi, Mathias Schreier, and Van Dang processed the data and contributed to writing the paper. Yixin Wen analyzed the data and contributed to writing the paper. Bjorn Lambrigtsen contributed to writing the paper.
Conflicts of Interest
The authors declare no conflict of interest.
Abbreviations
The following abbreviations are used in this manuscript:
| ADMM | Alternating Direction Method of Multipliers |
| AMSU-B | Advanced Microwave Sounding Unit - B |
| AVHRR | Advanced Very High Resolution Radiometer |
| CC | Correlation Coefficient |
| FoV | Field of View |
| FRAC | Full-Resolution Area Coverage |
| GAC | Global Area Coverage |
| GPM | Global Precipitation Measurement |
| IR | Infrared |
| MAE | Mean Absolute Error |
| MRMS | Multi-Radar/Multi-Sensor |
| MW | Microwave |
| PR | Precipitation Radar |
| QPE | Quantitative Precipitation Estimation |
| RMSE | Root-Mean-Square Error |
| TRMM | Tropical Rainfall Measuring Mission |
| TV | Total Variation |
| VIRS | Visible and Infrared Scanner |
References
- Yanovsky, I.; Lambrigtsen, B.; Tanner, A.; Vese, L. Efficient deconvolution and super-resolution methods in microwave imagery. IEEE J. Sel. Top. Appl. Earth Obs. Remote Sens. 2015, 8, 4273–4283. [Google Scholar] [CrossRef]
- Rudin, L.; Osher, S.; Fatemi, E. Nonlinear total variation based noise removal algorithms. Physica D 1992, 60, 259–268. [Google Scholar] [CrossRef]
- Glowinski, R.; Marrocco, A. Sur l’approximation, par elements finis d’ordre un, et la resolution, par, penalisation-dualité, d’une classe de problems de Dirichlet non lineares. J. Equine Vet. Sci. 1975, 9, 41–76. [Google Scholar]
- Gabay, D.; Mercier, B. A dual algorithm for the solution of nonlinear variational problems via finite element approximations. Comput. Math. Appl. 1976, 2, 17–40. [Google Scholar] [CrossRef]
- Glowinski, R.; Lions, J.L.; Tremolieres, R. Numerical Analysis of Variational Inequalities; North-Holland: Amsterdam, The Netherlands; New York, NY, USA; Oxford, UK, 1981. [Google Scholar]
- Wang, Y.; Yang, J.; Yin, W.; Zhang, Y. A new alternating minimization algorithm for total variation image reconstruction. SIAM J. Imaging Sci. 2008, 1, 248–272. [Google Scholar] [CrossRef]
- Yang, J.; Yin, W.; Zhang, Y.; Wang, Y. A fast algorithm for edge-preserving variational multichannel image restoration. SIAM J. Imaging Sci. 2009, 2, 569–592. [Google Scholar] [CrossRef]
- Yang, J.; Zhang, Y.; Yin, W. An efficient TVL1 algorithm for deblurring multichannel images corrupted by impulsive noise. SIAM J. Sci. Comput. 2009, 31, 2842–2865. [Google Scholar] [CrossRef]
- Goldstein, T.; Osher, S. The split bregman method for L1-regularized problems. SIAM J. Imaging Sci. 2009, 2, 323–343. [Google Scholar] [CrossRef]
- Yang, J.; Zhang, Y.; Yin, W. A fast alternating direction method for TVL1-L2 signal reconstruction from partial fourier data. IEEE J. Sel. Top. Signal Process. 2010, 4, 288–297. [Google Scholar] [CrossRef]
- Guo, W.; Yin, W. Edge guided reconstruction for compressive imaging. SIAM J. Imaging Sci. 2012, 5, 809–834. [Google Scholar] [CrossRef]
- Khaleghi, B.; Khamis, A.; Karray, F.; Razavi, S. Multisensor data fusion: A review of the state-of-the-art. Inf. Fusion 2013, 14, 28–44. [Google Scholar] [CrossRef]
- Atrey, P.K.; Hossain, M.A.; El Saddik, A.; Kankanhalli, M.S. Multimodal fusion for multimedia analysis: A survey. Multimedia Syst. 2010, 16, 345–379. [Google Scholar] [CrossRef]
- Yuksel, S.E.; Wilson, J.N.; Gader, P.D. Twenty years of mixture of experts. IEEE Trans. Neural Netw. Learn. Syst. 2012, 23, 1177–1193. [Google Scholar] [CrossRef] [PubMed]
- Kittler, J.; Hatef, M.; Duin, R.P.W.; Matas, J. On combining classifiers. IEEE Trans. Pattern Anal. Mach. Intell. 1998, 20, 226–239. [Google Scholar] [CrossRef]
- Vergara, L.; Soriano, A.; Safont, G.; Salazar, A. On the fusion of non-independent detectors. Digit. Signal Process. 2016, 50, 24–33. [Google Scholar] [CrossRef]
- Rodger, J.A. Toward reducing failure risk in an integrated vehicle health maintenance system: A fuzzy multi-sensor data fusion Kalman filter approach for IVHMS. Expert Syst. Appl. 2012, 39, 9821–9836. [Google Scholar] [CrossRef]
- Berliner, L.; Wikle, C.; Milliff, R. Multiresolution wavelet analyses in hierarchical bayesian turbulence models. In Bayesian Inference in Wavelet-Based Models; Muller, P., Vidakovic, B., Eds.; Springer: New York, NY, USA, 1999; Volume 141. [Google Scholar]
- Wikle, C.K.; Milliff, R.F.; Nychka, D.; Berliner, L.M. Spatiotemporal hierarchical bayesian modeling: Tropical ocean surface winds. J. Am. Stat. Assoc. 2001, 96, 382–397. [Google Scholar] [CrossRef]
- Banerjee, S.; Gelfand, A.E.; Finley, A.O.; Sang, H. Gaussian prediction process models for large spatial data sets. J. R. Stat. Soc. Ser. B 2008, 70, 825–848. [Google Scholar] [CrossRef] [PubMed]
- Cressie, N.; Johannesson, G. Fixed rank kriging for very large spatial data sets. J. R. Stat. Soc. Ser. B 2008, 70, 209–226. [Google Scholar] [CrossRef]
- Cressie, N.; Shi, T.; Kang, E.L. Fixed rank filtering for spatio-temporal data. J. Comput. Graph. Stat. 2010, 19, 724–745. [Google Scholar] [CrossRef]
- Nguyen, H.; Katzfuss, M.; Cressie, N.; Braverman, A. Spatio-temporal data fusion for very large remote sensing datasets. Technometrics 2014, 56, 174–185. [Google Scholar] [CrossRef]
- Yin, W.; Osher, S.; Goldfarb, D.; Darbon, J. Bregman iterative algorithms for L1-minimization with applications to compressed sensing. SIAM J. Imaging Sci. 2008, 1, 143–168. [Google Scholar] [CrossRef]
- Osher, S.; Burger, M.; Goldfarb, D.; Xu, J.; Yin, W. An iterative regularization method for total variation-based image restoration. Multiscale Model. Simul. 2005, 4, 460–489. [Google Scholar] [CrossRef]
- Donoho, D.L.; Johnstone, I.M. Adapting to unknown smoothness via wavelet shrinkage. J. Am. Stat. Assoc. 1995, 90, 1200–1224. [Google Scholar] [CrossRef]
- Wang, Y.; Yin, W.; Zhang, Y. A Fast Algorithm for Image Deblurring with Total Variation Regularization; CAAM Technical Report TR07-10; Rice University: Houston, TX, USA, 2007. [Google Scholar]
- Liu, C.; Zipser, E.J.; Cecil, D.J.; Nesbitt, S.W.; Sherwood, S. A cloud and precipitation feature database from nine years of TRMM observations. J. Appl. Meteorol. Climatol. 2008, 47, 2712–2728. [Google Scholar] [CrossRef]
- Huffman, G.J.; Adler, R.F.; Bolvin, D.T.; Gu, G.J.; Nelkin, E.J.; Bowman, K.P.; Hong, Y.; Stocker, E.F.; Wolff, D.B. The TRMM multisatellite precipitation analysis (TMPA): Quasi-global, multiyear, combined-sensor precipitation estimates at fine scales. J. Hydrometeorol. 2007, 8, 38–55. [Google Scholar] [CrossRef]
- Kidd, C.; Kniveton, D.R.; Todd, M.C.; Bellerby, T.J. Satellite rainfall estimation using combined passive microwave and infrared algorithms. J. Hydrometeorol. 2003, 4, 1088–1104. [Google Scholar] [CrossRef]
- Behrangi, A.; Hsu, K.; Imam, B.; Sorooshian, S.; Huffman, G.J.; Kuligowski, R.J. PERSIANN-MSA: A precipitation estimation method from satellite-based multispectral analysis. J. Hydrometeorol. 2009, 10, 1414–1429. [Google Scholar] [CrossRef]
- Zhang, J.; Howard, K.; Langston, C.; Kaney, B.; Qi, Y.; Tang, L.; Grams, H.; Wang, Y.; Cocks, S.; Martinaitis, S.; et al. Multi-radar multi-sensor (MRMS) quantitative precipitation estimation: Initial operating capabilities. Bull. Am. Meteorol. Soc. 2016, 97, 621–638. [Google Scholar] [CrossRef]
Figure 1.
(a) AMSU-B image at 15 km resolution, (b) AVHRR image at 1.9 km resolution, and (c) data fusion result at 1.9 km resolution are shown.
Figure 1.
(a) AMSU-B image at 15 km resolution, (b) AVHRR image at 1.9 km resolution, and (c) data fusion result at 1.9 km resolution are shown.


Figure 3.
The event on 9 January 2013. (a) Rain rate measured from AMSU-B at 15 km resolution. (b) Rain rate measured from AVHRR at 1.9 km resolution. (c) Fusion product at 1.9 km resolution. (d) Instantaneous rain rate measured from ground weather radar.
Figure 3.
The event on 9 January 2013. (a) Rain rate measured from AMSU-B at 15 km resolution. (b) Rain rate measured from AVHRR at 1.9 km resolution. (c) Fusion product at 1.9 km resolution. (d) Instantaneous rain rate measured from ground weather radar.
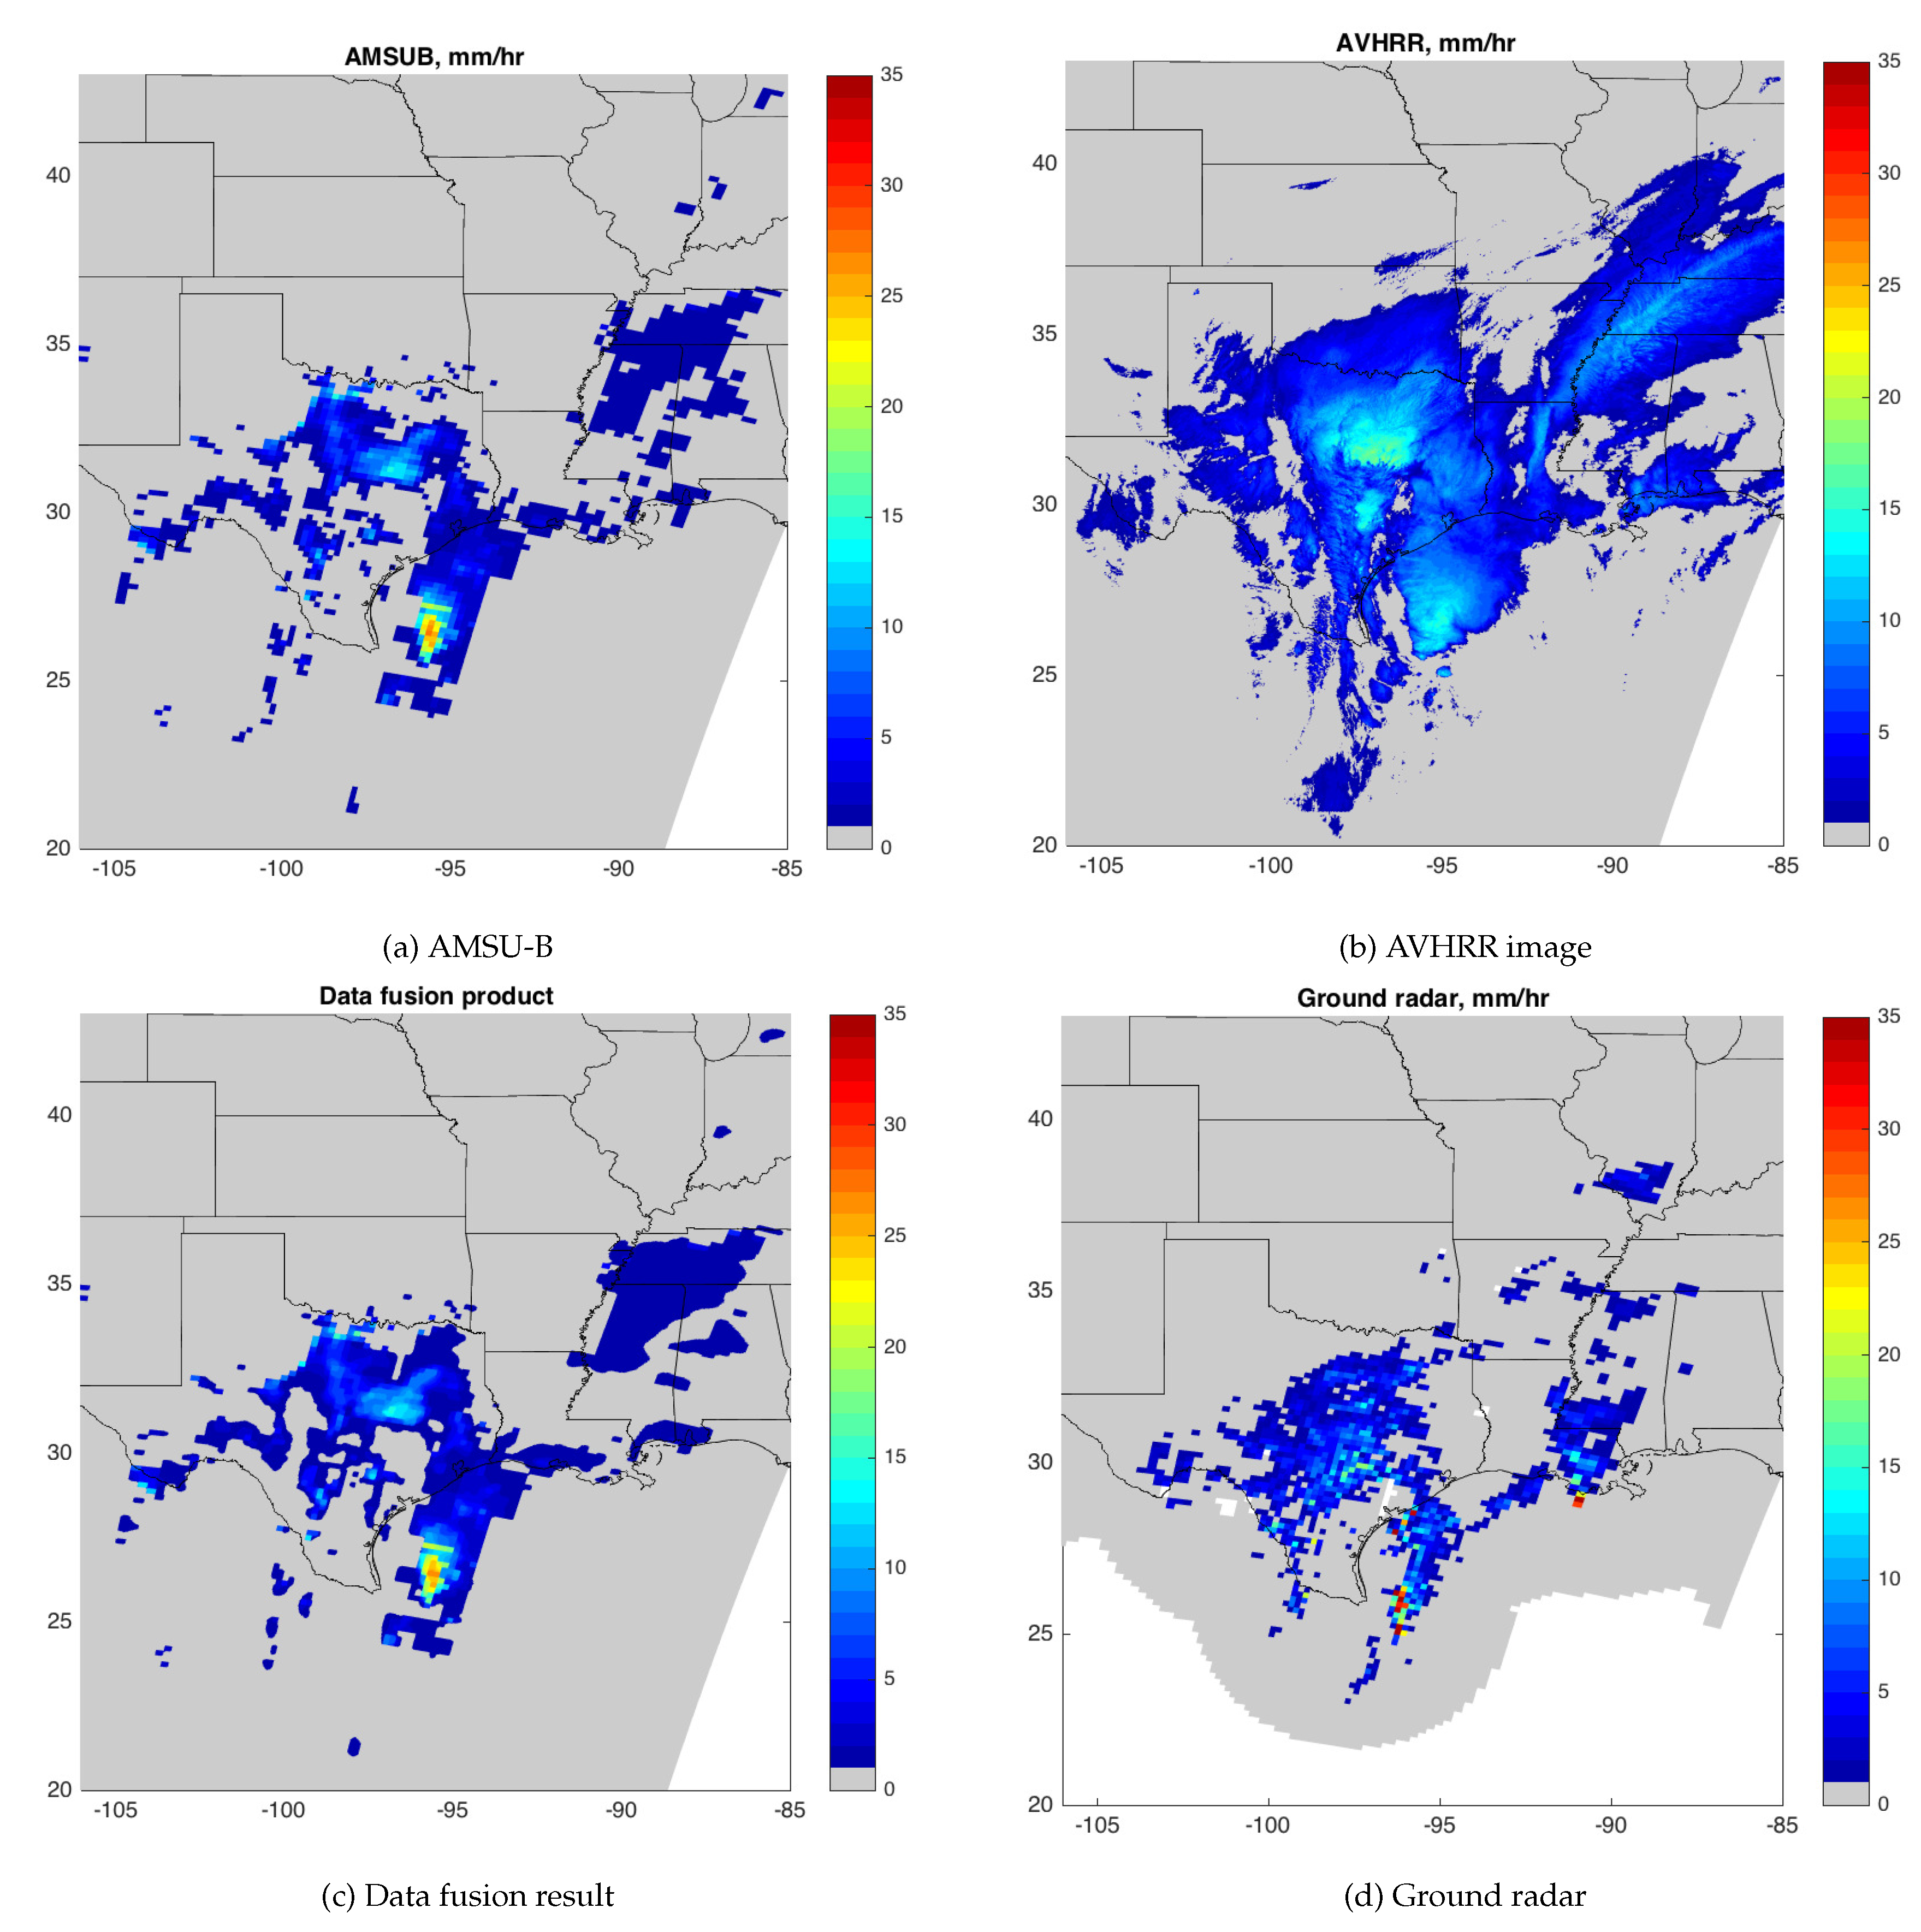
Figure 4.
The event on 9 January 2013. (a) The difference between data fusion product and AMSU-B. (b) The difference between data fusion product and AVHRR.
Figure 4.
The event on 9 January 2013. (a) The difference between data fusion product and AMSU-B. (b) The difference between data fusion product and AVHRR.


Table 1.
Statistical results for the Advanced Microwave Sounding Unit (AMSU-B), the Advanced Very High Resolution Radiometer (AVHRR), and the fusion product. The method with the best performance according to the statistic is denoted. Ground weather radar quantitative precipitation estimation (QPE) is used as reference. CC: correlation coefficient; MSE: mean absolute error; RMSE: root-mean-square error.
| Relative Bias (%) | CC | MAE (mm/h) | RMSE (mm/h) | |
|---|---|---|---|---|
| AMSU-B | 2.58 | 0.20 | 2.25 | 4.11 |
| AVHRR | 185.95 | 0.26 | 3.72 | 5.03 |
| Fusion product | −1.78 | 0.29 | 1.44 | 3.21 |
© 2017 by the authors. Licensee MDPI, Basel, Switzerland. This article is an open access article distributed under the terms and conditions of the Creative Commons Attribution (CC BY) license (http://creativecommons.org/licenses/by/4.0/).
Share and Cite
MDPI and ACS Style
Yanovsky, I.; Behrangi, A.; Wen, Y.; Schreier, M.; Dang, V.; Lambrigtsen, B. Enhanced Resolution of Microwave Sounder Imagery through Fusion with Infrared Sensor Data. Remote Sens. 2017, 9, 1097. https://doi.org/10.3390/rs9111097
AMA Style
Yanovsky I, Behrangi A, Wen Y, Schreier M, Dang V, Lambrigtsen B. Enhanced Resolution of Microwave Sounder Imagery through Fusion with Infrared Sensor Data. Remote Sensing. 2017; 9(11):1097. https://doi.org/10.3390/rs9111097
Chicago/Turabian StyleYanovsky, Igor, Ali Behrangi, Yixin Wen, Mathias Schreier, Van Dang, and Bjorn Lambrigtsen. 2017. "Enhanced Resolution of Microwave Sounder Imagery through Fusion with Infrared Sensor Data" Remote Sensing 9, no. 11: 1097. https://doi.org/10.3390/rs9111097
Note that from the first issue of 2016, this journal uses article numbers instead of page numbers. See further details here.