Article

Response of Grassland Degradation to Drought at Different Time-Scales in Qinghai Province: Spatio-Temporal Characteristics, Correlation, and Implications

State Key Laboratory of Water Environment Simulation, School of Environment, Beijing Normal University, Beijing 100875, China
*
Author to whom correspondence should be addressed.
Remote Sens. 2017, 9(12), 1329; https://doi.org/10.3390/rs9121329
Submission received: 28 October 2017 / Revised: 4 December 2017 / Accepted: 17 December 2017 / Published: 19 December 2017
(This article belongs to the Special Issue Satellite Remote Sensing for Water Resources in a Changing Climate)

Abstract

:
Grassland, as the primary vegetation on the Qinghai-Tibet Plateau, has been increasingly influenced by water availability due to climate change in last decades. Therefore, identifying the evolution of drought becomes crucial to the efficient management of grassland. However, it is not yet well understood as to the quantitative relationship between vegetation variations and drought at different time scales. Taking Qinghai Province as a case, the effects of meteorological drought on vegetation were investigated. Multi-scale Standardized Precipitation Evapotranspiration Index (SPEI) considering evapotranspiration variables was used to indicate drought, and time series Normal Difference Vegetation Index (NDVI) to indicate the vegetation response. The results showed that SPEI values at different time scales reflected a complex dry and wet variation in this region. On a seasonal scale, more droughts occurred in summer and autumn. In general, the NDVI presented a rising trend in the east and southwest part and a decreasing trend in the northwest part of Qinghai Province from 1998 to 2012. Hurst indexes of NDVI revealed that 69.2% of the total vegetation was positively persistent (64.1% of persistent improvement and 5.1% of persistent degradation). Significant correlations were found for most of the SPEI values and the one year lagged NDVI, indicating vegetation made a time-lag response to drought. In addition, one month lagged NDVI made an obvious response to SPEI values at annual and biennial scales. Further analysis showed that all multiscale SPEI values have positive relationships with the NDVI trend and corresponding grassland degradation. The study highlighted the response of vegetation to meteorological drought at different time scales, which is available to predict vegetation change and further help to improve the utilization efficiency of water resources in the study region.

Graphical Abstract

1. Introduction

Drought is generally defined as “a period of abnormally dry weather long enough to cause a serious hydrological imbalance” [1]. Climate warming increases its frequency. The regions of drought have been expanding and the degree of drought has been gradually increasing across the globe [2]. As a result, the issues of drought have attracted extensive attention [3].
Drought monitoring and assessment help to predict future drought advancement, especially summer drought, and make water resources management plans [4]. At present, researchers have proposed a variety of drought indexes to reflect the degree and characteristics of drought, such as the Palmer Drought Severity Index (PDSI) [5,6], Standardized Precipitation Index (SPI) [7], and Surface Wetness Index (H) [8]. The simplicity of the calculation of these indexes enable the worldwide usage to assess drought assessment associated with agriculture, water management, net primary production, and summer wildfires under global warming conditions [9,10,11,12]. More recently, Vicente-Serrano proposed a new climate drought index, the Standardized Precipitation Evapotranspiration Index (SPEI) [13,14]. The SPEI not only retains the advantages of the PDSI, but it is also suitable for making multi-spatial and multi-temporal scale comparisons. It takes into account both potential evapotranspiration (PET) and precipitation in determining the degree of drought [13,14]. Compared to the SPI, the SPEI can better account for the effects of temperature variability and temperature extremes on drought assessment [15]. Studies showed that the SPEI reaches higher correlation with crop yields than the SPI [9]. Thus, this index can capture the impact of temperatures on water demand, which makes it into a useful tool to monitor and evaluate the degree of drought. Currently, more and more studies are using the SPEI to evaluate the drought levels at different temporal and spatial scales. For example, Potopová et al. [16] studied the performance of the SPEI at various time lags for agricultural drought risk assessment. The change trends and the influence of El Niño-Southern Oscillation (ENSO) on droughts in Northern Chile have been analyzed in detail based on SPEI [17]. The relationship between low frequency drought and climate index in Beijing was also identified by using a series of values of the SPEI [18].
In recent years, drought conditions in the Qinghai-Tibet Plateau, which is called as “roof of the world”, have received a lot of attention due to climate change. Although the northeastern Qinghai province is abundant of water resources with the honor of being the “water tower” in China, various degrees of drought have occurred in the Qinghai Province in the last few decades due to climate change, which exhibited a low-frequency drought. The authors of [19,20] explored the spatio-temporal characteristics of dryness and wetness conditions across the Qinghai Province; Tian et al. [21] studied the effects of drought on the archaeal community in the soil in the Qinghai-Tibet Plateau. Many studies showed that the frequency of drought has increased and the vegetation covers also have changed owing to climate change in this region [19]. Therefore, it is of great importance to study the drought in Qinghai area. The distribution, characteristics, and changing trends of drought in Qinghai Province can provide scientific basis for drought monitoring, prediction, and prevention measures.
The ecological effects of drought are usually reflected by its impact on vegetation that are sensitive to climate change [22,23]. Grassland, which strongly depends on water resources, will be affected by climate change and drought frequency. In Qinghai province, the grassland dynamics has exhibited a continuous degradation process in different regions since the 1970s [24]. It is clear from some studies that grasslands show a response to drought that may be hysteretic [25]. Monitoring grassland degradation and identifying the contributing rate of climate change is crucial to grassland management.
The changes in grasslands can be characterized by the Normal Difference Vegetation Index (NDVI), as it is an important index to reflect the degree of vegetation coverage and its changes over time [26,27], it is widely applied in the research of vegetation conditions at large scales [28,29]. In recent years, with the development of technology, especially the application of remote sensing technology that can provide continuous NDVI information on vegetation conditions over time, a number of studies on NDVI trends have been undertaken [25,30,31]. The direction of NDVI change can be revealed using linear regression analysis [32] and the significance of change can be shown using the Mann-Kendall (M-K) analysis [33]. The vegetation trends and the persistence of the change can be analyzed by the Hurst index [34], which calculates estimates through the R/S (Rescaled Range) analysis method. Hou et al. [35] analyzed the characteristics of vegetation cover change in the eastern coastal areas of China; Xie et al. [36] studied the hydrological alteration analysis method, which was based on the Hurst coefficient. Thus, it is better suited than correlation models to simulate future vegetation change under uncertainties in future climate changes.
The responses of the NDVI to climate change have been extensively studied on regional and global scales. Li et al. [37] studied the response of vegetation to climate change and human activity based on the NDVI; Birtwistle et al. [38] found large seasonal-scale changes in the NDVI along channels, which was useful in determining when and where flow events have occurred. Fu and Burgher [39] analyzed the correlation between NDVI dynamics and climate, surface water, and groundwater. In Western China, especially in the Qinghai-Tibet Plateau, many studies have shown that the climate has changed, becoming warmer and wetter [40,41]. In the eastern parts of China, in spite of the low frequency of droughts, desertification and oasis degradation have been reported [42]. Therefore, increasing attention is being paid to those studies that use the NDVI to assess the ecological status in China [43]. However, the response of NDVI to SPEI at multiple scales for the Qinghai-Tibet Plateau is still not well understood.
The objectives of this study were to (1) investigate the frequency and intensity of drought in Qinghai Province based on SPEI at different scales to study the spatio-temporal and multi-scale characteristics of drought in this region; (2) analyze the spatio-temporal characteristics and changing trend of vegetation based on NDVI from 39 main meteorological stations in Qinghai Province, combining the Mann-Kendall method and Hurst index; and (3) explore the correlation between multiscale SPEI, NDVI with different time-lags, and NDVI trends, which provided the scientific basis for the efficient management and protection of vegetation.

2. Materials and Methods
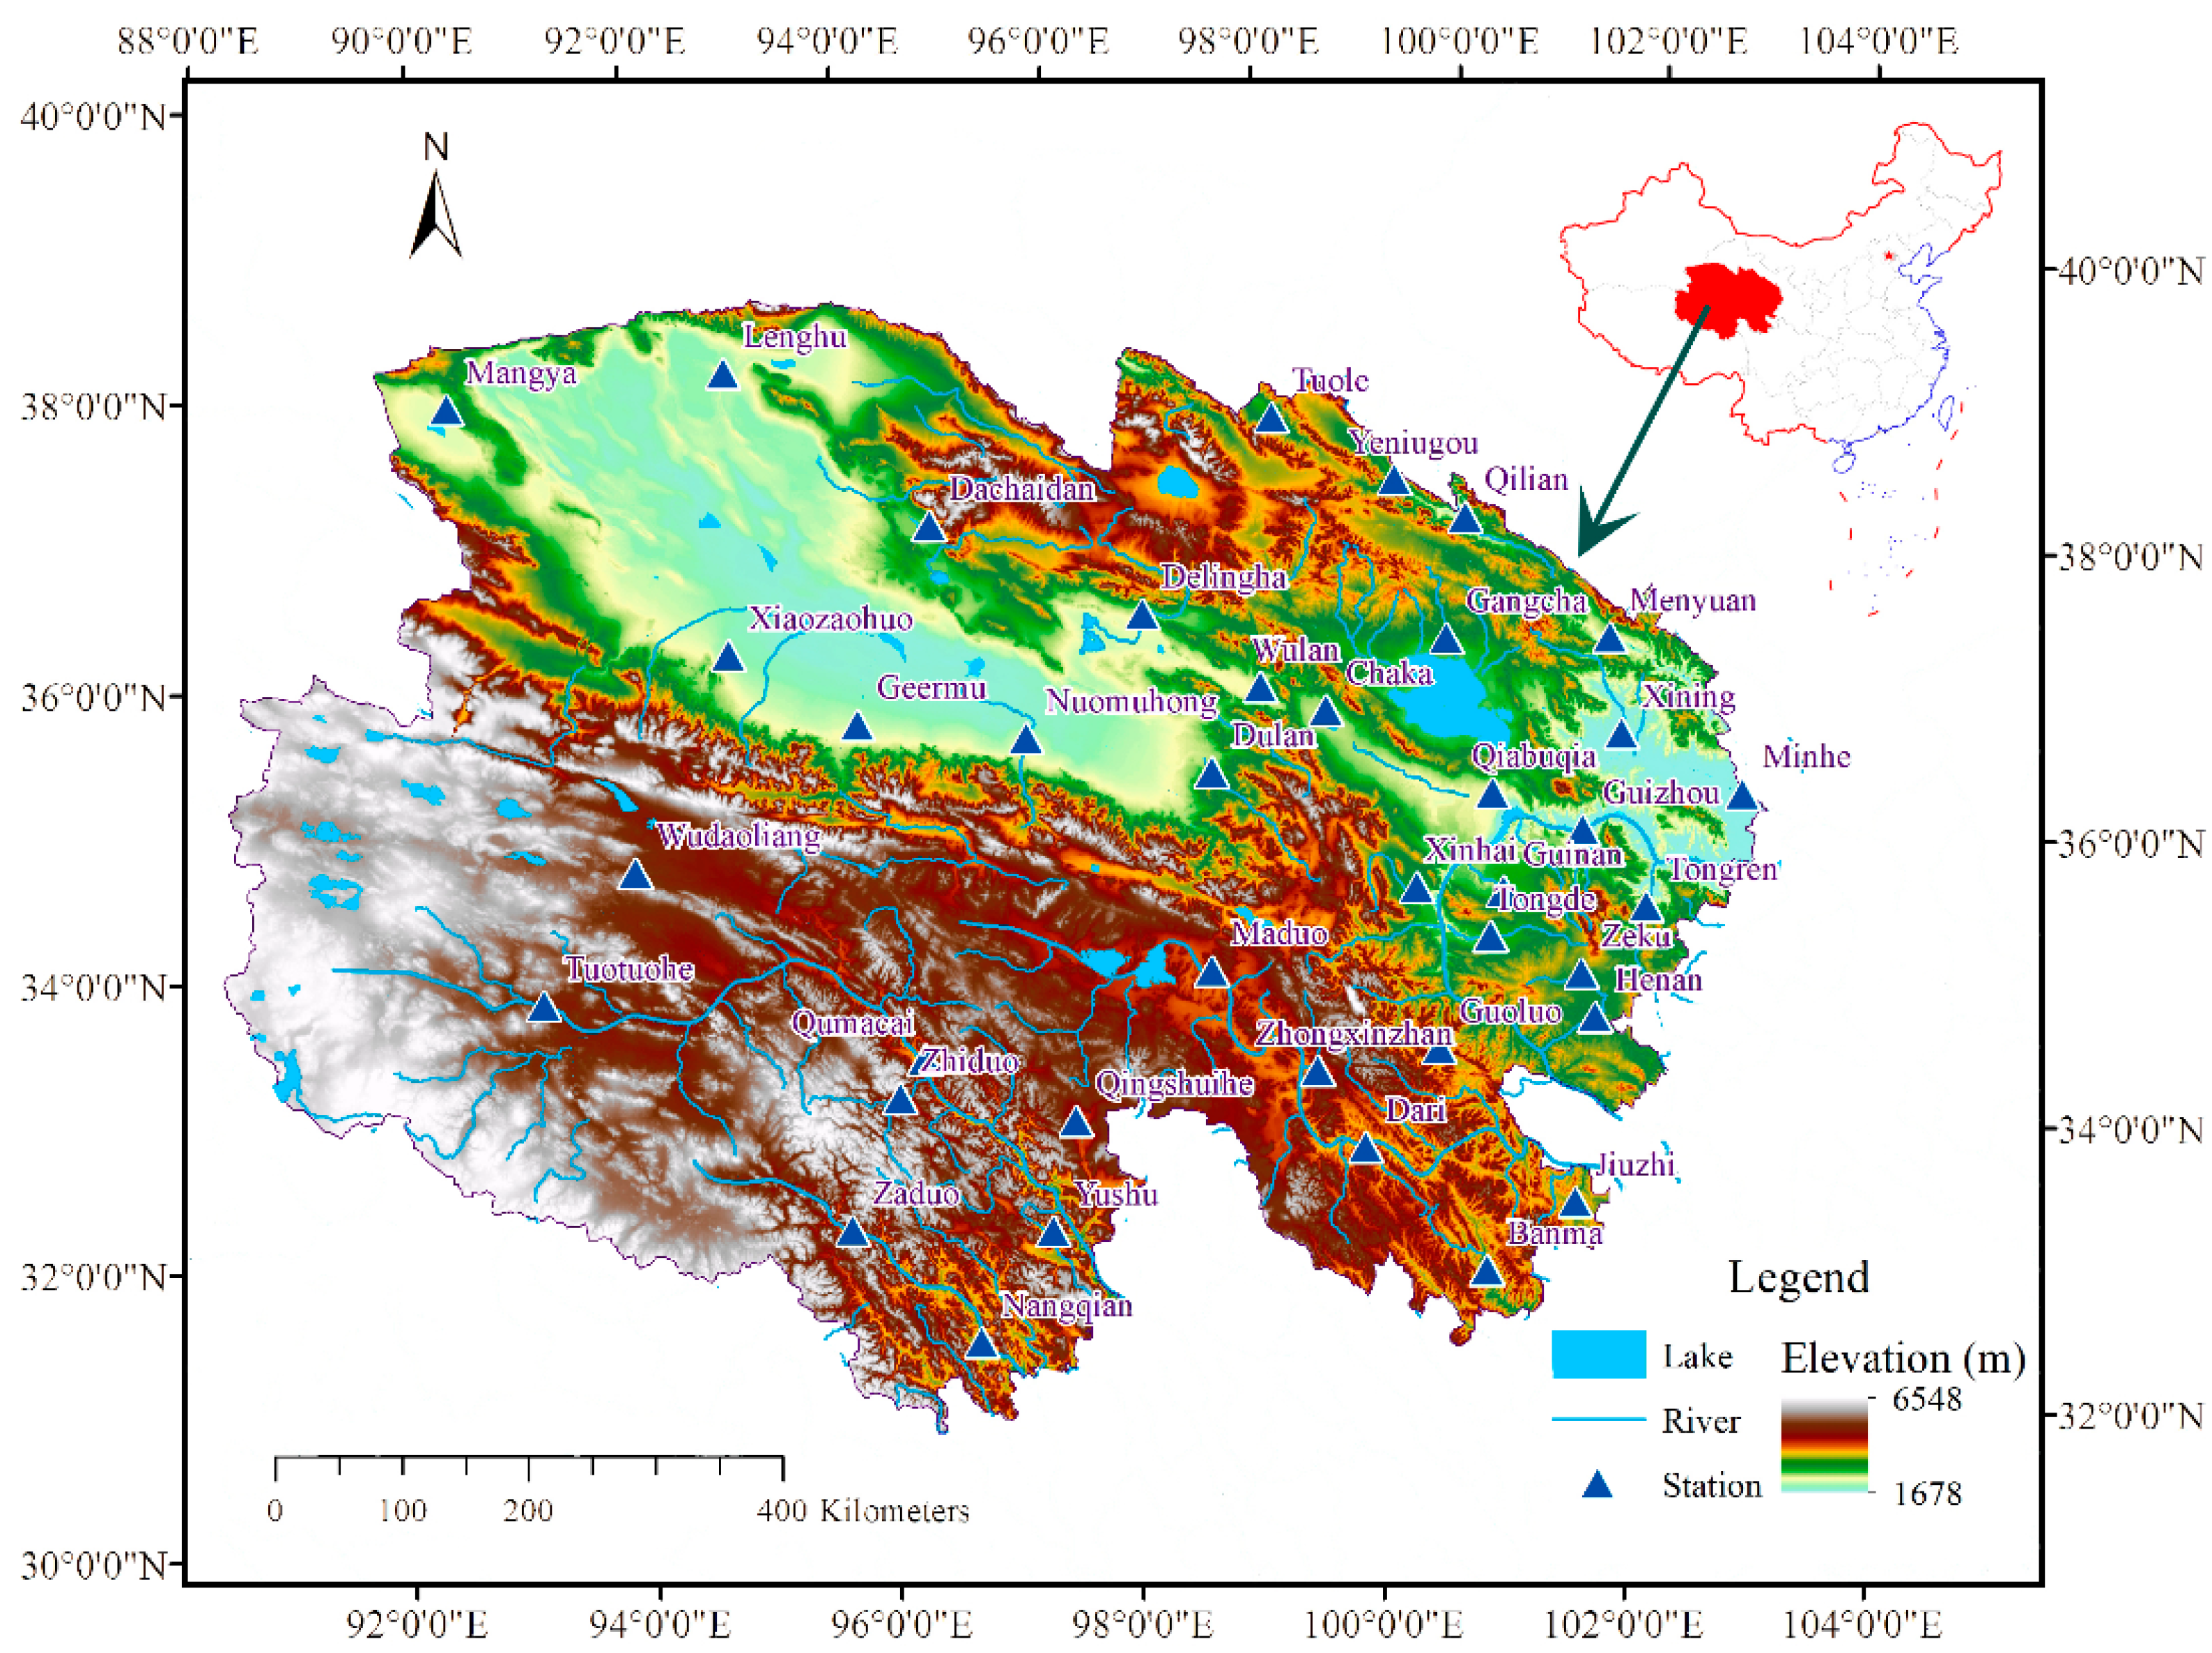
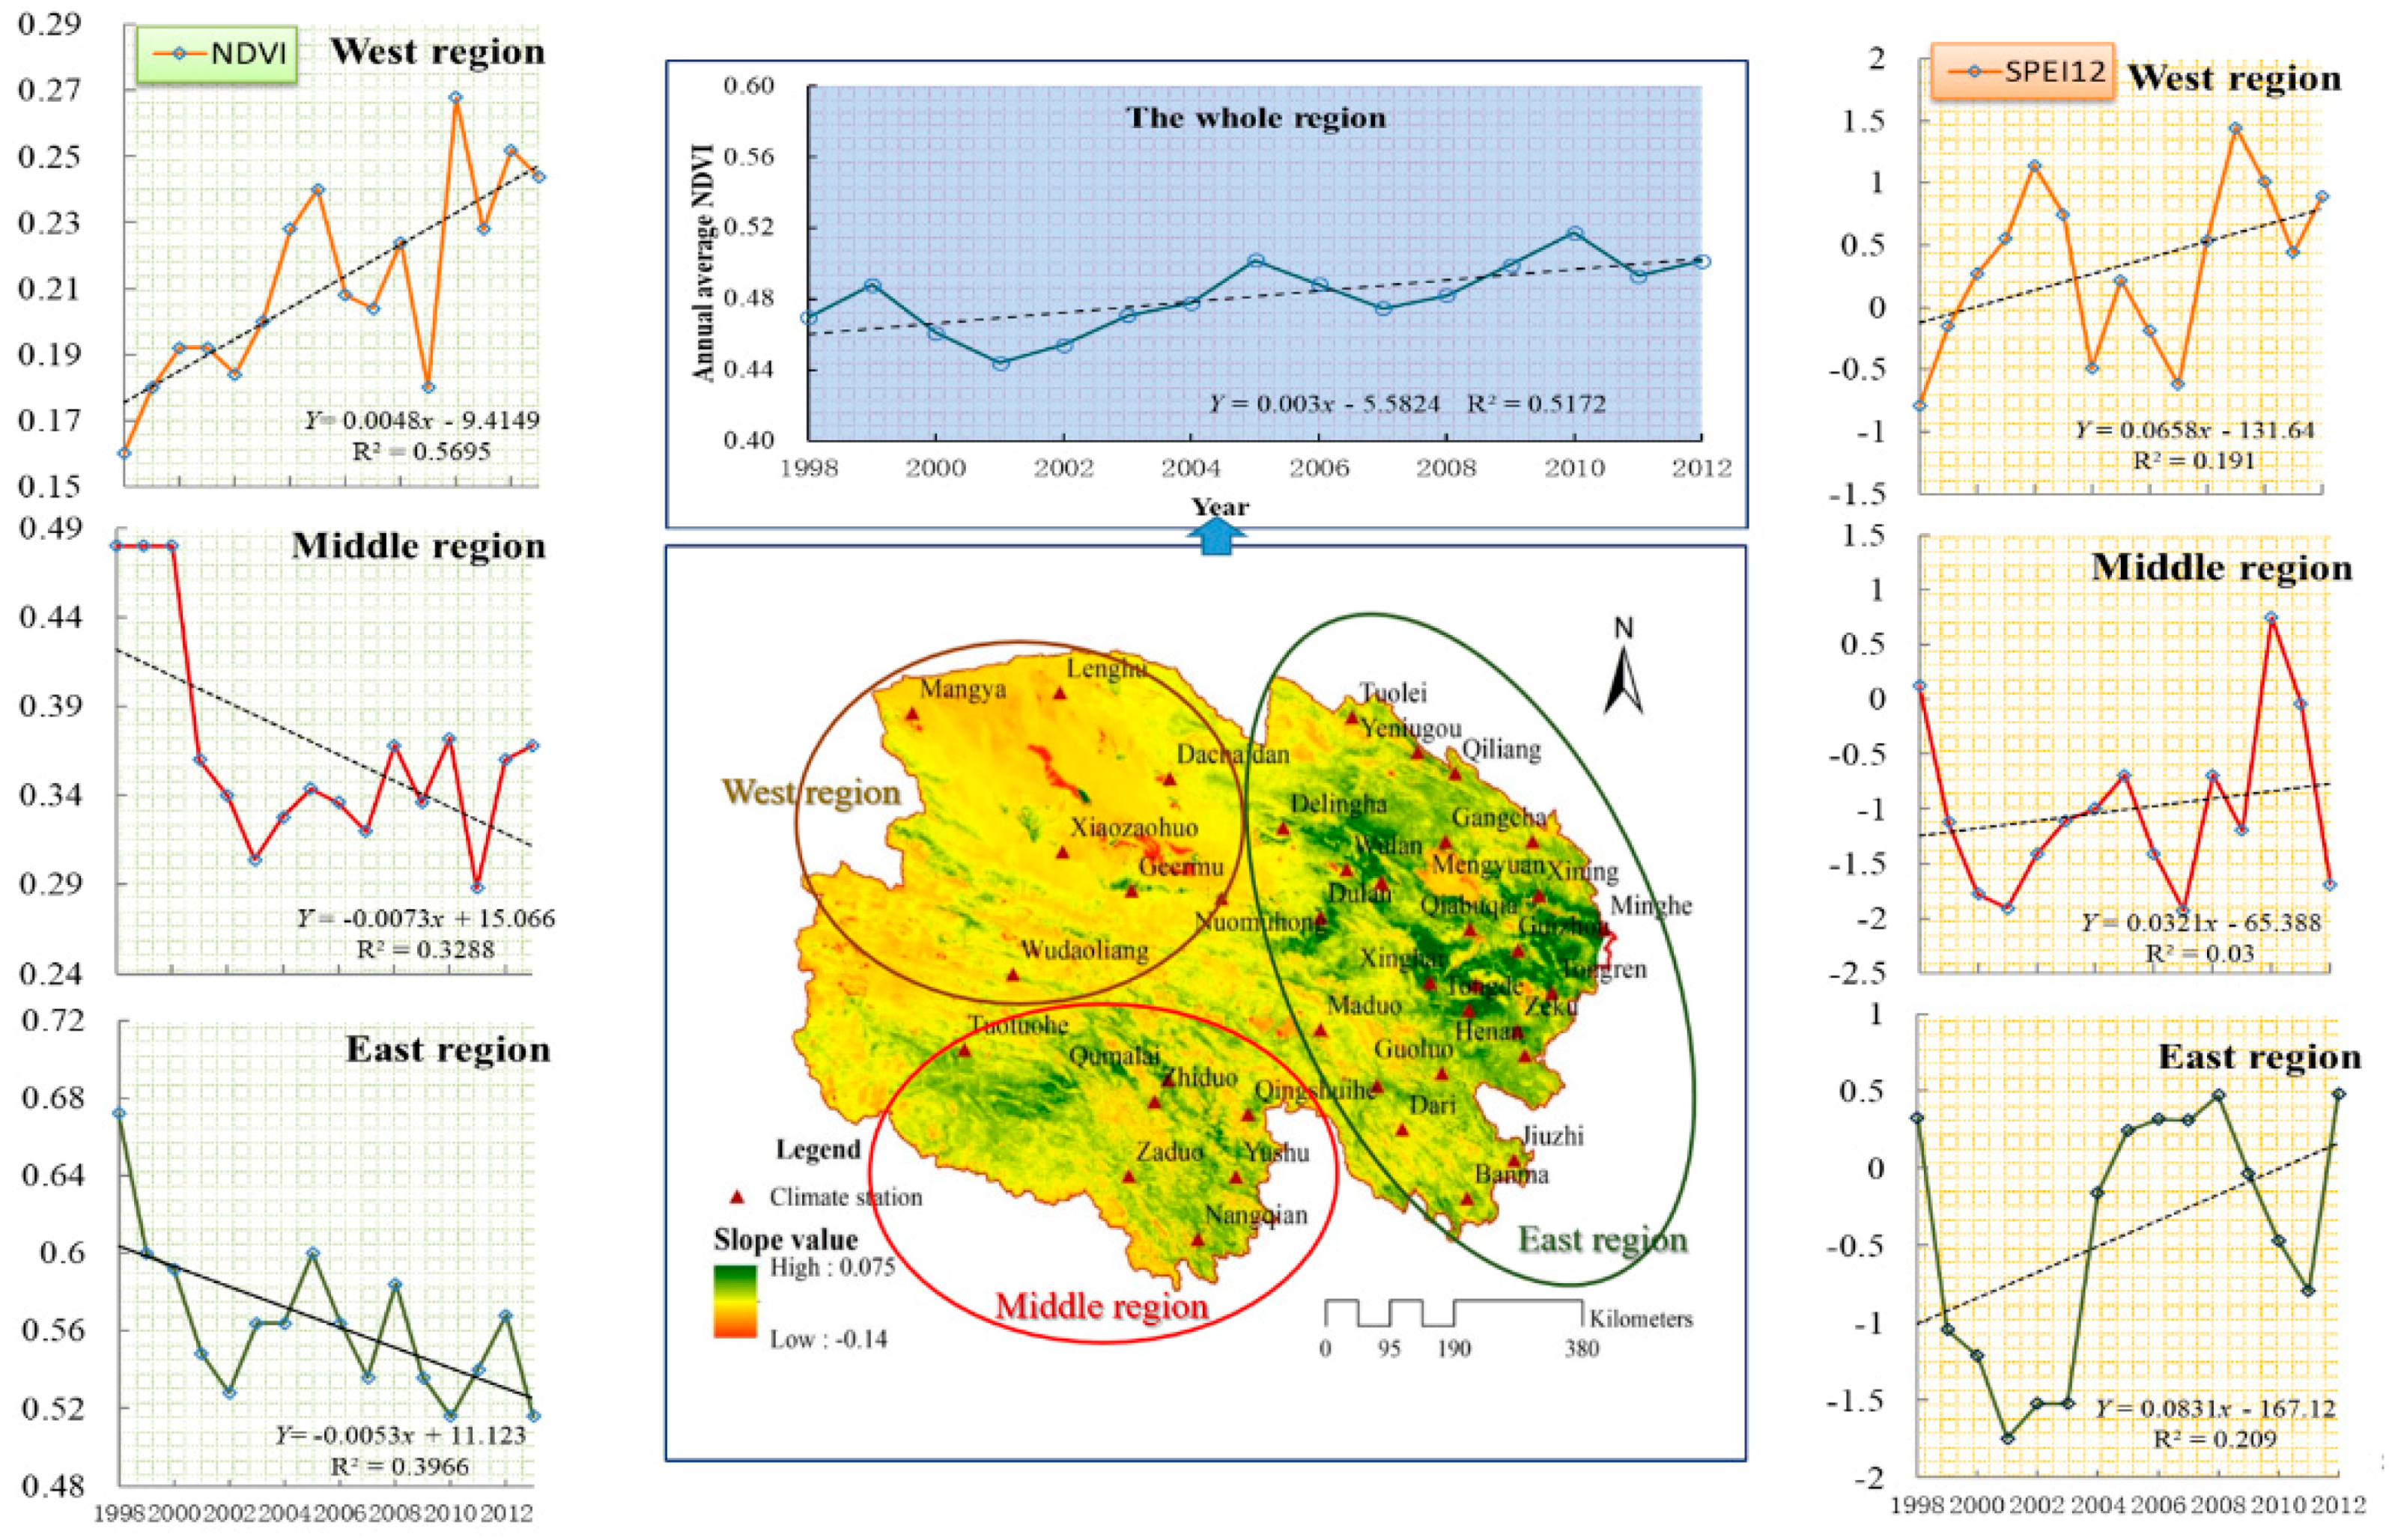
2.1. Study Area

Qinghai Province is located in the northeastern part of the Qinghai-Tibet Plateau (31°32′–39°12′N, 89°24′–103°04′E) with an area of 721,000 km2. The topography is complex and diverse with an average elevation of 3000 m [20,44]. Because Qinghai Province belongs to the inland hinterland, far from the sea, the warm air mass is not easy to invade due to the terrain acting as a barrier. Furthermore, the region is controlled by the plateau monsoon and the East Asian monsoon, which leads to changes in the frequency and the uniform spatio-temporal distribution of precipitation. The annual average precipitation ranges from 50 mm to 450 mm—Cold Lake Town has recorded the lowest precipitation of 15 mm and Jiuzhi County has recorded the highest value of 774 mm [45]. Averagely, Qinghai has received one of the lowest amounts of precipitation and has become the most arid region compared to others in the same latitude in the northern hemisphere [46]. In addition, climate is characterized by strong solar radiation and frequent weather disasters [47]. The unique natural environment of Qinghai Province determines the flora and vegetation types. The main vegetation types include alpine shrubs and alpine meadows with forest coverage of only 2.65% [20]. In the past 30 years, the drought in Qinghai Province has gradually aggravated and become one of the main meteorological disasters due to climate change and agricultural development. Therefore, it will be significant to study and analyze the spatio-temporal regularity of drought and the relationship between climate and vegetation in Qinghai Province.
The spatio-temporal characteristics of meteorological factors were studied based on the analysis of monthly data from 39 meteorological stations (Figure 1).

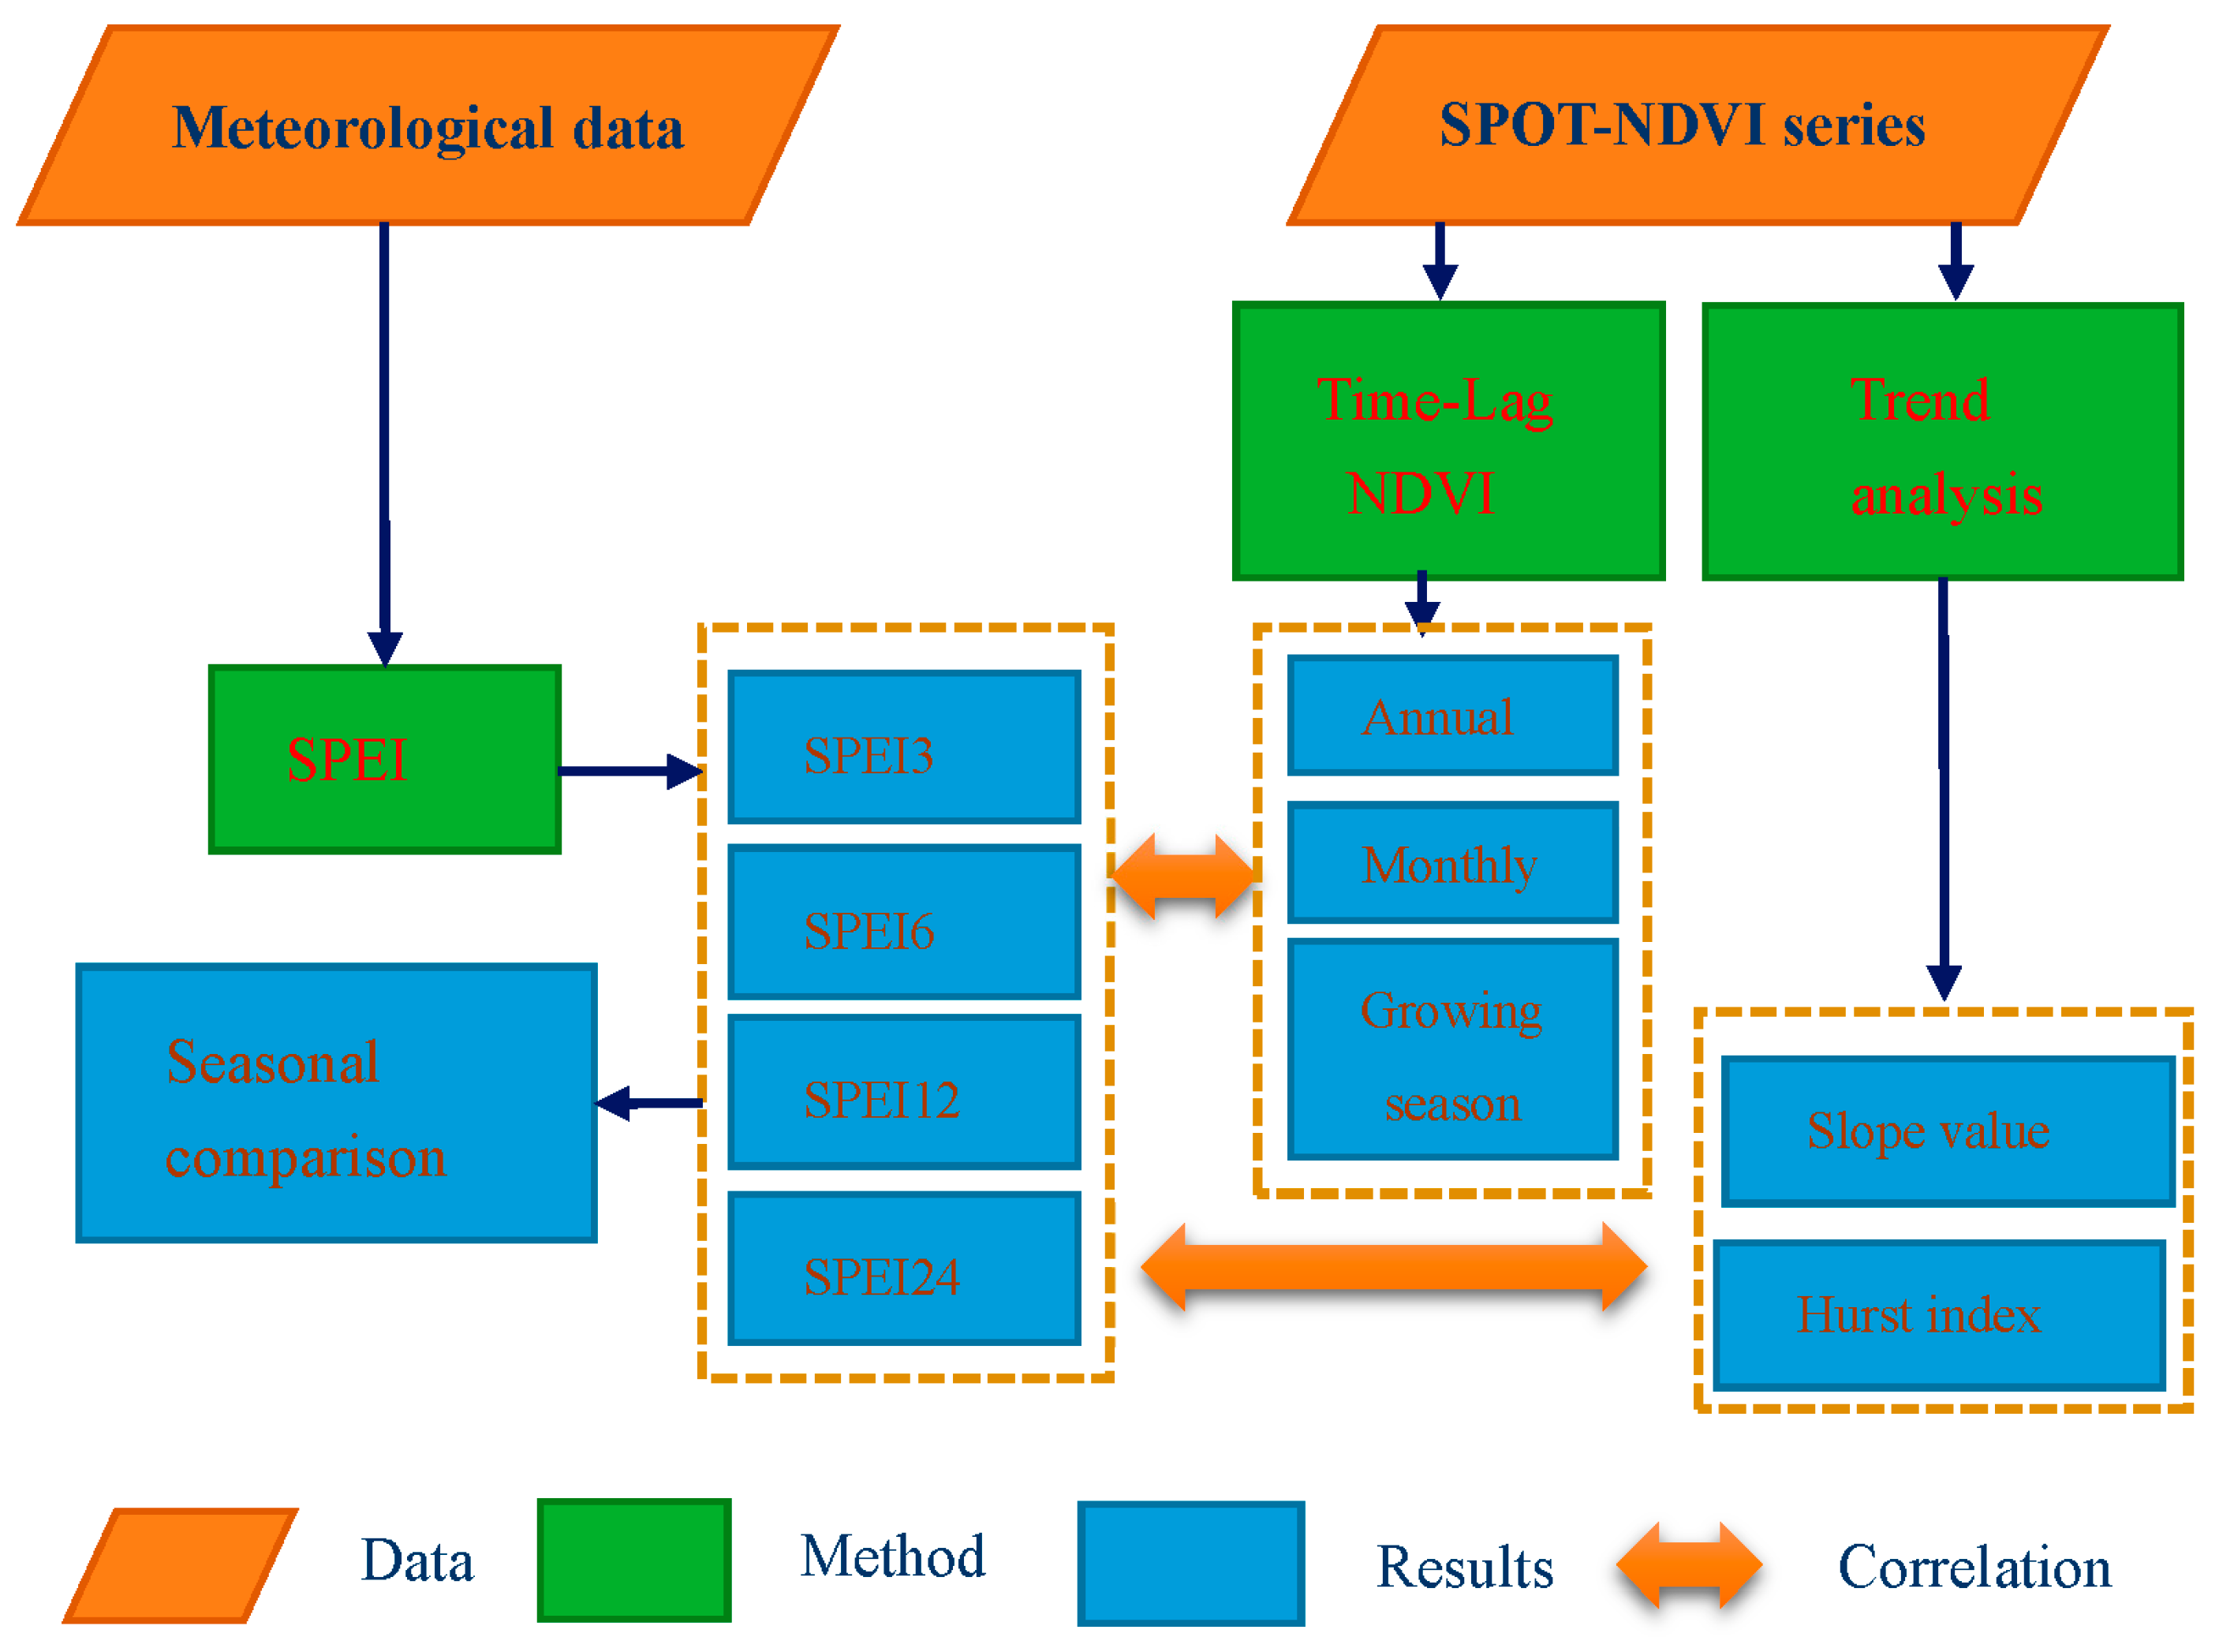
2.2. Data Sources and Methods

The meteorological data were acquired from National Climate Center (NCC) of the China Meteorological Administration, National Meteorological Information Center, and included monthly temperature, precipitation, wind speed, relative humidity, and actual water vapor pressure. The 39 stations are almost evenly distributed in Qinghai Province (Figure 1), which can reflect the overall meteorological characteristics of Qinghai. These data are continuous with no missing value, which ensures their uniformity. The quality and homogeneity of the climatic records from these stations were checked and controlled using the cumulative deviations test and the standard normal homogeneity test [48,49].
Systéme Pour l’Observation de la Terre Vegetation (SPOT VEGETATION) time-series 10-day composite images (http://www.vito-eodata.be/) derived from the vegetation instrument of the SPOT 4 and 5 satellites were used to calculate the temporal and spatial NDVI values. The resolution of the data is approximately 1 km [40,50]. Each composite consists of a digital number (DN) file ranging from 0 to 255 and a status map (SM) file. Further, the NDVI data was derived by NDVI = −0.1 + 0.004 × DN. Using this equation, the NDVI values were restricted to the range between −0.096 (DN = 1) and 0.92 (DN = 255). Then NDVI data were pre-processed with a Maximum Value Compositing (MVC) method to avoid the errors and uncertainty resulting from large solar zenith angles and cloud cover [50]. The MVC method for NDVI at monthly scale retains only the highest spectral value on a per-pixel basis for the series of NDVI data. The yearly NDVI was calculated by averaging the monthly maximum NDVI based on a per pixel basis, which provided annual information about the vegetation conditions in Qinghai province. The equation was calculated as follows:
N D V I y e a r = i = 1 12 N D V I m o n t h 12
where NDVImonth is the monthly maximum NDVI. NDVImonth was calculated by maximizing the three ten-day sets of data including NDVI1, NDVI2, and NDVI3, which refer to the maximum NDVI in the first ten days, second ten days, and third ten days of each month, respectively [50].

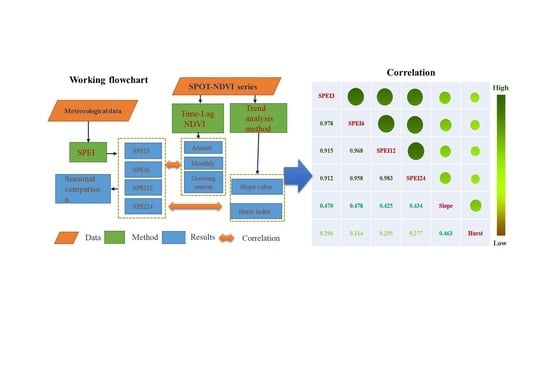
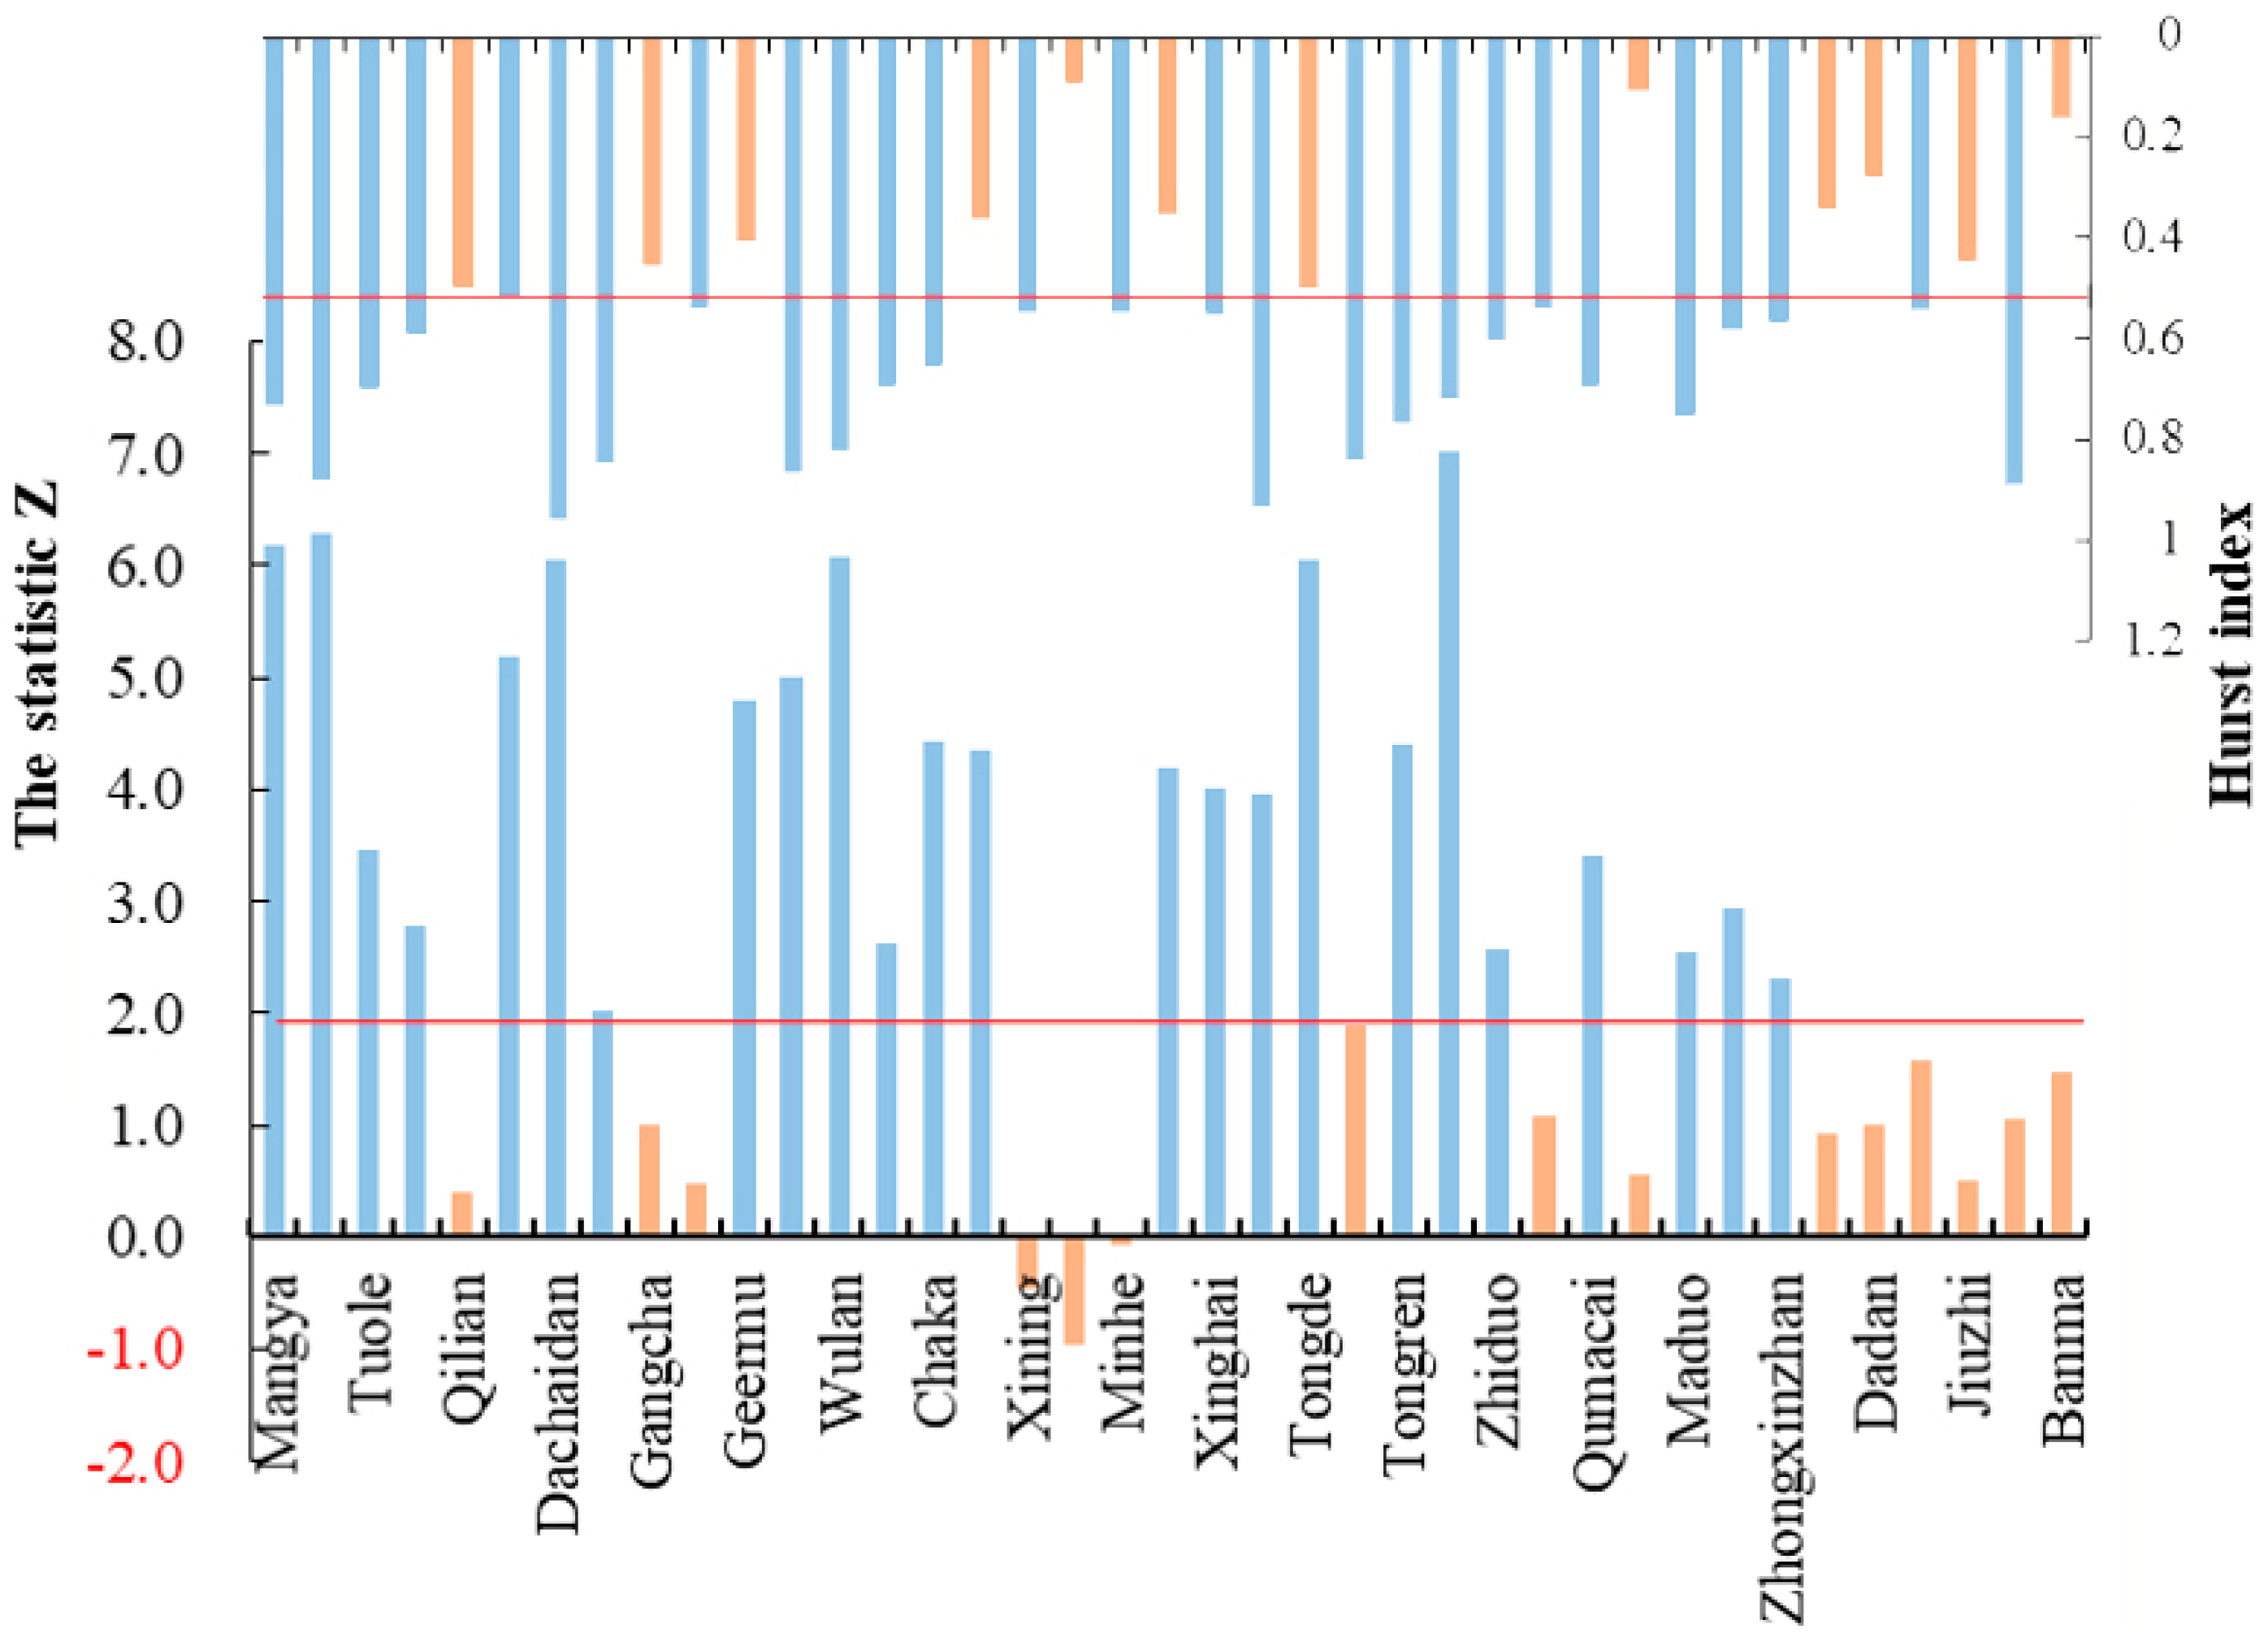
2.2.1. Trend Analysis for Vegetation Change

Temporally, the changing trend and intensity of NDVI can be analyzed using linear regression and then fitted to simulate the trend of each raster grid in the study region. The slope of the equation represents the changing intensity and can reflect the spatial distribution of change in the vegetation cover at different periods [32]. The advantage of this method is that it can be fitted using data for all years and thus can eliminate the influence of random and accidental factors on vegetation growth in the study period. Thus, slope values calculated can reflect the actual conditions of vegetation changes in a specified period [51]. The slope is calculated as follows:
S l o p e = n × i = 1 n i × N D V I i ¯ ( i = 1 n i ) ( i = 1 n N D V I ¯ i ) n × i = 1 n i 2 ( i = 1 n i ) 2
where, n is the number of years that are being studied; N D V I ¯ i is the mean value of NDVI at time i; Slope is the trend of the NDVI, when Slope > 0, the trend is positive in n years, and Slope < 0 indicates that the trend is negative in n years.
In order to determine the significance of the NDVI trends, the Mann-Kendall non-parametric test method was used. The values of Kendall inclination β and the Z statistics are generally estimated [52]. β is an unbiased estimate for long-term trends, when β > 0, the sequence shows a significant upward trend; when β = 0, the sequence shows no significant trend; and when β < 0, the sequence shows a significant downward trend [53]. Based on the Z statistics, results can be divided into significant changes (Z > 1.96 or Z < −1.96) and non-significant changes ( 1.96 Z 1.96 ).

2.2.2. Hurst Index Analysis Method

The Hurst index (H), proposed in 1951, is used to quantitatively describe the persistence over time series data sets [54]. It is widely applied in the field of natural sciences as many time series data sets, such as in the field of hydrology, geology, and climate, and data such as earthquake frequency, sunspots, etc. Vegetation cover changes are similar to hydrology, climate, and geochemistry, which are a natural phenomenon with self-similarity and long-range dependence [34,35]. The Rescaled Range Analysis (R/S analysis) in terms of the asymptotic behaviour of the rescaled range is usually used to estimate the Hurst values of vegetation [55].
The characteristics of the Hurst index are as follows [56]: The value of H ranges from 0 to 1 and it is calculated based on the least-square theory. When 0 < H < 0.5, the time series dataset is discontinuous, that is, the change in the future is expected to be different to the current trend of change. The lower the value of H, the higher is the discontinuity. When H = 0.5, the dataset is considered to be relatively independent with a standard Gauss distribution, which does not have continuity. When 0.5 < H < 1, the time series dataset is continuous, that is, the change in the future is similar to the current trends, and values of H closer to 1 indicate stronger continuity.

2.2.3. The Standardized Precipitation Evapotranspiration Index

The Standardized Precipitation Evapotranspiration Index (SPEI) is a multi-scale drought index based on climatic data, which combines the advantages of the SPI and Palmer drought index (PDSI) [13]. It is based on a monthly climate water balance that describes the degree of deviation of regional dry and wet conditions from climatological mean ones, by standardizing the difference between precipitation and potential evapotranspiration (PET). The PET is calculated using the Thornthwaite equation (Thornthwaite, 1948) which is a function of monthly mean temperature. Then the difference between the precipitation (P) and PET for the month i is calculated according to:
D i = P i P E T i .
The calculated Di values are aggregated at different time scales, following the same procedure as that for the SPI. Because there may be negative values in the original data sequence Di, the SPEI uses the three-parameter log-logistic probability distribution. The probability distribution function of the D series, according to the log-logistic distribution, is given by
F ( x ) = [ 1 + ( α χ γ ) β ] 1
where α, β, and γ are scale, shape, and location parameters, respectively, for D values in the range (γ < x < ∞). The next step is to define W parameter using following equation
W = −2ln(P)
where P is the probability of exceeding a determined D value. When P is greater than 0.5, P in Equation (5) is replaced by 1 − P and the sign of the resultant SPEI is reversed. Finally, SPEI is calculated as
S P E I = W C 0 + C 1 W + C 2 W 2 1 + d 1 W + d 2 W 2 + d 3 W 3
where C0 = 2.515517, C1 = 0.802853, C2 =0.010328, d1 = 1.432788, d2 = 0.189269, and d3 = 0.001308.
A full description of the methodology and validation is described by Vicente-Serrano et al. [13]. In this study, SPEI 3, SPEI 6, SPEI 12, and SPEI 24 were used and to represent the characteristics of 3, 6, 12, and 24 months, respectively. The calculation was performed using ‘SPEI’ package of R software (http://www.Rproject.org/).
Based on the drought classification criteria of SPEI established by the China Meteorological Administration, the intensity of drought in the study area was determined. The SPEI ranges and their corresponding meanings are listed in Table 1.

2.2.4. The Correlation between NDVI and SPEI

To reveal the vegetation response to climate factors, we carried out correlation analysis by linear regression model between SPEI and NDVI values. The NDVI values corresponding to SPEI values were extracted from the NDVI layers by a 5 km × 5 km rectangle at the sites of the meteorological stations to reflect the local average NDVI. Using the SPEI and the NDVI data for the 39 sites from 1998 to 2012, we determined the correlation coefficient at different time scales and explored the correlation and hysteresis. For the annual scale, we used the NDVI values of the year and one year lagged NDVI series. In order to eliminate the impact of extreme climate, we analyzed the correlation coefficients between annual average NDVI and annual average SPEI. For the monthly scale, previous studies found the time lag of the vegetation responses to climate to generally be shorter than a quarter; therefore, this study considered the time lags for 0–3 months [57]. The correlation coefficient of variables reflect the vegetation responses to SPEI at different scales. When r > 0, the two variables are positively correlated, and when r < 0, the two variables are negatively correlated. Further, when |r| ≥ 0.7, the two variables are considered to be highly correlated; when 0.5 < |r| < 0.7, then they are moderately correlated; when 0.3 < |r| < 0.5, the correlation is considered low; and when |r| < 0.3, the correlation between them is considered very weak.
The procedure for our working procedure is illustrated in Figure 2.

3. Results

3.1. Changes of the SPEI Values in Qinghai Province

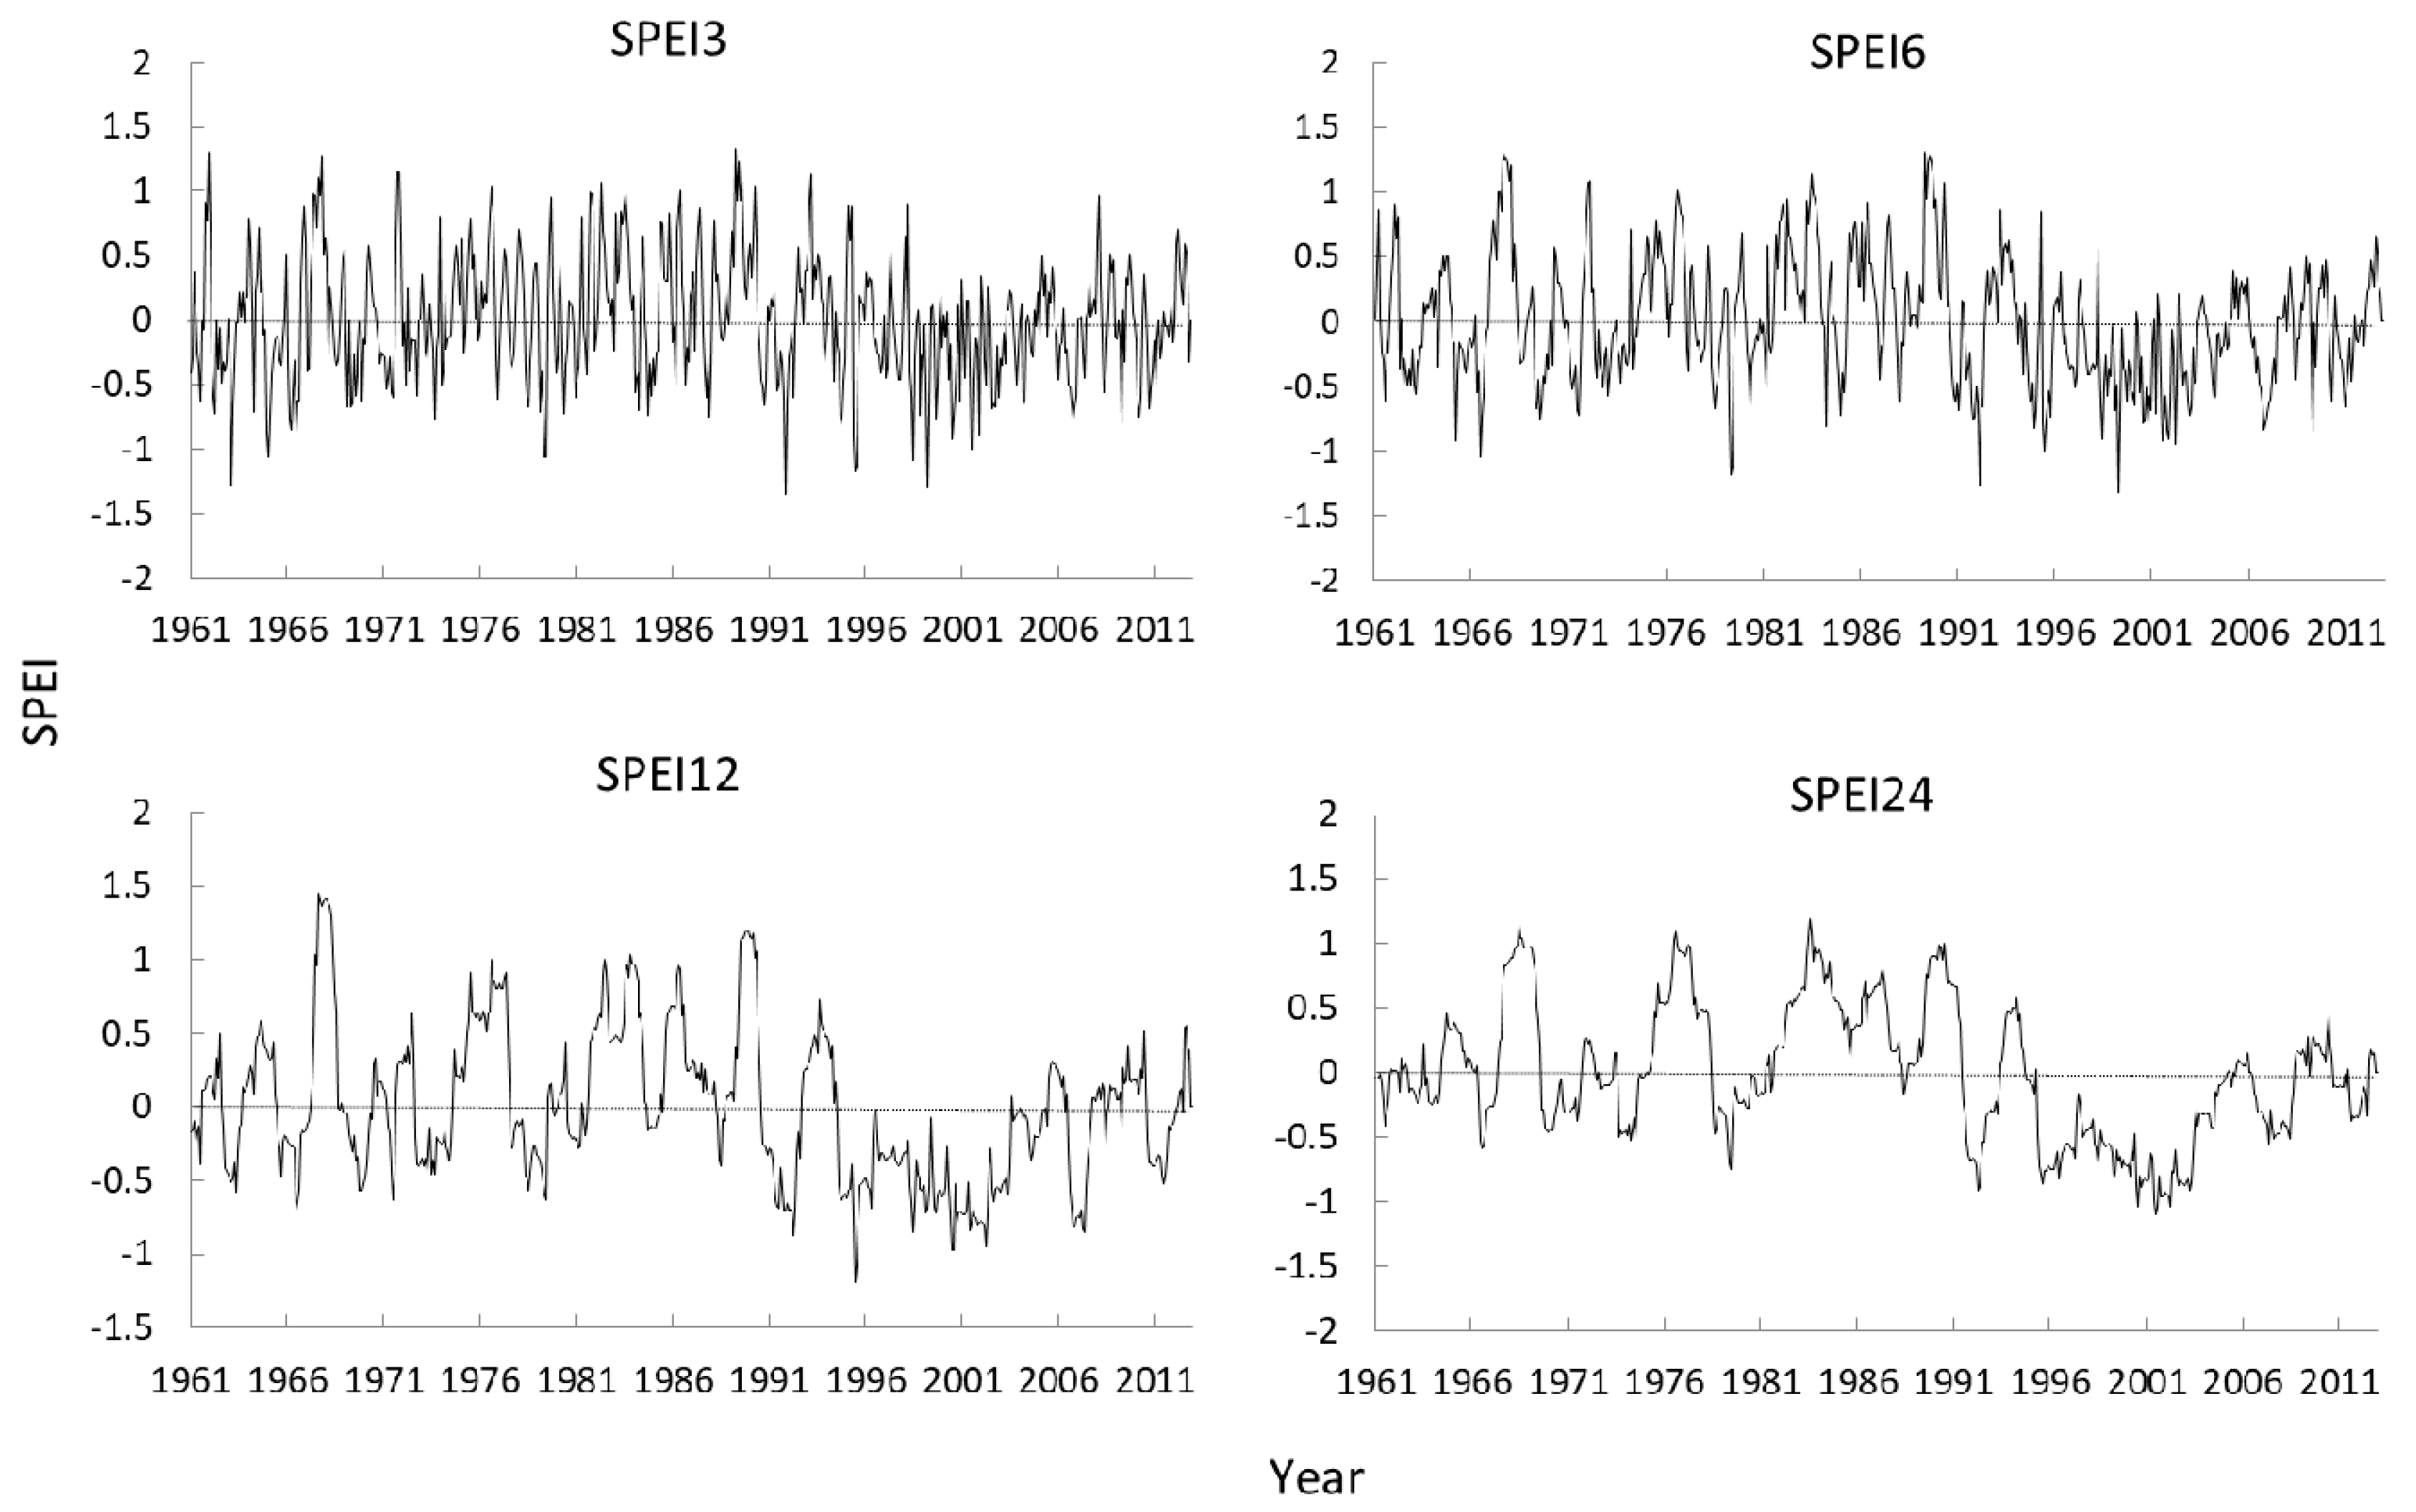
3.1.1. Multi-Scale Characteristics of SPEI

The average SPEI values of 39 meteorological stations at different time scales spanning 3, 6, 12, and 24 months are displayed in Figure 3. Result showed that SPEI values at smaller time scales such as SPEI 3 and SPEI 6 had high-frequency fluctuations, which indicated a more obvious change between the wet and dry status. On the contrary, the larger time scale SPEI values exhibited lower variabilities and revealed long-term drought or wetness. However, irrespective of the time scale, the general trend in the SPEI changes was similar.
SPEI 3, in comparison to the SPEI of longer time scales, showed the largest fluctuation amplitude which was sensitive to short-term precipitation and temperature change and it fully reflects the characteristics of short-term drought irregularity and frequency of Qinghai Province. The values of SPEI 6 also showed a relatively large fluctuation amplitude owing to the impact of temperature and precipitation, which indicated that the semi-annual frequency of drought is high in Qinghai. SPEI 12 and SPEI 24 more clearly reflect the changes of drought over the years in Qinghai Province. SPEI 24 showed that the frequency of drought from 1961 to 1990 was low, that most of years had no drought, or even had wet years, and only a few years recorded a drought phenomenon. However, the lower SPEI 24 values in 1990s reflected the high drought intensity and moderate intensity droughts began to appear. Moreover, the duration of drought was longer, spanning over a few years such as in 2001.
Our results show that the SPEI of multi-time scales can clearly quantify water balance anomalies with respect to long-term dry and wet conditions [13]. Therefore, it can obtain the status of water resource availability from rainfall indirectly, and can effectively reflect the degree and duration of drought in Qinghai Province.

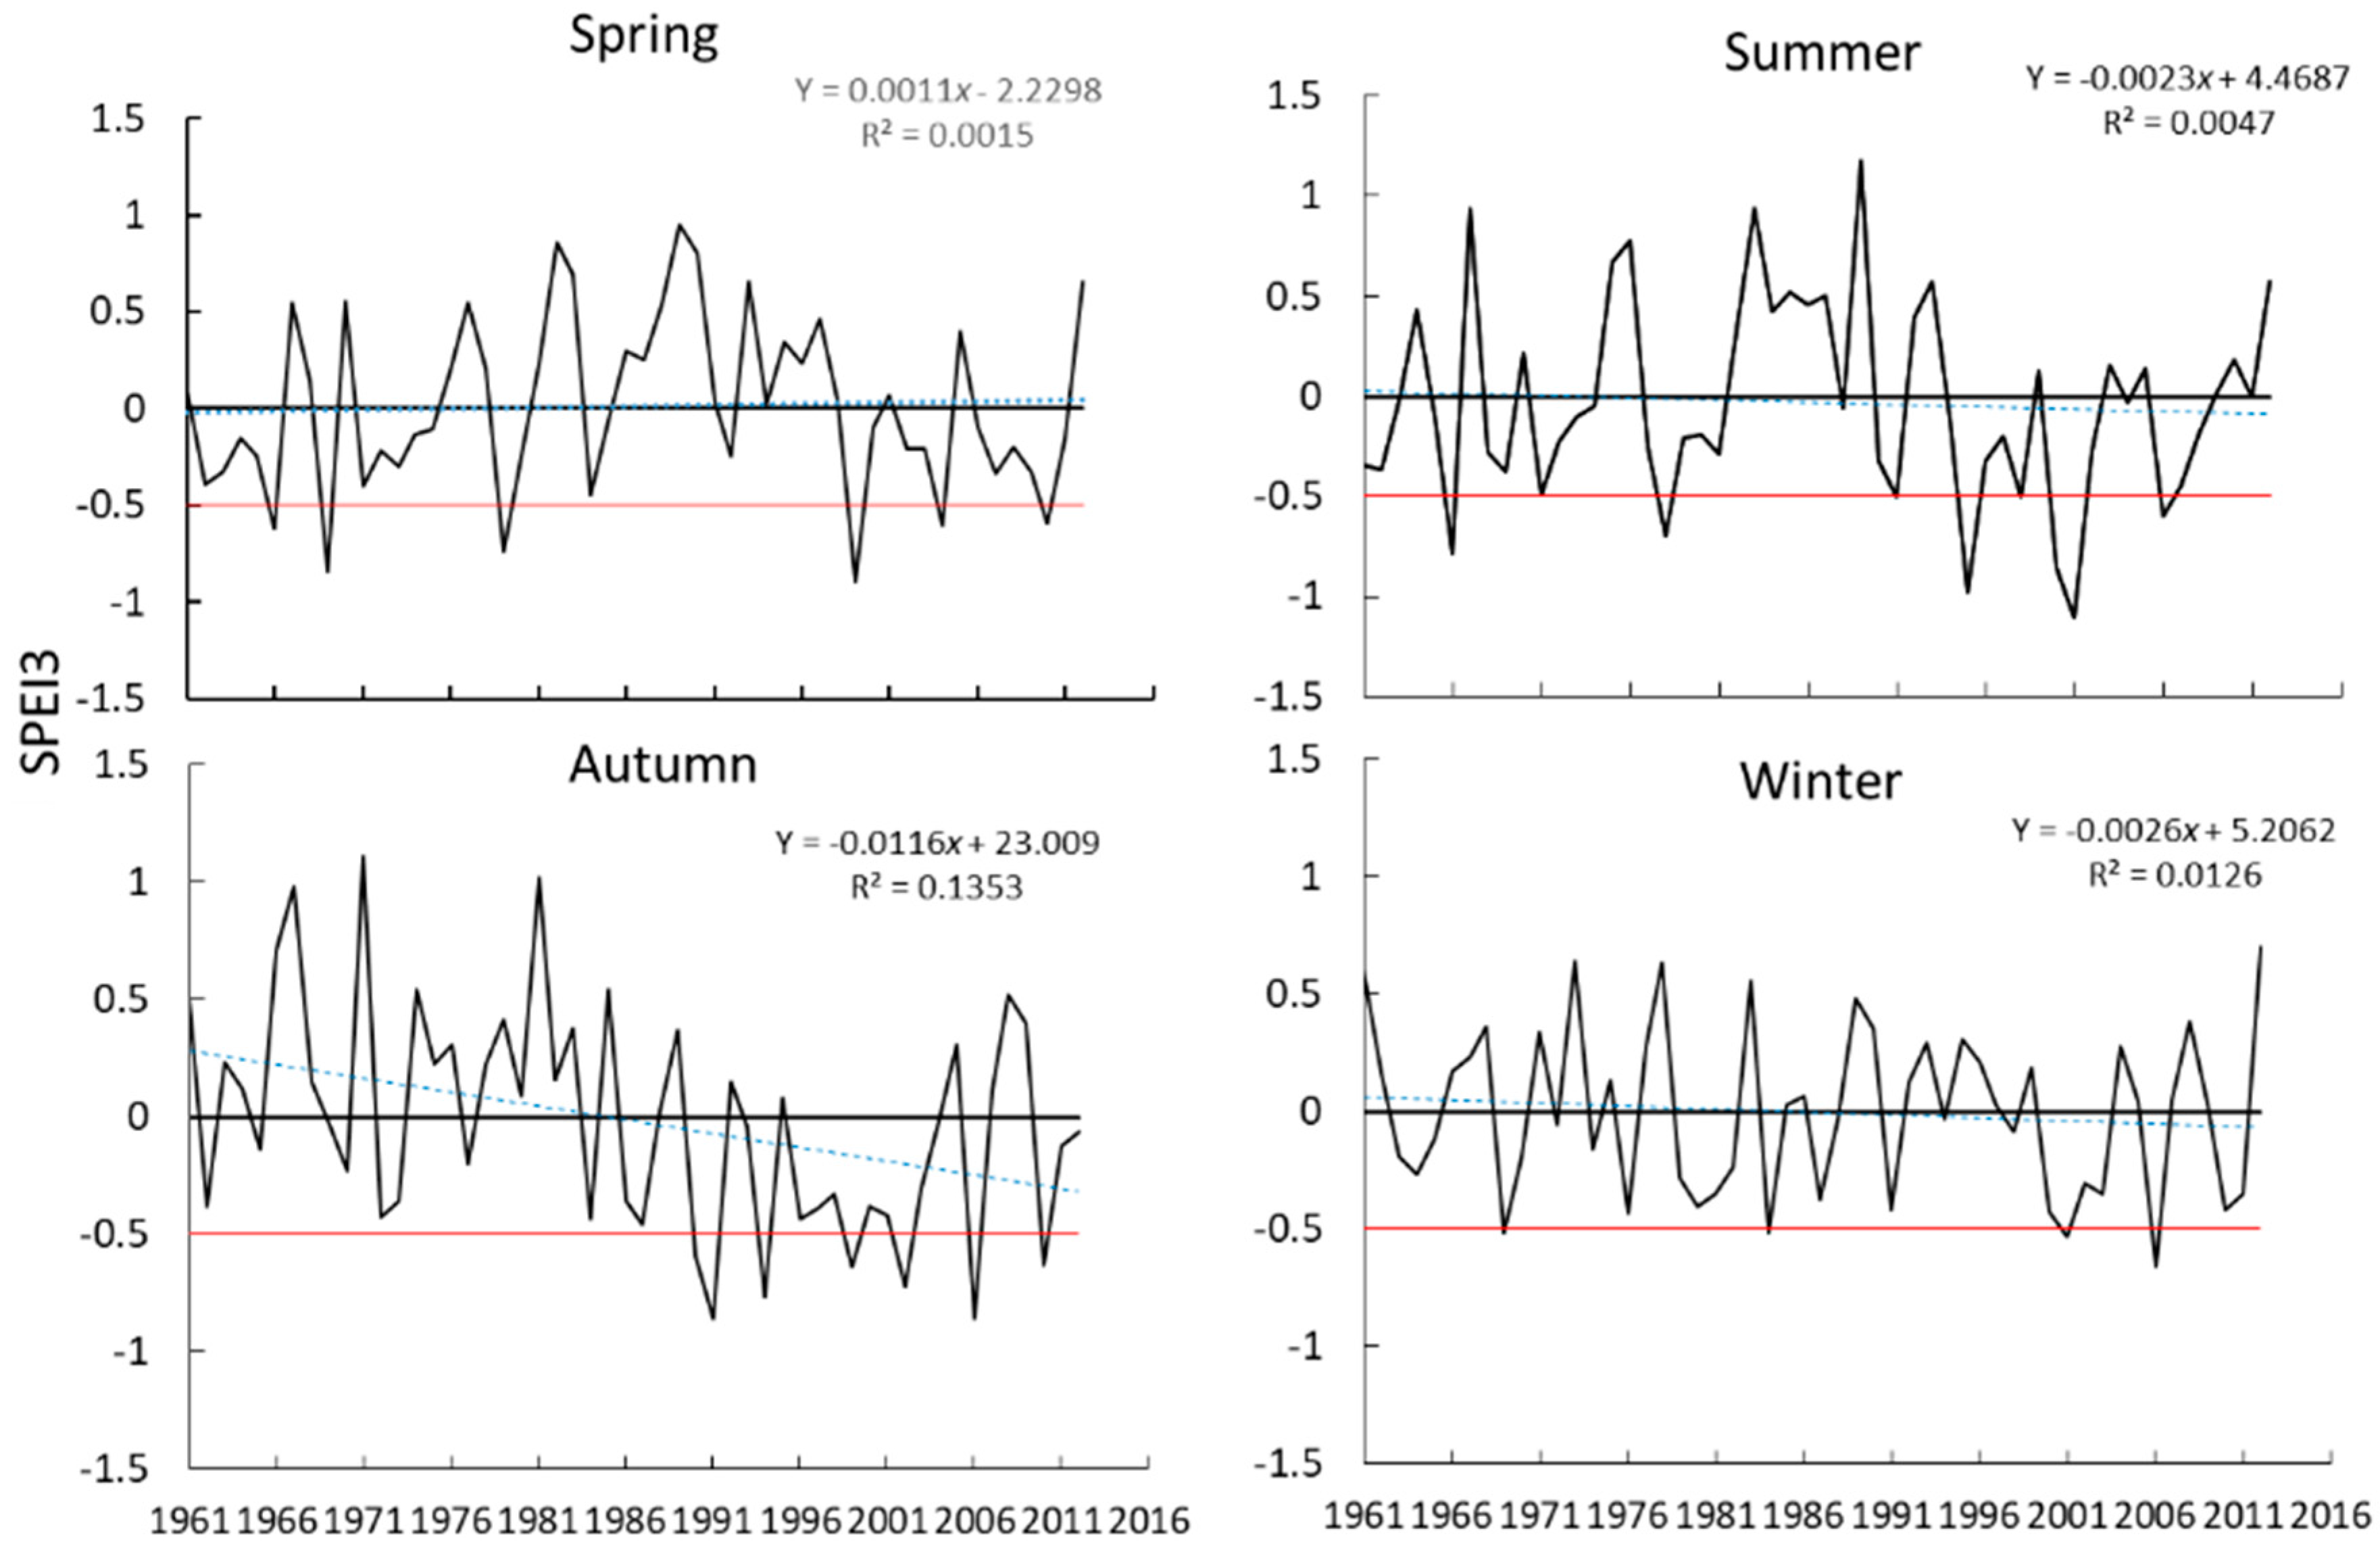
3.1.2. Seasonal Distribution of SPEI

Influenced by the westerly climate, plateau monsoon, and the East Asian monsoon climate, the frequency of precipitation in Qinghai Province changed significantly for decades and the spatio-temporal distribution is uneven [58]. It can be seen from Figure 4 that the seasons for drought mainly appeared in spring, summer, and autumn.
From the SPEI values in spring, the trend was not obvious (R2 = 0.0015). However, the positive and negative fluctuations in the year were larger with slight drought in some years. The drought in summer mainly occurred in June, and the SPEI showed a decreasing trend compared to spring. Furthermore, the time and intensity of drought both increased and some moderate droughts were recorded. The drought in autumn generally occurred in September, and the values of SPEI showed a downward trend from 1961 to 2012 with R2 of 0.14, which indicated that the trend of drought in autumn in Qinghai was strong. However, the intensity of drought was relatively weaker in some years. In winter, the changes of SPEI and the positive and negative fluctuations were both not obvious, with no drought in most years from 1961 to 2012.
Based on our results of SPEI changes at the seasonal scale in Qinghai Province in recent 51 years, it can be seen that the intensity of drought in spring, summer, and autumn differed, while drought in winter was rare. In addition, the values of SPEI in autumn decreased most and the next was in summer.

3.2. Changes in NDVI in Qinghai Province

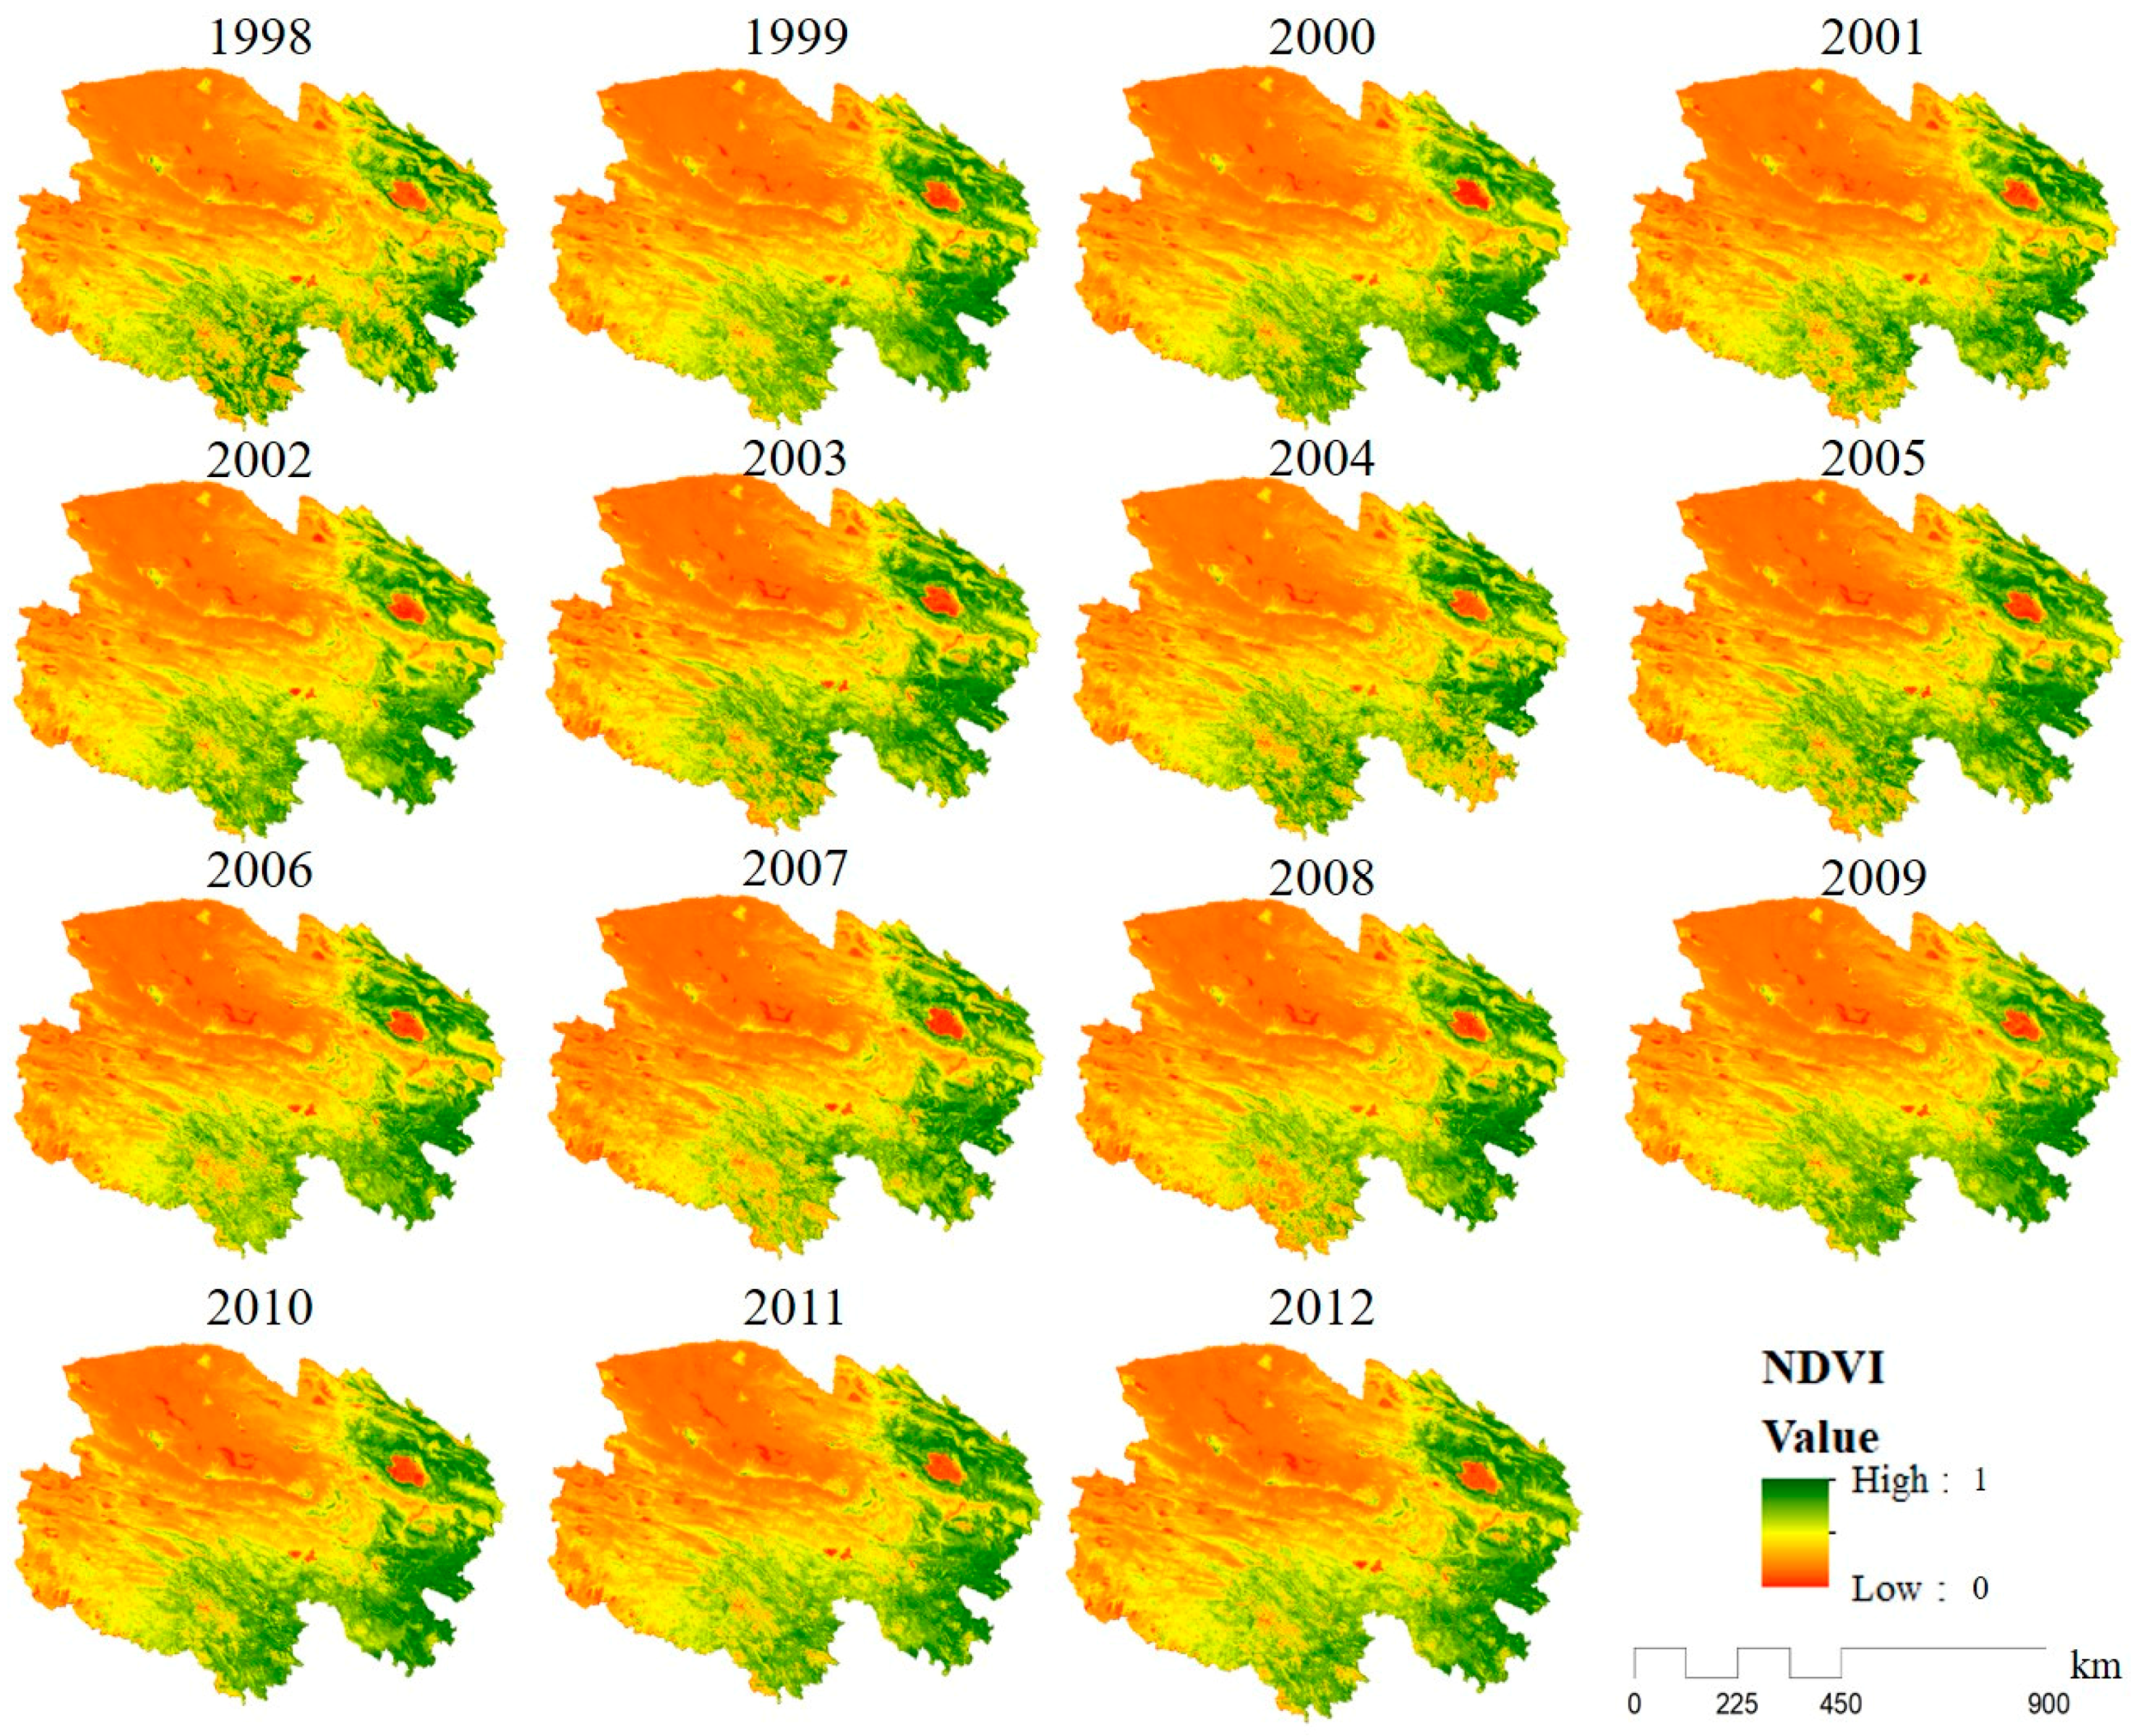
3.2.1. Spatio-Temporal Characteristics of NDVI

It can be seen from Figure 5 and Figure 6 that the vegetation coverage in Qinghai Province had great spatial differences, with an average annual NDVI value of 0.44. The eastern part of the study region was mainly scattered alpine meadow with a higher NDVI level, while the western part had a low NDVI level with desert grassland. The average annual NDVI fluctuated, but presented an increasing trend over 15 years (R2 = 0.5172). Between 2001 and 2005, the values increased continuously. The lowest value of NDVI in the 15 years appeared in 2001, while the highest value appeared in 2010. The increasing trend in the NDVI (R2 = 0.5172) over the years suggests that the vegetation coverage in Qinghai Province has increased.
The slopes of the NDVI changing trends in Qinghai Province were derived using linear regression. Based on this, the trend in the NDVI change and the spatial variation of these 39 sites were determined. Figure 5 shows that there exists great spatial variation in the slope values (in different colors) across the study area over the 15 years. In general, positive slopes were recorded for the eastern and southwestern parts of Qinghai Province, except for Minhe, Guizhou, and Xining stations, indicating an increase in the vegetation coverage. However, the slopes recorded for the northwestern part of Qinghai were less than 0, which suggested that in this region, the areas with vegetation coverage have reduced.

3.2.2. Trend Analysis of Vegetation Cover Change

The result of the Mann-Kendall non-parametric test indicated that 61.5% of study area changed significantly and 38.5% did not change significantly (Figure 6). For example, MangYa, LengHu, DaChaiDan, WuLan, TongDe, and TuoTuoHe stations showed a significantly increased trend at 0.05 confidence level. GoLuo, DaRi, HeNan, JiuZhi, and BanMa also showed an increasing trend but they were not significant at 0.05 confidence level. Further, XiNing, GuiZhou, and MinHe showed a decreasing trend but they were also not significant at 0.05 confidence level.
Based on the annual NDVI data from 1998 to 2012 in Qinghai Province and the R/S analysis, we also calculated the Hurst index of NDVI for each monitoring site (Figure 6). The result showed that 69.2% of the sites had a strong positive persistence in the area with vegetation cover (Hurst index >0.5), and in 30.8% of the sites, the trend was not persistent (Hurst index <0.5). In particular, the proportion of area that showed continuous improvement reached 64.1%, which was mainly seen in the MangYa, LengHu, TuoLe, YeNiuGou, XiaoZaoHuo, DaChaiDan, DeLingHa, and MuoMuHong areas. The proportion of area that showed continuous degradation was 5.1%, which included XiNing and MinHe. The proportion of area that showed a reverse continuous degradation was 28.2%, which mainly included in QiLian, GangCha, GeErMu, WuDaoLiang, YuShu, and GuoLuo areas. The remaining 2.6% of the study area showed a trend of reverse continuous improvement.

3.3. Correlation Analysis between NDVI and SPEI

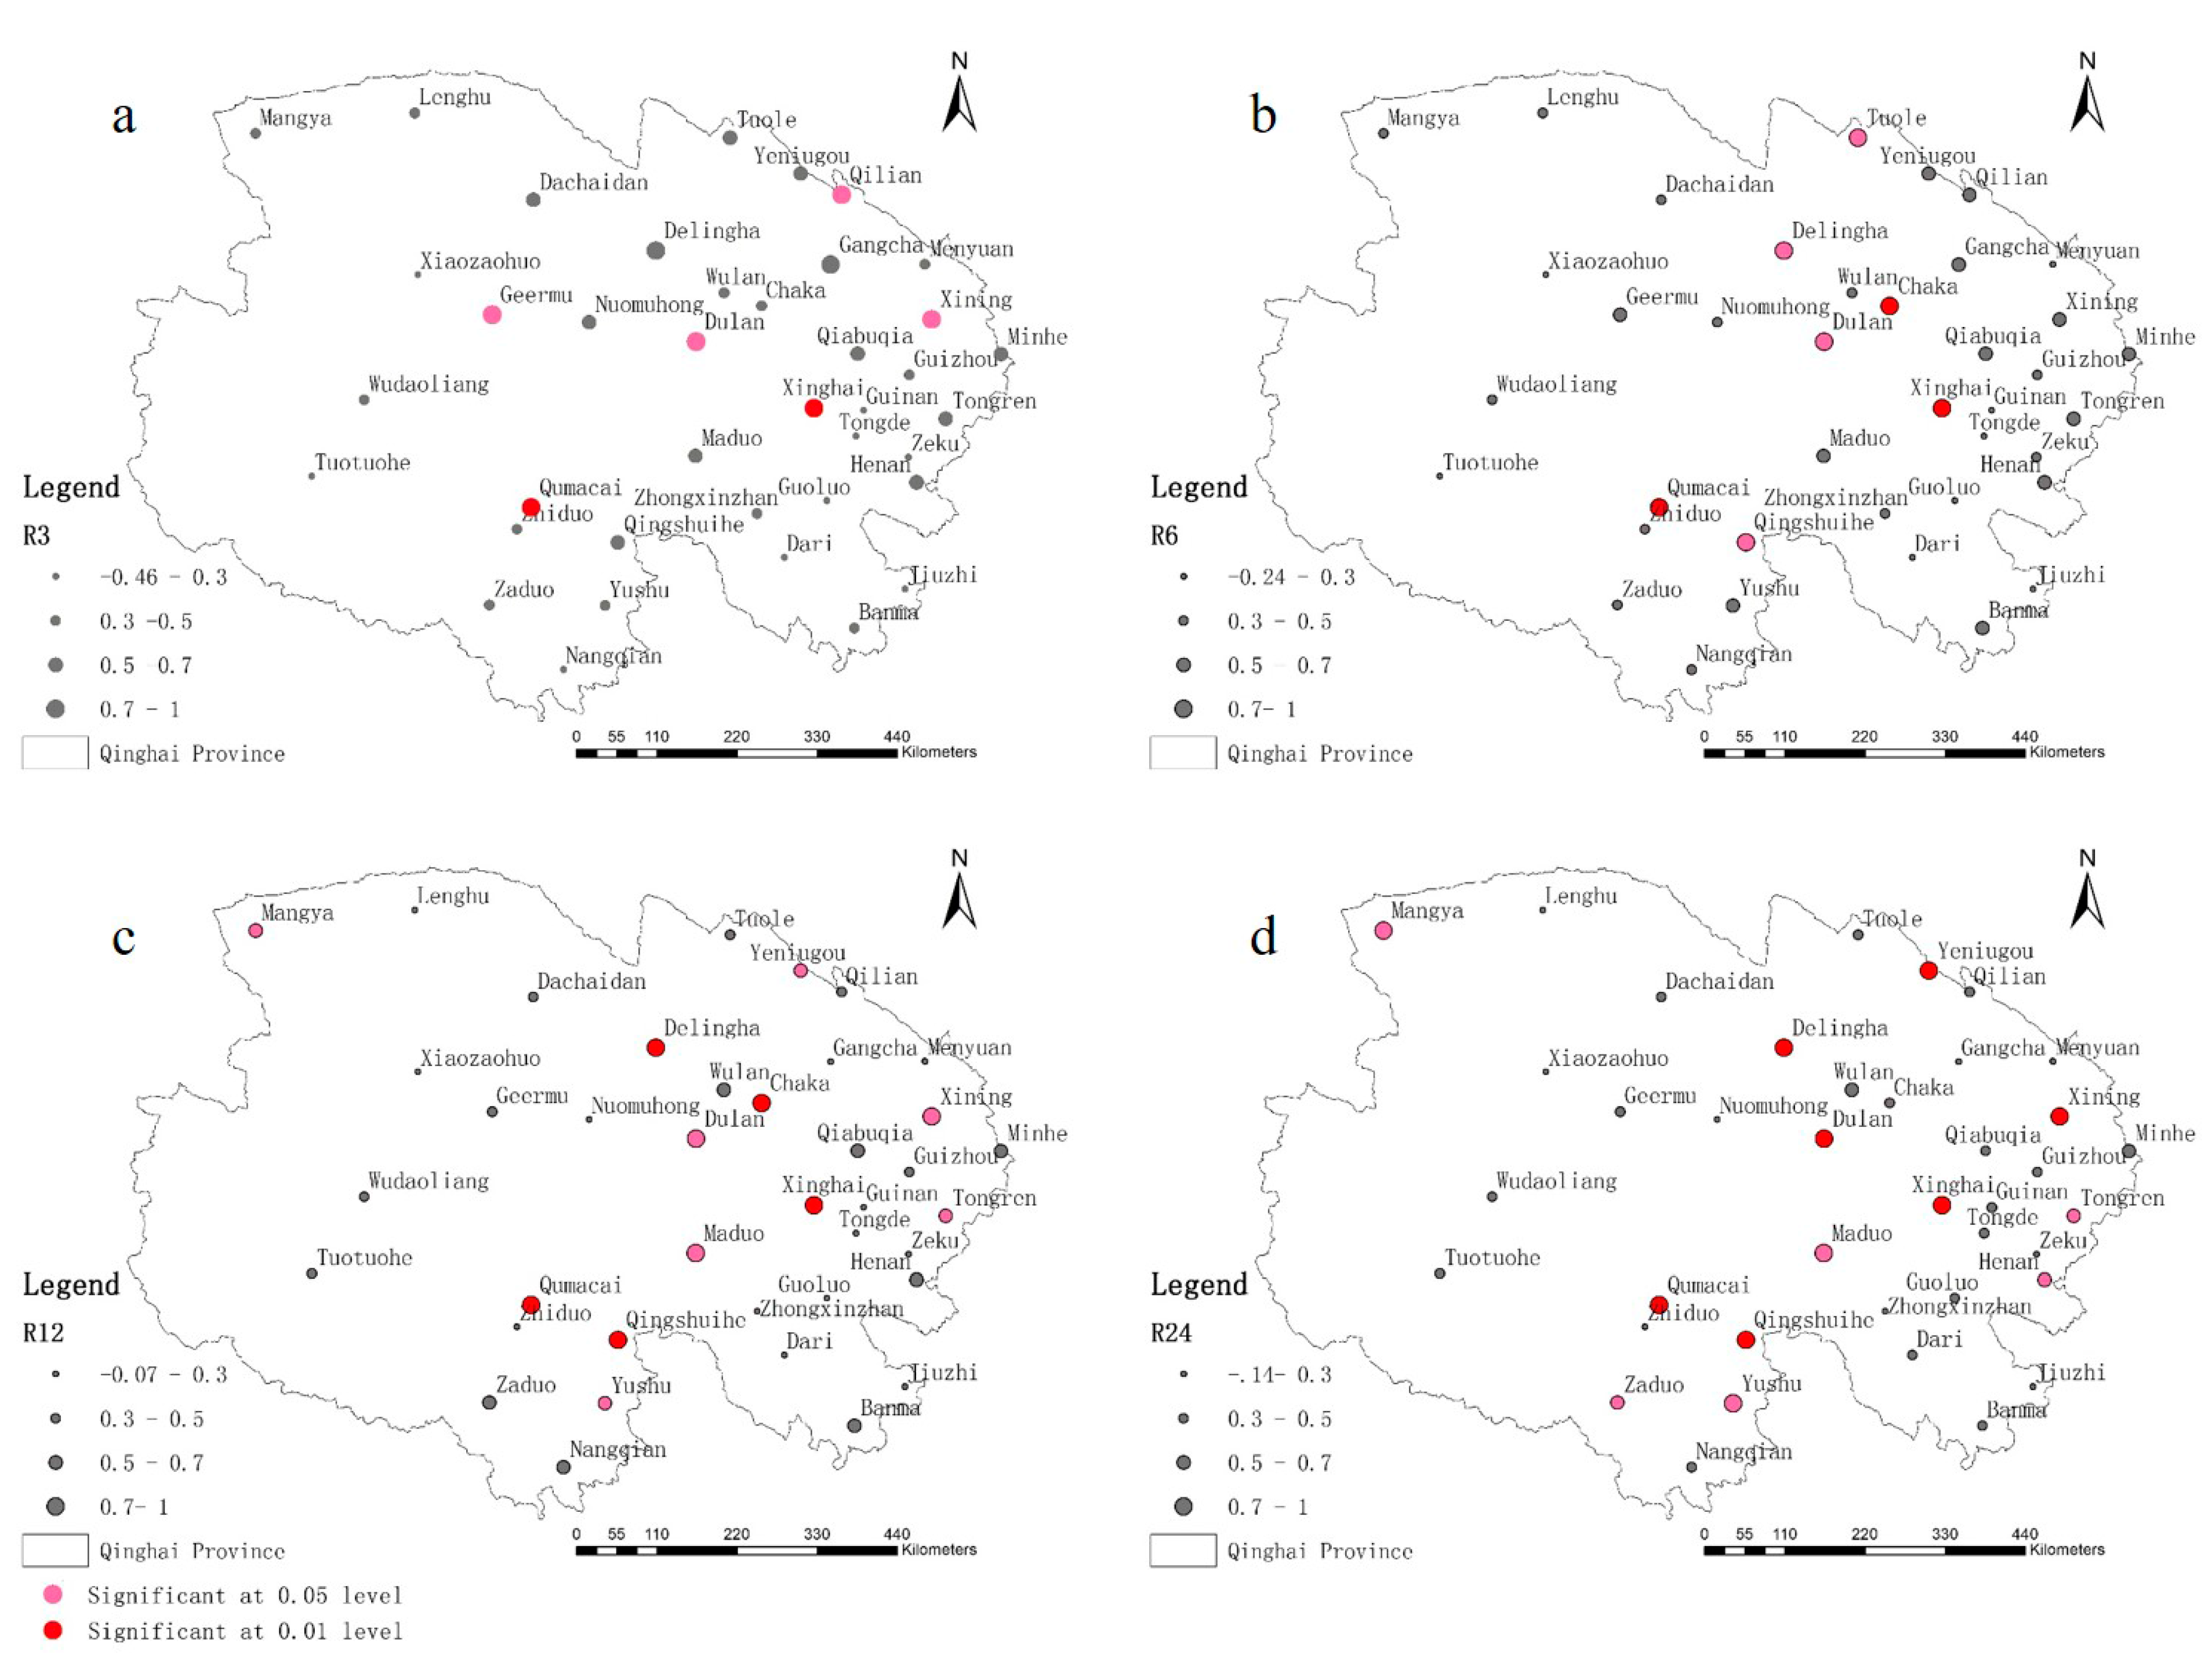
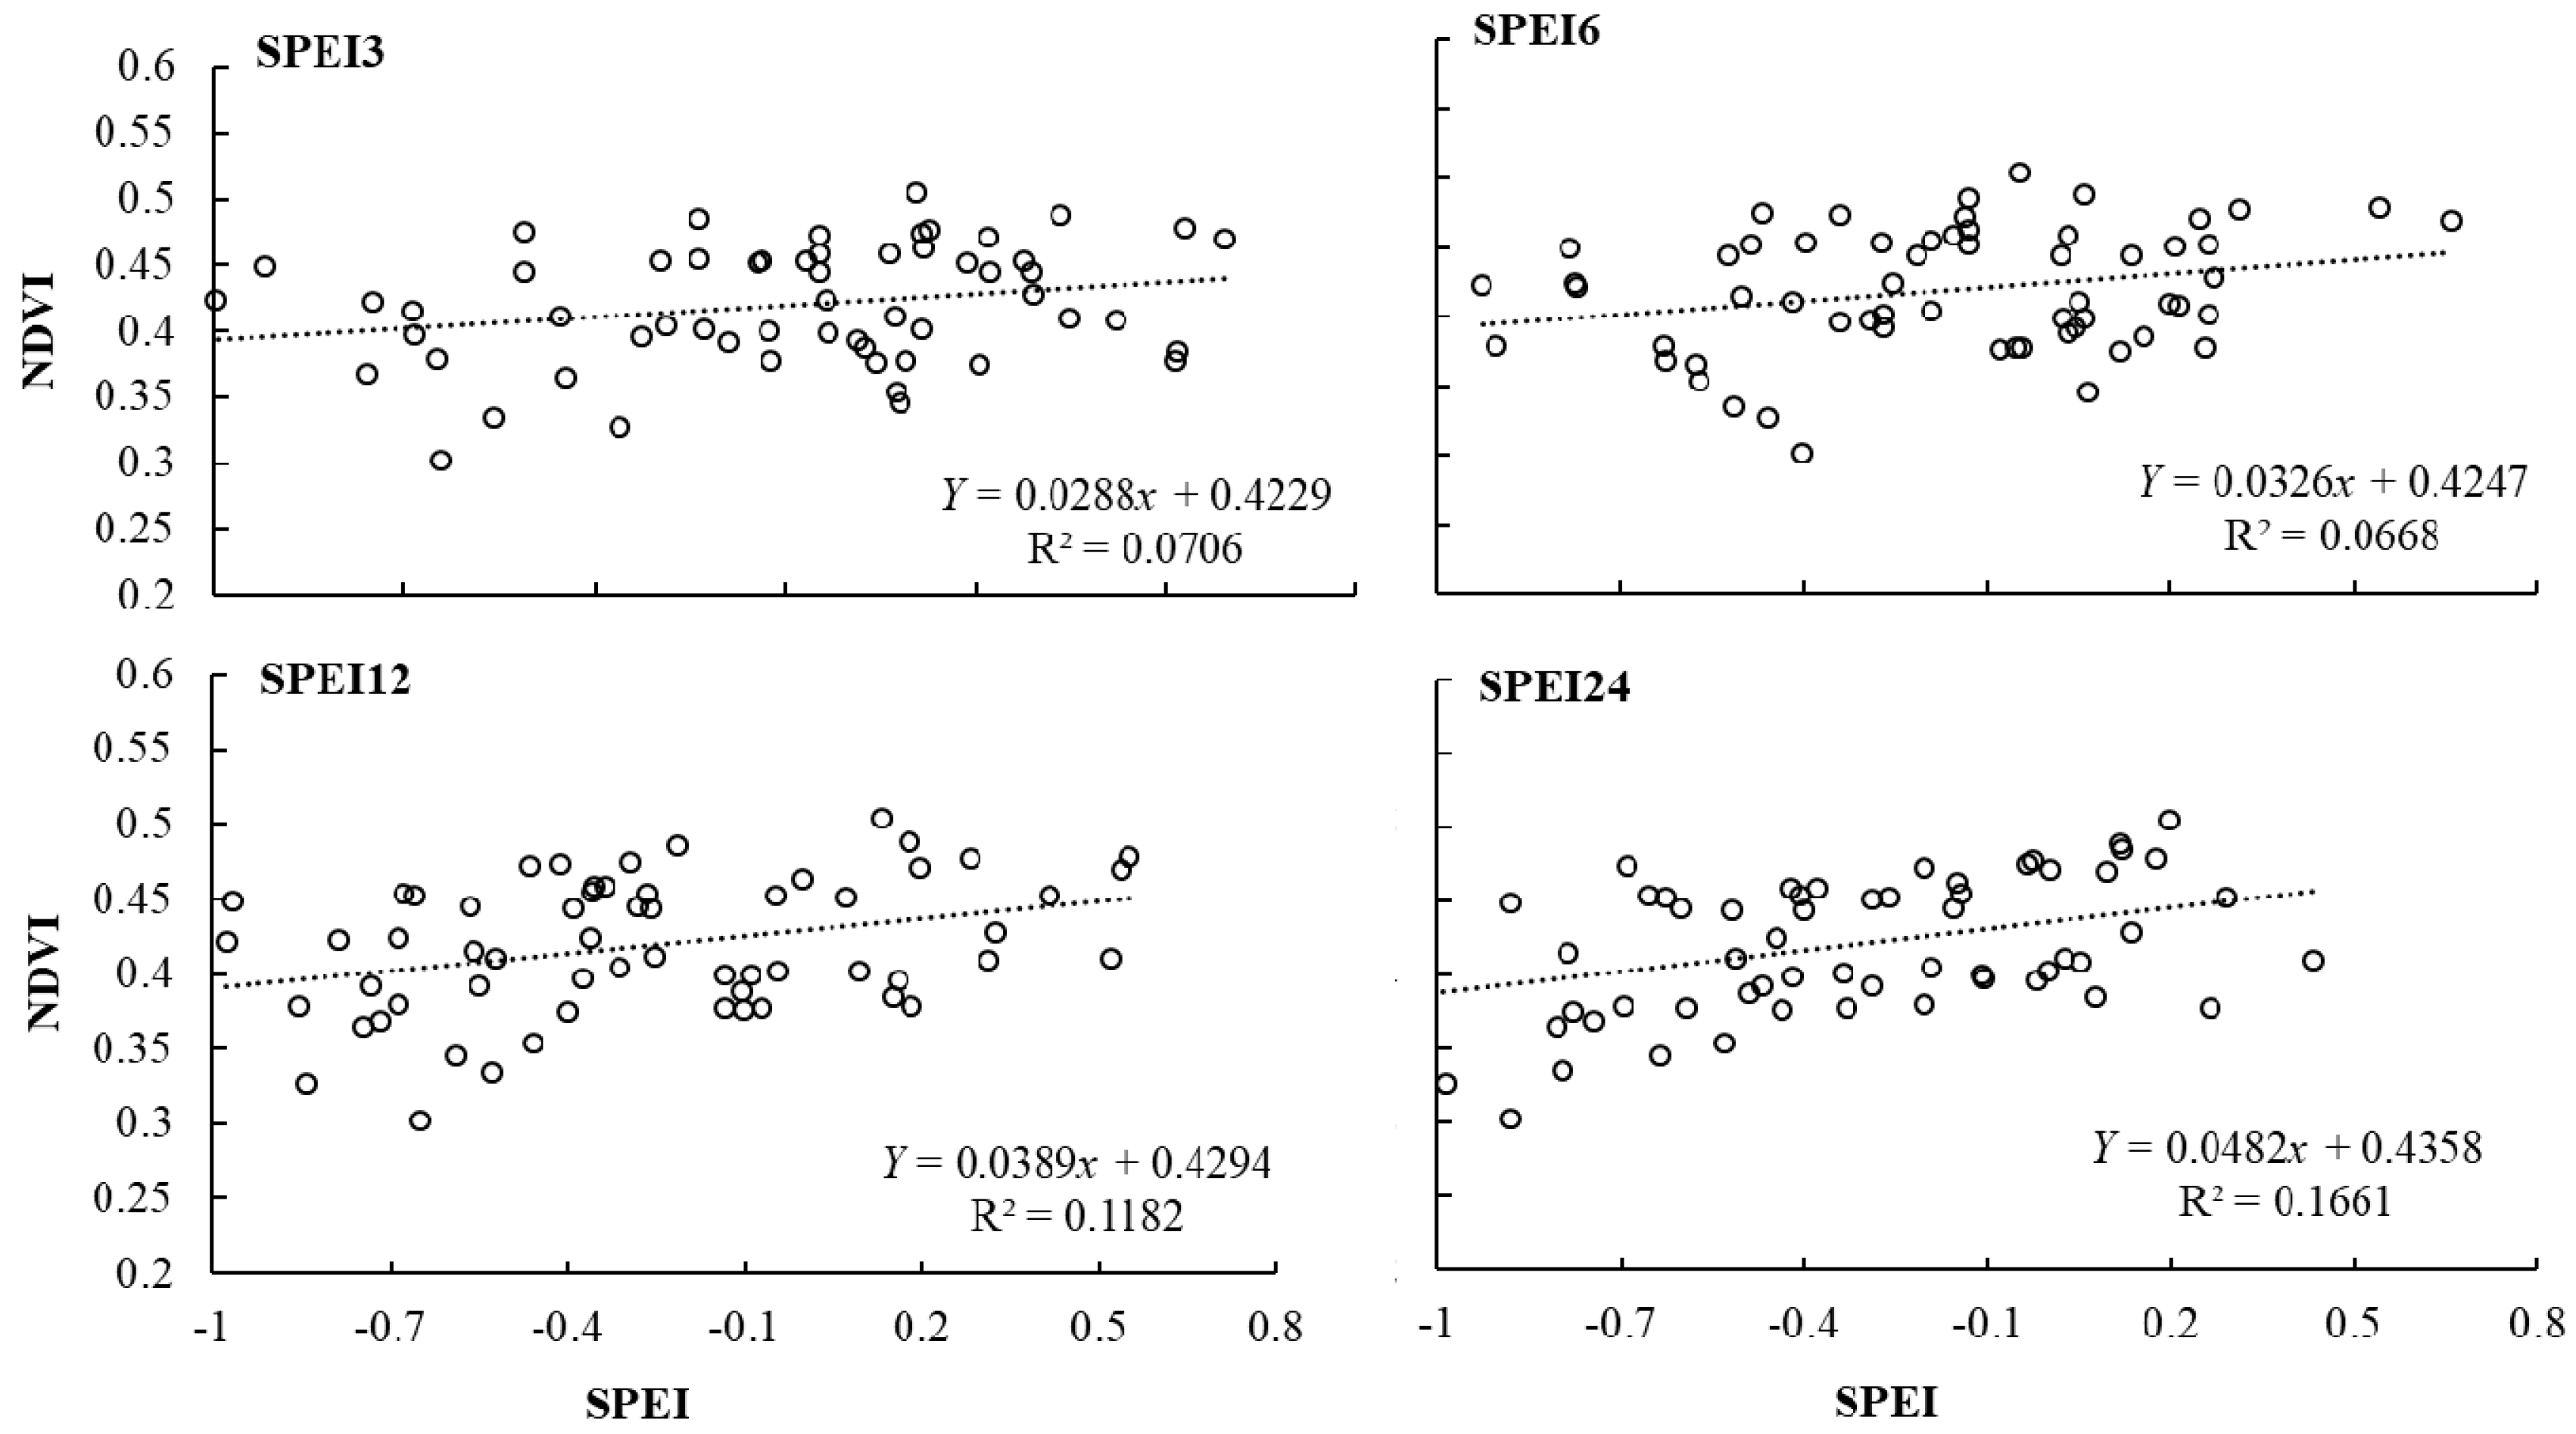
3.3.1. Correlation between NDVI and SPEI at an Annual Scale in Qinghai Province

The correlation coefficients of annual maximum NDVI and SPEI at different time scales are shown in Table 2. Although the correlation between NDVI and SPEI at the different time scales were all positive, SPEI 3 showed a weak correlation with NDVI, while SPEI 12, and SPEI 24 were highly correlated and the coefficients were greater than 0.8. In addition, the correlations with NDVI from SPEI 3 to SPEI 24 increased, and SPEI 24 was the most significant. We also found that the correlation between the NDVI values from the following year and SPEI was much higher than the correlation between NDVI and SPEI for the same year. However, SPEI 24 was an exception. Therefore, our results show that the annual maximum NDVI of Qinghai and the annual average SPEI at different time scales have different and positive correlations, which indicated that SPEI is one of the factors that affect the change in NDVI. More important, the results verified the hypothesis that NDVI values indicating the vegetation cover have time-lag effects of vegetation responses to response to the SPEI level.
The correlations between SPEI at different time scales and annual average NDVI were analyzed, and the correlation coefficients were shown in Table 3. The annual average NDVI instead of annual maximum NDVI was used in the analysis to avoid the extreme values of NDVI. We found that the annual average NDVI and SPEI at different time scales were also positively correlated as a whole. However, the correlations were much lower than those between annual maximum NDVI and SPEI. In addition, the correlation coefficient was lower than that for one year lagged NDVI series (Table 3).
Finally, in order to clearly investigate the relationship between vegetation cover and drought, we analyzed the correlation between annual average NDVI and SPEI for each site (Figure 7). There existed a strong correlation between NDVI and SPEI 3 only in XingHai and QuMaCai, and with SPEI 6 in ChaKa, XingHai, QuMaCai, and QingShuiHe. However, NDVI of DuNing, XiNing, XingHai, QuMaCai, MaDuo, and QingShuiHe showed a strong correlation with SPEI 12. The correlations between NDVI of DuLan, XiNing, XingHai, QuMaCai, YuShu, MaDuo, and QingShuiHe, and SPEI 24 were strong. Therefore, the response of vegetation cover to drought can be identified according to SPEI 12 and SPEI 24.

3.3.2. Correlation between NDVI and SPEI at a Monthly Scale in Qinghai Province

The maximum NDVI values for the growth peak period in growing season (June to September) for the 39 sites in Qinghai Province were obtained by maximum synthesis method. The correlation between NDVI and SPEI at different time scales was then analyzed at a monthly scale (Figure 8). We found that the NDVI and SPEI at different time scale were positively correlated but the strength of this correlation differed. The NDVI correlation with SPEI 12 and SPEI 24 were much higher than with SPEI 3 and SPEI 6.
The time-lag effect on NDVI by drought was further analyzed using NDVI data from one month, two months, and three months later. The results showed that the correlations between NDVI for that month and SPEI 12 were highest with a correlation coefficient of 0.6869. One month lagged NDVI and two months lagged NDVI also showed a high correlation with SPEI 12 and SPEI 24. However, the correlation between the NDVI value for three months lagged NDVI and SPEI at different time scales was relatively low (Table 4).

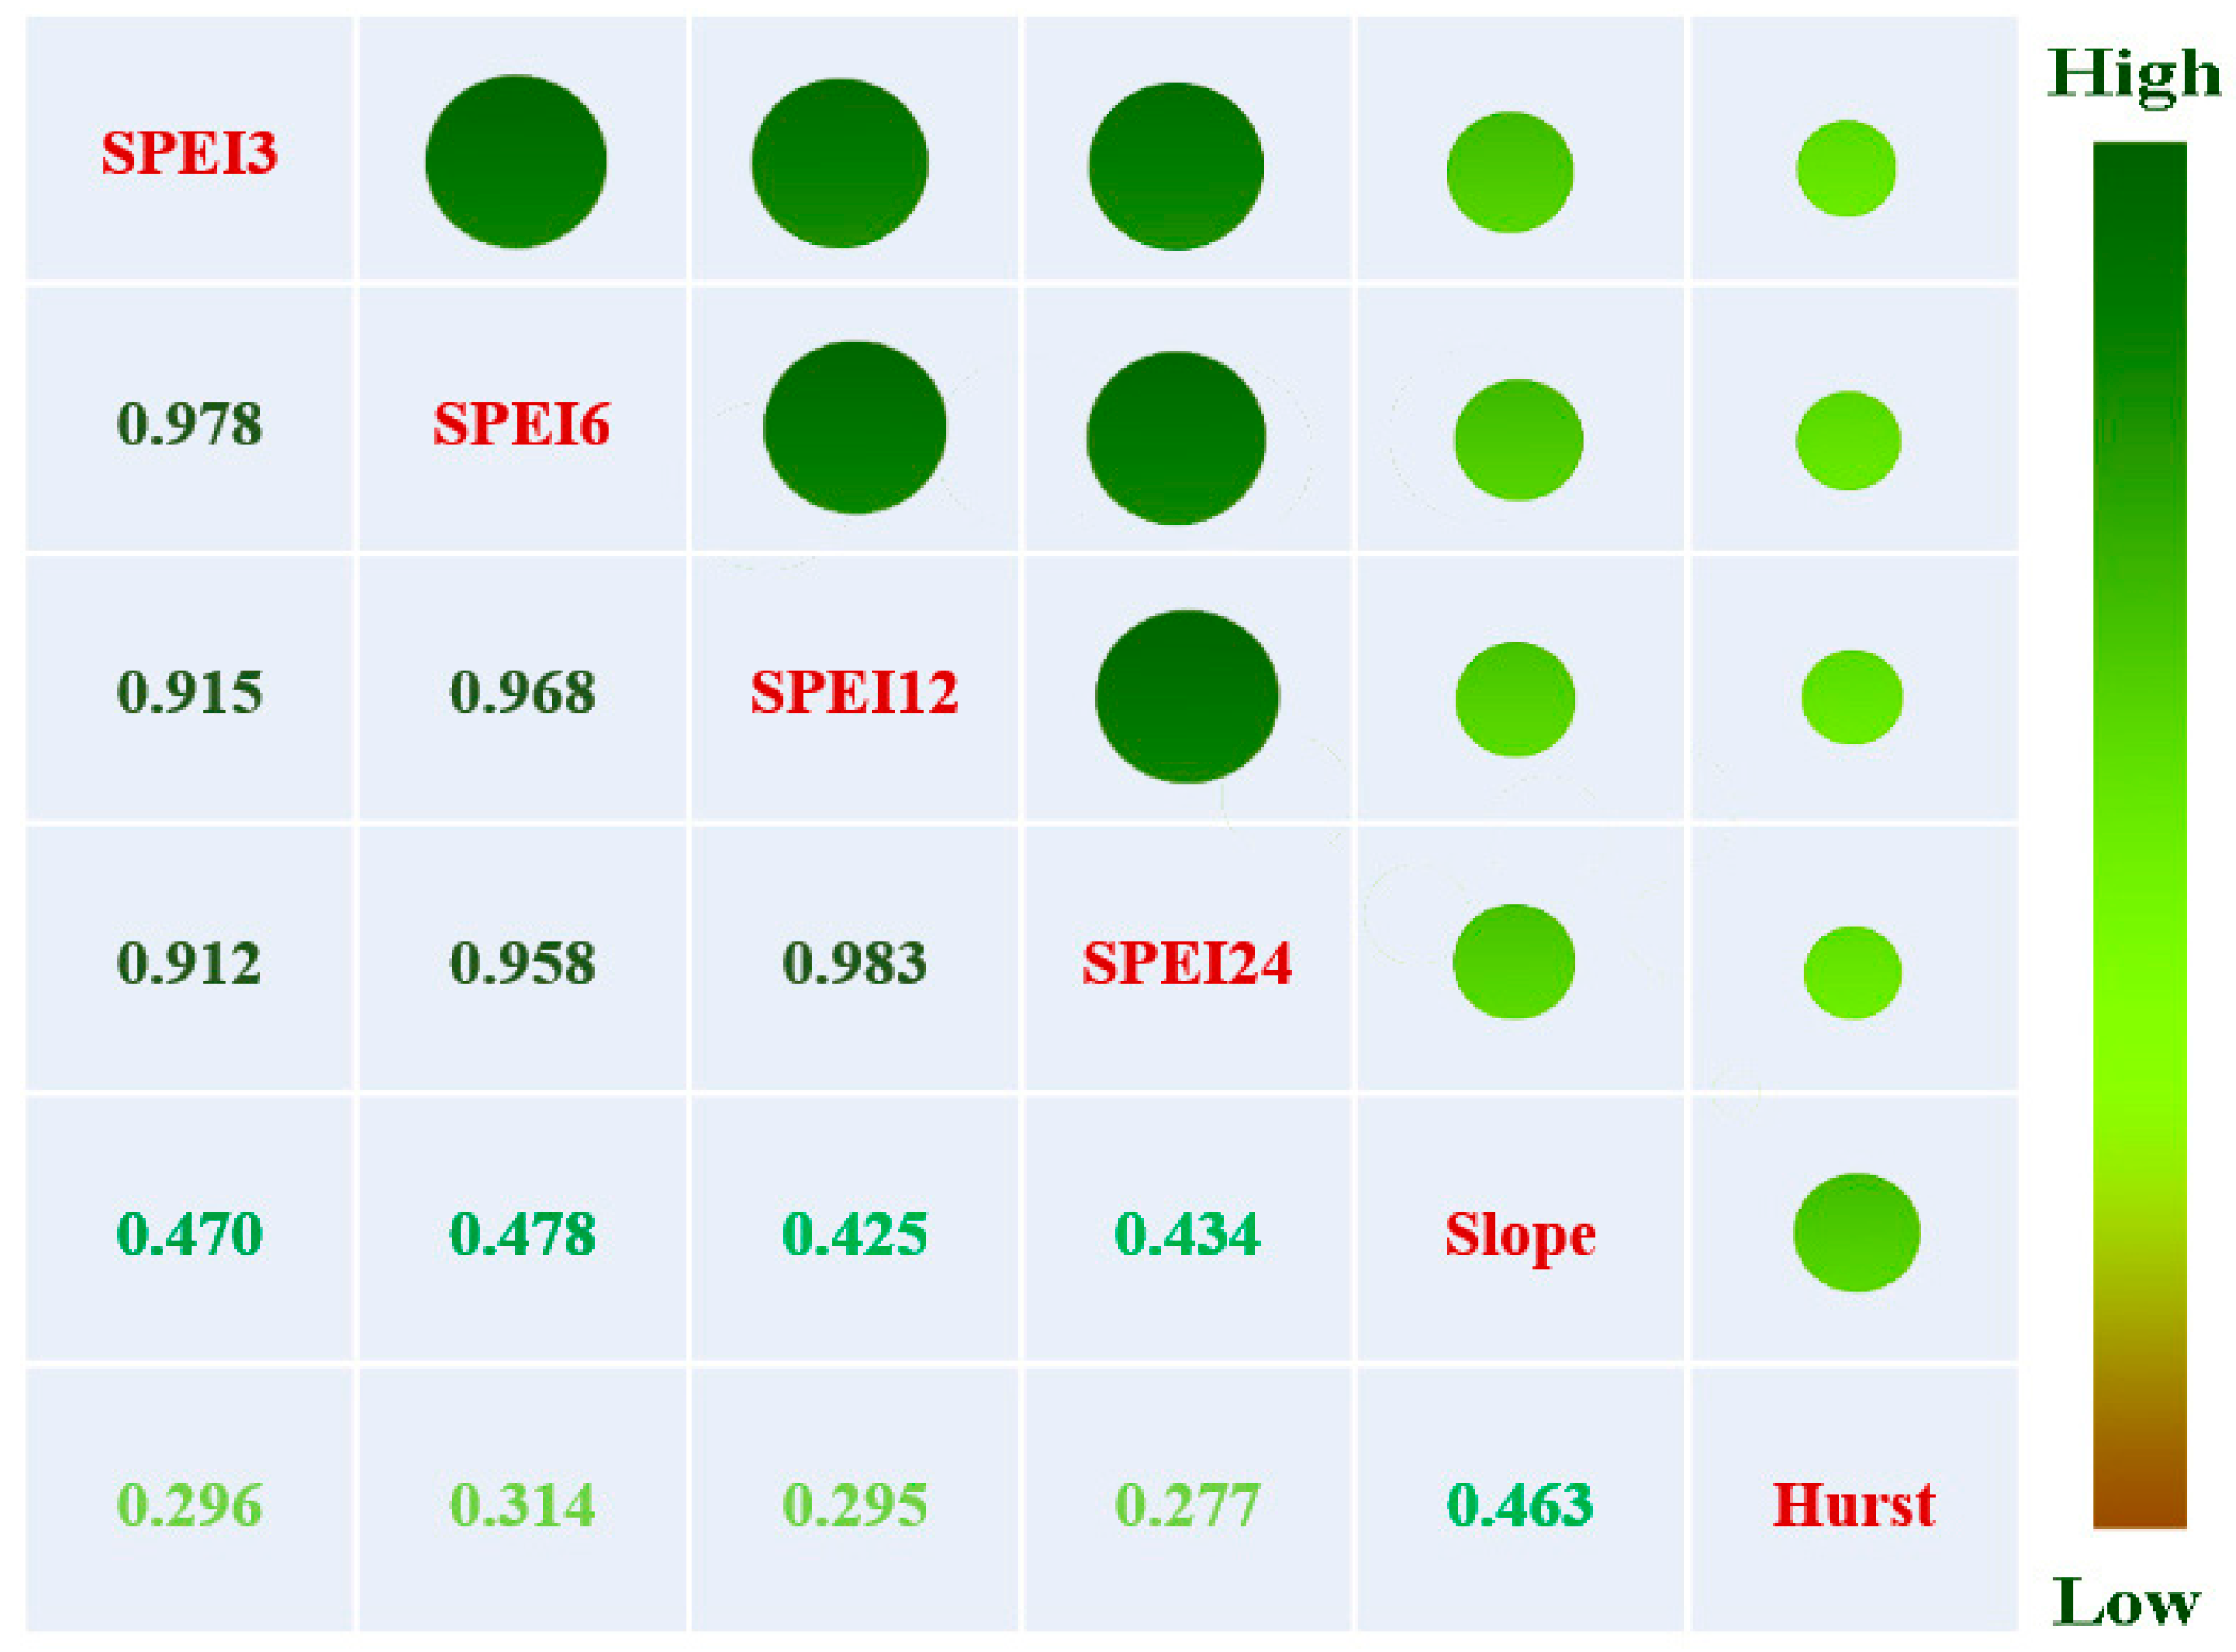
3.3.3. Correlation between NDVI Trend Indicators and SPEI at Different Scales

It could be deduced that the NDVI trend in the study period might also correlated with SPEI at different scales. The correlation analysis between SPEI values and NDVI trend indicators including Slope, Z-value, and Hurst in these 39 meteorological stations were further explored (Figure 9). The results showed that all SPEI values had a significantly positive correlation with Slope values and a weak positively with Hurst index (Figure 10).

4. Discussion

We used the Standardized Precipitation Evapotranspiration Index (SPEI) and Normal Difference Vegetation Index (NDVI) to analyze drought scenarios and the impacts of drought on vegetation. Many innovative approaches have been used in this paper. These include: (1) analysis of drought at different time scales and seasonal scales; (2) combining linear regression, Hurst index, and Mann-Kendall analysis to comprehensively study the changing trend in vegetation; and (3) analysis of correlation and hysteresis between multi-scale SPEI and NDVI.

4.1. Implications of SPEI for Water Resource Management for Grassland

The climate in Qinghai Province is considered to be varied, which is indicated clearly by the incidence of drought at different time scales. This further confirms the hotspot status of the area about climate [59]. In recent decades, many studies focusing on droughts in China have been undertaken to understand the effects of climate change and the ecological effects of drought. The knowledge of the spatio-temporal characteristics of multiple time scale droughts is important for water management and drought risk assessment. For SPEI application, Gao et al. [60] undertook a comparative study of the historical drought data using SPEI and showed the suitability of SPEI for assessing the intensity of drought in northeast China. In this paper, we first compared the SPEI at different time scales. SPEI for short time scales (SPEI 3) can reflect seasonal drought, while SPEI 12 or SPEI 24 with longer time scales reflect annual characteristic of drought. The Soil Moisture Index (SMI) was correlated with the SPEI with short time scales [61]. It was also verified that the SPEI and Streamflow Drought Index (SDI) reflecting hydrological droughts are closely related and the correlation coefficients increased from SPEI 1 to SPEI 12 [62]. Homdee et al. [63] also showed that when the time scale is longer, the response of SPEI to drought is slower. At the seasonal time scale, our results indicated that autumn and summer had droughts that are more frequent. However, Yang and Liu [64] suggest that the seasons of drought were spring and autumn in east Qinghai province, which may be because they did not consider the entire region.

4.2. Relationship between Multi-Scale SPEI and NDVI Dynamics

Remote sensing methodologies can supply valuable information necessary for the climate analysis and have greatly altered the water resource assessment due to their capability to capture the spatiotemporal variations in the hydro-meteorological variables. Estimation of land surface characteristics could be considered as an indirect but efficient way for potential applications in water resource management. Our results further indicated that, temporally, the NDVI showed an increasing trend, implying that ecological conditions have improved in recent years. In addition, the lowest value observed in 2001 reflects the extreme drought event experienced that year [65]. Spatially, most regions of Qinghai showed a slight increasing trend indicated by the value of the slope at each site. This further corroborates that the ecological environment has been better, which may be related to increased precipitation and human protection. According to the persistence analysis of NDVI, the majority of the study sites showed a Hurst index greater than 0.5, indicating that the positive persistence of NDVI was stronger. The improved status of vegetation could possibly be explained by the policy of afforestation [66].
With the aim to identify the time scales and regions affected easily by droughts, the correlation between NDVI and SPEI at different time scales was calculated for the 39 meteorological stations. The results indicated that the SPEI 12 and SPEI 24, especially of the next year, were highly correlated to NDVI, while SPEI 3 and SPEI 6 were not. This may have been because the effect of drought at shorter time scales was not obvious. Cheng et al. [67] have verified that the influence of precipitation on vegetation growth over short time scales was slight. In addition, the SPEI 3 and the SPEI 6 of the following year showed higher correlation with the NDVI, as the impact of change in climate does not instantly reflect in the vegetation. This lag effect on vegetation by drought has also been reflected in other studies [68]. The significance correlation between all SPEI values and Slope values indicated that high-level drought could lead to a more severe grass degradation. There were no large differences between SPEI values at different scales, which also implied that short-period drought also contributed greatly to the grass degradation. Our results could be helpful to grassland management, such as irrigation before growing seasons and prediction of the drought based on the SPEI calculation.
There are still some limitations in this study. First, we did not study the changes between different vegetation types. Second, the change of vegetation was not only affected by climate but also human activities; thus, it is necessary to further explore the reasons of change in NDVI. Finally, different resource management methods and patterns should be explored for the healthy development of grassland in Qinghai-Tibet in our future studies [69].

5. Conclusions

The frequency of drought in Qinghai Province had an overall increasing trend from 1961 to 2012, with intense status in some years. The change in the SPEI value differed with different time scales, i.e., the smaller the time scale, the more obvious was the change in the SPEI value. On a seasonal scale, the intensity of drought was highest in autumn, followed by summer and spring. Winter recorded the lowest intensity of droughts. Analyzing the change in vegetation cover in Qinghai Province over time using NDVI values, our study indicated that the values presented an increasing trend from 1998 to 2012 and a continuous increase from 2001 to 2005. Analyzing the spatial variation in the vegetation coverage in Qinghai Province, we found the values of slope for most regions were greater than zero. However, Xining, Guizhou, and MinHe were exceptions. Thus, the NDVI values increased over time and the area where the vegetation cover has improved was much greater than that of degraded area. In 39 study sites, 5.1%, including XiNing and MinHe, showed continuous degradation in vegetation cover. Sites including QiLian, GangCha, GeErMu, WuDaoLiang, YuShu, and GuoLuo showed a reverse continuous degradation and accounted for 28.2% of the study sites. For 2.6% of the study sites, the trend could not be clearly ascertained.
The correlation between SPEI and NDVI indicated that the annual maximum NDVI and annual average NDVI had a positive correlation with SPEI at different time scales, while the NDVI for the following year showed a strong positive correlation. On the monthly scale, the correlation between NDVI and SPEI were more complex—NDVI for a month, one year, two years, and three years later were positively correlated with SPEI 12. This indicates that the SPEI is one of the major influencing factors of NDVI.

Acknowledgments

The research was supported by the National Key Research and Development Project (No. 2016YFC0502103) and National Natural Science Foundation of China (41571173).

Author Contributions

Shiliang Liu and Yueqiu Zhang conceived and designed the experiments; Shiliang Liu and Yueqiu Zhang analyzed the data; Fangyan Cheng, Xiaoyun Hou, and Shuang Zhao contributed reagents/materials/analysis tools; Shiliang Liu wrote the paper.

Conflicts of Interest

The authors declare no conflict of interest.

References

  1. Field, C.B.; Barros, V.; Stocker, T.F.; Qin, D.; Dokken, D.J.; Ebi, K.L.; Mastrandrea, M.D.; Mach, K.J.; Plattner, G.K.; Allen, S.K.; et al. (Eds.) Managing the Risks of Extreme Events and Disasters to Advance Climate Change Adaptation; IPCC Special Report; Cambridge University Press: Cambridge, UK, 2012; p. 582. [Google Scholar]
  2. Gang, C.; Wang, Z.; Chen, Y.; Yang, Y. Drought-induced dynamics of carbon and water use efficiency of global grasslands from 2000 to 2011. Ecol. Indic. 2016, 67, 788–797. [Google Scholar] [CrossRef]
  3. Carrão, H.; Naumann, G.; Barbosa, P. Mapping global patterns of drought risk: An empirical framework based on sub-national estimates of hazard, exposure and vulnerability. Glob. Environ. Chang. 2016, 39, 108–124. [Google Scholar] [CrossRef]
  4. Alam, N.M.; Sharma, G.C.; Moreira, E.; Jana, C.; Mishra, P.K.; Sharma, N.K.; Mandal, D. Evaluation of drought using SPEI drought class transitions and log-linear models for different agro-ecological regions of India. Phys. Chem. Earth 2017, 100, 31–43. [Google Scholar] [CrossRef]
  5. Palmer, W.C. Meteorological Drought; U.S. Department of Commerce Weather Bureau Research Paper: Washington, DC, USA, 1965.
  6. Hao, Z.; Hao, F.; Singh, V.P.; Xia, Y. A theoretical drought classification method for the multivariate drought index based on distribution properties of standardized drought indices. Adv. Water Resour. 2016, 92, 240–247. [Google Scholar] [CrossRef]
  7. Dutta, D.; Kundu, A.; Patel, N.R. Assessment of agricultural drought in Rajasthan (India) using remote sensing derived vegetation condition index (VCI) and standardized precipitation index (SPI). Egypt. J. Remote Sens. Space Sci. 2015, 18, 53–63. [Google Scholar] [CrossRef]
  8. He, J.; Zhang, M.; Wang, P. Characteristics of extreme arid climate change in southwest China during the past 50 years. Acta Geogr. Sin. 2011, 66, 1179–1190. [Google Scholar]
  9. Labudová, L.; Labuda, M.; Takáč, J. Comparison of SPI and SPEI applicability for drought impact assessment on crop production in the Danubian Lowland and the East Slovakian Lowland. Theor. Appl. Climatol. 2016, 128, 491–506. [Google Scholar] [CrossRef]
  10. Marcos, R.; Turco, M.; Bedía, J.; Llasat, M.C.; Provenzale, A. Seasonal predictability of summer fires in a Mediterranean environment. Int. J. Wildland Fire 2015, 24, 1076–1084. [Google Scholar] [CrossRef]
  11. Peng, D.; Zhang, B.; Wu, C.; Huete, A.R.; Gonsamo, A.; Lei, L.; Ponce-Campos, G.E.; Liu, X.; Wu, Y. Country-level net primary production distribution and response to drought and land cover change. Sci. Total Environ. 2017, 574, 65–77. [Google Scholar] [CrossRef] [PubMed]
  12. Turco, M.; Levin, N.; Tessler, N.; Saaroni, H. Recent changes and relations among drought, vegetation and wildfires in the eastern Mediterranean: The case of Israel. Glob. Planet. Chang. 2017, 151, 28–35. [Google Scholar] [CrossRef]
  13. Vicente-Serrano, S.; Beguería, S.; López-Moreno, J. A multi-scalar drought index sensitive to global warming: The standardized precipitation evapotranspiration index. J. Clim. 2010, 23, 1696–1718. [Google Scholar] [CrossRef]
  14. Vicente-Serrano, S.; López-Moreno, J.; Lorenzo-Lacruz, J. The nao impact on droughts in the Mediterranean region. Adv. Glob. Chang. Res. 2011, 46, 23–40. [Google Scholar]
  15. Vicente-Serrano, S.M.; Beguería, S.; Lorenzo-Lacruz, J.; Camarero, J.J.; López-Moreno, J.I.; Azorin-Molina, C.; Revuelto, J.; Morán-Tejeda, E.; Sanchez-Lorenzo, A. Performance of drought indices for ecological, agricultural, and hydrological applications. Earth Int. 2012, 16, 1–27. [Google Scholar] [CrossRef]
  16. Potopová, V.; Štěpánek, P.; Možný, M.; Türkott, L. Performance of the standardised precipitation evapotranspiration index at various lags for agricultural drought risk assessment in the Czech Republic. Agric. For. Meteorol. 2015, 202, 26–38. [Google Scholar] [CrossRef]
  17. Meza, F.J. Recent trends and enso influence on droughts in northern Chile: An application of the standardized precipitation evapotranspiration index. Weather Clim. Extremes 2013, 1, 51–58. [Google Scholar] [CrossRef]
  18. Su, H.; Li, G. Low-frequency drought variability based on SPEI in association with climate indices in Beijing. Acta Ecol. Sin. 2012, 32, 5467–5475. [Google Scholar]
  19. Wang, H.; Chen, A.; Wang, Q. Drought dynamics and impacts on vegetation in China from 1982 to 2011. Ecol. Eng. 2015, 75, 303–307. [Google Scholar] [CrossRef]
  20. Liu, Z.; Zhou, P.; Zhang, F. Spatiotemporal characteristics of dryness/wetness conditions across Qinghai province, Northwest China. Agric. For. Meteorol. 2013, 182–183, 101–108. [Google Scholar] [CrossRef]
  21. Tian, J.; Zhu, Y.; Kang, X.; Dong, X. Effects of drought on the archaeal community in soil of the Zoige wetlands of the Qinghai-Tibetan plateau. Eur. J. Soil Biol. 2012, 52, 84–90. [Google Scholar] [CrossRef]
  22. Bajgain, R.; Xiao, X.; Wagle, P.; Basara, J.; Zhou, Y. Sensitivity analysis of vegetation indices to drought over two tallgrass prairie sites. ISPRS J. Photogramm. Remote Sens. 2015, 108, 151–161. [Google Scholar] [CrossRef]
  23. Gouveia, C.; Trigo, R.M.; Beguería, S. Drought impacts on vegetation activity in the Mediterranean region: An assessment using remote sensing data and multi-scale drought indicators. Glob. Planet. Chang. 2016, 151, 15–27. [Google Scholar] [CrossRef]
  24. Liu, J.Y.; Xu, X.L.; Shao, Q.Q. Grassland degradation in the “three-river headwaters” region, Qinghai province. J. Geogr. Sci. 2008, 18, 259–273. [Google Scholar] [CrossRef]
  25. Liu, S.; Zhao, H.; Su, X.; Deng, L. Spatio-temporal variability in rangeland conditions associated with climate change in the Altun mountain national nature reserve on the Qinghai-Tibet Plateau over the past 15 years. Rangel. J. 2015, 37, 67–75. [Google Scholar] [CrossRef]
  26. Alatorre, L.C.; Sánchez-Carrillo, S.; Miramontes-Beltrán, S. Temporal changes of ndvi for qualitative environmental assessment of mangroves: Shrimp farming impact on the health decline of the arid mangroves in the gulf of California (1990–2010). J. Arid Environ. 2016, 125, 98–109. [Google Scholar] [CrossRef]
  27. Ichii, K.; Kawabata, A.; Yamaguchi, Y. Global correlation analysis for ndvi and climatic variables and NDVI trends: 1982–1990. Int. J. Remote Sens. 2002, 23, 3873–3878. [Google Scholar] [CrossRef]
  28. Carlson, T.N.; Ripley, D.A. On the relation between ndvi, fractional vegetation cover, and leaf area index. Remote Sens. Environ. 1997, 62, 241–252. [Google Scholar] [CrossRef]
  29. Zhou, L.; Tucke, J.C.; Kaufma, R.K. Variations in northern vegetation activity inferred from satellite data of vegetation index during 1981 to 1999. J. Geophys. Res. 2001, 106, 20069–20083. [Google Scholar] [CrossRef]
  30. Gandhi, G.M.; Parthiban, S.; Thummalu, N. NDVI: Vegetation change detection using remote sensing and gis-a case study of Vellore district. Proced. Comput. Sci. 2015, 57, 1199–1210. [Google Scholar] [CrossRef]
  31. White, D.C.; Lewis, M.M.; Green, G. A generalizable ndvi-based wetland delineation indicator for remote monitoring of groundwater flows in the Australian Great Artesian basin. Ecol. Indic. 2016, 60, 1309–1320. [Google Scholar] [CrossRef]
  32. Eckert, S.; Hüsler, F.; Liniger, H. Trend analysis of MODIS NDVI time series for detecting land degradation and regeneration in Mongolia. J. Arid Environ. 2015, 113, 16–28. [Google Scholar] [CrossRef]
  33. Cui, Y.P.; Liu, J.Y.; Hu, Y.F. An analysis of temporal evolution of NDVI in various vegetation-climate regions in inner Mongolia, China. Proced. Environ. Sci. 2012, 13, 1989–1996. [Google Scholar] [CrossRef]
  34. Jiang, W.; Yuan, L.; Wang, W. Spatio-temporal analysis of vegetation variation in the Yellow River basin. Ecol. Indic. 2015, 51, 117–126. [Google Scholar] [CrossRef]
  35. Hou, X.X.; Ying, L.L.; Gao, M.; Bi, X.L.; Lu, X.; Zhu, M.M. Character of vegetation cover change in China’s Eastern coastal areas 1998–2008. Sci. Geogr. Sin. 2010, 30, 735–749. [Google Scholar]
  36. Xie, P.; Chen, G.; Lei, H. Hydrological alteration analysis method based on hurst coefficient. J. Basic Sci. Eng. 2009, 17, 32–39. [Google Scholar]
  37. Li, H.; Liu, G.; Fu, B. Response of vegetation to climate change and human activity based on NDVI in the three-river headwaters region. Acta Ecol. Sin. 2011, 31, 5495–5504. [Google Scholar]
  38. Birtwistle, A.N.; Laituri, M.; Bledsoe, B. Using NDVI to measure precipitation in semi-arid landscapes. J. Arid Environ. 2016, 131, 15–24. [Google Scholar] [CrossRef]
  39. Fu, B.; Burgher, I. Riparian vegetation ndvi dynamics and its relationship with climate, surface water and groundwater. J. Arid Environ. 2015, 113, 59–68. [Google Scholar] [CrossRef]
  40. Cong, N.; Piao, S.; Chen, A.; Wang, X. Spring vegetation green-up date in china inferred from SPOT NDVI data: A multiple model analysis. Agric. For. Meteorol. 2012, 165, 104–113. [Google Scholar] [CrossRef]
  41. Ling, L.; Xu, H.; Zhang, Q. Climate change in the manas river basin, Xinjiang during 1956–2007. J. Glaciol. Geocryol. 2011, 33, 64–71. [Google Scholar]
  42. Ouyang, W.; Hao, F.; Skidmore, A.K. Integration of multi-sensor data to assess grassland dynamics in a Yellow river sub-watershed. Ecol. Indic. 2012, 18, 163–170. [Google Scholar] [CrossRef]
  43. Sun, Y.; Guo, P. Spatiotemporal variation of vegetation coverage index in north China during the period from 1982 to 2006. Arid Zone Res. Inst. 2012, 2, 187–193. [Google Scholar]
  44. Liu, S.; Cheng, F.; Dong, S.; Zhao, H.D.; Hou, X.Y.; Wu, X. Spatiotemporal dynamics of grassland aboveground biomass on the Qinghai-Tibet Plateau based on validated MODIS NDVI. Sci. Rep. 2017, 7, 1–8. [Google Scholar] [CrossRef] [PubMed]
  45. Cui, B.L.; Xiao, B.; Li, X.Y.; Wang, Q.; Zhang, Z.H.; Zhan, C.; Li, X.D. Exploring the geomorphological processes of Qinghai Lake and surrounding lakes in the northeastern Tibetan Plateau, using Multitemporal Landsat Imagery (1973–2015). Glob. Planet. Chang. 2017, 152, 167–175. [Google Scholar] [CrossRef]
  46. Yao, Y.; Zhang, X.; Ma, Q. Application research on different drought indices in crop growing period at east agricultural region of Qinghai Province. J. Nat. Disasters 2014, 23, 177–189. [Google Scholar]
  47. Shen, H.; Ma, H.; Wang, J. Variation characteristics of extreme air temperature events in Qinghai Province. J. Glaciol. Geocryol. 2012, 34, 1371–1382. [Google Scholar]
  48. Feng, S.; Hu, Q.; Qian, W. Quality control of daily meteorological data in china 1951–2000: A new dataset. Int. J. Climatol. 2004, 24, 853–870. [Google Scholar] [CrossRef]
  49. Fischer, T.; Gemmer, M.; Liu, L.; Su, B. Temperature and precipitation trends and dryness/wetness pattern in the Zhujiang River Basin, South China, 1961–2007. Quat. Int. 2011, 244, 138–148. [Google Scholar] [CrossRef]
  50. Liu, S.L.; Su, X.K.; Dong, S.K.; Cheng, F.Y.; Zhao, H.D.; Wu, X.Y.; Zhang, X.; Li, J.R. Modeling aboveground biomass of an alpine desert grassland with SPOT-VGT NDVI. GISci. Remote Sens. 2015, 52, 680–699. [Google Scholar] [CrossRef]
  51. Dai, S.; Zhang, B.; Wang, H. Vegetation cover change and the driving factors over northwest China. J. Arid Land 2011, 3, 25–33. [Google Scholar]
  52. Cao, J.; Chi, D.; Wu, L. Mann-Kendall examination and application in the analysis of precipitation trend. Agric. Sci.Technol. Equip. 2008, 5, 35–39. [Google Scholar]
  53. Xu, Z.; Takeuchi, K.; Ishidaira, H. Monotonic trend and step changes in Japanese precipitation. J. Hydrol. 2003, 279, 144–150. [Google Scholar] [CrossRef]
  54. Hurst, H. Long term storage capacity of reservoirs. Trans. Am. Soc. Civ. Eng. 1951, 116, 776–808. [Google Scholar]
  55. Zhang, G.; Zha, L. Analysis on the future tendency of climate change in Nanjing in the last 50 years. J. Anhui Normal Univ. 2008, 31, 580–586. [Google Scholar]
  56. Wang, J.; Xu, Z. Long-term trend and the sustainability of air temperature and precipitation in the Baiyangdian basin. Resour. Sci. 2009, 31, 1214–1221. [Google Scholar]
  57. Wu, D.H.; Zhao, X.; Liang, S.L.; Zhou, T.; Huang, K.C.; Tang, B.J.; Zhao, W.Q. Time-lag effects of global vegetation responses to climate change. Glob. Chang. Biol. 2015, 21, 3520–3531. [Google Scholar] [CrossRef] [PubMed]
  58. Liu, B.; Jin, H.L.; Sun, L.Y.; Sun, Z.; Su, Z.Z. Winter and summer monsoonal evolution in northeastern Qinghai-Tibetan Plateau during the Holocene period. Chem. Der Erde Geochem. 2013, 73, 309–321. [Google Scholar] [CrossRef]
  59. Wang, Z.; Zhang, Y.; Yang, Y.; Zhou, W. Quantitative assess the driving forces on the grassland degradation in the Qinghai-Tibet plateau, in China. Ecol. Inform. 2016, 33, 32–44. [Google Scholar] [CrossRef]
  60. Gao, B.; Jiang, T.; Su, B.; Zhu, X. Evolution analysis on droughts in northeast China during 1961–2012 based on SPEI. Chin. J. Agrometeorol. 2014, 35, 656–662. [Google Scholar]
  61. Kędzior, M.A.; Zawadzki, J. SMOS data as a source of the agricultural drought information: Case study of the Vistula catchment, Poland. Geoderma 2017, 306, 167–182. [Google Scholar] [CrossRef]
  62. Li, Y.; He, J.; Li, X. Hydrological and meteorological droughts in the Red River Basin of Yunnan Province based on SPEI and SDI Indices. Prog. Geogr. 2016, 35, 758–767. [Google Scholar]
  63. Homdee, T.; Pongput, K.; Kanae, S. A comparative performance analysis of three standardized climatic drought indices in the Chi river basin, Thailand. Agric. Nat. Resour. 2016, 50, 211–219. [Google Scholar] [CrossRef]
  64. Yang, F.; Liu, L. Study on occurrence pattern and trend of drought in east Qinghai province. Arid Zone Res. 2012, 29, 284–288. [Google Scholar]
  65. Fu, Y. The meteorological disasters in Qinghai province in 2001: A review. J. Qinghai Meteorol. 2002, 1, 37–42. [Google Scholar]
  66. Liao, Q.; Zhang, X.; Ma, Q. Spatiotemporal variation of fractional vegetation cover and remote sensing monitoring in the eastern agricultural region of Qinghai Province. Acta Ecol. Sin. 2014, 34, 5936–5943. [Google Scholar]
  67. Cheng, G.; Zhang, B.L.; Chang, C.H. Correlation analysis on typical vegetation ndvi with temperature and precipitation in Otintag sandy land. Hubei Agric. Sci. 2013, 52, 1298–1303. [Google Scholar]
  68. Zhao, S.; Gong, Z.; Liu, X. Correlation analysis between vegetation coverage and climate drought conditions in north China during 2001–2013. Acta Geogr. Sin. 2015, 70, 717–729. [Google Scholar]
  69. Song, M.; Peng, J.; Wang, J.; Dong, L. Better resource management: An improved resource and environmental efficiency evaluation approach that considers undesirable outputs. Resour. Conserv. Recycl. 2016, 128, 197–205. [Google Scholar] [CrossRef]
Figure 1. Study area and distribution of climate stations in Qinghai Province.
Remotesensing 09 01329 g001
Figure 2. The working flowchart of this study.
Remotesensing 09 01329 g002
Figure 3. Dynamic characteristics of SPEI at multiple time scales in Qinghai Province.
Remotesensing 09 01329 g003
Figure 4. Dynamic characteristics of SPEI for different seasons in Qinghai Province.
Remotesensing 09 01329 g004
Figure 5. The temporal change and spatial distribution of Normal Difference Vegetation Index (NDVI) from 2000 to 2012 in Qinghai Province.
Remotesensing 09 01329 g005
Figure 6. Slope values and annual change of NDVI in different locations in Qinghai Province.
Remotesensing 09 01329 g006
Figure 7. The Z value and Hurst index of NDVI series for 39 meteorological stations in Qinghai Province.
Remotesensing 09 01329 g007
Figure 8. The correlation coefficient map of annual average NDVI and SPEI at different time scales of 39 meteorological stations. (a) R3, correlation with SPEI 3; (b) R6: correlation with SPEI 6; (c) R12: correlation with SPEI 12; (d) R24: correlation with SPEI 24.
Remotesensing 09 01329 g008
Figure 9. Correlation coefficients between NDVI for the growing season and SPEI at different time scales for 39 meteorological stations.
Remotesensing 09 01329 g009
Figure 10. Pearson correlation coefficient of SPEI values and NDVI trend indicators in 39 meteorological stations.
Remotesensing 09 01329 g010
Table 1. Intensity of drought based on Standardized Precipitation Evapotranspiration Index (SPEI) values.
SPEI Value RangeDrought Grade
<−2Extreme drought
[−2, −1.5]Severe drought
[−1.5, −1]Moderate drought
[−1, −0.5]Slight drought
>−0.5No drought
Table 2. The correlation of annual maximum NDVI and SPEI at multi-time scales.
NDVI Series SPEI 3SPEI 6SPEI 12SPEI 24
NDVI for the year0.35960.58010.8097 **0.8927 **
One year lagged NDVI series0.6652 *0.7534 **0.8325 **0.8035 **
* Significant correlation at the 0.05 level, ** Significant correlation at the 0.01 level.
Table 3. The correlation of annual average NDVI and SPEI at multi-time scales.
NDVI Series SPEI 3SPEI 6SPEI 12SPEI 24
NDVI for the year0.30110.57340.53210.3202
One year lagged NDVI series0.56110.7285 **0.8137 **0.7680 **
* Significant correlation at the 0.05 level, ** Significant correlation at the 0.01 level.
Table 4. The correlation coefficients of month change of NDVI and SPEI.
NDVI Series SPEI 3SPEI 6SPEI 12SPEI 24
NDVI for the month0.01810.46090.6869 **0.5106
One month lagged NDVI series0.00660.37450.8403 **0.8221 **
Two months lagged NDVI series0.06500.18050.6289 *0.8582 **
Three months lagged NDVI series−0.1249−0.21520.11410.5454
* Significant correlation at the 0.05 level, ** Significant correlation at the 0.01 level.

