Article

Analyzing Parcel-Level Relationships between Urban Land Expansion and Activity Changes by Integrating Landsat and Nighttime Light Data

Guangdong Provincial Key Laboratory of Urbanization and Geo-Simulation, School of Geography and Planning, Sun Yat-sen University, Guangzhou 510275, China
*
Authors to whom correspondence should be addressed.
Remote Sens. 2017, 9(2), 164; https://doi.org/10.3390/rs9020164
Submission received: 17 December 2016 / Revised: 8 February 2017 / Accepted: 14 February 2017 / Published: 16 February 2017
(This article belongs to the Special Issue Recent Advances in Remote Sensing with Nighttime Lights)

Abstract

:
Urban growth is a process that imposes profound physical and socioeconomic restructuring on cities. Urban land expansion as an immediate physical manifestation of urban growth has been extensively studied using a variety of remote sensing methods. However, little research addresses the interactions between urban land expansion and corresponding activity changes, especially at local scales. We propose an innovative analytical framework that integrates Landsat and nighttime light data to capture the parcel-level relationships between urban land expansion and activity changes. The urban land data are acquired based on the classification of Landsat images, whereas the activity changes are approximated by the nighttime light data. Using the Local Indicator of Spatial Association (LISA) (local Moran’s I) approach, four types of local relationships between land expansion and activity changes are defined at the parcel level. The proposed analytical framework is applied in Guangzhou, China, as a case study. The results reveal the mismatched growth between urban land and activity intensity at the parcel level, where the increase in urban land area outpaces the increase of activity intensity. Such results are expected to provide a more comprehensive understanding of urban growth, and can be used to assist urban planning and related decision-making.

Graphical Abstract

1. Introduction

The world’s urbanization process has been accelerating. It is estimated that 66% of the world’s population will live in cities by 2050 [1]. Urban growth has profound impacts on population increase, land expansion, economic growth, and changes in lifestyles and consumption patterns. However, the influences exerted by urban growth may give rise to varying consequences in the different dimensions (e.g., physical and socioeconomic) of cities. Extensive studies have been devoted to the analysis of urban growth based on remote sensing methods [2,3]. However, these studies suffer from two drawbacks. The first one is related to the classification system of urban land-use/land-cover, as pointed out by Seto et al. [4]. In this classification system, the geographical space is represented by using discrete and usually regular land units (e.g., pixels/cells), in which the land-use/land-cover types are assigned in either discrete or continuous manners [5]. Urban growth is then measured predominantly by summing up the total amounts of land units that are classified as ‘urban’, or quantified by using a wide variety of spatial metrics [6]. In other words, ‘urban’ pixels are assumed to be homogenous, while their inherent variations in socioeconomic activities, for example, are frequently ignored [4]. Therefore, urban growth analysis solely based on such classifications can sometimes be misleading, such that the new developed ‘urban’ land units in different locations (e.g., uptown areas vs. the city core) can lead to equivalent changes in socioeconomic activities. Some of the existing applications, such as the generation of the US National Land Cover Database (NLCD) [7], partially alleviate this problem by subdividing the urban class into finer categories (e.g., developed areas with low intensity, medium intensity and high intensity). However, the changes in socioeconomic activities still cannot be explicitly reflected using broad urban categories like the US NLCD.
The second drawback is that the relationships between the physical manifestation of urban growth and associated changes in the socioeconomic dimension of activity intensity are not always analyzed at the local scales. Empirical studies have paid more attention to the delineations of changes in the extent, forms and morphology of urban land use/land cover [8], leaving aside the social processes behind such physical changes. For studies of urban growth at the regional scale, the detected local information needs to be aggregated into the meso or macro levels (e.g., the administrative levels of city, province/state or country) at which statistical data are available, where the relationships between the physical and socioeconomic changes are estimated using regression analysis [9]. However, the relationships obtained in this manner only provide the knowledge of general trends but are unable to reflect the local spatial variations. This approach is also not always applicable to intra-urban studies due to the difficulty in collecting relevant socioeconomic data at the intra-urban scale.
To overcome these two drawbacks, we propose a new framework for urban growth analysis, which tightly links urban land expansion with activity intensity changes at the parcel level. In this analytical framework, we detect urban land expansion based on the classifications of Landsat images, and characterize urban land with activity intensities that are approximated using nighttime light data. The existing literature has consistently reported significant correlations between nighttime lights and various socioeconomic activities, such as economic production [10], energy consumption [11,12] and freight traffic [13]. As a data source with a long archive history, nighttime light data have now become an important indicator to measure the intensity and spatial variation of human activities across the world. However, the problem of signal saturation caused by the standard operation at the high gain setting somehow limits the applications of the Defense Meteorological Satellite Program’s Operational Linescan System (DMSP/OLS) images [14]. The recently released global radiance-calibrated nighttime light products successfully solve this problem [15]. They have been applied in the fine-scale estimation of regional gross domestic production (GDP) [16]. Therefore, in our research, we use these data to represent the intensity of socioeconomic activities. We subsequently apply the approach of Local Indicator of Spatial Association (LISA) (local Moran’s I) [17] to evaluate the local interactions between urban land expansion and activity intensity changes. As an indicator of local spatial autocorrelation, LISA is particularly useful for detecting outliers that may suggest a spatial regime [18,19]. In our analysis, therefore, LISA can indicate outlier land units with, for example, rapid land expansion and slow activity intensity increase, suggesting the mismatch of changes in land and activity.
The proposed analytical framework is illustrated with a case study in a fast developing city, Guangzhou, China, to explore the spatiotemporal characteristics of urban growth from 1995 to 2012. The analysis is carried out at the parcel level instead of the pixel level, because land parcels are a better representation of realistic land entities [20]. By using the proposed framework, the primary questions we intended to investigate are whether the urban land increase matches the socioeconomic activity growth, and if not, whether an increase in urban land is always followed with proportionate growth in activity intensity, or vice versa. The urban land data of Guangzhou from 1995 to 2012 are obtained through the classifications of multi-temporal Landsat images. The spatial variations of socioeconomic activity intensity are measured using the concurrent nighttime light data. Next, the temporal changes of urban land area and socioeconomic activity intensity are detected and aggregated into the parcel level. Finally, the local relationships between the increases of urban land area and activity intensity are determined using the LISA approach.

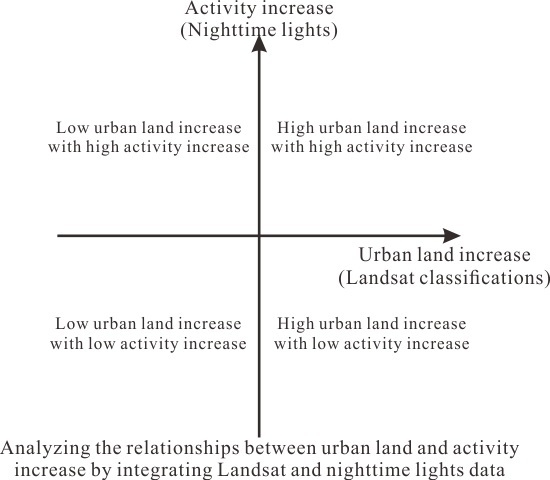
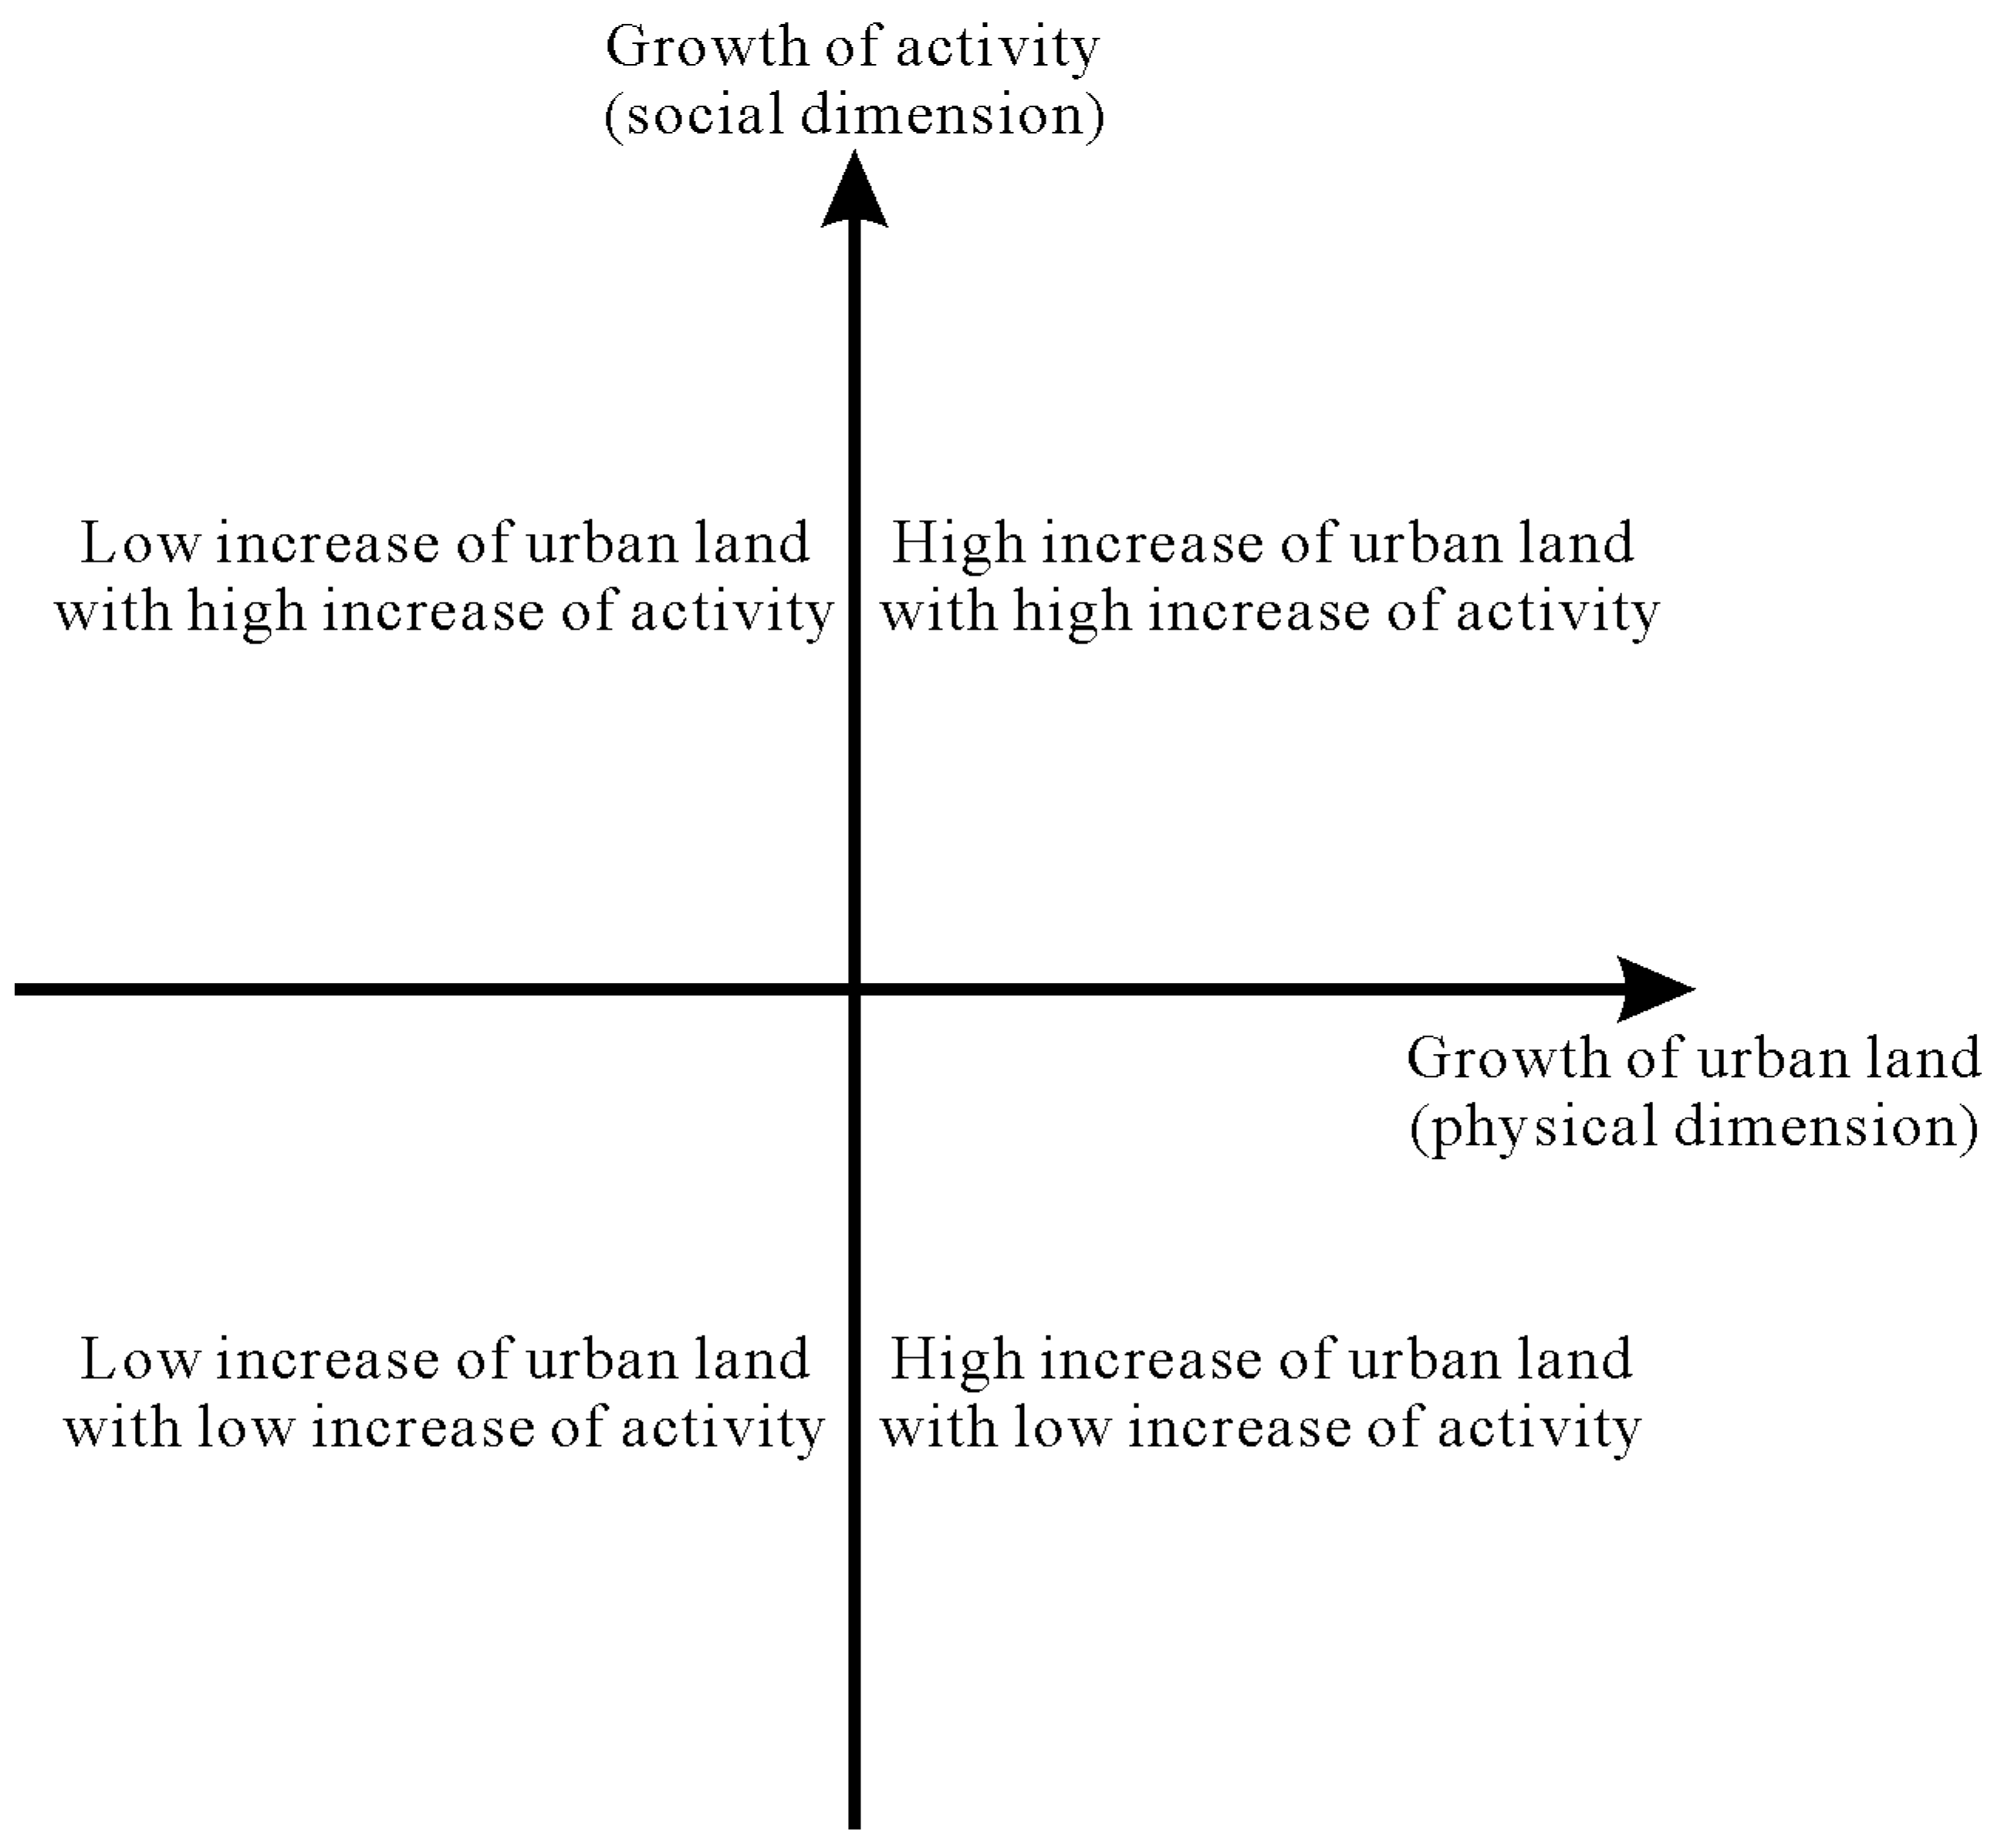
2. Urban Land Expansion and Activity Changes

In this study, we measure urban growth in two dimensions: physical and socioeconomic. The common form of a city’s physical growth is the expansion of urbanized areas. The socioeconomic consequences of urban growth may include natural growth in population, rural–urban migration and activity concentration [21]. Therefore, urban growth at the local scales during a specific period of [t0, t1] can be expressed using the following equations:
l i = ( L i , t 1 L i , t 0 ) / S i
a i = ( A i , t 1 A i , t 0 ) / S i
where L i and A i are the urban land area and the activity intensity for the ith land unit, respectively; S i is the area of the ith land unit; and l i and a i are the area-corrected net changes of urban land expansion and activity intensity for the ith land unit from time t 0 to t 1 . For a given land unit, the relationships between l i and a i can be measured using the four quadrants that correspond to four possible types of urban growth (Figure 1):
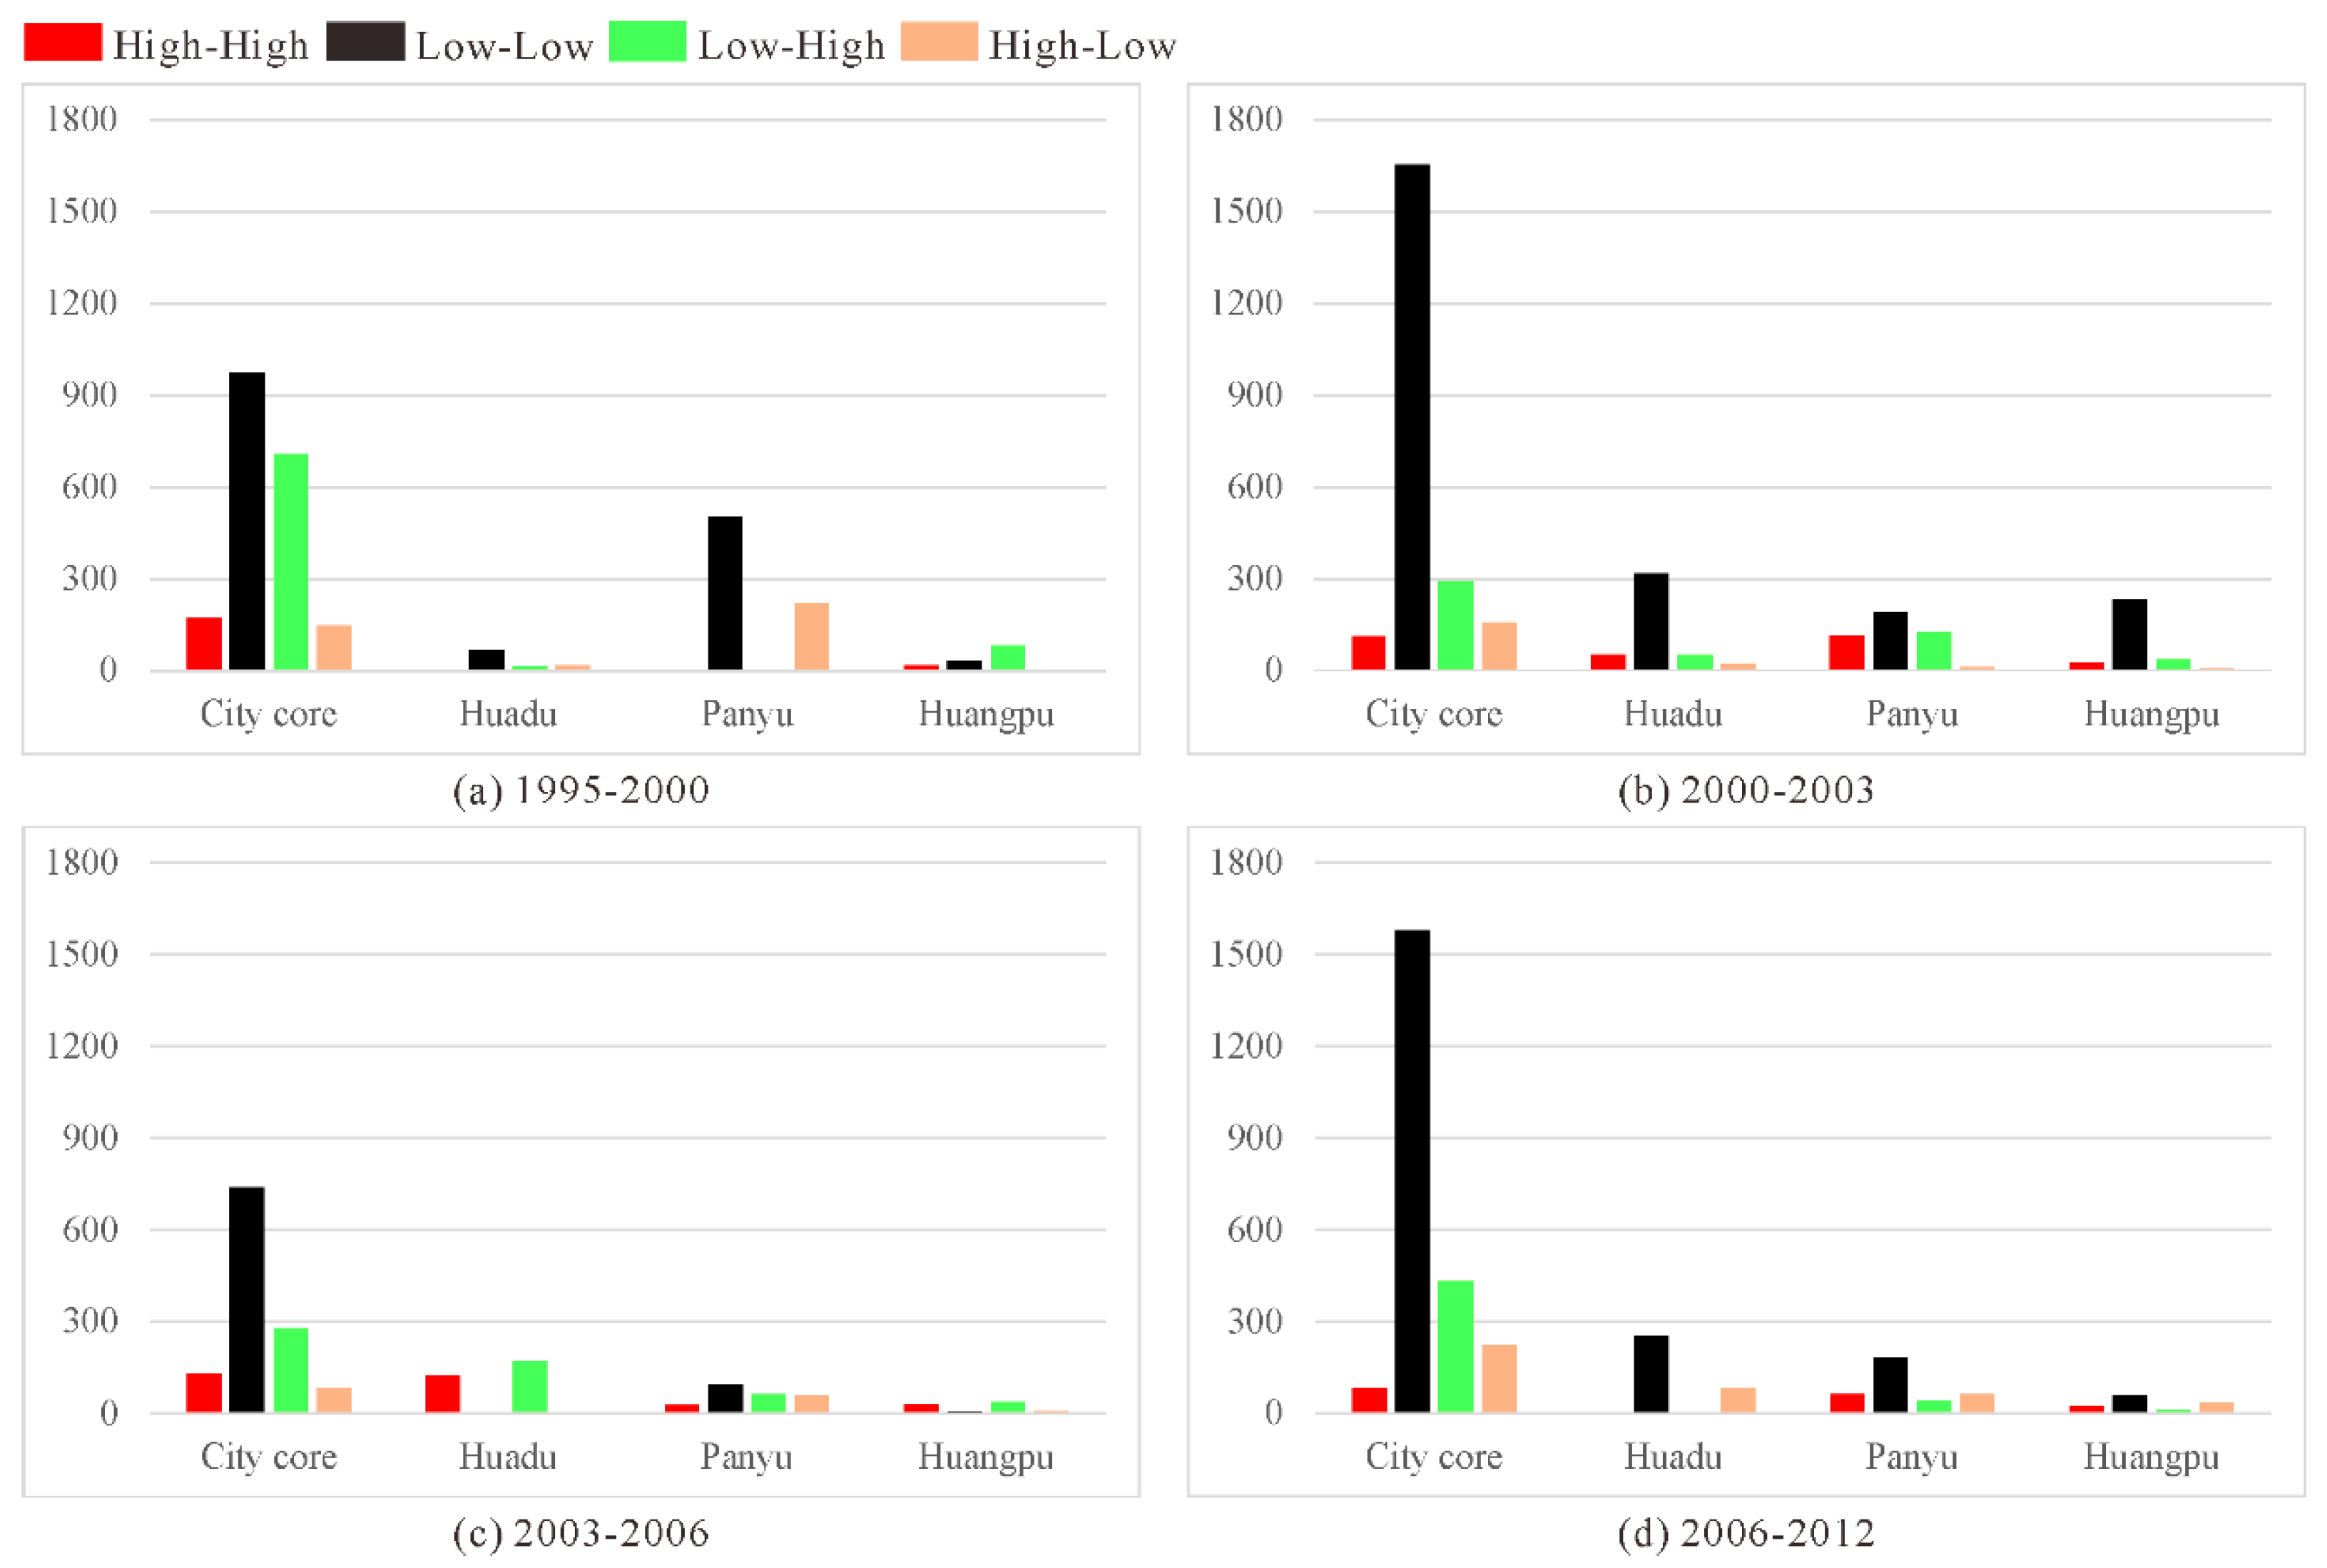
  • High increase of urban land area with high increase of activity intensity (HH)
  • High increase of urban land area with low increase of activity intensity (HL)
  • Low increase of urban land area with high increase of activity intensity (LH)
  • Low increase of urban land area with low increase of activity intensity (LL)
If a land unit is identified as HH (or LL), this land unit experiences a high (or low) increase in both urban land area and activity intensity. However, if a land unit is identified as HL (or LH), this land unit has a higher growth rate in urban land area (or activity intensity) than activity intensity (or urban land area). Intuitively, the quadrants shown in Figure 1 are similar to the outcomes of LISA, which are four combinations of ‘high’ and ‘low’—high-high, low-low, high-low and low-high. The LISA approach is also known as local Moran’s I [17]. Compared with the conventional Moran’s I measuring the global spatial autocorrelation, LISA helps detect potential clusters of local spatial units even though there is only weak global spatial autocorrelation. Therefore, we used the LISA approach to detect the local relationships between land area increase and activity intensity change. The calculation of univariate LISA ( I i ) is as follows:
I i = z i j = 1 N w i j z j
z i , k = ( X i X i , m e a n ) / σ X
where N is the number of spatial units; X i is the value of variable of interest for the ith unit, and X m e a n is the mean of the variable; w i j is the spatial weight between the ith and jth spatial units; σ X is the standard deviation of the variable. The significance of I i can be assessed using the conditional randomization approach [17]. This approach randomly permutes the variable values over the locations in the dataset, and calculates the local Moran’s I for the permuted dataset. The resulting distributions provide the reference under the null hypothesis of randomness, and can be used to evaluate the significance of the observed local spatial autocorrelation against the random pattern. The LISA approach also provides a Moran scatterplot, in which four quadrants are drawn based on the average values of individual locations and neighborhoods. In this scatterplot, if an above-average value is surrounded by above-average neighbors, then it is categorized as high-high; if a below-average value is surrounded by below-average neighbors, then it is categorized as low-low. In contrast, if an above-average value is surrounded by below-average neighbors, then it is categorized as high-low, and vice-versa (i.e., low-high). Equations (3) and (4) examine local spatial autocorrelation for only one variable of interests. When two variables (denoted as k and l) are involved, a bivariate LISA ( I i , k l ) can be used:
I i , k l = z i , k j = 1 N w i j z j , l
z i , k = ( X i , k X k , m e a n ) / σ k
z i , l = ( X i , l X l , m e a n ) / σ l
where N is the number of spatial units; X i , k and X i , l are the values of variables k and l for the ith and jth spatial units, respectively; X i ,   m e a n and X l ,   m e a n are the means of the variables k and l, respectively; σ k and σ l are the variances of variables k and l, respectively; and w i j is the spatial weight between the ith and jth spatial units. The implementation of LISA was carried out in the GeoDa software [22]. The bivariate LISA in GeoDa can yield the maps to demonstrate the spatial clusters (i.e., high-high, low-low, high-low and low-high) and their statistical significance levels obtained through the conditional randomization approach mentioned above.

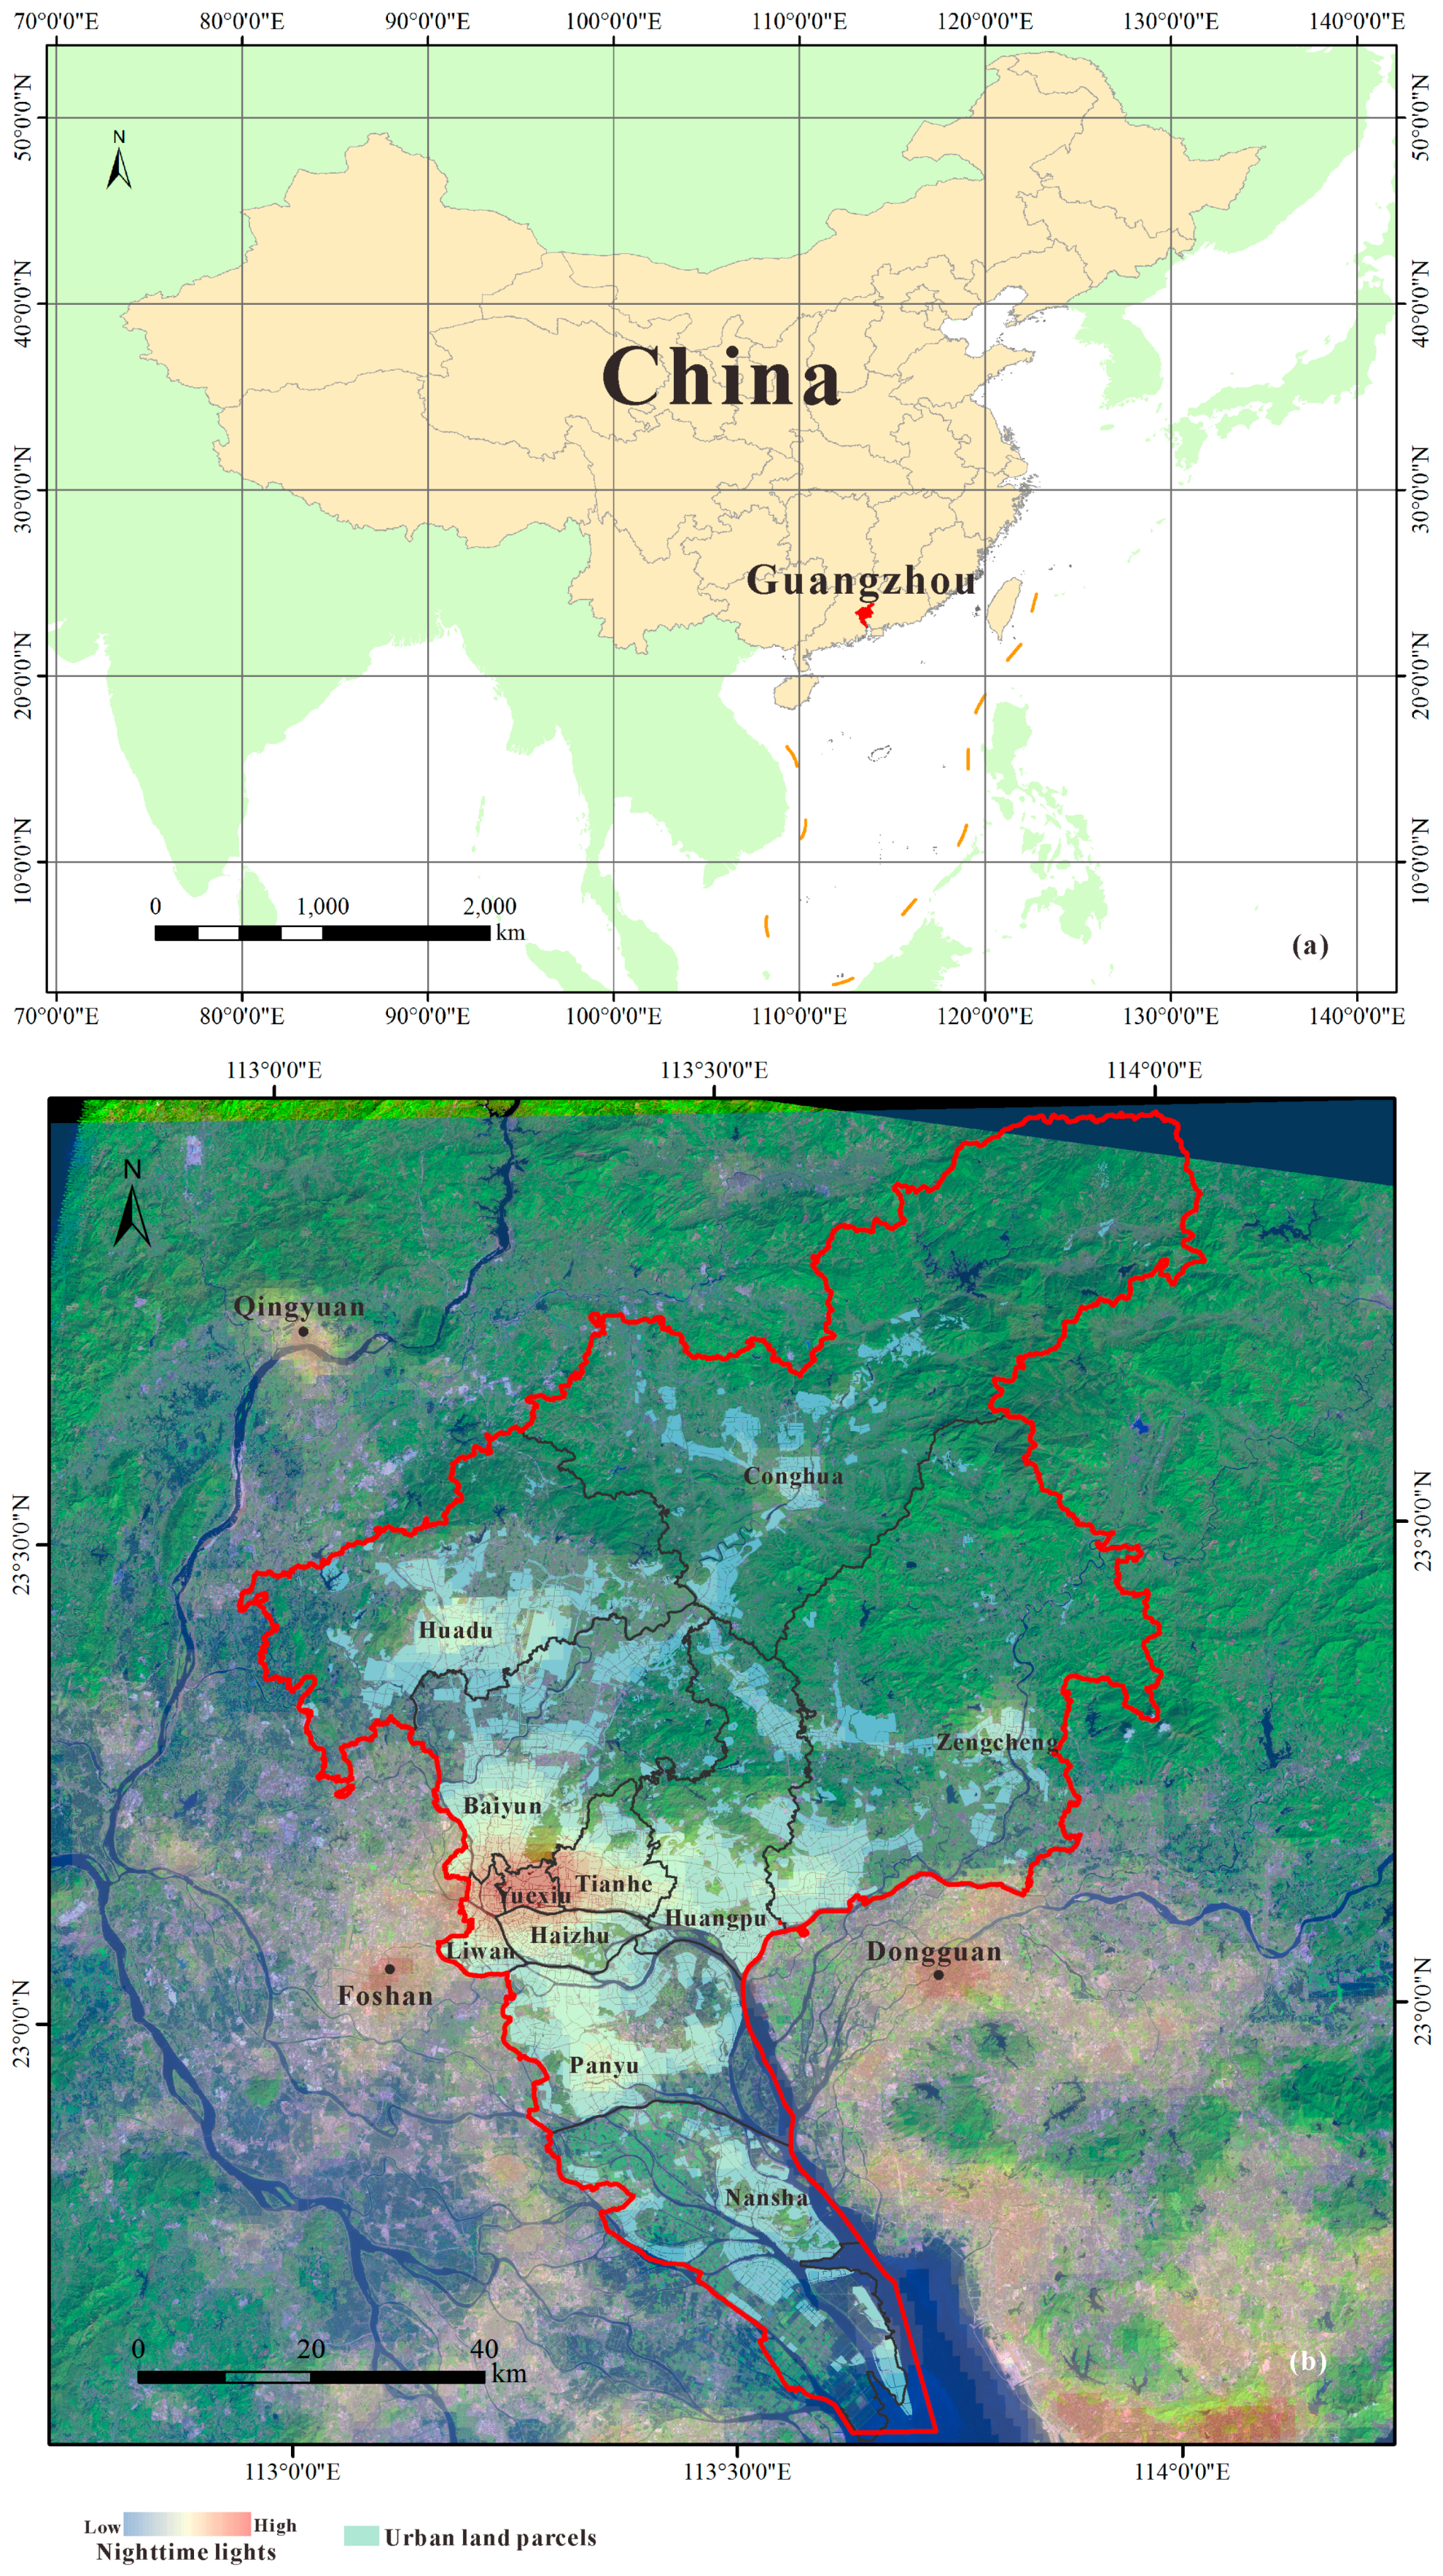
3. Study Area and Data

The study area is located in Guangzhou, China (Figure 2). Guangzhou is the capital of Guangdong Province, and the central city of Pearl River Delta (PRD). The rapid urbanization processes and associated land-use change in PRD have been reported by previous studies [23,24]. As the largest city in this region, Guangzhou rapidly grew and restructured into a multi-nucleus city during the past thirty years (Figure 2) [25]. Compared with the other cities in PRD, however, Guangzhou has unique urban growth drivers, such as the constructions of large city projects (e.g., the University Town), hosting international sport events (e.g., the 2010 Asian Games) and the encouragements of real estate development [26,27,28]. In recent years, several sub-centers (e.g., Panyu, Huangpu and Huadu) have emerged on the outskirts of the city core [3,29]. In 2014, the two county-level cities of Zengcheng and Conghua were upgraded into the districts of Guangzhou. They are expected to become the next new growth centers. In this study, we explore the urban growth process in Guangzhou from 1995 to 2012, considering the increases of urban land area and activity intensity at the parcel level.
Five scenes of cloud-free Landsat TM/ETM+ images in the years of 1995, 2000, 2003, 2006 and 2012 were acquired for the extraction of urban land-use (Table 1). They were downloaded from the U.S. Geological Survey Global Visualization and have already been geometrically corrected. The planimetric root mean square errors of the geometric residuals for these images are 4.386 m (1995), 3.429 m (2000), 4.126 m (2003), 4.451 m (2006) and 5.372 m (2012), as reported by the image metadata files. They were processed and analyzed through a semi-automatic classification method for extracting urban land-use in each year. First, the object-based segmentation was implemented for all images using the eCognition software. Second, these objects were classified into urban and non-urban based on the calculated normalized difference built-up index (NDBI) [30]. For each image, a number of ‘urban’ object samples were selected through visual inspection to determine the lower bound and the upper bound of NDBI thresholds (Table 2) for extracting urbanized areas. However, the NDBI-based extractions may contain misclassifications. One major misclassification exists between the categories of post-harvested farmland and urban land. Another typical misclassification was the confusion between bare land and factories with metal rooftops. Thus, to ensure the data quality, visual interpretation and manual editing were carried out to refine the classifications with the aid of concurrent Google Earth images. After the corrections of classification errors, the accuracy has been improved, reaching 92%–98% (Table 2).
The literature has confirmed the positive correlations between nighttime lights and many socioeconomic activities [10,11,13,31]. We obtained the nighttime light data from the National Geophysical Data Center at National Oceanic and Atmospheric Administration (NOAA/NGDC). We used the global radiance calibrated products instead of the DMSP/OLS data to avoid the signal saturation problem. The radiance calibrated products also allows a better characterization of lights variation in the city cores (Table 1). According to the technical description document of the radiance calibrated products, an inter-annual calibration should be implemented for the selected products before any comparative analysis:
R = β 0 + β 1 R
where R and R are the original and calibrated data values, respectively; β 0 and β 1 are coefficients that can be found in the technical description document of the products (Table 3). It should be noted that F16_20051128-20061224_rad_v4 is the reference data for all products and hence there are no coefficients for it.
Additionally, the official land parcel data of the study area in 2011 were also acquired from the local planning agencies. The shapes and boundaries of the parcels maintain unchanged throughout the study periods. Compared with individual pixels, land parcel data offer a better representation of realistic land entities. We aggregated the urban land area and the sum of nighttime lights intensity for each parcel level. The area-corrected net changes of the parcel-level urban land expansion and activity changes are then calculated using Equations (1) and (2).

4. Results

4.1. Implementation of the Methodology

The contemporary literature has consistently reported the correlating relationships between nighttime lights and various kinds of socioeconomic activities [10,11,13,31]. Despite such evidence, it is worth testing whether the calibrated nighttime lights as a global product can reflect the spatial variations of activity intensity at a single city level. Therefore, we conducted regression analysis using the calibrated nighttime lights products and a dataset of point of interests (POIs) in 2011. A POI is a point location with the attributes of its name, address and category. Thus, the POIs dataset can provide fine information about the locations of activities. We prepared the POIs dataset by collecting the individual POIs records through the Place API of Baidu Maps, a domestic web-based maps platform in China. We chose four categories of POIs, including residential, shopping center, company and factory, to represent the typical types of activities related to living, shopping/socializing, working (office) and industrial production. Then we obtained the spatial density for each type of POI, assuming that the higher the POI density of a location is, the higher the activity intensity that location has. Next, we randomly picked 10% of parcels to test whether a correlation exists between the calibrated nighttime lights and the densities for each POI type.
A multivariate regression model is established by using all of the four density variables to test whether the nighttime lights are positively correlated with all of the activities jointly at the local level. As shown by Table 4, all of the coefficients obtained from the multivariate regression are positive and significant, suggesting that the nighttime lights can be explained as the joint effects of the four selected types of local activity (R2 = 0.7728). Moreover, the standardized coefficients reveal that the POIs types of company (0.51) and shopping (0.40) have much greater effects on the dependent variable of nighttime lights than the types of residential (0.11) and factory (0.07). The differences of these correlations may be related to concentration of working and shopping places in the city core, where high intensity of nighttime lights are observed, whereas factories are mainly distributed in urban peripheries with much lower nighttime lights. Overall, these results confirm that the calibrated nighttime lights products as a single indicator is effective to reflect the spatial variations of activity intensity at the parcel level.
The bivariate LISA analysis was implemented using the GeoDa software [22]. The calculation of wij in Equation (5) requires a pre-defined threshold distance between two parcel centroids for retrieving all the neighbors of the ith parcel. Generally, a larger number of neighbors would be included if a greater threshold distance is set. There is no a single method to determine the adequate threshold distance value. In our analysis, we first calculated the nearest neighbor distance for each of the land parcels, and then segmented all land parcels with different values of nearest neighbor distance to identify the corresponding proportions. We found that the nearest neighbor distance ranges from 2.98 m to 5524.79 m (mean = 375.8 m), and 97.25%, 98.57% and 99.81% of parcels with a nearest neighbor distance of less than 1 km, 2 km and 3 km, respectively. In other words, over 99% of parcels have at least one neighboring parcel within 3 km. Thus, we tested the bivariate LISA with the threshold distance ranging from 1 km, 2 km to 3 km. We found that the neighborhood resulted from the threshold distance of 2 km was large enough because it includes all immediate neighbors and also limits the number of nonadjacent parcels. For each period, most of the parcels that experienced urban growth (i.e., high-high, high-low and low-high) are within the city core and its surrounding regions of Huadu, Panyu and Huangpu, whereas the low-low parcels are mainly located in the remote areas, such as Conghua and Zengcheng. In Nansha, a plenty of low-low parcels before 2003 become high-high in the latter periods of 2003–2006 and 2006–2012. This is consistent with the changed role of Nansha during these periods from an ordinary suburban area into an important sea port with the rapidly growing industries and a newly built business service center [32].

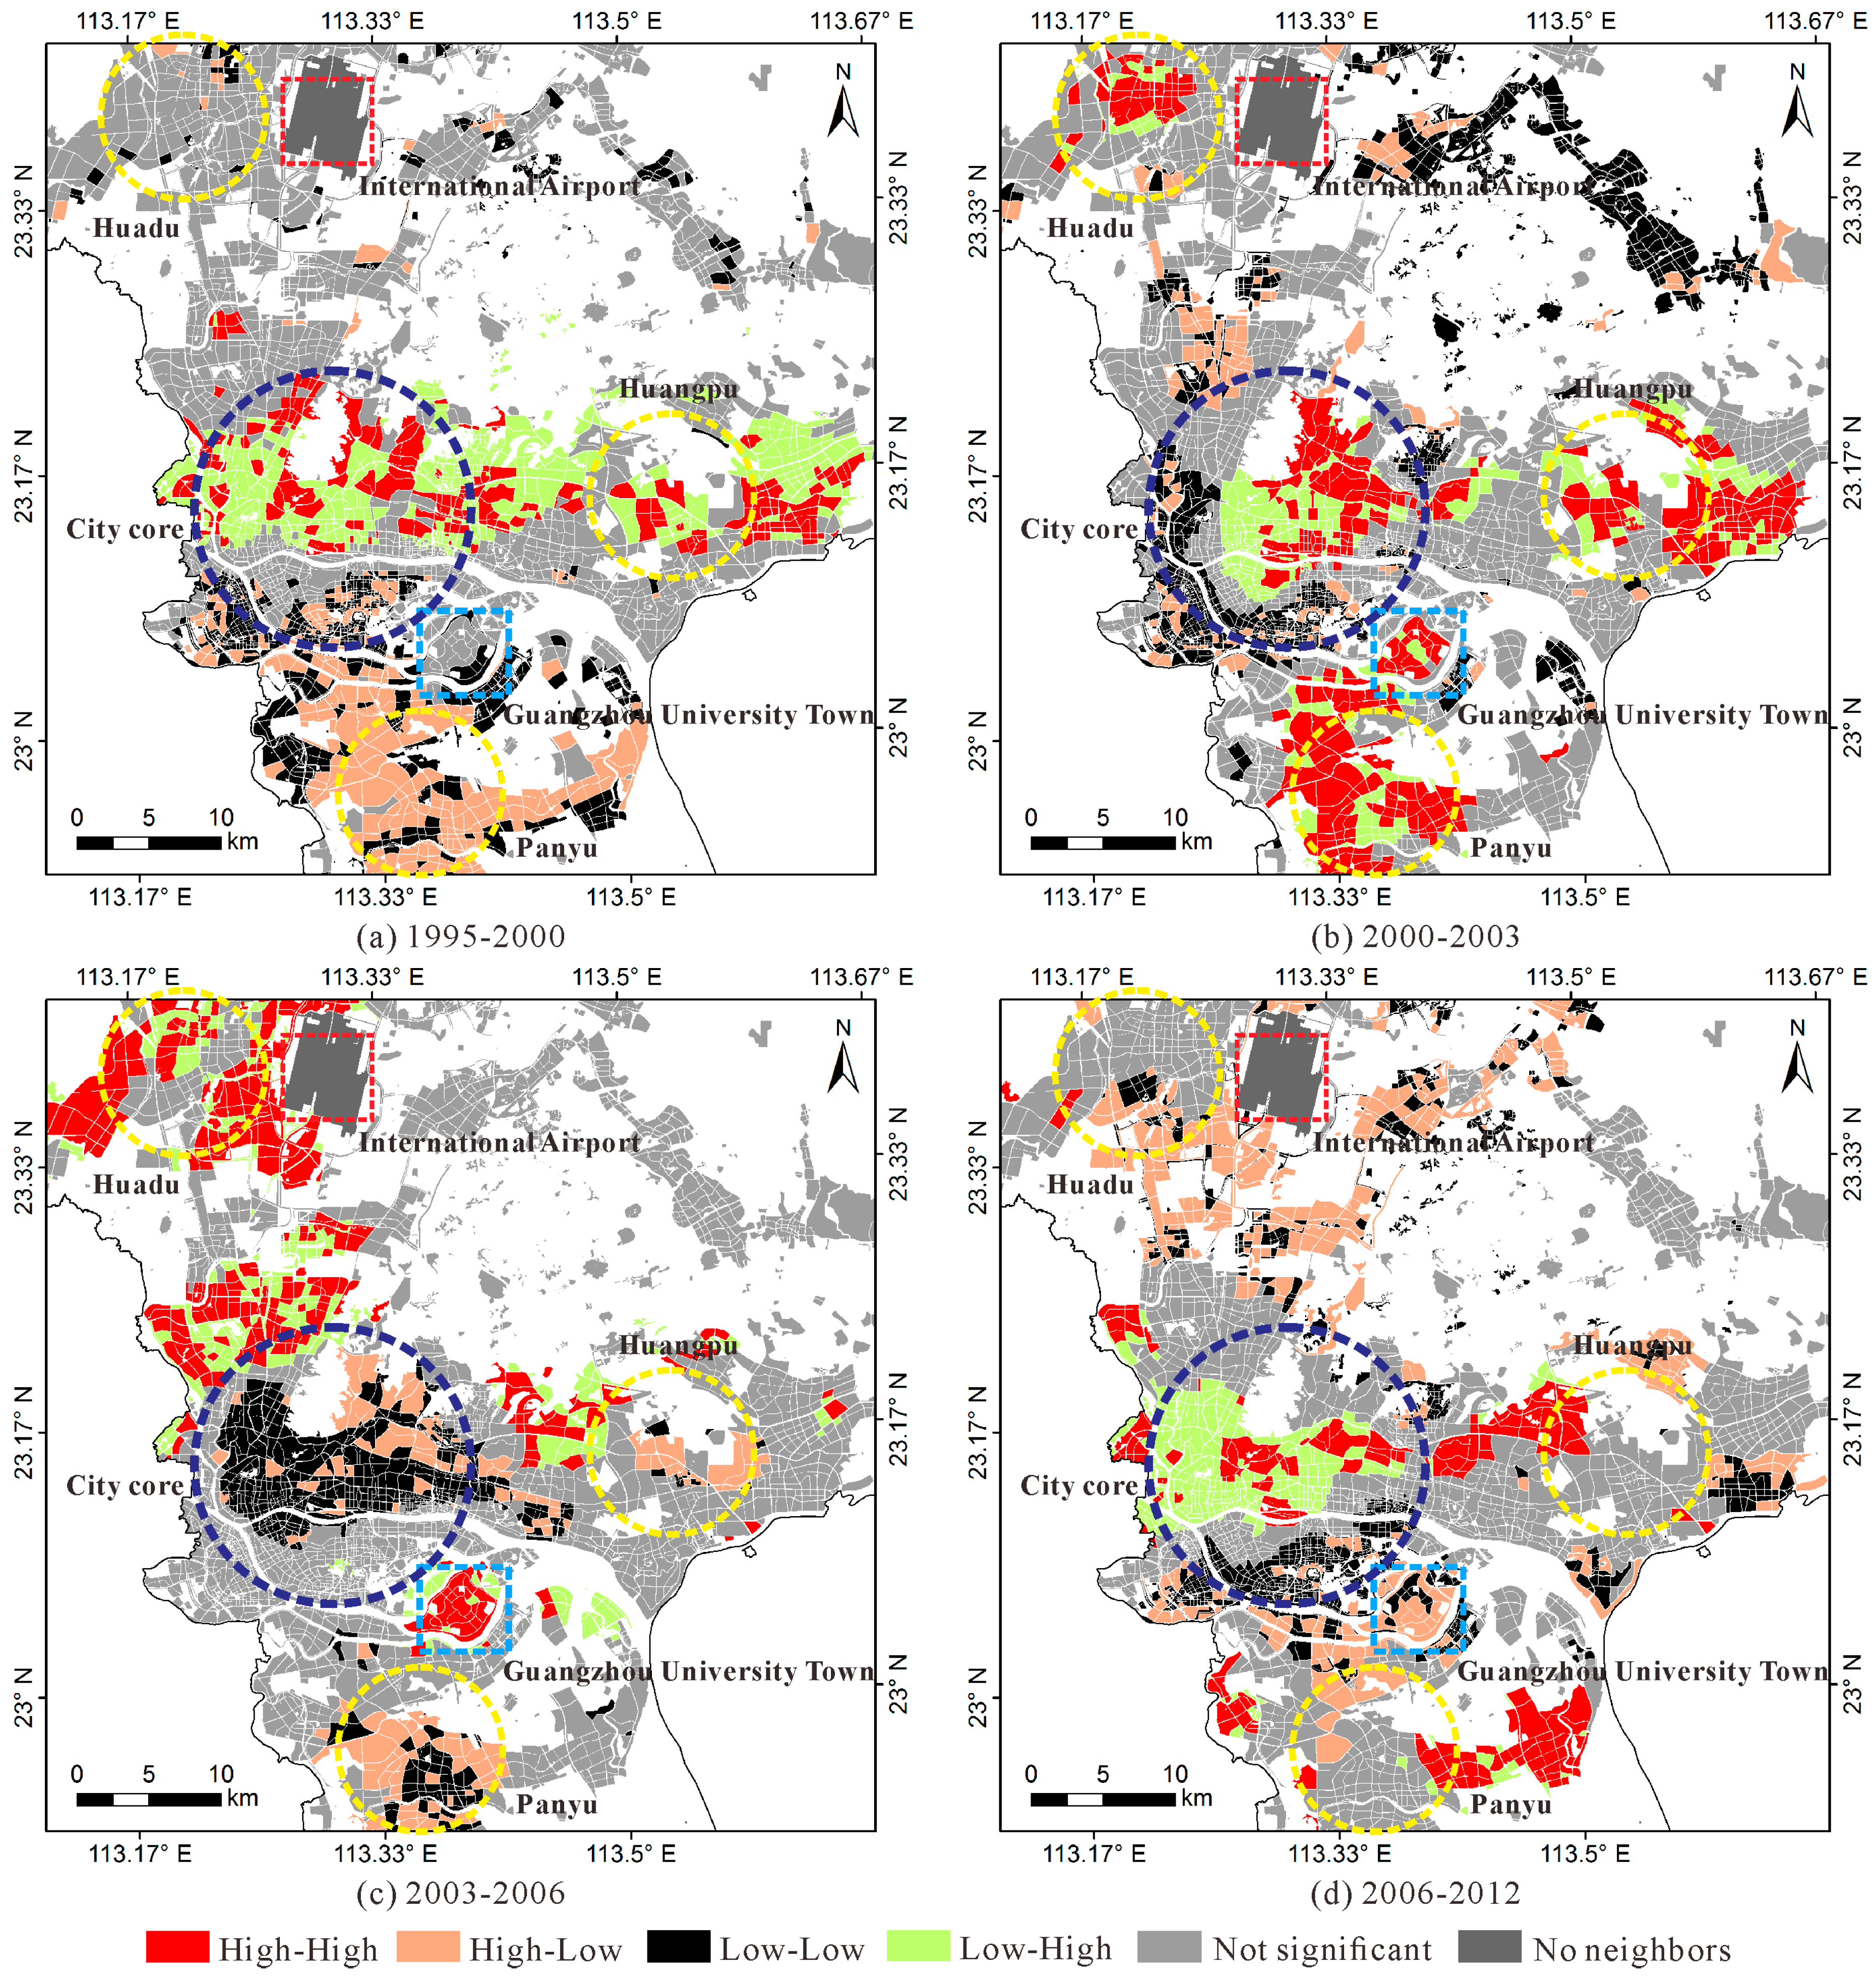
4.2. Relationships between Urban Land Expansion and Activity Changes

Compared with the districts of Huadu, Panyu and Huangpu, the city core experiences tremendous growth in terms of the number of parcels with either observed urban land area or activity intensity increase. Moreover, the dominant growth type in the city core is low-high (i.e., more activity increase than land area increase) throughout the four periods due to its immense power of attracting socioeconomic activities. A similar growth pattern can be found in Huangpu during the period of 1995–2000, although the amount of parcels witnessed growth is relatively small (Figure 3a and Figure 4a). For Panyu, however, most of the parcels are of high-low type, suggesting that urban growth is mainly in the form of urban land expansion instead of activity intensity increase. In brief, urban growth in this period is characterized by urban land expansion in the south and the activity intensity increase in the central area of the city.
In the period of 2000–2003, a considerable amount of high-high parcels is observed in the city core, Huadu, Panyu and Huangpu (Figure 3b), suggesting the rapid growth of both urban land area and activity intensity in these areas. The city core, particularly its center, continues its strong trend in activity intensity growth after the period of 1995–2000. Additionally, the average GDP growth rates for the districts in the city core, such as Liwan, Haizhu and Tianhe, are as high as more than 11% in this period (Table 5). Panyu and Huadu also has a large number of high-high parcels. This is related to the launch of two important construction projects in this period, namely Guangzhou University Town (the cyan box in Figure 3) and the new Guangzhou Baiyun International Airport (the red box in Figure 3) [33]. These two projects had a tremendous impact on the spatial restructuring of Guangzhou. According to the planning scheme, the construction of Guangzhou University Town in Panyu is to open spaces for the setup of new campuses for local universities. This leads to rapid land conversion and also activity increase [34]. This can be reflected by the emerged high-high parcels in this town (Figure 3b). The other construction project, i.e., the new international airport in Huadu, significantly alters the development pattern in this area. This can be confirmed by the observed large cluster of high-high parcels at the center of Huadu. The economic growth of these two districts is also evident, as indicated by the average GDP growth rate of approximately 15% (Table 5). Overall, urban growth in the period of 2000–2003 is featured by the widespread growth of urban land and activity intensity in the city core as well as its surrounding districts of Panyu, Huadu and Huangpu.
In the following period of 2003–2006, urban growth in Huadu accelerates dramatically, as indicated by the growing number of parcels with increased urban land area and activity intensity (Figure 4c). The parcels of high-high and low-high types contribute the largest proportions. This pattern is almost identical to that in the period of 2000–2003. The high-high and low-high parcels spread out from the center of Huadu toward the newly built international airport (Figure 3c), suggesting the long-lasting attraction effect of this important transportation hub. In addition, the average GDP growth rate of Huadu is the third highest (13.64%) compared with the other districts (Table 5). For the city core, a reverse trend can be found in the central area. A large parcel cluster, which is previously identified as high-high/low-high, changes into the low-low type in this period. This indicates that the central area becomes the cold spot of urban growth. The hot spot, however, emerges near the new international airport in the north part of the city core, where massive high-high and low-high parcels intertwine with each other (Figure 3c). In the district of Panyu, the number of high-high parcels significantly decreases compared with previous periods. Most of the high-high parcels are identified in the Guangzhou University Town. On the other hand, a number of low-low parcels are observed at the center of Panyu. They were encompassed by several clusters of high-low parcels on the fringe area of central Panyu, suggesting a pure land expansion process there. The average GDP growth rate of Panyu is relatively low in this period, approximately 6% (Table 5).
In the period of 2006–2012, the high-high parcels are mainly located in Panyu and Huangpu. This is because the construction of new facilities for hosting the 2010 Asian Games [27] (Figure 3d). For example, the Asian Games Town, one of the Asian Games venues, is sited in the eastern Panyu, where a cluster of high-high parcels is observed. In fact, the construction of the Asian Games City is part of the long term development plan in this area, and successfully attracted real estate projects after the Asian Games finished [26]. In the city core, a large number of low-high and high-high parcels are found in the central area, indicating a more significant growth in activity intensity than urban land area in this period (Figure 4d). The average GDP growth rates again rise to over 10% in this period for all districts, suggesting a rapid economic increase in this period.

5. Discussion

One important finding in our results is the mismatching increases detected between urban land and activity intensity at the parcel level. Generally, the mismatch of growth can have two modes: activities grow while land development lags, or conversely, land expands while activities increase slowly. The first mode may suggest the short-term shortage of land supply for the growing socioeconomic activities. However, the land demand generated by growing activities may not be fulfilled due to certain regulations of urban planning and land provision policies. A typical example of this is Hong Kong, where intensive socioeconomic activities are densely distributed in a compact urban space and new land for developments is under strict control. For the second mode, it indeed reflects the short-term surplus of land supply. The literature has reported an emerging gap between the fast land development and the slow urbanization rates in the cities of mainland China [35]. This is largely related to the land-centered urbanization for increasing government revenue on one hand [36], and the rural-urban migration restriction policies on the other [37]. As a result, serious problems have emerged such as the emergence of “ghost cities” which are characterized by a mass of empty skyscrapers and big apartments [36,38]. Apparently, conventional approaches of land expansion analysis [39,40] cannot directly identify the social dynamics behind the physical changes of urban surface (e.g., the “ghost city”). In this regard, the analytical framework proposed in this study is more useful because of its tight link between the physical and social aspects of urban growth.
In this study, the calibrated nighttime light data are used to represent the parcel-level activity intensity. In particular, we evaluate the correlations between the calibrated nighttime light data and four typical types of activities represented using the densities of POIs for residential, shopping, company and factory categories, respectively. Multi-variate regression analysis consistently yields significantly positive coefficients for the selected activity types (R2 = 0.7728). This indicates that the calibrated nighttime light data is a reliable indicator to reflect the joint effects of comprehensive human activities. Overall, these results can be a complement to existing literature that mainly focuses on the relationships between nighttime lights and socioeconomic variables at the meso or macro levels [11,12,41].
The major limitation of the calibrated nighttime light data is their coarse temporal resolution. Compared with the DMSP/OLS data, which has a long archive history since 1990s, the radiance calibrated products are only available for several irregular periods, some of which are listed in Table 1. Thus, more complementary data are required if the annual changes of activity intensity are of interest. The temporal consistency between the calibrated nighttime lights products and other data sources might also constrain data selection for related studies. These limitations are expected to be overcome by the recently released Nighttime Visible Infrared Imaging Radiometer Suite (VIIRS) Day/Night Band Composites. Although these new products are not available before 2012, they have plenty of potential for research aiming at exploring the short-term changes of human activities. Moreover, more socioeconomic attributes can be incorporated, such as the employment density and rural-urban migration, to refine the characterization of human activities at the local level. This also points out a potential direction for our future study.

6. Conclusions

In this research, we analyze the relationships between urban land expansion and activity changes in Guangzhou at the parcel level. The innovation of this paper is the integration of Landsat and nighttime light data for urban growth analysis. Previous research on urban growth analysis using remote sensing techniques primarily focuses on the dynamics of urban land expansion, while little research has addressed the question of how activity changes along with urban land expansion processes. The nighttime light data offers a unique advantage in solving this problem due to their strong correlations with many human activities [31,41]. This is also evident in our case study, as indicated by the results of regression analysis shown in Table 4.
The proposed analytical framework is useful to depict a more comprehensive pattern of urban growth. In our case study, we obtained the urban land data through the multi-temporal classifications of Landsat images with a semi-automatic method. The accuracies of the urban land data range from 92.10% to 98.45%. In addition, we used the calibrated nighttime light data to delineate the spatial variations of activity intensities in different periods. By using the LISA (local Moran’s I) approach, we captured the parcel-level mismatching increases between urban land and activity in Guangzhou. In future research, we plan to refine our results by using NPP-VIIRS data, and also try to incorporate other fine-scale socioeconomic attributes to attain more comprehensive activity information.

Acknowledgments

This research was supported by the Key National Natural Science Foundation of China (Grant No. 41531176), the National Natural Science Foundation of China (Grant No. 41601420, 41371376), the Guangdong Natural Science Foundation (Grant No. 2015A030310288), and the Fundamental Research Funds for the Central Universities (16lgpy03).

Author Contributions

Xiaoping Liu and Xia Li conceived and supervised the research topic; Yimin Chen performed the experiments, analyzed the data, and wrote the paper.

Conflicts of Interest

The authors declare no conflict of interest.

References

  1. United Nations. World Urbanization Prospects: The 2012 Revision; United Nations: New York, NY, USA, 2013. [Google Scholar]
  2. Zhang, Q.; Seto, K.C. Mapping urbanization dynamics at regional and global scales using multi-temporal DMSP/OLS nighttime light data. Remote Sens. Environ. 2011, 115, 2320–2329. [Google Scholar] [CrossRef]
  3. Ma, Y.; Xu, R. Remote sensing monitoring and driving force analysis of urban expansion in Guangzhou city, China. Habitat Int. 2010, 34, 228–235. [Google Scholar] [CrossRef]
  4. Seto, K.C.; Reenberg, A.; Boone, C.G.; Fragkias, M.; Haase, D.; Langanke, T.; Marcotullio, P.; Munroe, D.K.; Olah, B.; Simon, D. Urban land teleconnections and sustainability. Proc. Natl. Acad. Sci. USA 2012, 109, 7687–7692. [Google Scholar] [CrossRef] [PubMed]
  5. Myint, S.W.; Gober, P.; Brazel, A.; Grossman-Clarke, S.; Weng, Q. Per-pixel vs. Object-based classification of urban land cover extraction using high spatial resolution imagery. Remote Sens. Environ. 2011, 115, 1145–1161. [Google Scholar] [CrossRef]
  6. Pham, H.M.; Yamaguchi, Y. Urban growth and change analysis using remote sensing and spatial metrics from 1975 to 2003 for Hanoi, Vietnam. Int. J. Remote Sens. 2011, 32, 1901–1915. [Google Scholar] [CrossRef]
  7. Jin, S.; Yang, L.; Danielson, P.; Homer, C.; Fry, J.; Xian, G. A comprehensive change detection method for updating the National Land Cover Database to circa 2011. Remote Sens. Environ. 2013, 132, 159–175. [Google Scholar] [CrossRef]
  8. Li, X.; Gong, P.; Liang, L. A 30-year (1984–2013) record of annual urban dynamics of Beijing city derived from Landsat data. Remote Sens. Environ. 2015, 166, 78–90. [Google Scholar] [CrossRef]
  9. Deng, X.; Huang, J.; Rozelle, S.; Uchida, E. Economic growth and the expansion of urban land in China. Urban Stud. 2010, 47, 813–843. [Google Scholar] [CrossRef]
  10. Ma, T.; Zhou, C.; Pei, T.; Haynie, S.; Fan, J. Responses of SUOMI-NPP VIIRS-derived nighttime lights to socioeconomic activity in China’s cities. Remote Sens. Lett. 2014, 5, 165–174. [Google Scholar] [CrossRef]
  11. Chand, T.K.; Badarinath, K.; Elvidge, C.; Tuttle, B. Spatial characterization of electrical power consumption patterns over India using temporal DMSP-OLS night-time satellite data. Int. J. Remote Sens. 2009, 30, 647–661. [Google Scholar] [CrossRef]
  12. Shi, K.; Chen, Y.; Yu, B.; Xu, T.; Yang, C.; Li, L.; Huang, C.; Chen, Z.; Liu, R.; Wu, J. Detecting spatiotemporal dynamics of global electric power consumption using DMSP-OLS nighttime stable light data. Appl. Energy 2016, 184, 450–463. [Google Scholar] [CrossRef]
  13. Shi, K.; Yu, B.; Hu, Y.; Huang, C.; Chen, Y.; Huang, Y.; Chen, Z.; Wu, J. Modeling and mapping total freight traffic in china using NPP-VIIRS nighttime light composite data. GISci. Remote Sens. 2015, 52, 274–289. [Google Scholar] [CrossRef]
  14. Zhang, Q.; Schaaf, C.; Seto, K.C. The vegetation adjusted NTL urban index: A new approach to reduce saturation and increase variation in nighttime luminosity. Remote Sens. Environ. 2013, 129, 32–41. [Google Scholar] [CrossRef]
  15. Hsu, F.-C.; Baugh, K.E.; Ghosh, T.; Zhizhin, M.; Elvidge, C.D. DMSP-OLS radiance calibrated nighttime lights time series with intercalibration. Remote Sens. 2015, 7, 1855–1876. [Google Scholar] [CrossRef]
  16. Cao, Z.; Wu, Z.; Kuang, Y.; Huang, N.; Wang, M. Coupling an intercalibration of radiance-calibrated nighttime light images and land use/cover data for modeling and analyzing the distribution of GDP in Guangdong, China. Sustainability 2016, 8, 108. [Google Scholar] [CrossRef]
  17. Anselin, L. Local indicators of spatial association—LISA. Geogr. Anal. 1995, 27, 93–115. [Google Scholar] [CrossRef]
  18. Gray, D. District house price movements in England and Wales 1997–2007: An exploratory spatial data analysis approach. Urban Stud. 2012, 49, 1411–1434. [Google Scholar] [CrossRef]
  19. McGreal, S.; de La Paz, P.T.; Kupke, V.; Rossini, P.; Kershaw, P. Measuring the influence of space and time effects on time on the market. Urban Stud. 2015, 53, 2867–2884. [Google Scholar] [CrossRef]
  20. Leyk, S.; Ruther, M.; Buttenfield, B.P.; Nagle, N.N.; Stum, A.K. Modeling residential developed land in rural areas: A size-restricted approach using parcel data. Appl. Geogr. 2014, 47, 33–45. [Google Scholar] [CrossRef]
  21. Liu, Y.; Li, Z.; Liu, Y.; Chen, H. Growth of rural migrant enclaves in Guangzhou, China: Agency, everyday practice and social mobility. Urban Stud. 2015, 52, 3086–3105. [Google Scholar] [CrossRef]
  22. Anselin, L.; Syabri, I.; Kho, Y. GeoDa: An introduction to spatial data analysis. Geogr. Anal. 2006, 38, 5–22. [Google Scholar] [CrossRef]
  23. Chen, Y.; Li, X.; Liu, X.; Ai, B. Modeling urban land-use dynamics in a fast developing city using the modified logistic cellular automaton with a patch-based simulation strategy. Int. J. Geogr. Inf. Sci. 2014, 28, 234–255. [Google Scholar] [CrossRef]
  24. Liu, X.P.; Ma, L.; Li, X.; Ai, B.; Li, S.Y.; He, Z.J. Simulating urban growth by integrating landscape expansion index (LEI) and cellular automata. Int. J. Geogr. Inf. Sci. 2014, 28, 148–163. [Google Scholar] [CrossRef]
  25. Chen, Y.; Chang, K.-T.; Han, F.; Karacsonyi, D.; Qian, Q. Investigating urbanization and its spatial determinants in the central districts of Guangzhou, China. Habitat Int. 2016, 51, 59–69. [Google Scholar] [CrossRef]
  26. Shin, H.B. Unequal cities of spectacle and mega-events in China. City 2012, 16, 728–744. [Google Scholar] [CrossRef] [Green Version]
  27. Shin, H.B. Urban spatial restructuring, event-led development and scalar politics. Urban Stud. 2014, 51, 2961–2978. [Google Scholar] [CrossRef] [Green Version]
  28. Xu, J.; Yeh, A.G. City repositioning and competitiveness building in regional development: New development strategies in Guangzhou, China. Int. J. Urban Region. Res. 2005, 29, 283–308. [Google Scholar] [CrossRef] [Green Version]
  29. Wei, Y.; Zhao, M. Urban spill over vs. Local urban sprawl: Entangling land-use regulations in the urban growth of China’s megacities. Land Use Policy 2009, 26, 1031–1045. [Google Scholar]
  30. Zha, Y.; Gao, J.; Ni, S. Use of normalized difference built-up index in automatically mapping urban areas from TM imagery. Int. J. Remote Sens. 2003, 24, 583–594. [Google Scholar] [CrossRef]
  31. Ma, T.; Zhou, Y.; Wang, Y.; Zhou, C.; Haynie, S.; Xu, T. Diverse relationships between SUOMI-NPP VIIRS night-time light and multi-scale socioeconomic activity. Remote Sens. Lett. 2014, 5, 652–661. [Google Scholar] [CrossRef]
  32. Gong, J.; Liu, Y.; Xia, B. Spatial heterogeneity of urban land-cover landscape in Guangzhou from 1990 to 2005. J. Geogr. Sci. 2009, 19, 213–224. [Google Scholar] [CrossRef]
  33. Ng, M.K.; Xu, J. Second metamorphosis? Urban restructuring and planning responses in Guangzhou and Shenzhen in the twenty-first century. In Maturing Megacities; Springer: Berlin, Germany, 2014; pp. 29–60. [Google Scholar]
  34. Li, Z.; Li, X.; Wang, L. Speculative urbanism and the making of university towns in China: A case of Guangzhou university town. Habitat Int. 2014, 44, 422–431. [Google Scholar] [CrossRef]
  35. Wang, X.; Hui, E.C.; Choguill, C.; Jia, S. The new urbanization policy in China: Which way forward? Habitat Int. 2015, 47, 279–284. [Google Scholar] [CrossRef]
  36. Lin, G.C.; Yi, F. Urbanization of capital or capitalization on urban land? Land development and local public finance in urbanizing China. Urban Geogr. 2011, 32, 50–79. [Google Scholar] [CrossRef]
  37. Chang, G.H.; Brada, J.C. The paradox of China’s growing under-urbanization. Econ. Syst. 2006, 30, 24–40. [Google Scholar] [CrossRef]
  38. Yu, H. China’s “ghost cities”. East Asian Policy 2014, 6, 33–43. [Google Scholar] [CrossRef]
  39. Bagan, H.; Yamagata, Y. Landsat analysis of urban growth: How Tokyo became the world’s largest megacity during the last 40 years. Remote Sens. Environ. 2012, 127, 210–222. [Google Scholar] [CrossRef]
  40. Shi, K.; Yu, B.; Huang, Y.; Hu, Y.; Yin, B.; Chen, Z.; Chen, L.; Wu, J. Evaluating the ability of NPP-VIIRS nighttime light data to estimate the gross domestic product and the electric power consumption of China at multiple scales: A comparison with DMSP-OLS data. Remote Sens. 2014, 6, 1705–1724. [Google Scholar] [CrossRef]
  41. Chen, Y.; Li, X.; Liu, X.; Ai, B. Analyzing land-cover change and corresponding impacts on carbon budget in a fast developing sub-tropical region by integrating MODIS and Landsat TM/ETM+ images. Appl. Geogr. 2013, 45, 10–21. [Google Scholar] [CrossRef]
Figure 1. The four quadrants corresponding to the four possible urban growth types.
Remotesensing 09 00164 g001
Figure 2. (a) Location of the study area: Guangzhou, China. (b) Guangzhou has a matured city core (Yuexiu, Tianhe, Haizhu, Liwan and Baiyun), three sub-centers (Panyu, Huadu and Huangpu) and three new growth centers (Conghua, Zengcheng and Nansha).
Remotesensing 09 00164 g002
Figure 3. The bivariate LISA maps for the variables between the increase of urban land area and the increase of activity intensity for the periods of (a) 1995–2000, (b) 2000–2003, (c) 2003–2006 and (d) 2006–2012 (threshold distance = 2 km; significance level = 0.05). ‘High-High’ represents high urban land increase and high activity increase; ‘High-Low’ represents high urban land increase and low activity increase; ‘Low-Low’ represents low urban land increase and low activity increase; ‘Low-High’ represents low urban land increase and high activity increase. ‘Not significant’ represents no associations between urban land increase and activity increase. ‘No neighbors’ represents parcels with no neighbors.
Remotesensing 09 00164 g003
Figure 4. The respective numbers of parcels categorized as high-high, high-low, low-low and low-high in the city core, Huadu, Panyu and Huangpu (threshold distance = 2 km) for the periods of (a) 1995–2000, (b) 2000–2003, (c) 2003–006 and (d) 2006–2012. The city core includes districts of Baiyun, Haizhu, Liwan, Tianhe and Yuexiu.
Remotesensing 09 00164 g004
Table 1. Landsat images (122/044) and global radiance calibrated nighttime light data.
Acquisition Dates of the Landsat ImagesGlobal Radiance Calibrated Nighttime Lights
1995.12.30 (Landsat 5 TM)F12_19960316-19970212_rad_v4
2000.11.01 (Landsat 7 ETM+)F12-F15_20000103-20001229_rad_v4
2003.12.20 (Landsat 5 TM)F14-F15_20021230-20031127_rad_v4
2006.12.04 (Landsat 7 ETM+)F16_20051128-20061224_rad_v4
2012.11.02 (Landsat 7 ETM+)F16_20100111-20110731_rad_v4
Table 2. Values of NDBI for the extraction of urbanized areas and associated accuracy.
YearObject CountNDBIAccuracy
(Before Correction)
Accuracy
(After Correction)
1995169,153[0.0957, 0.3465]78.88%92.10%
2000225,882[0.0600, 0.3295]79.00%94.89%
2003211,519[0.1024, 0.2284]77.10%94.63%
2006220,185[0.1117, 0.2381]74.63%95.77%
2012243,001[0.1474, 0.2962]79.74%98.45%
Table 3. Inter-annual calibration coefficients of the global radiance calibrated nighttime light data.
Productsβ0β1
F12_19960316-19970212_rad_v44.3360.915
F12-F15_20000103-20001229_rad_v43.6580.710
F14-F15_20021230-20031127_rad_v43.7360.797
F16_20100111-20110731_rad_v4–1.9871.246
Note: There are no coefficients for F16_20051128-20061224_rad_v4 because it is the reference dataset.
Table 4. Results of the multivariate regression using the four POI density variables (R2 = 0.7728).
ResidentialShoppingCompanyFactoryConstant
Coefficient7.46 ***101.01 ***63.10 ***4.05 **−23.40 **
Standardized coefficient0.11 ***0.40 ***0.51 ***0.07 **--
t-statistics3.3311.7018.562.50−2.83
Significance level: *** = 0.001; ** = 0.01.
Table 5. District-level gross domestic products (GDP) and average growth rates from 2001 to 2012.
LiwanYuexiuHaizhuTianheBaiyunPanyu Huadu
GDP (103 million yuan)
200123,647.6249,677.3821,929.4629,773.2630,970.9331,792.0116,722.03
200329,793.7859,598.6427,144.3136,468.1843,633.5141,478.4722,113.83
200634,479.2294,499.1131,301.0094,295.7052,690.8449,158.5832,455.51
201260,713.22172,681.481,405.94195,534.196,514.0794,718.9465,131.26
Average Growth Rate (%)
2001–200312.259.5311.2610.6718.7011.5512.31
2003–20064.9916.614.8637.256.495.8313.64
2006–20129.8910.5717.2712.9210.6114.2215.00
Note: GDP are in the price of the year 2000.

