1. Introduction
Water vapor (H
2O) and carbon dioxide (CO
2) are the two most abundant constituents of high-temperature volcanic gases. Measuring their emission rates from volcanic vents is a high priority for volcano observatories and researchers around the world, as changes in their emission can be indicative of processes occurring at depth. Unfortunately, both species are considerably more difficult to measure than the less-abundant sulfur dioxide (SO
2) due to the significant atmospheric H
2O and CO
2 background concentrations. The concentration of H
2O and CO
2 in volcanic plumes can be measured with MultiGAS systems [
1,
2] by positioning them in the plume or by Fourier Transform Infrared Spectrometers (FTIR) by using a hot surface or an artificial heat lamp as a source of infrared radiation [
3,
4], but deriving emission rates from these measurements is difficult.
Only recently, Butz et al. [
5] were able to quantitatively measure CO
2 in the Mount Etna plume using solar occultation FTIR spectroscopy for the first time. This method shows great promise, as it allows CO
2 detection from a safe distance from the vent and without subjecting any instrumentation to the harsh environment inside the plume. It could also potentially be automated. Instruments installed in the field could track the sun as it moves behind the volcanic plume and measure the CO
2/SO
2 ratio whenever appropriate meteorological conditions exist. The main limitation of the method is that it requires direct solar radiation to pass through the plume to the instrument without being scattered. Thus, measurements are only possible along the direct path between the sun and the instrument. This prohibits the integrative measurement of the entire plume required for deriving the emission rate. However, emission rates can be determined by scaling the CO
2/SO
2 ratio obtained by FTIR or other methods with the SO
2 emission rate measured by the established Differential Optical Absorption Spectroscopy (DOAS) or SO
2 camera techniques.
The recent success of solar occultation FTIR measurements in measuring volcanic CO
2 raises the question of whether the absorption of CO
2 and H
2O can also be measured in scattered solar radiation passing through the plume. This would allow for the direct determination of the emission rate, as the volcanic plume could be scanned or imaged to determine the trace gas abundance in a cross-section. Multiplied by the wind speed, this value then gives the emission rate. Volcanic SO
2 is measured in this way with scanning DOAS and SO
2 cameras [
6,
7] but even though the absorption cross-sections of both CO
2 and H
2O exhibit characteristic features in the near-infrared (NIR) spectral region, measuring the absorption of scattered solar radiation by these volcanic gases remains extremely challenging.
Following the general principle behind SO
2 imaging in the ultraviolet spectral range, Pering et al. [
8] now present a novel method for imaging volcanic H
2O emissions and determining emission rates. By introducing two bandpass filters in front of a NIR-sensitive camera system, they measure the incident radiance of scattered solar radiation on and off of an H
2O absorption band. By comparing the on-band radiance coming from the clear sky next to the plume with that coming from the plume, they derive an optical depth. As is customary for SO
2 camera measurements [
7,
9], this optical depth is then normalized by the optical depth obtained from the off-band filter in an attempt to correct for scattering of light on aerosols and water droplets in the plume.
The authors measured a clear signal at the location of the volcanic plume in their images. However, a few calculations show that, contrary to their interpretation, the measured signal is unlikely to be associated with the absorption of NIR radiation by water vapor in the volcanic plume. Instead, the most probable explanation for their findings is that the effective atmospheric light path of the detected radiation has been modified by aerosol scattering in the plume, and that their first-order scattering correction is not a valid method for removing the associated signal. The calculations leading to these conclusions are described below.
2. Simple Simulation of Expected Absorption
Light passing through a medium is attenuated according to the Beer-Lambert-Bouguer law of absorption:
Here,
L(
λ) describes the spectral radiance of light after passing through the medium,
L0(
λ) represents the radiance before entering the medium,
λ is the wavelength,
σ is the absorption cross-section of the absorber, and
S is the column density. The column density is the integral of the absorbing species along the light path, and is generally the parameter that spectroscopic measurements are trying to determine [
10].
Using Equation (1), the expected absorption signal can be easily estimated for a given measurement geometry if the absorption cross-section of the species of interest is known. The cross-sections of both CO
2 and H
2O are relatively well-known and available for download from the HITRAN database [
11]. For the sake of brevity, and because this was the topic of the original study by Pering et al. [
8], the following sections will focus on H
2O, but the discussed concepts apply to CO
2 as well.
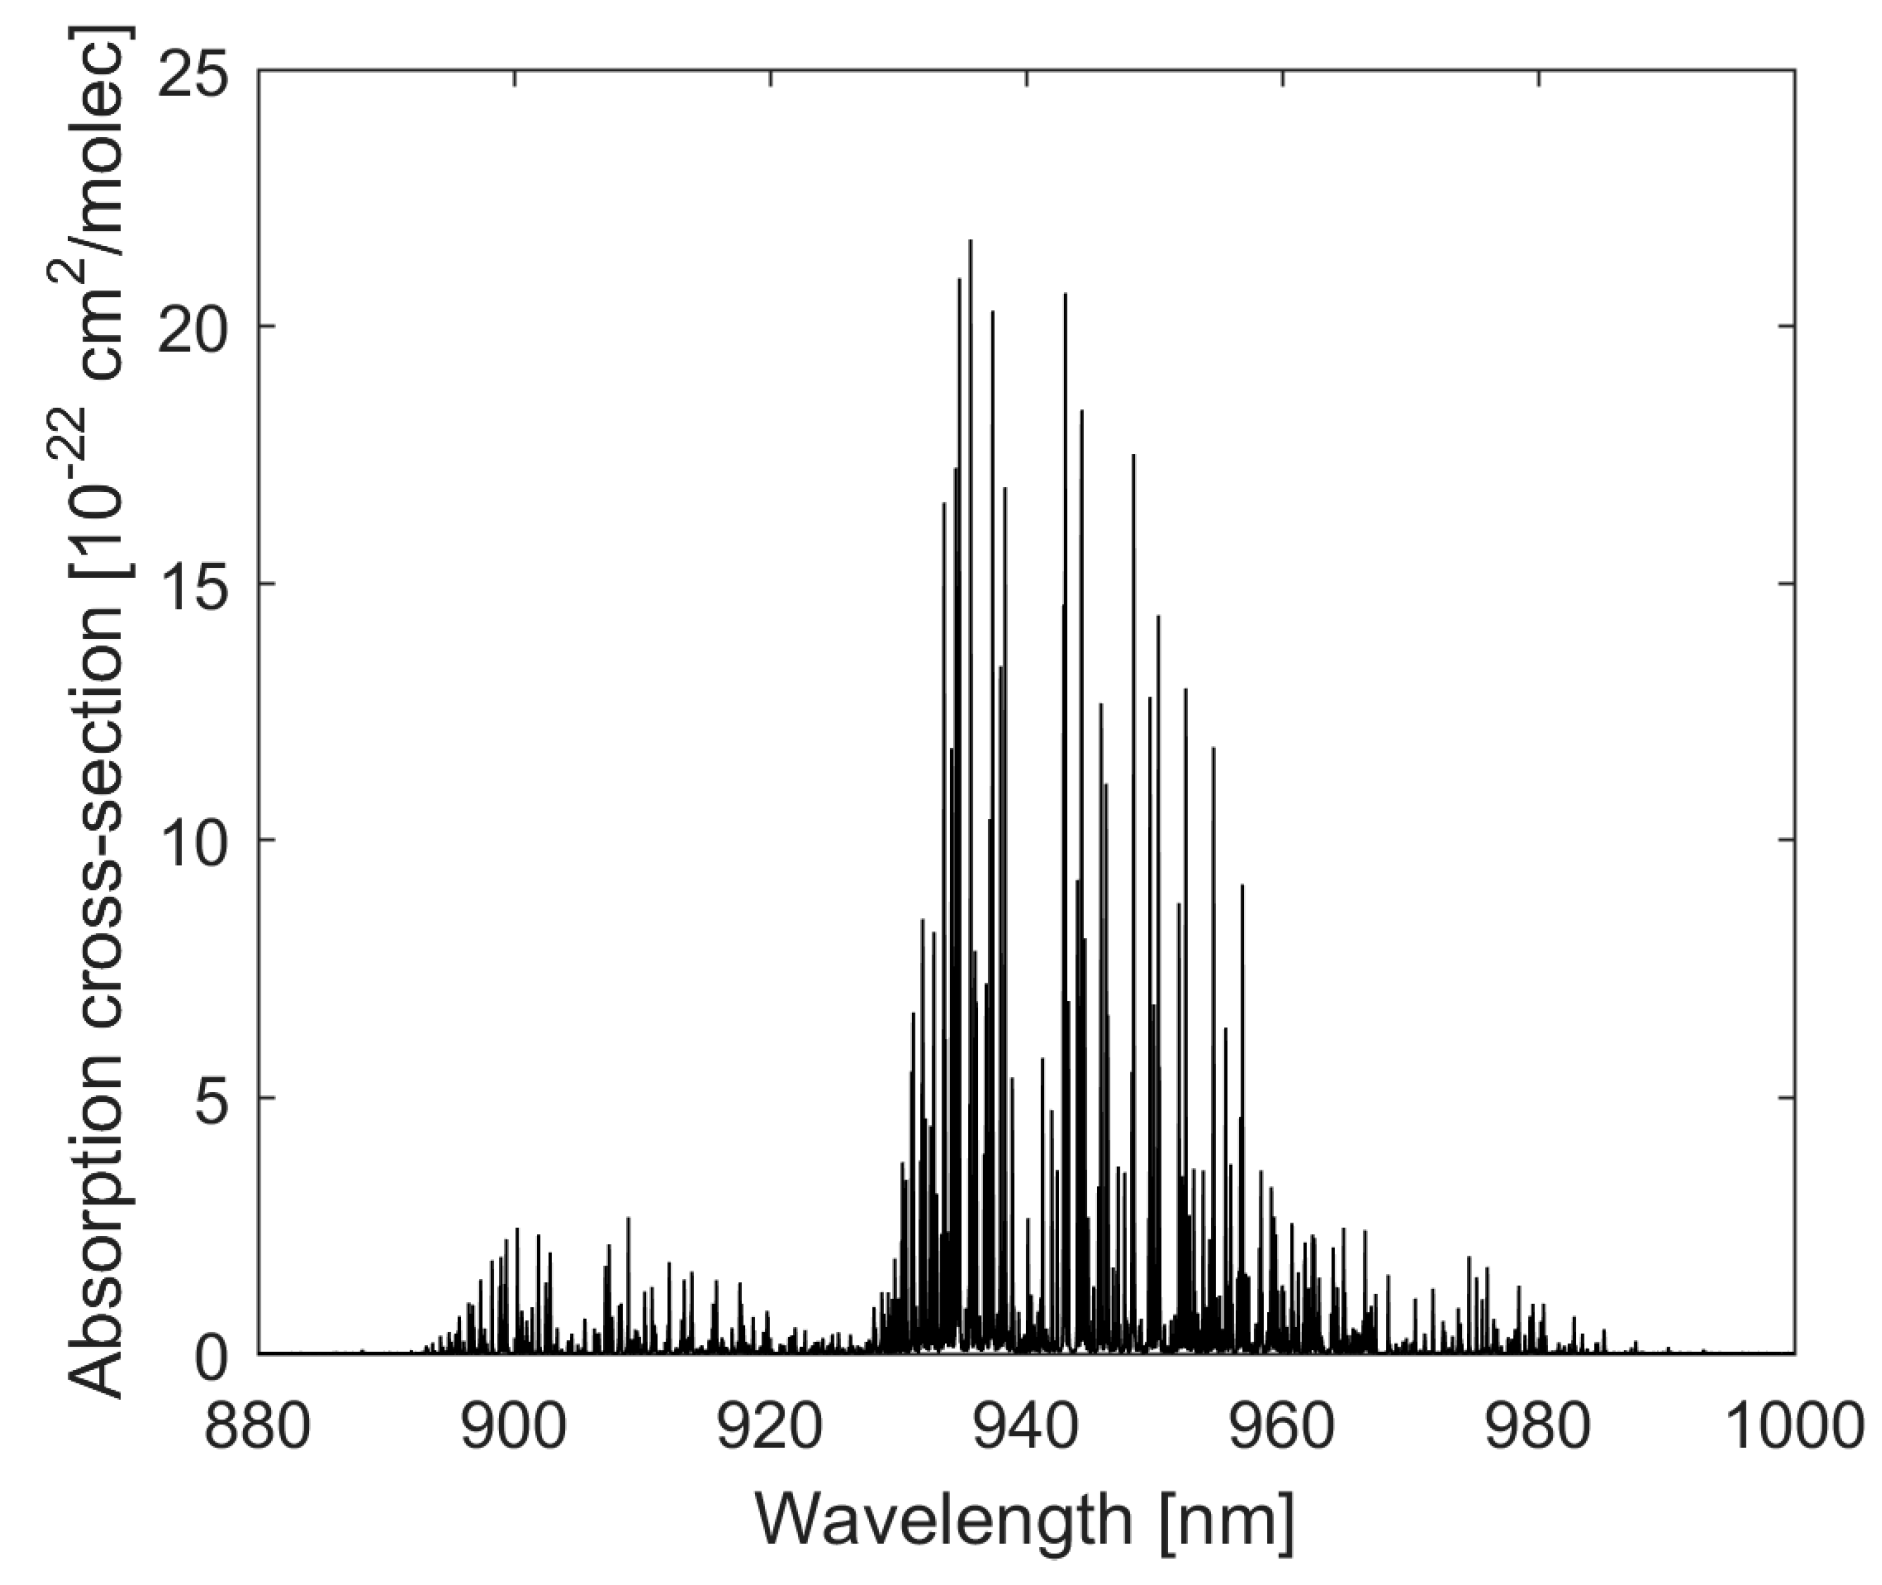
H
2O has an absorption band at around 940 nm. The absorption cross-section of this band was calculated for a line width of 0.01 cm
−1 from the line strengths listed in the HITRAN database, and is plotted in
Figure 1. Note that the maximum cross-section is around 2 × 10
−21 cm
2/molecule. This value differs from the 5.7 × 10
−22 cm
2/molecule (=19 cm
2/g) cited by Pering et al. [
8], but this could simply be a result of using a greater line width for the calculation of the cross-section. In the end, it is the area under each line that will determine the absorbed energy. Since individual lines cannot be resolved, the maximum amplitude of the cross-section is not of great importance for these measurements or the below calculations.
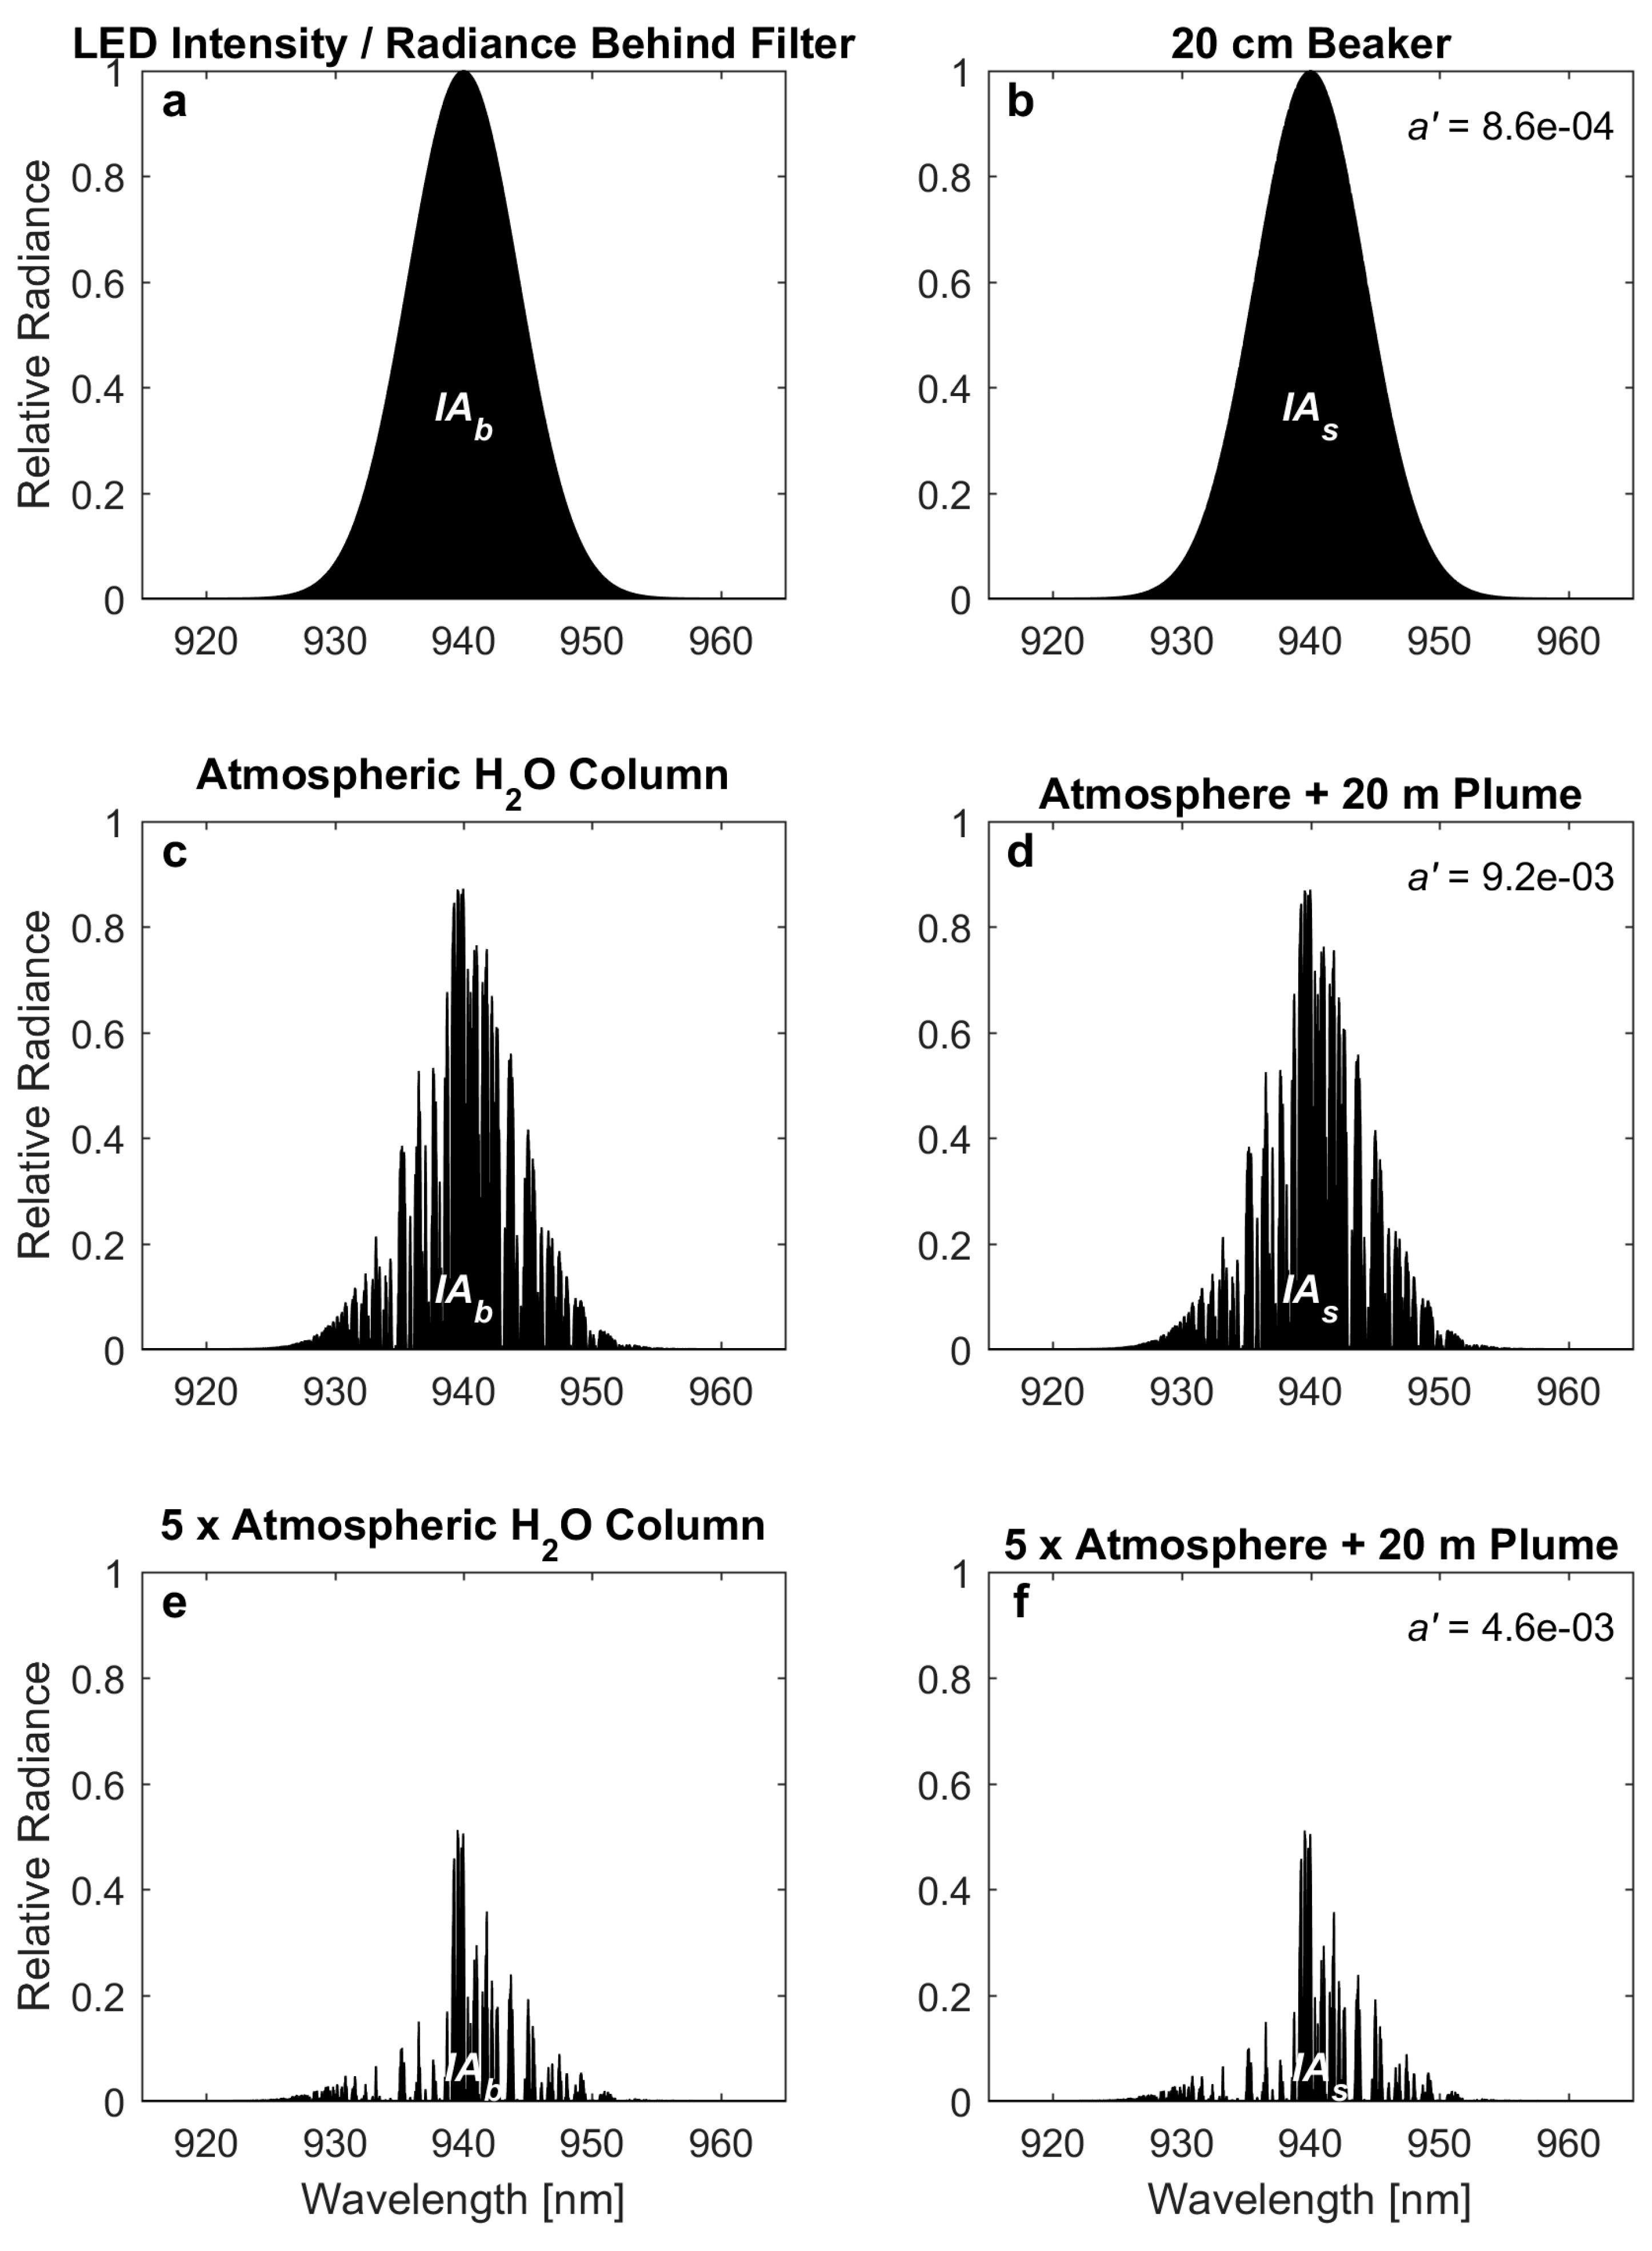
The spectrum of a light-emitting diode (LED) is similar to the transmittance curve of a bandpass filter. Both can be approximated by a Gaussian curve. A Gaussian with a 10 nm Full Width at Half Maximum (FWHM) is plotted in
Figure 2a. Assuming this initial spectrum as the background radiance, the remaining spectral radiance after passing through a known amount of water vapor can be calculated according to Equation (1). The August-Roche-Magnus formula provides a tool for estimating the H
2O saturation vapor pressure
ps as a function of temperature [
12,
13]:
In this form, the temperature
T must be inserted in units of degrees Celsius and the equation yields the vapor pressure
ps in hPa. Relative humidity can then be obtained by comparing the actual water vapor partial pressure (or concentration) to the saturation pressure. This equation, or a variant thereof, is probably what Pering et al. [
8] meant to refer to in their Equation (2), though their equation appears to be reproduced incorrectly.
Applying Equation (2), one finds that 100% relative humidity corresponds to approximately 23 hPa at 20 °C. Inserting this value into the ideal gas law yields a water vapor concentration of about 6 × 10
17 molecules/cm
3. With this information, the approximate absorption of various water vapor column amounts can be simulated. For example, a heated beaker filled with water might induce 100% relative humidity over a 20-cm path length above it. This corresponds to a column density of about 1.2 × 10
19 H
2O molecules/cm
2. If this path were illuminated by an LED with a Gaussian emission spectrum, the remaining light intensity after passing through the water column can be calculated according to Equation (1). Though barely different from the initial Gaussian, the spectrum of transmitted light is plotted in
Figure 2b. Integration over the spectral radiance gives the total incident radiance, which is the parameter that would be measured by a camera or other photodetector (denoted by
IAs and
IAb by Pering et al. [
8]). The optical depth
a’ is then obtained by taking the negative logarithm, analogous to the authors’ Equation (1). (In the absence of in-plume scattering,
IBs and
IBb are assumed to be identical and therefore cancel each other out.)
In the example of the beaker, only 0.086% of the total radiance is absorbed, so an extremely precise measurement would be required to detect any absorption at all. It is unlikely that a measurement with sufficient precision is possible with a webcam, as attempted by Pering et al. [
8]. It is unclear exactly where their measured signal originated from, but it may be related to an imperfect correction of light scattered on water droplets and steam above the beaker. These scattering effects are generally greater in magnitude than the absorption of water vapor itself, as will be discussed in more detail below.
On the other hand, an H
2O plume degassing from a volcanic fumarole might exhibit 100% relative humidity over a path of 20 m. In this case, the same calculation shows that about 6.8% of the light would be absorbed by water vapor along the 20-m path. In the absence of volcanic gas, the light would travel through 20 m of background atmosphere, and assuming 50% relative humidity in the background air, only 3.8% of the signal would be attenuated along the same light path. The measured optical depth
a’ associated with the plume itself would therefore be about 3%. Such a signal could be detected with a reasonably sensitive detector, perhaps even with a high quality webcam. Certainly, a more expansive plume could be detected in this way. However, such a measurement would require an experimental setup in which an active source of radiation (e.g., LED) is placed behind the volcanic plume, similar to active long-path DOAS or active FTIR experiments. This class of measurements is summarized in
Table 1(A). Things become more difficult if solar radiation is employed as the light source, as will be shown in the next section.
3. Solar Occultation Measurements
In contrast to measuring SO
2, which has a negligible atmospheric background concentration, the quantitative detection of volcanic H
2O and CO
2 is complicated by the fact that these species have significant atmospheric background abundances. Any ground-based remote sensing technique that relies on solar radiation as a light source will measure light that has passed through the entire atmospheric column above the measurement site at least once. If the radiation also passes through a volcanic plume, the column density will be enhanced over the atmospheric column by the additional amount of the target gas in the plume. Measured at sea level, the global average vertical column density of water vapor is approximately 8 × 10
22 molecules/cm
2 [
14], though the actual value varies significantly with latitude and is much larger near the equator.
A “solar occultation” measurement is performed by pointing a spectroscopic instrument at the sun and measuring unscattered (“direct”) solar radiation passing through the atmosphere [
15,
16]. If a volcanic plume is located between the sun and the instrument, the radiation additionally passes through it (see
Table 1(B)). If such measurements are performed at low latitudes near solar noon, the sun is close to the zenith and the light path is close to a vertical column through the atmosphere. This measurement geometry is advantageous for two reasons: (1) The low solar zenith angle and nearly vertical measurement geometry reduce the absorption of light by the background atmosphere to a minimum, thus maximizing the relative contribution of the plume. (2) Perhaps more importantly, the influence of scattering can be neglected because any light scattered out of the direct path between the sun and the instrument is unlikely to ever be detected by the instrument. Therefore, the light path of the measured radiation is known to always be the direct path between the sun and the instrument.
The calculations performed in the previous section can be repeated for the vertical atmospheric H
2O column. Inserting 8 × 10
22 molecules/cm
2 into the Beer-Lampert-Bouguer law (Equation (1)), the spectrum shown in
Figure 2c is obtained. This spectrum shows that virtually all wavelengths in the measurement window are now absorbed to some degree, with several lines essentially reaching null, i.e., the spectrum is completely dark in spots. Integration over all wavelengths shows that about 2/3 of the radiance is absorbed on its way through the atmosphere.
This spectrum can now be compared to the spectrum obtained with an additional fumarolic water vapor plume in the light path. Again using a 20-m plume of 100% relative humidity (RH), a volcanic H
2O column of 1.2 × 10
21 molecules/cm
2 can be added to the atmospheric column, resulting in a total column of 8.12 × 10
22 molecules/cm
2. The associated spectrum of transmitted light is plotted in
Figure 2d, but does not differ discernably from the atmospheric spectrum. Using the atmospheric spectrum as a reference (
IAb), the optical depth added by the volcanic plume is only 0.0092. This signal is small, but might be detectable with a precise instrument. Certainly, it should be possible to detect a somewhat larger plume from a higher elevation volcanic vent (where the overhead H
2O column is reduced) with the solar occultation geometry. Recent solar occultation FTIR measurements for the first time succeeded in measuring volcanic CO
2 emitted from Mount Etna, albeit at much higher spectral resolution and longer wavelengths [
5]. However, even more challenges arise when scattered solar radiation is used as a light source, as is needed for scanning or imaging applications. This is discussed in the next section.
4. Measuring H2O Absorption in Scattered Sunlight
Scanning and imaging applications in the ultraviolet, visible, and NIR wavelength ranges use solar radiation scattered in the Earth’s atmosphere as a source of light (
Table 1(C)), the main advantage being that the entire plume is illuminated at once. Therefore, the scanners or cameras can measure the trace gas abundance throughout the plume and eventually derive emission rates rather than just measuring relative gas abundances.
When measuring a gas species that is present in both the plume and the background atmosphere, the scattered light measurements can become very dependent on the measurement geometry. For example, water vapor has a scale height of about 2 km in the atmosphere [
17], which means its concentration drops to 1/e times its ground-level value at this altitude. Light detected by a scanning or imaging instrument pointed at 10 degrees elevation above the horizon has traveled more than 10 km in the lowermost 2 km water vapor layer. Therefore, the spectral radiance of this light will typically exhibit H
2O absorption associated with about five times the vertical atmospheric H
2O column.
Figure 2e shows the spectral radiance reaching a detector behind a bandpass filter after passing through 3.2 × 10
23 H
2O molecules/cm
2 (five times the average vertical atmospheric column). The atmospheric absorption is quite strong now, and the relative contribution of an additional 20-m plume of 100% RH is now even smaller (
Figure 2f). In this scenario, the expected plume optical depth is less than half of one percent. Clearly, a very precise measurement would be required to detect this signal.
In practice, however, such a measurement will probably not be possible. Up to now, the presented examples have assumed that the influence of scattering aerosols in the water vapor plume is negligible. This holds true for solar occultation measurements, where scattered radiation is not detected, but as will be discussed next, it is not valid for measurements of scattered sunlight.
5. The Effect of Scattering in the Plume
Due to the high abundance of H
2O in high-temperature volcanic gas and the tendency for emitted SO
2 to form sulfate aerosols, most volcanic plumes contain some amount of aerosols and/or liquid water droplets, particularly in areas proximal to the vent. These aerosols and water droplets can potentially scatter solar radiation towards an observing instrument (shown in
Table 1(C), path B). In fact, aerosol scattering effects are the process by which these plumes become visible to the human eye. As mentioned before, the conventional approach for first order correction of scattering in ultraviolet SO
2 camera measurements is to divide the trace gas optical depth by the optical depth obtained in a wavelength range outside the trace gas absorption band (Equation (3)) [
7,
9].
This very same correction was also applied by Pering et al. [
8]. Unfortunately, the method is not valid for correcting absorption measurements of gas species that are abundant in the background atmosphere. This can be easily demonstrated with the help of an example. Assuming the same measurement geometry as discussed in the previous section, but now allowing for in-plume scattering, the plume may appear brighter in the off-band channel (Pering et al. use 850 nm) due to additional radiation being scattered toward the instrument on aerosols in the plume (
Table 1(C), path B). Even for relatively transparent plumes, it is reasonable to assume that 10% of the detected radiation could have been scattered in the plume. In this case, the plume would appear ~10% brighter than the background in the off-band channel. The standard correction (Equation (3)) would then call for the measured on-band (940 nm) optical depth to be increased by 0.1. Note that this correction is orders of magnitude larger than the expected signal from H
2O absorption in the plume (~0.0046,
Figure 2f), so the applied correction would have to be extremely precise.
Unfortunately, it will not be possible to attain this level of precision. The problem lies in the different atmospheric path that the plume-scattered radiation (
Table 1(C), path B) has taken when compared to the light coming through the plume from behind (
Table 1(C), path A). In a single scattering approximation, the plume-scattered radiation will have traveled straight through the atmospheric H
2O column (again, assuming the sun is close to the zenith) before being scattered towards the detector. In general, its atmospheric path will be significantly different than that of the light coming from behind the plume. In our example, if we again assume a five times shorter path for the plume-scattered radiation, light absorption by atmospheric H
2O will be significantly smaller, and the contribution of this light to the total radiance will be much greater than the additional 10% measured in the off-band channel. Inserting the numbers from the previous section for a standard atmosphere into Equation (1), and assuming that 10% of the detected light traveled along path B in
Table 1(C), we expect a detected optical depth of −0.33 at 940 nm. The negative sign means that the plume actually appears 33% brighter than the background. This is a direct effect of the shorter path through the atmospheric water column taken by the plume-scattered radiation. Applying the correction from the off-band channel (Equation (3)) would yield a corrected optical depth of −0.23. Since the off-band channel does not account for atmospheric water vapor absorption, the derived differential optical depth is very far from the true value associated with absorption of light by water vapor in the plume (only 0.0046).
While these numbers are valid only for the specific measurement geometry of the given example, they illustrate the main difficulty of measuring the absorption of scattered solar radiation by volcanic water vapor or CO2. The problem lies in the fact that even small amounts of aerosols or condensed water droplets in the plume cause changes in the effective atmospheric path length of the detected radiation. Because H2O and CO2 are abundant in the atmosphere, these path length changes significantly affect the detected spectral radiance or integrated intensity. The instrument registers a change in the amount of water vapor along the line of sight, but the majority of this change comes from the modified effective path that radiation has taken on its way through the atmosphere. In the discussed example, these atmospheric effects are about two orders of magnitude greater than the signal expected from absorption of radiation by H2O in the plume itself. Moreover, the example is by no means an extreme case. Plume-scattered radiation will oftentimes account for more than 10% of the incident light, particularly when imaging plumes close to their source vents. The discussion also shows that the dual channel correction approach (Equation (3)) is not valid when measuring gas species with significant atmospheric abundances, because it does not take potential changes of the effective path length through the atmospheric background into account.
6. The Physics behind the Measurements Presented by Pering et al.
According to the above discussion, the dual channel camera employed by Pering et al. [
8] was probably not able to measure the extremely weak absorption of scattered sunlight by water vapor in the volcanic plume. In both the Vulcano Island and Mount Etna measurements, scattering on plume aerosols and water droplets most likely led to a change in the effective atmospheric path length of the detected radiation. Since a change in atmospheric path brings a change in atmospheric water vapor absorption with it, the instrument would have responded to this effect. This means that the parameter derived from the imagery was not primarily associated with in-plume water vapor absorption but instead was essentially a measure of the contribution of in-plume aerosol scattering to the total detected radiation (parameter
f in
Table 1(C)).
While this does not appear to have been the intent of the measurements, others have shown that monitoring the radiance arriving at the detector due to in-plume aerosol scattering may in some cases give a first-order approximation of the plume’s water content [
18,
19]. However, factors other than the plume’s water abundance also impact the plume scattering efficiency. Environmental conditions such as the temperature and relative humidity of the background air, the vent exit temperature, and the concentration of sulfate aerosols and other condensation nuclei in the plume all affect the plume aerosol optical depth and thus the expected scattering efficiency of the plume. In addition, even if the plume and environmental conditions remained constant, geometric parameters such as the solar zenith angle, the solar azimuth angle relative to the observation azimuth, and the measurement elevation angle will all influence the expected contribution from in-plume aerosol scattering to the total detected radiance.
Given the sensitivity of the measured signal to such a large number of potentially varying parameters, the method can only be expected to achieve quantitative results if very frequently calibrated with an independent measure of plume water content. Pering et al. chose to calibrate their measurements using simultaneously recorded measurements of relative humidity within the plume. This approach could work, though measuring the total water content in both the vapor and liquid phase would require a heated instrument. Otherwise, the presence of condensed liquid water in the instrument or gas inlet would simply lead to a saturation of the relative humidity at 100%.
Pering et al. also reported coincident emission rates of SO
2 and H
2O from the Northeast Crater of Mount Etna. Figure 3 and Figure 4 in [
8] show what appears to be a positive correlation between H
2O and SO
2 fluxes, but the above discussion introduces some ambivalence into these results. Since the measured NIR water vapor absorption signal appears to be mainly associated with the scattering of light on aerosols in the plume, the signal is expected to vary with the aerosol abundance. The abundance of aerosols in the plume could be related to the water abundance, but it is certainly also related to the abundance of sulfate aerosols and other condensation nuclei within the plume. Therefore, it seems plausible that the efficiency of scattering within the plume could be modulated by the sulfate aerosol concentration (which in turn is likely related to the SO
2 output), even if the total water abundance remained constant over time. Thus, the performed measurements are probably not well-suited to provide quantitative information on the contemporaneous output fluxes of SO
2 and H
2O.
7. Conclusions
Measuring the absorption of scattered sunlight by CO2 or H2O in volcanic plumes is challenging. The main difficulty in taking such measurements lies in the potential for a change in the effective atmospheric light path of the detected radiation caused by scattering on plume aerosols. Since both CO2 and H2O have significant atmospheric background concentrations, any change in the atmospheric light path will also affect the measured absorption signal, regardless of the CO2 or H2O abundance inside the plume. This difficulty is not limited to ground-based measurements. Earth-observing satellite instruments face the very same challenges, which must be overcome before reliable measurements of volcanic CO2 or H2O can be made.
Pering et al. [
8] reported on NIR-imaging measurements of volcanic plumes at Vulcano Island and Mount Enta. Their novel method measures the absorption of NIR light by water vapor. However, the examples discussed here show that the method is extremely sensitive to the scattering of light on aerosols within the plume. The signal caused by changes in the effective atmospheric light path due to in-plume scattering is about two orders of magnitude larger than the expected absorption signal from water vapor in the plume itself. The proposed method for correcting aerosol scattering by normalizing the measured optical depth with an optical depth obtained outside the water absorption wavelength region (Equation (3)) does not work, as it does not take absorption of light by atmospheric water vapor into account. Therefore, similar to other methods that attempt to relate a plume’s visible opacity to its water content [
18,
19], the technique can only produce quantitative information if very frequently calibrated with an independent measurement method. Also, since the aerosol abundance within the plume can influence its scattering efficiency, the NIR-imaging technique cannot easily distinguish between a change in the abundance of sulfate aerosols or water vapor in a volcanic plume.
Despite the challenges associated with the quantitative remote sensing of volcanic CO
2 and H
2O, a few approaches do show promise. For one, any type of active-source measurement (e.g., active-source FTIR or active long-path DOAS) can be successful, since this geometry eliminates the need for detected radiation to pass through the entire atmosphere before reaching the sensor. When attempting to use sunlight, solar occultation measurements have the great advantage that by far the majority of the detected radiation has passed through the atmosphere (and plume) in a straight line from the sun to the sensor [
5]. Scattered-light measurements are much more difficult because they are susceptible to variations in atmospheric radiative transfer. One starting point could be the application of sensors to high-elevation volcanoes, thereby reducing the overhead atmospheric CO
2 and H
2O columns. For example, water vapor absorption was recently detected in the plume of Sabancaya Volcano, Peru, at 6000 m above sea level using the DOAS technique [
20]. Scattered-light measurements should also focus on completely transparent volcanic plumes to minimize in-plume scattering effects. This typically means measuring a plume at a distance from the vent, rather than directly at the point of emission. Through a combination of these approaches, continuous monitoring of volcanic CO
2 and H
2O emissions may become possible without the need to install instrumentation within the gas plumes themselves.


