Automatic Evaluation of Photovoltaic Power Stations from High-Density RGB-T 3D Point Clouds


1
Department of Cartographic and Land Engineering, University of Salamanca, Hornos Caleros, 50, 05003 Ávila, Spain
2
Applied Geotechnologies Research Group, University of Vigo, Rúa Maxwell s/n, Campus Lagoas-Marcosende, 36310 Vigo, Spain
*
Author to whom correspondence should be addressed.
Remote Sens. 2017, 9(6), 631; https://doi.org/10.3390/rs9060631
Submission received: 20 February 2017
/
Revised: 18 May 2017
/
Accepted: 13 June 2017
/
Published: 20 June 2017
Abstract
:A low-cost unmanned aerial platform (UAV) equipped with RGB (Red, Green, Blue) and thermographic sensors is used for the acquisition of all the data needed for the automatic detection and evaluation of thermal pathologies on photovoltaic (PV) surfaces and geometric defects in the mounting on photovoltaic power stations. RGB imagery is used for the generation of a georeferenced 3D point cloud through digital image preprocessing, photogrammetric and computer vision algorithms. The point cloud is complemented with temperature values measured by the thermographic sensor and with intensity values derived from the RGB data in order to obtain a multidimensional product (5D: 3D geometry plus temperature and intensity on the visible spectrum). A segmentation workflow based on the proper integration of several state-of-the-art geomatic and mathematic techniques is applied to the 5D product for the detection and sizing of thermal pathologies and geometric defects in the mounting in the PV panels. It consists of a three-step segmentation procedure, involving first the geometric information, then the radiometric (RGB) information, and last the thermal data. No configuration of parameters is required. Thus, the methodology presented contributes to the automation of the inspection of PV farms, through the maximization of the exploitation of the data acquired in the different spectra (visible and thermal infrared bands). Results of the proposed workflow were compared with a ground truth generated according to currently established protocols and complemented with a topographic survey. The proposed methodology was able to detect all pathologies established by the ground truth without adding any false positives. Discrepancies in the measurement of damaged surfaces regarding established ground truth, which can reach the 5% of total panel surface for the visual inspection by an expert operator, decrease with the proposed methodology under the 2%. The geometric evaluation of the facilities presents discrepancies regarding the ground truth lower than one degree for angular parameters (azimuth and tilt) and lower than 0.05 m2 for the area of each solar panel.

1. Introduction
PV cells work under the photoelectric effect: when a light photon with appropriate frequency affects the cell surface, the silicon atoms are excited and an electron is ripped off them. In these conditions, each cell is converted into an electric generator that, grouped with the other cells of the PV module, produces the voltage and power supply to the external circuit. A single PV cell will overheat when it is inversely polarized or its connector is damaged. The reason is that all the energy circulates through a small part of the cell causing a significant temperature increase. Thus, regardless of the cause of the damage in the cell, the damaged surface will suffer a local overheating effect. Thereby, heat transfer in solar energy conversion devices is one of the most important parameters to be studied for the determination of their state and their efficiency. In addition to other techniques mainly based on electrical properties [1,2], infrared thermography (IRT) has been proven as an adequate technique for the evaluation of solar energy installations [3]. The reason for the application of IRT is its capability to measure superficial temperature of objects from the radiation emitted in the thermal infrared band of the spectrum. Particularly, the detection of relative temperature differences allows de determination of thermal gradients and the detection of anomalous behaviors. Several thermographic techniques have been applied for the detection of pathologies and the evaluation of the productivity of the energy modules. These tests are mainly performed in laboratories, with limited sample size and mainly focused on the detection and precise characterization of pathologies at the level of PV cell with the aim at improving its design and performance [4,5,6]. In the cases where the thermographic studies were performed in-situ, two main aspects were analyzed. The first is the characterization and parameterization of the external factors that affect the absolute precision of the thermographic inspection for the performance of quantitative studies [7]. The second is the evaluation of energy facilities on small-scale communities [8].
Other pathologies that can reduce the productivity of the PV facilities are related to the geometric defects in the mounting. PV panel productivity depends directly on the incident solar radiation which is maximized when the solar rays strike orthogonally the photovoltaic surface. In this way, azimuth and tilt parameters of PV panels should be carefully defined according to the geographical location of the PV power station and validated after the construction process to confirm the fulfillment of the project guidelines.
The generation of 3D models from dense 3D point clouds is well-known in the scientific community [9,10,11,12]. These products present proven quality and applicability for the development of automatic segmentation and geolocation of elements of interest. The 3D models are generated through the segmentation and parameterization of the point clouds, using techniques that are usually based on initial pre-filtering strategies complemented with more sophisticated algorithms which take advantage of the geometric and radiometric information associated with each 3D point. Segmentation techniques can be focused on different strategies such as iterative search of basic primitives (planes, lines, etc.) [13,14,15,16,17]; evaluation of different sets of characteristics calculated from a point and its neighborhood [18,19,20]; or multiclass classification techniques based on supervised machine learning algorithms [21,22,23]. In this way, it is possible to locate different elements regardless the complexity of the scenario going from simple geometries such as roofs [24] or columns [25] to complex geometries such as trees [26,27], buildings [24,28,29] or vehicles [30].
The current procedure for monitoring PV stations is based on the thermographic inspection, panel-by-panel, performed in-situ by a human operator who tries to estimate the percentage of damaged panel that can affect its productivity. This procedure is not only slow and expensive but also dependent on the subjectivity and expertise of the operator. Some companies use unmanned aerial vehicles equipped with thermographic video cameras in a similar way as proposed in this studies [2,31,32], but the processing is performed manually through the visualization of the data recorded by a human operator. Thus, capture time is reduced but processing time and human subjectivity are still elements that affect the quality of the final product, although some researchers have tried to solve this subjectivity by using image processing algorithms [32]. An alternative to the use of thermographic cameras is the integration of RGB cameras in the UAV [33,34]; the main drawback of this option is that the type of defect detected depends on the flight conditions.
Both current established inspection protocols and more novel methodologies proposed by researchers are still affected by the subjectivity implicit in the inspection processes supervised by human operators. Although these novel methodologies present advances in data acquisition, they do not propose automatisms that allow speeding up the inspection processes. In addition, these novel methodologies do not provide a metric product that allows a geometric evaluation of the facilities in the inspection or construction processes. In order to improve the limitations of the methodologies remarked above, we developed a methodology able to segment automatically individual PV panels from a precise dataset obtained with a low-cost aerial platform equipped with RGB cameras. The segmented individual panels are evaluated through the complementary thermographic information. Particularly, this methodology provides advances in the robustness and efficiency of the classical inspection and validation procedures, which performed by a human operator. Results are obtained through unsupervised detection techniques adding semantics to the geometry contained in the point cloud. This semantic information is accurately geo-referenced reaching centimeter accuracy. Thus, the inspection procedure becomes accurate, faster and not affected by human subjectivity.
The proposed methodology consists of three complementary segmentation strategies: (i) a geometrically-based segmentation process is used to extract points belonging to PV panel clusters; (ii) an intensity-based segmentation [35,36,37] is used to segment each individual PV panel through the detection of points belonging to their frames; and (iii) a thermographic-based segmentation is used for the detection and location of pathologies through a qualitative approach based on relative temperature differences. Thus, the computation of the thermophysical properties of PV modules or their precise absolute temperature is not necessary and the accurate location of the pathologies is performed through a custom 5D metric product. In this case, images from the RGB cameras are processed with photogrammetric and computer vision algorithms [38,39] for their orientation and generation of a 3D dense point cloud of the PV panels.
The data processing methodology is scalable to any other high-density aerial data sources such as LiDAR (Light Detection And Ranging) [40]. The use of geo-referenced 3D dense point clouds will allow the performance of accurate analysis of areas, azimuths and tilts of the PV panels which are parameters strictly linked to the productivity of PV installations [41,42,43].
The paper has been structured as follows: after this introduction, Section 2 includes a detailed explanation of the materials and methods used for data acquisition and processing towards the automatic segmentation of PV panels and their classification according to the existence of geometric or thermal irregularities. Section 3 is devoted to analyzing the methodology through the results of its application to a PV power station selected as case study. Finally, Section 4 establishes the most relevant conclusions of the approach. The selected case study is a PV power station located in Gotarrendura (center of Spain) (coordinates 40°42′N, 4°44′W), which is nationally well-known as pioneer in the implementation of new energy models based on the exploitation of renewable energy sources and on self-sufficiency.
2. Materials and Methods
2.1. Equipment
The acquisition of RGB imagery (Figure 1a) was performed following the photogrammetric principles using an Olympus E-PM1 camera (Table 1) equipped with a 14–42 mm lens. This camera was selected because of its relationship among versatility, quality and weight (390 g).
The thermographic data acquisition (Figure 1b) was performed with a camera Gobi 384 equipped with a thermographic lens with 10 mm focal length, providing a field of view of 51° × 40°. This camera was selected due to its compromise between lightweight and thermal resolution. Its sensor is a 384 × 288 uncooled microbolometer array able to acquire with a frame rate up to 50 fps (frames per second).
Both imaging sensors are mounted on an unmanned aerial vehicle chosen with the requirements of high payload, low-cost and agility. The UAV used for the case study is an eight-propeller copter, a rotary-wing electric powered system specially designed for aerial photography. The copter has an onboard navigation system based on a GPS (Global Positioning System) receiver and an IMU (Inertial Measurement Unit). The system includes a gyrostabilized camera platform in which the sensors are mounted providing strength, anti-vibration and the possibility of making changes of orientation through digital servos. Thus, the camera can be kept in horizontal position, offsetting the motions of the equipment in flight.
2.2. Methodology
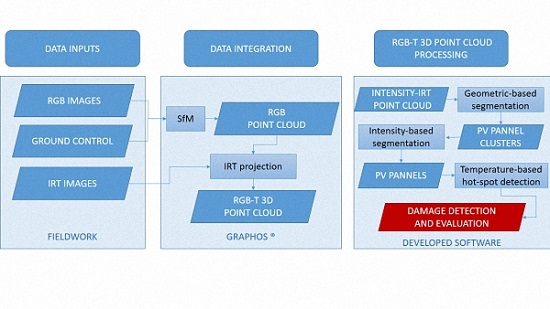
The methodology proposed in this work consists of a linear workflow starting on the survey design and going to the generation of the final product (Figure 2). Survey design guidelines are proposed to obtain an imaging dataset that guarantees the correct execution of the process. RGB images are introduced in a Structure from Motion (SfM) process to obtain an accurate 3D point cloud. Information from IRT images is projected to the 3D point cloud to complement the visible spectrum radiometry associated to each 3D point. The point cloud is introduced into a geometric-based segmentation able to isolate points belonging to PV panel clusters. Isolated PV panel points clusters are processed using machine learning algorithms to perform the segmentation of each PV panel. Finally, IRT radiometry is used through a statistical approach to locate and quantify damages in the photovoltaic PV surfaces. Thus, metric information from the 3D point cloud is complemented with qualitative information from the IRT analysis, providing geometrical assembly parameters (tilt and azimuth), Thus, the 3D point cloud allows the accurate geolocation of the panels complemented with both their actual state and the location and extension of pathologies if detected.
2.2.1. Design of Thermographic Survey
Several external parameters influence the thermographic measurements, such as atmospheric attenuation, non-uniform heating of the object by solar incidence and reflections produced by the radiation emitted by surrounding elements and reflected on the surface under study [7]. The existence of these influential factors requires the establishment of a protocol for data acquisition with the aim of minimizing these effects and acquiring valid products for their processing and analysis.
The first rule is the adjustment of the ambient parameters in the camera for the atmospheric correction; that is, distance camera-object, ambient temperature and humidity, prior to data acquisition. This fact is essential when increasing the flying height, due to the higher quantity of atmosphere between camera and object and the consequent higher need for its correction.
The second rule is the acquisition of thermographic images with an angle of incidence of 20–25° between the normal to the object surface under study and the optical axis of the camera. Thus, the measurement of the radiation reflected from the unmanned aerial platform and other surrounding surfaces is minimized.
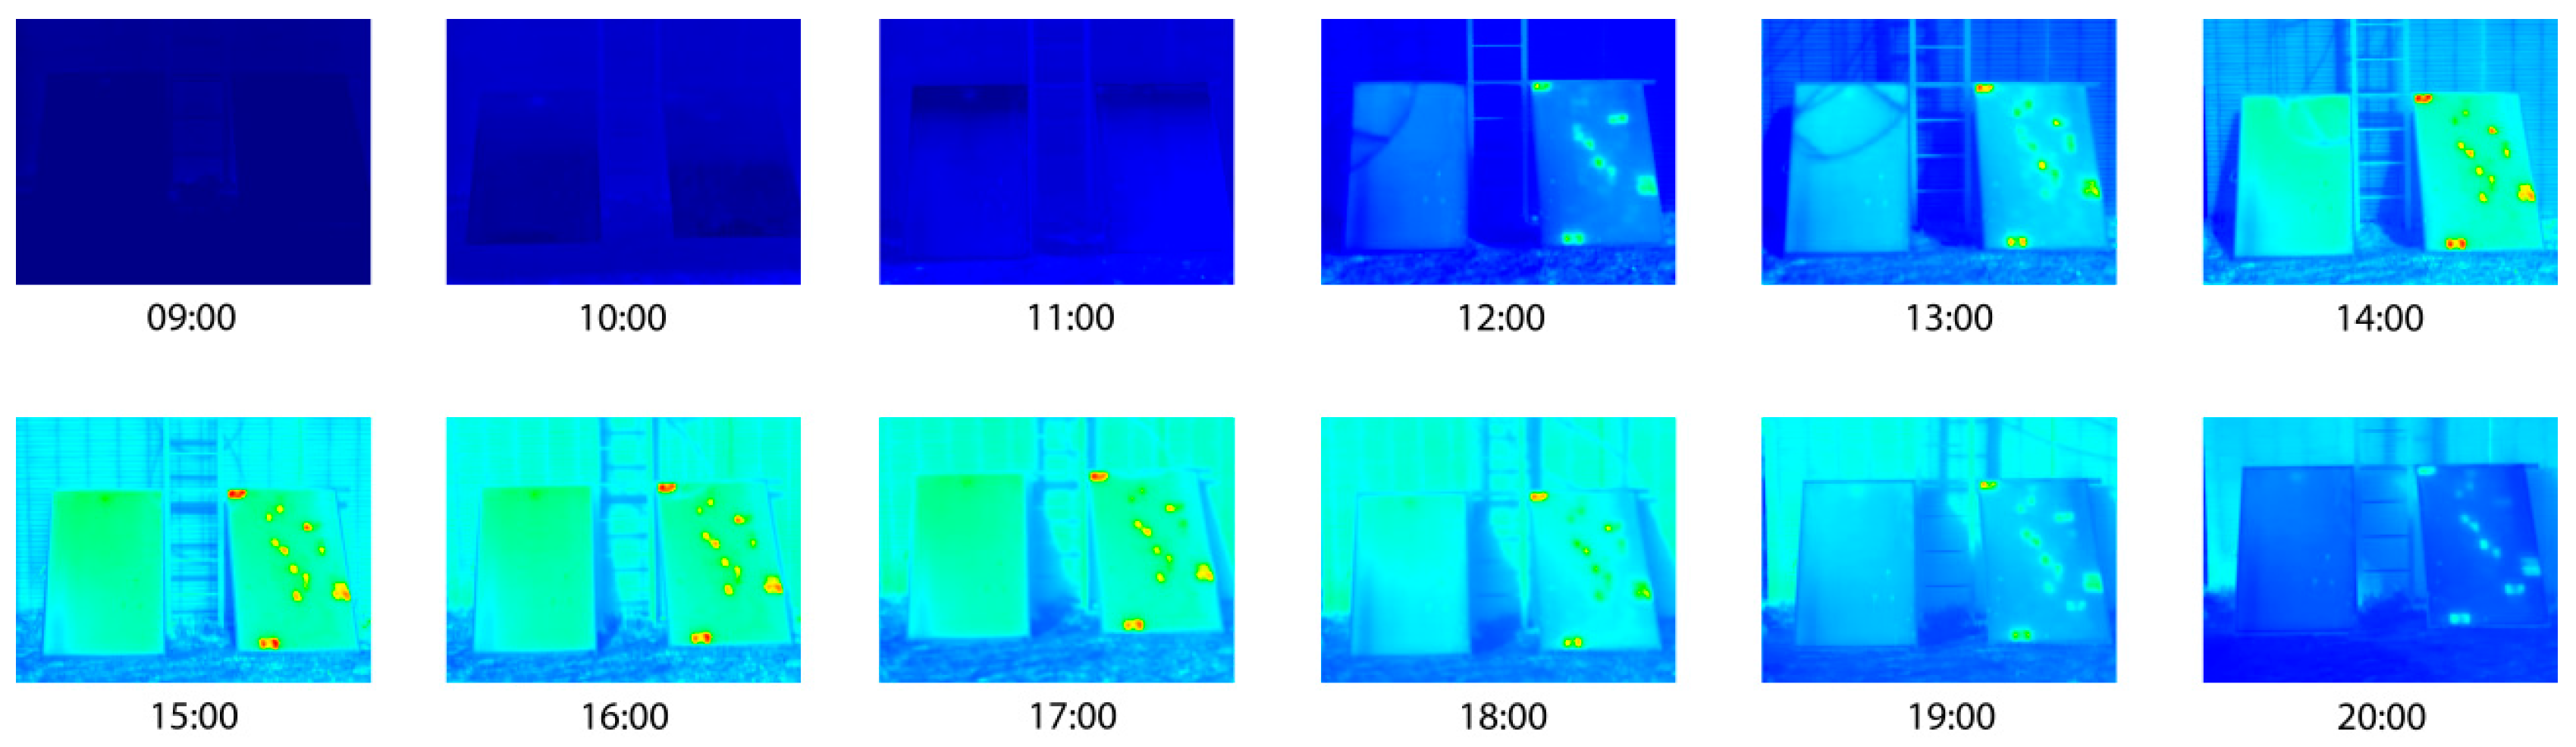
The third rule is the identification of the most suitable surveying conditions for the detection of the elements of interest (pathologies) and the minimization of false positives and false negatives. The survey should be performed in a period that ensures a high productivity level of the installation, preferably in the summer season. A thermographic monitoring test of the PV panels has been carried out to define these conditions. The test consisted of the thermographic monitoring of the panels with one-hour interval between sunrise and sunset. Each thermographic survey is composed by several thermograms from different points of view varying the distance between camera and object as well as the angle formed by the optical axis of the thermographic sensor and the surface under study. One set of results is shown in Figure 3 as example.
The monitoring results define the period between noon and an hour prior sunset as the valid time window for the detection of pathologies, considering that there is direct incidence of the Sun on the panels on the day of the inspection. Thus, the thermographic approach is “passive-active thermography”, with the Sun acting as excitation source but no artificial heating involved [44]. Days with high cloudiness, where solar energy radiation will be limited and thus the heat transfer in the pathologies will not be enough for automatic detection, should be discarded. The central time zone of the day between noon and sun zenith angle of 23.5° should be discarded since it corresponds to the peak productivity of the PV panels and thus there is a high probability of registering as pathologies the overheated areas produced by overheating of the electronic components. Thus, the survey is proposed and performed between sun zenith angle of 23.5° and an hour prior to sunset in order to minimize the registration of false pathologies. The angle of 23.5° defines the angle of Sun declination in which solar irradiance presents a key reduction; the position of the Sun at this angle establishes summer and winter solstices. The same value of 23.5° is applied in this paper to define the zenith angle where solar radiation is at its top, with independence of the time of the year. It varies in a time frame of 1 or 2 h, depending of the time of the year and the location of the study, and can be determined using libraries such as SPA (Solar Position Algorithm) [45].
In order to avoid missing pathologies, attention was given to acquire thermographic images from the totality of the surface of each PV panel.
2.2.2. Flight Planning and RGB-IRT Image Acquisition
Proper flight planning is important to ensure the acquisition of high quality images and minimize acquisition time. Due to the different characteristics and purpose of the imaging sensors, different flights have been planned for the RGB and the thermographic survey. The flight planning for RGB imagery was carried out based on the classical principles of aerial photogrammetry [46] adapted to the new algorithms and strategies of Structure from Motion (SfM) [47]. The adaptation consists mainly on increasing the overlap between images (short baselines) in order to guarantee good results in dense matching. The thermographic flight planning was carried out based on the design guidelines of the thermographic survey and the desired target resolution, in such way that information acquired covers the totality of the object under study.
Thus, the flight height is determined by the characteristics of each camera (pixel size and focal length) and the geometric resolution desired for the images (known as Ground Sample Distance (GSD)), as determined by Equation (1):
where (m) is the focal length of the sensor; (m) is the flight height over the ground; “pixelsize” (m) is the size of the pixel in the sensor; and (m) is the Ground Sample Distance.
2.2.3. 3D Point Cloud Reconstruction
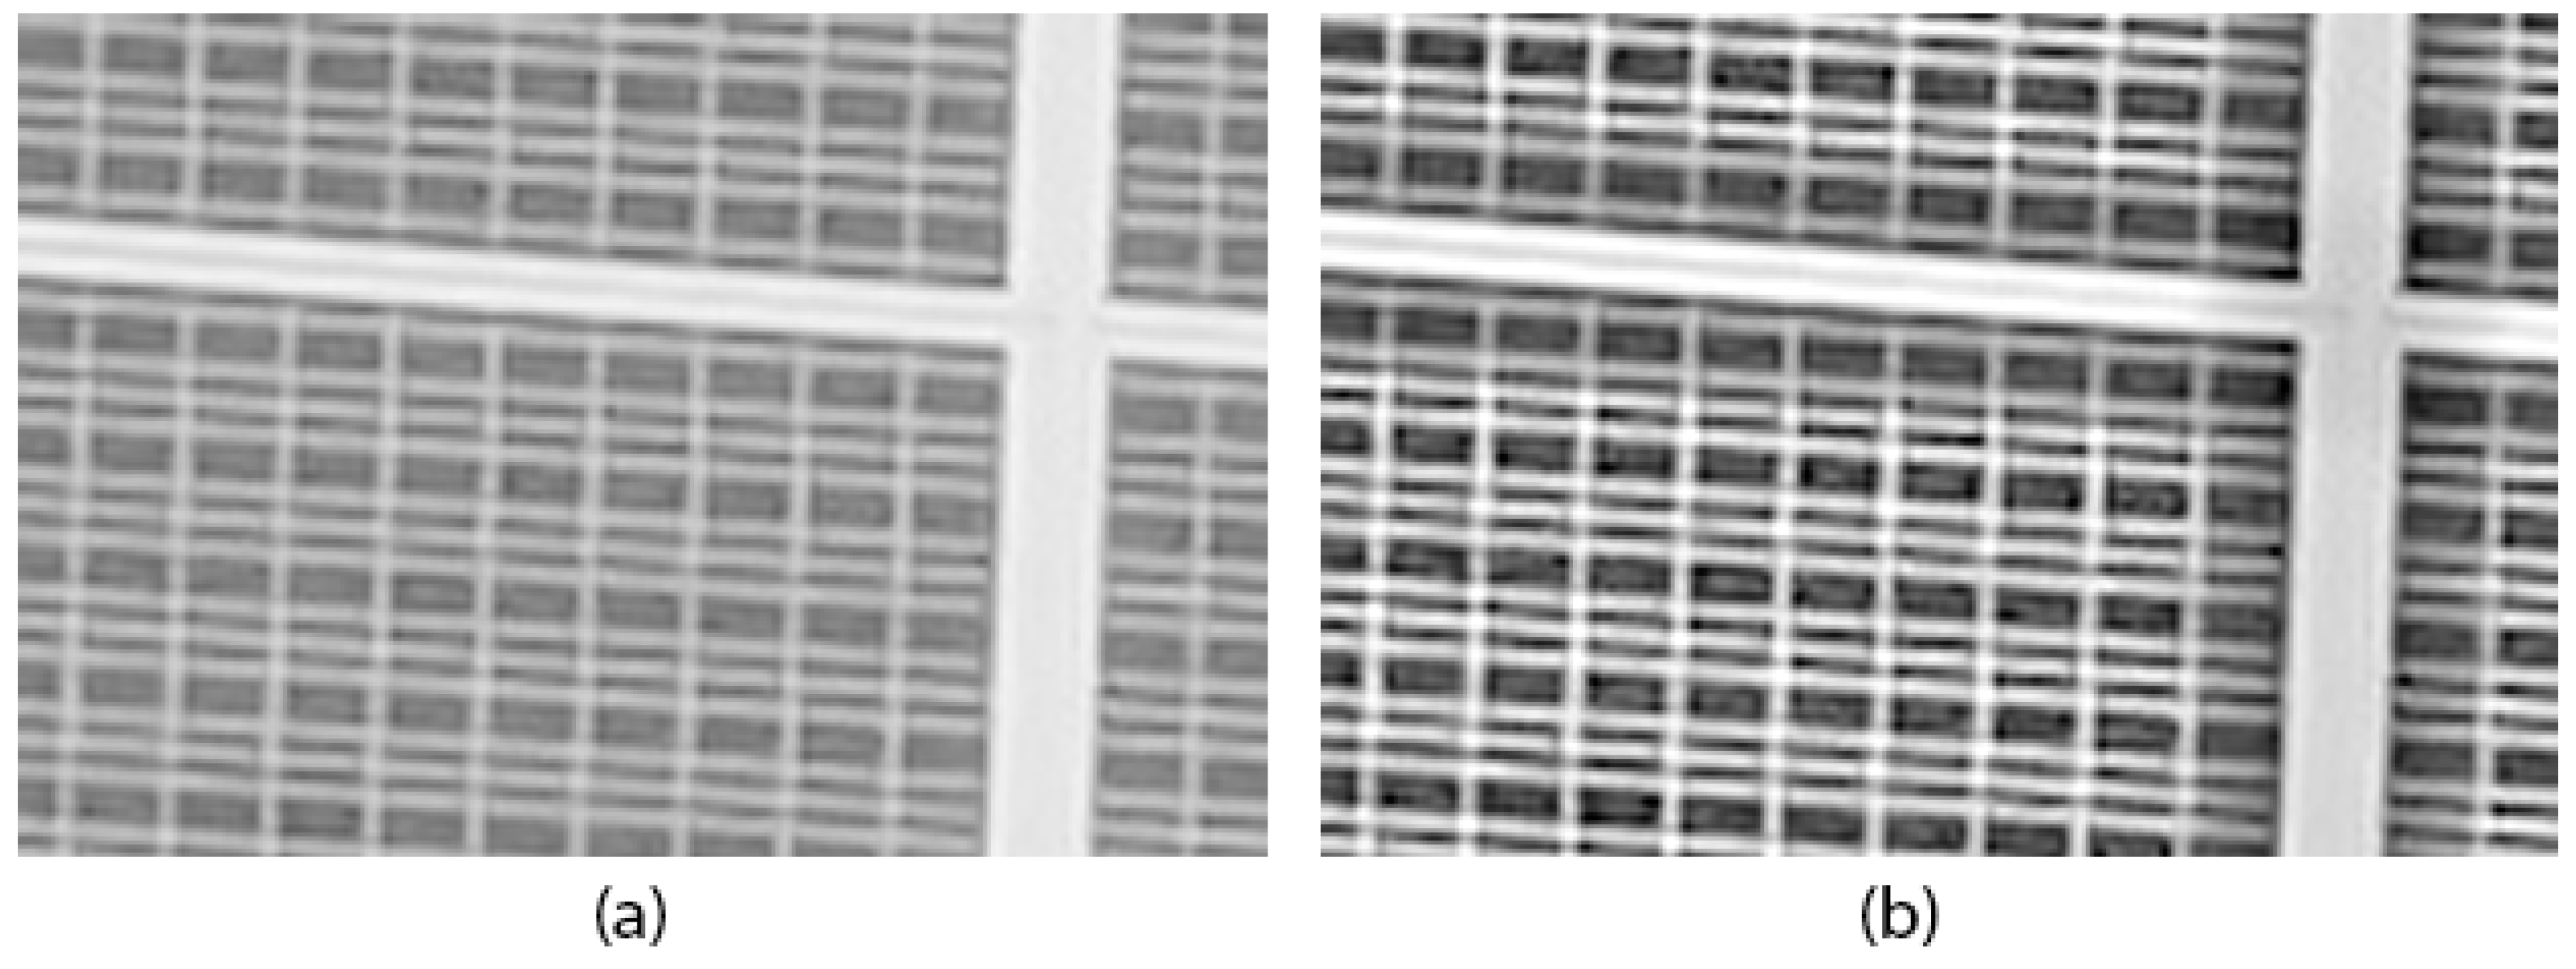
The generation of dense 3D point clouds is performed through an image-based modeling technique consisting of the combination of digital image processing, photogrammetry and computer vision [38,48]. The procedure is carried out for the RGB images, since their higher spatial resolution in comparison to the thermographic images allows for more accurate results. Due to the homogeneous and repetitive texture of the surfaces to be reconstructed (PV panels), digital image processing algorithms are necessary to increase the radiometric information and ensure a dense reconstruction, uniform over the entire surface. RGB images are processed using a contrast preserving decolorization algorithm [49] to convert the multi-channel imagery to gray-scale images. Then, a Wallis filter [50] is applied for the radiometric equalization of the images. It performs a locally-adaptive (spatially-varying) contrast enhancement on a grey-scale raster data, as opposed to a global contrast filter, which applies the same level of contrast to the entire image. The resulting image contains greater detail in both low and high-level contrast regions, ensuring local enhancement (Figure 4). The suitability of both algorithms for this purpose is justified in several studies [51,52,53].
Once images are radiometrically optimized, the photogrammetric process consists of the following steps: local feature detection and matching to detect homologous tie points between images, relative image orientation to know the position of the camera in each acquisition, absolute image orientation to translate the camera positions to the global coordinate system and dense matching for the computation of the 3D coordinates of each image pixel. Further detail can be found in [38], as well as a description of GRAPHOS® software, an Open Source Photogrammetric Suite developed by the authors and used for this work.
With these steps, a dense 3D point cloud with radiometric information on the visible spectrum was obtained for the case study. This radiometric information is converted to its intensity value, represented as a digital level by the sum of the RGB channels normalized to 8 bits. The thermographic mapping of the 3D point cloud was solved through the interactive identification of homologous entities between each thermographic image and the 3D point cloud. The result obtained is a 5D point cloud (X, Y, Z, T, RGB-I) where each point (X, Y, Z) has a temperature (T) and an intensity (I) value associated. Each radiometric value is represented by the RGB conversion to a predefined color map according to intensity and temperature values, respectively (Figure 5).
2.2.4. Geometric-Based Segmentation of PV Panel Clusters
Once the 3D point cloud is generated from the RGB images and the thermographic texture is applied, the next procedure is the segmentation of the point cloud for the identification of individual PV panels. This is performed in several steps. First, a Voxel-Grid subsampling algorithm implemented by PCL (Point Cloud Library) [54] was used to down-sample and homogenize the density of the 3D point cloud, allowing the accurate evaluation of the spatial distribution of the points. This step allows a considerable acceleration of the processing due to the significant reduction of data volume, and implies the creation of a “Voxel grid” (a set of tiny 3D boxes in space) over the input cloud data. Then, in each voxel (i.e., 3D box) all the points will be approximated (i.e., downsampled) by their centroid. This approach is slightly slower than their approximation to the center of the voxel, but entails a more accurate representation of the underlying surface. The result is a point cloud with homogeneous density in which the approximate quantification of areas is possible by counting points.
A progressive morphological filter is used to remove ground points by gradually increasing the evaluation window size and using elevation difference thresholds (more details about the filter can be found in [55]). An initial filtered surface is derived by applying an opening operation with a default window size to the raw point cloud. This operation is common in computer vision for object detection and background removal, and is based on a combination of dilation and erosion operations. An opening operation is then performed on the resulting surface to derive a second surface. The elevation difference of a cell between surfaces is compared to a threshold to determine if the point in this cell is a non-ground point. In the next iteration, the window size is increased, and another opening operation is applied to the filtered surface. These steps are repeated until the size of the filtering window is larger than the pre-defined largest size of non-ground objects (maximum dimension of PV panel clusters). The threshold is determined by the elevation difference and terrain slope [56].
Non-ground point clouds including the PV panels are segmented using Euclidean cluster segmentation. It consists of the evaluation of each cluster using Principal Component Analysis (PCA) to find the best-fit plane of the panel cluster based on the evaluation of the covariance matrix. This procedure is chosen because the values of the covariance matrix contain information that is suitable for the geometric characterization of each cluster of PV panels. Specifically, the eigenvector corresponding to the smallest eigenvalue contains information about the normal vector of the fitting plane, from which azimuth and tilt values can be computed as shown in [57]. The other two eigenvalues, and their corresponding eigenvectors, contain information about the direction of the principal dimensions of the cluster. Geometric outlier points are removed through the evaluation of the point-to-plane Euclidean distance.
2.2.5. Intensity-Based Segmentation of PV Panels
This step is based on the fact that PV modules are composed by two elements which are clearly distinguishable: (1) the frame that supports the panel, which is constituted by metallic profiles usually made from anodized aluminum; and (2) the PV surfaces, which are constituted by the encapsulation of diverse material layers, generally from glass, ethylene-vinyl acetate, polyvinylidene fluoride and the PV elements. Given the high contrast in the reflectance and absorbance properties between the metallic panel frames and the surface of the PV cells, the intensity attribute on the visible spectrum is used for the classification of frame/non-frame points. Assuming that the intensity distribution of reflective and non-reflective points follows a normal distribution, they can be fitted to a Gaussian Mixture Model (GMM) with two components [58]. Thus, the first component is assigned to a Gaussian distribution centered on a high intensity value (high-reflective points), while the second component is associated to the Gaussian distribution centered on a low intensity value, for non-reflective points. Thus, each point is assigned to one or the other component, as a function of their largest posterior probability.
Once high-reflective points are segmented, the detection of the points strictly belonging to the aluminum frames is performed. This step is necessary to filter out reflective points from the mounting or other surrounding elements. An iterative RANSAC (Random Sample Consensus) algorithm [59] is applied to detect lines parallel to the eigenvectors and that define the direction in each cluster of the principal dimensions of the panel as shown in Figure 6. Line directionality is complemented with geometric constraints to evaluate the continuity and length of the lines extracted. The intersections of the lines extracted projected over a horizontal reference plane are used to create a segmentation grid, used for the isolation of each PV panel of a cluster in an individual point cloud. The dimensions of each PV panel are calculated through the computation of the minimum bounding box of points belonging to each isolated PV panel. This approach is also based on the previous results of the PCA analysis. Eigenvectors complemented with the centroid of each PV panel define a local reference coordinate system per PV panel where the minimum volume bounding box can be computed. Thus, the methodology is robust to the existence of PV panels with different dimensions in the study area.
2.2.6. Temperature-Based Detection of Thermal Pathologies
Once each PV panel is clustered, the surface affected by significant pathologies is computed individually. In this case, the data used for segmentation are the temperature values acquired with the thermographic camera.
In this case, the median temperature of all the PV panels in a grid is computed as reference value. The median (M) is a measure of central tendency but offers the advantage of being very insensitive to the presence of outliers; thus, it was chosen as robust estimator of the central tendency of the temperatures of the PV panels, corresponding to non-damaged PV panel surface. This parameter is computed for all the panels in a grid with the aim of avoiding the use of an anomalous temperature from a defect as reference. Specifically, thermographic outliers are segmented using the Median Absolute Deviation (MAD) (Equation (2)), which is totally immune to the sample size.
where is a single sample, is the median of the absolute deviation from the median of the series, is the median of the n original samples and , a constant linked to the assumption of normality of the data.
In addition, the rejection criterion of a value must be defined. As for the mean and standard deviation, it is necessary to define a level of decision, a. Miller, J. [60] proposes the following values for the level of decision: 3 (very conservative), 2.5 (moderately conservative) or 2 (poorly conservative). Points are considered as non-damaged inliers if the condition defined by equation (Equation (3)) is satisfied.
where, in this case study, x is the evaluated temperature value, M is the median of the temperature values and a is the level of decision selected as rejection criterion.
Assuming that the surface of a PV panel is a perfect plane, each cluster of 4D points (geometry plus temperature) segmented as pathology is projected to a plane adjusted by least squares to enable the precise quantification of the surface affected and minimize deviations produced by the “noise” of this type of 3D products. Pathology points inside each PV panel are clustered as individual pathologies using the method based on the Euclidean distance between points explained in Section 2.2.4. The extraction of the points that describe the perimeter of each pathology cluster is performed through the computation of their concave hull using an implementation of the “alpha shape” computational geometry approach based on the Delaunay triangulation [61]. This perimeter is used to compute the area of the affected surface, obtaining the ratio of damaged surface per panel as the sum of the damaged areas divided by the total area of the panel.
3. Experimental Results
3.1. Study Case
The proposed methodology has been selected due to the knowledge of the existence of damaged PV panels, adequate for testing the methodology. The PV installations consist of 21 fixed PV panel clusters distributed in 8 equidistant lines. Each line is composed by 30 PV panels of the same type with dimensions of 1.5 m × 0.8 m. Temporal security regulations limited the inspection to the first 6 lines from south to north. The result was an aerial survey of 16 PV clusters with an extension of 4000 m2 in a rectangular shape of 50 m × 80 m.
Regarding the RGB Flight planning (Figure 7a), time between shots was established as 2 s for an approximated flight speed of 10 km/h, ensuring image acquisition with minimum forward and side overlaps of 70% and 30%, respectively. The focal length of the RGB sensor was fixed to 14 mm and the flight altitude over the ground was 40 m, resulting on a GSD of 1 cm. As a result, 43 RGB images were acquired covering the whole study area.
The full resolution RGB images were processed according to the photogrammetric and computer vision methodologies. RGB radiometry of each point was converted to its intensity value on the visible spectrum. The point cloud generated was preprocessed with the voxel grid algorithm to homogenize point density, obtaining as result a point cloud of 39,194,155 points, implying an approximated average resolution of 10,000 points/m2 (≈1 point/GSD2).
In order to georeference the scene and perform the quality assessment of the survey, a topographic GNSS (Global Navigation Satellite System) survey was performed, consisting of nine GCP homogeneously distributed over the study area (Figure 7b). Because the absolute positioning accuracy of the scene should not be strict for this type of work, GCP were measured using RTK (Real Time Kinematics) positioning, ensuring that on-flight positioning precision provided by the equipment was better than 2 cm. Five of these GCP (points 1, 3, 5, 7 and 9) were used for the absolute georeferencing of the scene (Table 2) obtaining a final deviation of 0.012 m. The remaining points (points 2, 4, 6 and 8) were used as check points to perform the geometric quality assessment of the final product (Table 3) obtaining a final deviation of 0.033 m.
In the case of the IRT flight planning, time between shots and flight speed should be carefully correlated to ensure a high redundancy in the information to allow the supervised selection to discard blurred or radiometrically inconsistent imagery. Experience derived from previous surveys allows establishing an approximated flight speed of 10 Km/h as an appropriate parameter for the sensor used. Flight planning was designed through the definition of way points at the beginning and end of each line of PV panel clusters, guaranteeing that the vehicle overhangs the panels in the vertical of the terrain. Thermographic redundancy is guaranteed due to the high frame rate of the sensor, established in 50 fps. Flight altitude selected was 10 m over the ground, resulting on a GSD of 2.5 cm. In this case, 116 thermographic images were acquired and supervised by a human operator to select a total amount of 80 for the study of the study area. The thermographic texture was projected over the point cloud obtaining a hybrid RGB-I 3D point cloud with thermographic texture mapped over the points of the PV panels.
The 5D point cloud with intensity and thermographic texture is the input of the algorithm developed. In the first step, ground points are removed using the progressive morphological filter, obtaining as result a point cloud of the PV panels with 2,524,058 points. In this first filtering process, only geometry (X, Y, Z) is required.
The point cloud of the PV panels without ground points is introduced into the geometric segmentation process resulting in the extraction of 16 PV panel clusters (Figure 8a) that have been automatically evaluated and classified regarding their geometric properties (azimuth and tilt) (Table 4) without finding any construction defect limiting the productivity of the installation. These clusters are processed with the intensity-based segmentation process, resulting in the segmentation of 480 PV panels (Figure 8b).
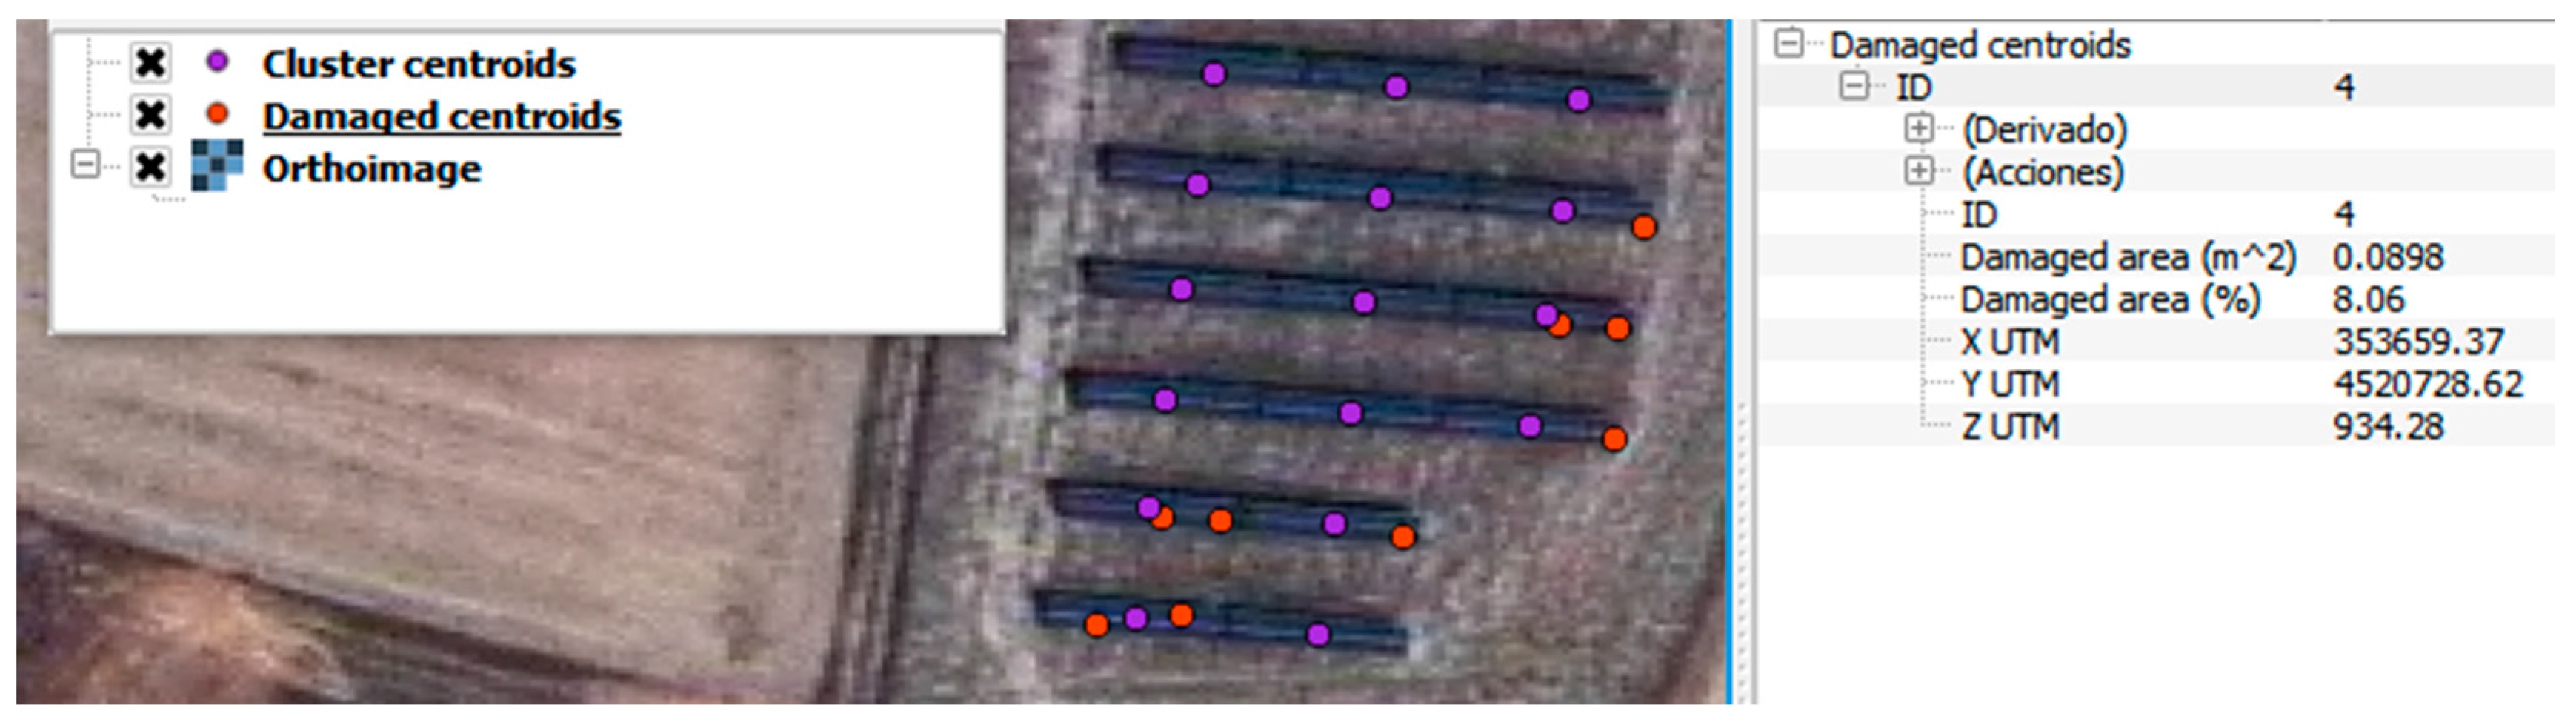
Each individual PV panel is evaluated through temperature radiometry and classified regarding the existence of pathologies or damaged areas, quantifying the percentage of area affected (Figure 9). In total, nine damaged PV panels were detected (Table 5).
The results are stored using both simple ASCII files and GIS Shapefiles, allowing the simple integration of the information derived from the proposed methodology with external data sources (Figure 10).
3.2. Accuracy Assessment
In order to perform an accuracy assessment of the proposed methodology, fieldwork has been carried out to acquire validation information that can be established as ground truth. Regarding the PV panel segmentation, the validation has consisted in a supervised monitoring of the segmentation results. This process determines the high robustness of the segmentation process, with no lack or excess of segmentation: only the existing PV panels were segmented, with no appearance of new panels resulting from over-segmentation. The ground truth for the thermal pathologies was defined through a visual inspection. The whole case study was evaluated from the ground by an expert human operator aided with a thermographic camera. The human operator took note of all detected thermal pathologies, referencing the damaged PV panels through a predefined reference system based on their position within the facilities (line, cluster and number of panel). The proposed methodology was also able to detect all pathologies detected by the human operator in the field survey, without creating new (non-existent) ones. Regarding damaged areas of each PV panel, these were also measured by an expert operator following two different methodologies. The first, through a visual estimation of the damaged area (in percentage). This subjective approach is the usual methodology according to the established inspection protocols. The second, designed to obtain a ground truth less affected by the subjectivity of the operator and which will be used for comparison with the proposed methodology, was generated by measuring the damaged surfaces using a flexometer. Given the arbitrariness in the shape of pathologies, the areas of the thermal pathologies were calculated from their approximation to basic primitives such as rectangles (height and width measurements) and circumferences (diameter measurements), which are assumed to result in over-sized area values. The comparison between the results and the ground truth obtained (Table 6) manifests the effects of the subjectivity on the visual inspection, showing the tendency of the inspector to quantify the damaged surface by counting only the number of cells fully affected by overheating. This results in an under-sizing of the actual damaged surface because the productivity reduction by the overheating of adjacent cells is not taken into account. The comparison of the results of the proposed methodology with the ground truth established from the direct measurement of damage dimensions (with the flexometer) shows the accuracy of the proposed workflow with discrepancies lower than 2% of the panel area (1.22 m2), corresponding to discrepancies smaller than 0.02 m2 for the 480 solar panels evaluated.
Finally, regarding the geometric evaluation of the facilities, the accuracy of the azimuth and tilt of the PV clusters was tested through the comparison of the parameters extracted with the proposed methodology and the values defined as ground truth by the topographic survey (Table 7). In particular, the topographic survey was supported by the GCP and using a reflectorless total station, Trimble VX, whose precision for 3D point surveying without prism is 10 mm. Solar panels azimuth and tilt ground truth values were acquired making multiple angular and distance measurements in order to guarantee more precision and reliability. Discrepancies were lower than one degree for angular parameters, being these results completely acceptable due to the precisions established for the measurement of the GCPs used both for the absolute orientation of the point cloud and for the establishment of the reference system in the topographic survey.
3.3. Computing Efficiency Analysis
The machine used to perform the computation was a Microsoft Windows 8.1 workstation with 32 GB RAM, a 3.40 GHz Intel Core i5-3570K processor and an Nvidia Quadro 2000 GPU. The dense point cloud generation was the most computationally demanding process investing a total of 17 min and 45 s for the whole data set.
Regarding the algorithm developed for the automatic classification of segmented PV panels, the execution time performed through a single thread algorithm was 2 min and 23 s for the whole study area. However, multithreading computation has been implemented, reducing computation time proportionally to the number of concurrent running threads.
4. Discussion
The advantages of using the proposed methodology for the evaluation of the state of PV panels from PV power stations include both efficiency and robustness against traditional thermographic inspection methods.
Whilst, in this study, the required data were acquired with an UAV, the proposed methodology is valid for processing datasets captured with different airborne sensors such as LiDAR or any other RGB and thermographic sensors transported by any manned or unmanned aerial vehicle that guarantees the required resolution and precision.
The quality of the product obtained with the proposed methodology relies on the factors mentioned below. The main problem is the complexity of the automation in the detection of pathologies minimizing the appearance of false positives, mainly due to the high number of factors to consider in the thermal imaging interpretation, such as environmental conditions, solar reflections, surface state of the element under study and emissivity. This problem can be solved through the election of an appropriate survey time window and the follow-up of the guidelines specified in Section 2.2.1 at the time of the thermographic acquisition. Geolocation accuracy is dependent on the quality of the ground control points used, in such way that the use of equipment and survey processes is necessary to guarantee the precision of the project.
The proposed methodology was able to detect 100% of the pathologies established in the ground truth, justifying the accuracy of the methodology for maintenance tasks. However, it is necessary to highlight that the use of the median as an estimator of the reference temperature value for non-damaged surfaces would not be a valid definition if the damages in a panel cluster cover more than one half of the surface. If this condition is fulfilled, the proposed methodology for the detection of thermal anomalies on the photovoltaic surface would set the temperature of damaged surfaces as the reference temperature value and therefore the entire surface would be classified as undamaged. However, if this happened, the safety systems of the PV power station would generate warnings produced both by the existence of very high temperatures and by the low productivity of the system. Therefore, this is not a typical maintenance task and the proposed methodology is designed to avoid this situation, allowing the detection and resolution of incidences at an earlier stage.
Maximum discrepancies in the measurement of damaged surfaces descend from 5% for visual inspection to 2% using the proposed methodology. The geometric evaluation of the facilities presents discrepancies regarding the ground truth lower to one degree for angular parameters (azimuth and tilt). Although these accuracy improvements in the measurement of damaged areas cannot be considered as a decisive criterion for the replacement of current evaluation protocols for the proposed methodology, improvements in processing time and the metric qualities of the product are decisive to make more efficient inspection processes, especially in large PV power stations. Regarding land-based inspection methods, where the facilities are traversed by a human operator equipped with a thermographic camera and a GPS tracking system, our inspection method drastically reduces survey time reaching the day productivity of a human operator in just a few minutes of flight. In those cases where aerial vehicles are already used for the thermographic survey, the proposed unsupervised algorithm removes the tedious and manual process of thermographic interpretation and evaluation by a human operator, removing human errors and reporting metric and objective information from the evaluated facilities. In all cases, geolocation is highly improved reaching centimeter accuracy in the geolocation of pathologies. Thus, the inspection procedure becomes accurate, faster and not affected by human subjectivity.
Trying to compare the proposed methodology against other similar techniques, no similar strategies for the evaluation of large-scale PV power stations were found.
5. Conclusions
This paper presents a methodology for the automatic processing of 5D point clouds with geometric, intensity and thermographic information for the evaluation of the state of PV power stations through a completely automatic process, which allows the detection and evaluation of pathologies on the facilities. A combined geometric, radiometric (RGB intensity-based) and statistical process allows the identification of individual PV panels and the evaluation of construction inaccuracies, which could considerably limit the productivity of the facility by not taking full advantage of available solar resources. Individual clustered PV panels are evaluated again through a combined geometric, radiometric (temperature-based) and statistical approach, to detect and quantify surfaces affected by pathologies that can drastically reduce the production capacity of the element. The resulting hybrid product provides a complete and georeferenced, thermographic and metric information of the elements in the PV power station. This information enables faster and better detection of pathologies, their spatial location and interpretation of the real state of the facilities. The high-level of automation of the procedure allows the evaluation of wide PV power stations in a fast and accurate way, establishing as only limitations the capacity of payload and autonomy of the aerial platform as well as the operational capacities of the computer equipment where the process is executed.
This project opens new trends for future work both from a sensorial and methodological point of view. Concerning the first, the accurate registration of the thermographic sensor regarding the aerial platform, through the accurate relative orientation and timestamp synchronization between imaging sensors and navigation system, would allow the automatic registration between thermographic images and 3D point clouds. Robust integration of high density LiDAR sensors on UAV platforms is still a developing field. The use of these sensors will not only reduce processing time in the photogrammetric generation of 3D point clouds avoiding the difficulties related to the reconstruction of texture-less surfaces but will also provide a new radiometric value to integrate in the process, as the intensity of the returned signal is usually at near infrared wavelengths.
From a methodological point of view, regarding the possibility to take advantage of the large amount of information derived from this methodology, it would be interesting to advance in the definition of an universal data structure allowing to work with lighter and more agile information that we can include as an additional layer on a GIS (Geographic Information System) enabling the integration of this information with other data sources (cadastral information, demographic information, urban parameters, etc.) to perform energy demand studies allowing the proper dimensioning of the installations.
Acknowledgments
Authors would like to thank the Ministry of Economy and Competitiveness, Government of Spain, for the financial support given through human resources grants (IJCI-2015-24492).
Author Contributions
All authors conceived and designed the study. L.L.F. implemented the methodology. All authors discussed the basic structure of the manuscript. L.L.F. wrote the document. All authors read and approved the final manuscript.
Conflicts of Interest
The authors declare no conflict of interest.
References
- Ghanbari, T.; Hoseini, S.R.K. KF-based technique for detection of anomalous condition of the PV panels. IET Gener. Transm. Distrib. 2016, 10, 3698–3706. [Google Scholar] [CrossRef]
- Hachana, O.; Tina, G.M.; Hemsas, K.E. PV array fault DiagnosticTechnique for BIPV systems. Energy Build. 2016, 126, 263–274. [Google Scholar] [CrossRef]
- Buerhop, C.; Pickel, T.; Dalsass, M.; Scheuerpflug, H.; Camus, C.; Brabec, C.J. aIR-PV-check: A quality inspection of PV-power plants without operation interruption. In Proceedings of the IEEE 43rd Photovoltaic Specialists Conference (PVSC), Portland, OR, USA, 5–10 June 2016; pp. 1677–1681. [Google Scholar]
- Breitenstein, O. Nondestructive local analysis of current–voltage characteristics of solar cells by lock-in thermography. Sol. Energy Mater. Sol. Cells 2011, 95, 2933–2936. [Google Scholar] [CrossRef]
- Tsai, D.-M.; Wu, S.-C.; Li, W.-C. Defect detection of solar cells in electroluminescence images using Fourier image reconstruction. Sol. Energy Mater. Sol. Cells 2012, 99, 250–262. [Google Scholar] [CrossRef]
- Isenberg, J.; Warta, W. Spatially resolved evaluation of power losses in industrial solar cells by illuminated lock-in thermography. Prog. Photovolt. Res. Appl. 2004, 12, 339–353. [Google Scholar] [CrossRef]
- Krenzinger, A.; de Andrade, A.C. Accurate outdoor glass thermographic thermometry applied to solar energy devices. Sol. Energy 2007, 81, 1025–1034. [Google Scholar] [CrossRef]
- Bazilian, M.D.; Kamalanathan, H.; Prasad, D.K. Thermographic analysis of a building integrated photovoltaic system. Renew. Energy 2002, 26, 449–461. [Google Scholar] [CrossRef]
- Herrero-Huerta, M.; Felipe-García, B.; Belmar-Lizarán, S.; Hernández-López, D.; Rodríguez-Gonzálvez, P.; González-Aguilera, D. Dense Canopy Height Model from a low-cost photogrammetric platform and LiDAR data. Trees 2016, 30, 1287–1301. [Google Scholar] [CrossRef]
- Fernández-Hernandez, J.; González-Aguilera, D.; Rodríguez-Gonzálvez, P.; Mancera-Taboada, J. Image-Based Modelling from Unmanned Aerial Vehicle (UAV) Photogrammetry: An Effective, Low-Cost Tool for Archaeological Applications. Archaeometry 2015, 57, 128–145. [Google Scholar] [CrossRef]
- Chen, B.; Shi, S.; Gong, W.; Zhang, Q.; Yang, J.; Du, L.; Sun, J.; Zhang, Z.; Song, S. Multispectral LiDAR Point Cloud Classification: A Two-Step Approach. Remote Sens. 2017, 9, 373. [Google Scholar] [CrossRef]
- Nevalainen, O.; Honkavaara, E.; Tuominen, S.; Viljanen, N.; Hakala, T.; Yu, X.; Hyyppä, J.; Saari, H.; Pölönen, I.; Imai, N.N.; et al. Individual Tree Detection and Classification with UAV-Based Photogrammetric Point Clouds and Hyperspectral Imaging. Remote Sens. 2017, 9, 185. [Google Scholar] [CrossRef]
- Li, L.; Yang, F.; Zhu, H.; Li, D.; Li, Y.; Tang, L. An Improved RANSAC for 3D Point Cloud Plane Segmentation Based on Normal Distribution Transformation Cells. Remote Sens. 2017, 9, 433. [Google Scholar] [CrossRef]
- Xu, B.; Jiang, W.; Shan, J.; Zhang, J.; Li, L. Investigation on the Weighted RANSAC Approaches for Building Roof Plane Segmentation from LiDAR Point Clouds. Remote Sens. 2016, 8, 5. [Google Scholar] [CrossRef]
- Wu, T.; Hu, X.; Ye, L. Fast and Accurate Plane Segmentation of Airborne LiDAR Point Cloud Using Cross-Line Elements. Remote Sens. 2016, 8, 383. [Google Scholar] [CrossRef]
- Arastounia, M.; Lichti, D.D. Automatic Object Extraction from Electrical Substation Point Clouds. Remote Sens. 2015, 7, 15605–15629. [Google Scholar] [CrossRef]
- Rodríguez-Cuenca, B.; García-Cortés, S.; Ordóñez, C.; Alonso, M.C. Automatic Detection and Classification of Pole-Like Objects in Urban Point Cloud Data Using an Anomaly Detection Algorithm. Remote Sens. 2015, 7, 12680–12703. [Google Scholar] [CrossRef]
- Li, Y.; Li, L.; Li, D.; Yang, F.; Liu, Y. A Density-Based Clustering Method for Urban Scene Mobile Laser Scanning Data Segmentation. Remote Sens. 2017, 9, 331. [Google Scholar] [CrossRef]
- Yang, H.; Chen, W.; Qian, T.; Shen, D.; Wang, J. The Extraction of Vegetation Points from LiDAR Using 3D Fractal Dimension Analyses. Remote Sens. 2015, 7, 10815–10831. [Google Scholar] [CrossRef]
- Aijazi, A.K.; Checchin, P.; Trassoudaine, L. Segmentation Based Classification of 3D Urban Point Clouds: A Super-Voxel Based Approach with Evaluation. Remote Sens. 2013, 5, 1624–1650. [Google Scholar] [CrossRef]
- Zhang, J.; Lin, X.; Ning, X. SVM-Based Classification of Segmented Airborne LiDAR Point Clouds in Urban Areas. Remote Sens. 2013, 5, 3749–3775. [Google Scholar] [CrossRef]
- Corcoran, J.; Knight, J.; Pelletier, K.; Rampi, L.; Wang, Y. The Effects of Point or Polygon Based Training Data on RandomForest Classification Accuracy of Wetlands. Remote Sens. 2015, 7, 4002–4025. [Google Scholar] [CrossRef]
- Ni, H.; Lin, X.; Zhang, J. Classification of ALS Point Cloud with Improved Point Cloud Segmentation and Random Forests. Remote Sens. 2017, 9, 288. [Google Scholar] [CrossRef]
- Awrangjeb, M.; Fraser, C.S. Automatic Segmentation of Raw LiDAR Data for Extraction of Building Roofs. Remote Sens. 2014, 6, 3716–3751. [Google Scholar] [CrossRef]
- Díaz-Vilariño, L.; Conde, B.; Lagüela, S.; Lorenzo, H. Automatic Detection and Segmentation of Columns in As-Built Buildings from Point Clouds. Remote Sens. 2015, 7, 15651–15667. [Google Scholar] [CrossRef]
- Zhang, C.; Zhou, Y.; Qiu, F. Individual Tree Segmentation from LiDAR Point Clouds for Urban Forest Inventory. Remote Sens. 2015, 7, 7892–7913. [Google Scholar] [CrossRef]
- Weinmann, M.; Weinmann, M.; Mallet, C.; Brédif, M. A Classification-Segmentation Framework for the Detection of Individual Trees in Dense MMS Point Cloud Data Acquired in Urban Areas. Remote Sens. 2017, 9, 277. [Google Scholar] [CrossRef]
- Yang, B.; Huang, R.; Li, J.; Tian, M.; Dai, W.; Zhong, R. Automated Reconstruction of Building LoDs from Airborne LiDAR Point Clouds Using an Improved Morphological Scale Space. Remote Sens. 2017, 9, 14. [Google Scholar] [CrossRef]
- Gilani, S.A.N.; Awrangjeb, M.; Lu, G. An Automatic Building Extraction and Regularisation Technique Using LiDAR Point Cloud Data and Orthoimage. Remote Sens. 2016, 8, 258. [Google Scholar] [CrossRef]
- Zhang, J.; Duan, M.; Yan, Q.; Lin, X. Automatic Vehicle Extraction from Airborne LiDAR Data Using an Object-Based Point Cloud Analysis Method. Remote Sens. 2014, 6, 8405–8423. [Google Scholar] [CrossRef]
- Sharma, V.; Chandel, S.S. A novel study for determining early life degradation of multi-crystalline-silicon photovoltaic modules observed in western Himalayan Indian climatic conditions. Sol. Energy 2016, 134, 32–44. [Google Scholar] [CrossRef]
- Aghaei, M.; Gandelli, A.; Grimaccia, F.; Leva, S.; Zich, R.E. IR real-time analyses for PV system monitoring by digital image processing techniques. In Proceedings of the 2015 International Conference on Event-Based Control, Communication, and Signal Processing (EBCCSP), Krakow, Poland, 17–19 June 2015; pp. 1–6. [Google Scholar]
- Aghaei, M.; Dolara, A.; Leva, S.; Grimaccia, F. Image resolution and defects detection in PV inspection by unmanned technologies. In Proceedings of the IEEE Power and Energy Society General Meeting (PESGM), Boston, MA, USA, 17–21 July 2016; pp. 1–5. [Google Scholar]
- Ortega-Farías, S.; Ortega-Salazar, S.; Poblete, T.; Kilic, A.; Allen, R.; Poblete-Echeverría, C.; Ahumada-Orellana, L.; Zuñiga, M.; Sepúlveda, D. Estimation of Energy Balance Components over a Drip-Irrigated Olive Orchard Using Thermal and Multispectral Cameras Placed on a Helicopter-Based Unmanned Aerial Vehicle (UAV). Remote Sens. 2016, 8, 638. [Google Scholar]
- Riveiro, B.; Lourenço, P.B.; Oliveira, D.V.; González-Jorge, H.; Arias, P. Automatic Morphologic Analysis of Quasi-Periodic Masonry Walls from LiDAR. Comput. Aided Civ. Infrastruct. Eng. 2015, 31. [Google Scholar] [CrossRef]
- Shen, Y.; Lindenbergh, R.; Wang, J. Change Analysis in Structural Laser Scanning Point Clouds: The Baseline Method. Sensors 2016, 17, 26. [Google Scholar] [CrossRef] [PubMed]
- Vo, A.-V.; Truong-Hong, L.; Laefer, D.F.; Bertolotto, M. Octree-based region growing for point cloud segmentation. ISPRS J. Photogramm. Remote Sens. 2015, 104, 88–100. [Google Scholar] [CrossRef]
- González-Aguilera, D.; López-Fernández, L.; Rodríguez-Gonzálvez, P.; Guerrero, D.; Hernandez-Lopez, D.; Remondino, F.; Menna, F.; Nocerino, E.; Toschi, I.; Ballabeni, A.; et al. Development of an all-purpose free photogrammetric tool. Int. Arch. Photogramm. Remote Sens. 2016, 41, 31–38. [Google Scholar] [CrossRef]
- Remondino, F.; Spera, M.G.; Nocerino, E.; Menna, F.; Nex, F. State of the art in high density image matching. Photogramm. Rec. 2014, 29, 144–166. [Google Scholar] [CrossRef]
- Roca, D.; Martínez-Sánchez, J.; Lagüela, S.; Arias, P. Novel Aerial 3D Mapping System Based on UAV Platforms and 2D Laser Scanners. J. Sens. 2016, 2016. [Google Scholar] [CrossRef]
- Hussein, H.M.S.; Ahmad, G.E.; El-Ghetany, H.H. Performance evaluation of photovoltaic modules at different tilt angles and orientations. Energy Convers. Manag. 2004, 45, 2441–2452. [Google Scholar] [CrossRef]
- Schuffert, S.; Voegtle, T.; Tate, N.; Ramirez, A. Quality Assessment of Roof Planes Extracted from Height Data for Solar Energy Systems by the EAGLE Platform. Remote Sens. 2015, 7, 17016–17034. [Google Scholar] [CrossRef]
- Huang, Y.; Chen, Z.; Wu, B.; Chen, L.; Mao, W.; Zhao, F.; Wu, J.; Wu, J.; Yu, B. Estimating Roof Solar Energy Potential in the Downtown Area Using a GPU-Accelerated Solar Radiation Model and Airborne LiDAR Data. Remote Sens. 2015, 7, 17212–17233. [Google Scholar] [CrossRef]
- Solla, M.; Lagüela, S.; Riveiro, B.; Lorenzo, H. Non-destructive testing for the analysis of moisture in the masonry arch bridge of Lubians (Spain). Struct. Control Health Monit. 2013, 20, 1366–1376. [Google Scholar] [CrossRef]
- Reda, I.; Andreas, A. Solar position algorithm for solar radiation applications. Sol. Energy 2004, 76, 577–589. [Google Scholar] [CrossRef]
- Tait, D.A. Photogrammetry, vol. 1. Fundamentals and Standard Processes: Karl Kraus; Ferdinand Dümmels Verlag: Bonn, Germany, 1993; p. 402, DM 58.00; ISBN 3-427-78681-1. [Google Scholar]
- Agarwal, S.; Furukawa, Y.; Snavely, N.; Simon, I.; Curless, B.; Seitz, S.M.; Szeliski, R. Building Rome in a day. Commun. ACM 2011, 54, 105–112. [Google Scholar] [CrossRef]
- Remondino, F.; El-Hakim, S. Image-based 3D modelling: A review. Photogramm. Rec. 2006, 21, 269–291. [Google Scholar] [CrossRef]
- Lu, C.; Xu, L.; Jia, J. Contrast preserving decolorization. In Proceedings of the IEEE International Conference on Computational Photography (ICCP), Seattle, WA, USA, 28–29 April 2012; pp. 1–7. [Google Scholar]
- Wallis, R. An approach to the space variant restoration and enhancement of images. In Proceedings of the Symposium on Current Mathematical Problems in Image Science, Monterey, CA, USA, 10–12 November 1976; pp. 329–340. [Google Scholar]
- Remondino, F.; Zhang, L. Surface reconstruction algorithms for detailed close-range object modeling. In Proceedings of the ISPRS Commission III Symposium, Bonn, Germany, 20–22 September 2006; pp. 117–123. [Google Scholar]
- Ohdake, T.; Chikatsu, H. 3D modelling of high relief sculpture using image-based integrated measurement system. Int. Arch. Photogramm. Remote Sens. Spat. Inf. Sci. 2005, 36, 6. [Google Scholar]
- Seiz, G.; Baltsavias, E.P.; Gruen, A. Cloud mapping from the ground: Use of photogrammetric methods. Photogramm. Eng. Remote Sens. 2002, 68, 941–951. [Google Scholar]
- Rusu, R.B.; Cousins, S. 3D is here: Point cloud library (pcl). In Proceedings of the 2011 IEEE International Conference on Robotics and Automation, Shanghai, China, 9–13 May 2011; pp. 1–4. [Google Scholar]
- Zhang, K.; Chen, S.-C.; Whitman, D.; Shyu, M.-L.; Yan, J.; Zhang, C. A progressive morphological filter for removing nonground measurements from airborne LIDAR data. IEEE Trans. Geosci. Remote Sens. 2003, 41, 872–882. [Google Scholar] [CrossRef]
- Zhang, K.; Whitman, D. Comparison of three algorithms for filtering airborne LiDAR data. Photogramm. Eng. Remote Sens. 2005, 71, 313–324. [Google Scholar] [CrossRef]
- López-Fernández, L.; Lagüela, S.; Picón, I.; González-Aguilera, D. Large scale automatic analysis and classification of roof surfaces for the installation of solar panels using a multi-sensor aerial platform. Remote Sens. 2015, 7, 11226–11248. [Google Scholar] [CrossRef]
- Soilán, M.; Riveiro, B.; Martínez-Sánchez, J.; Arias, P. Traffic sign detection in MLS acquired point clouds for geometric and image-based semantic inventory. ISPRS J. Photogramm. Remote Sens. 2016, 114, 92–101. [Google Scholar] [CrossRef]
- Fischler, M.A.; Bolles, R.C. Random sample consensus: A paradigm for model fitting with applications to image analysis and automated cartography. Commun. ACM 1981, 24, 381–395. [Google Scholar] [CrossRef]
- Miller, J. Short report: Reaction time analysis with outlier exclusion: Bias varies with sample size. Q. J. Exp. Psychol. 1991, 43, 907–912. [Google Scholar] [CrossRef]
- Edelsbrunner, H.; Kirkpatrick, D.G.; Seidel, R. On the shape of a set of points in the plane. IEEE Trans. Inf. Theory 1983, 29, 551–559. [Google Scholar] [CrossRef]
Figure 1.
Example of the images generated by the different imaging sensors used: (a) RGB image; and (b) thermographic image with thermal values represented using a color map.
Figure 1.
Example of the images generated by the different imaging sensors used: (a) RGB image; and (b) thermographic image with thermal values represented using a color map.
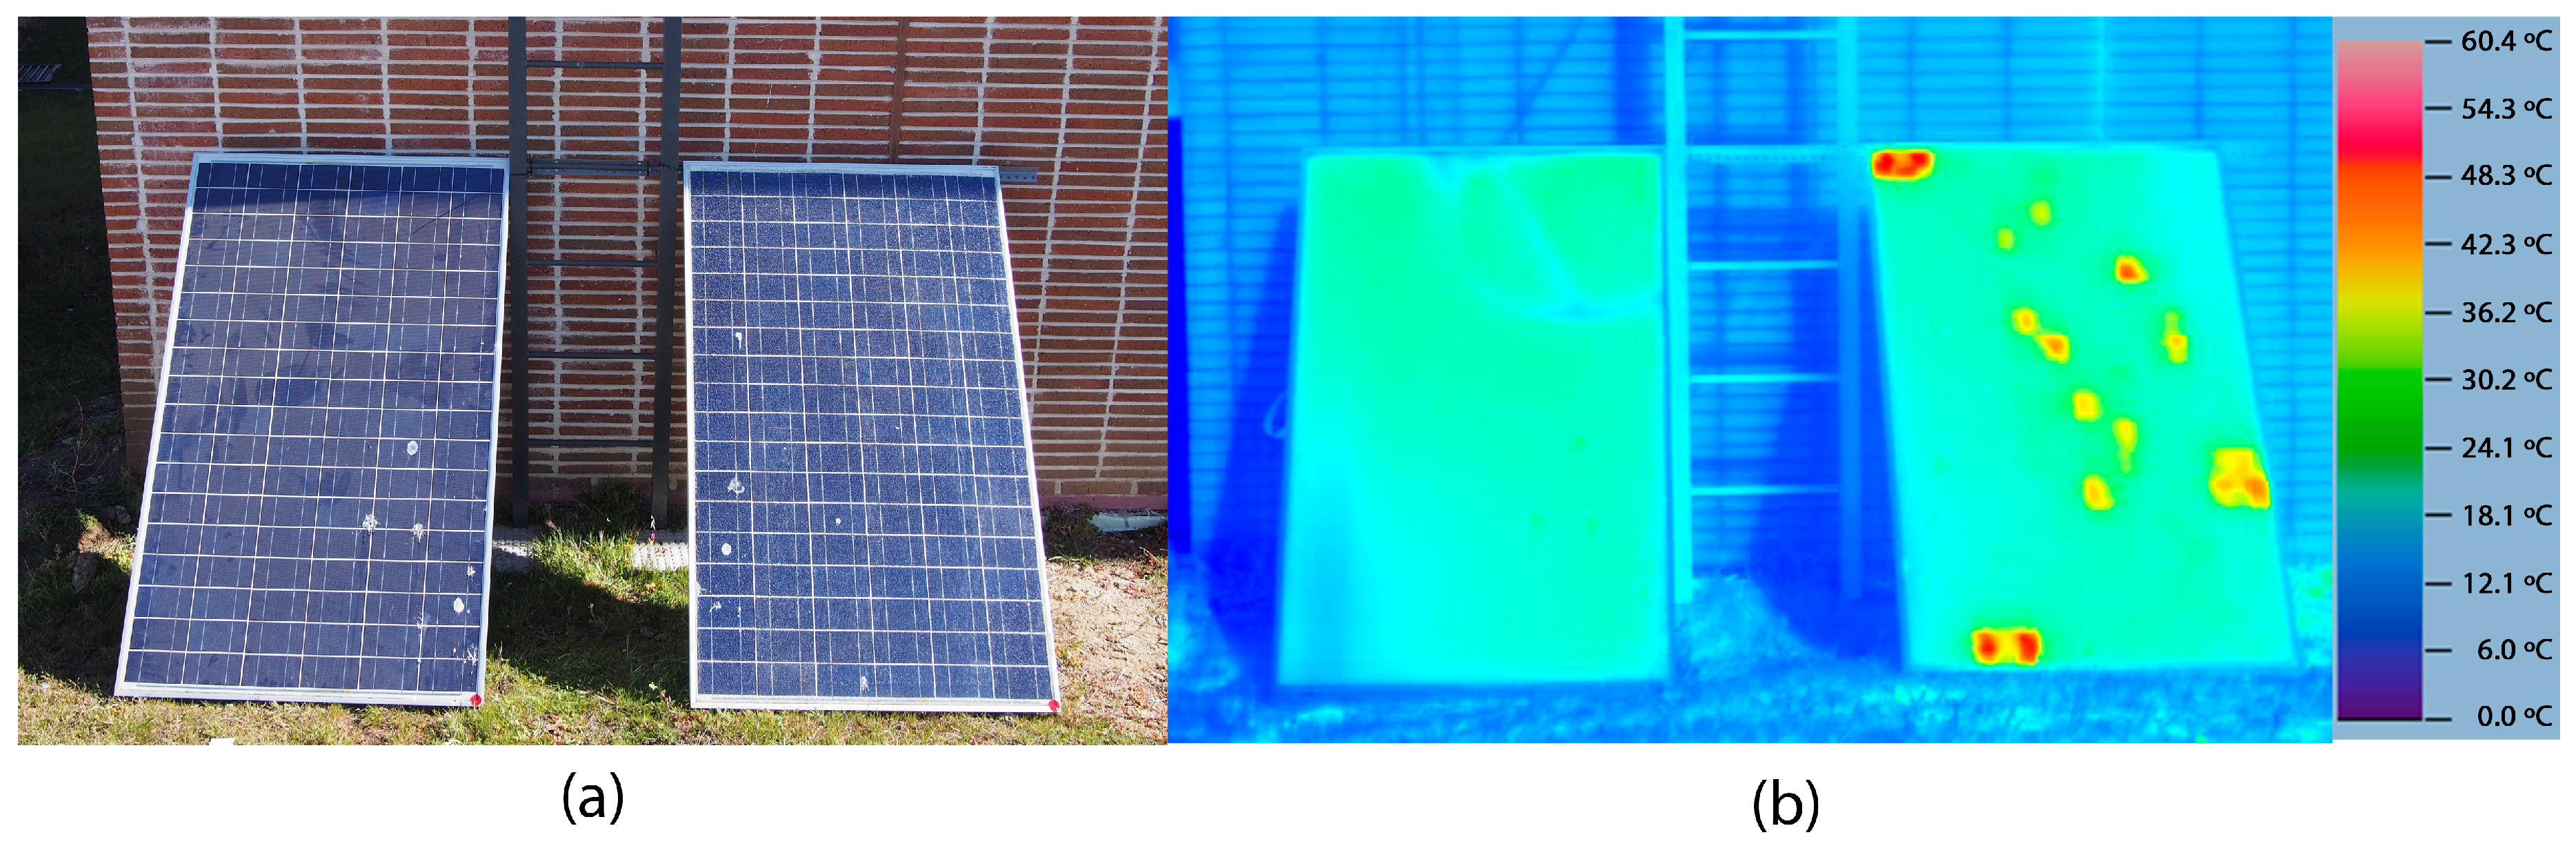
Figure 2.
General workflow of the proposed methodology.
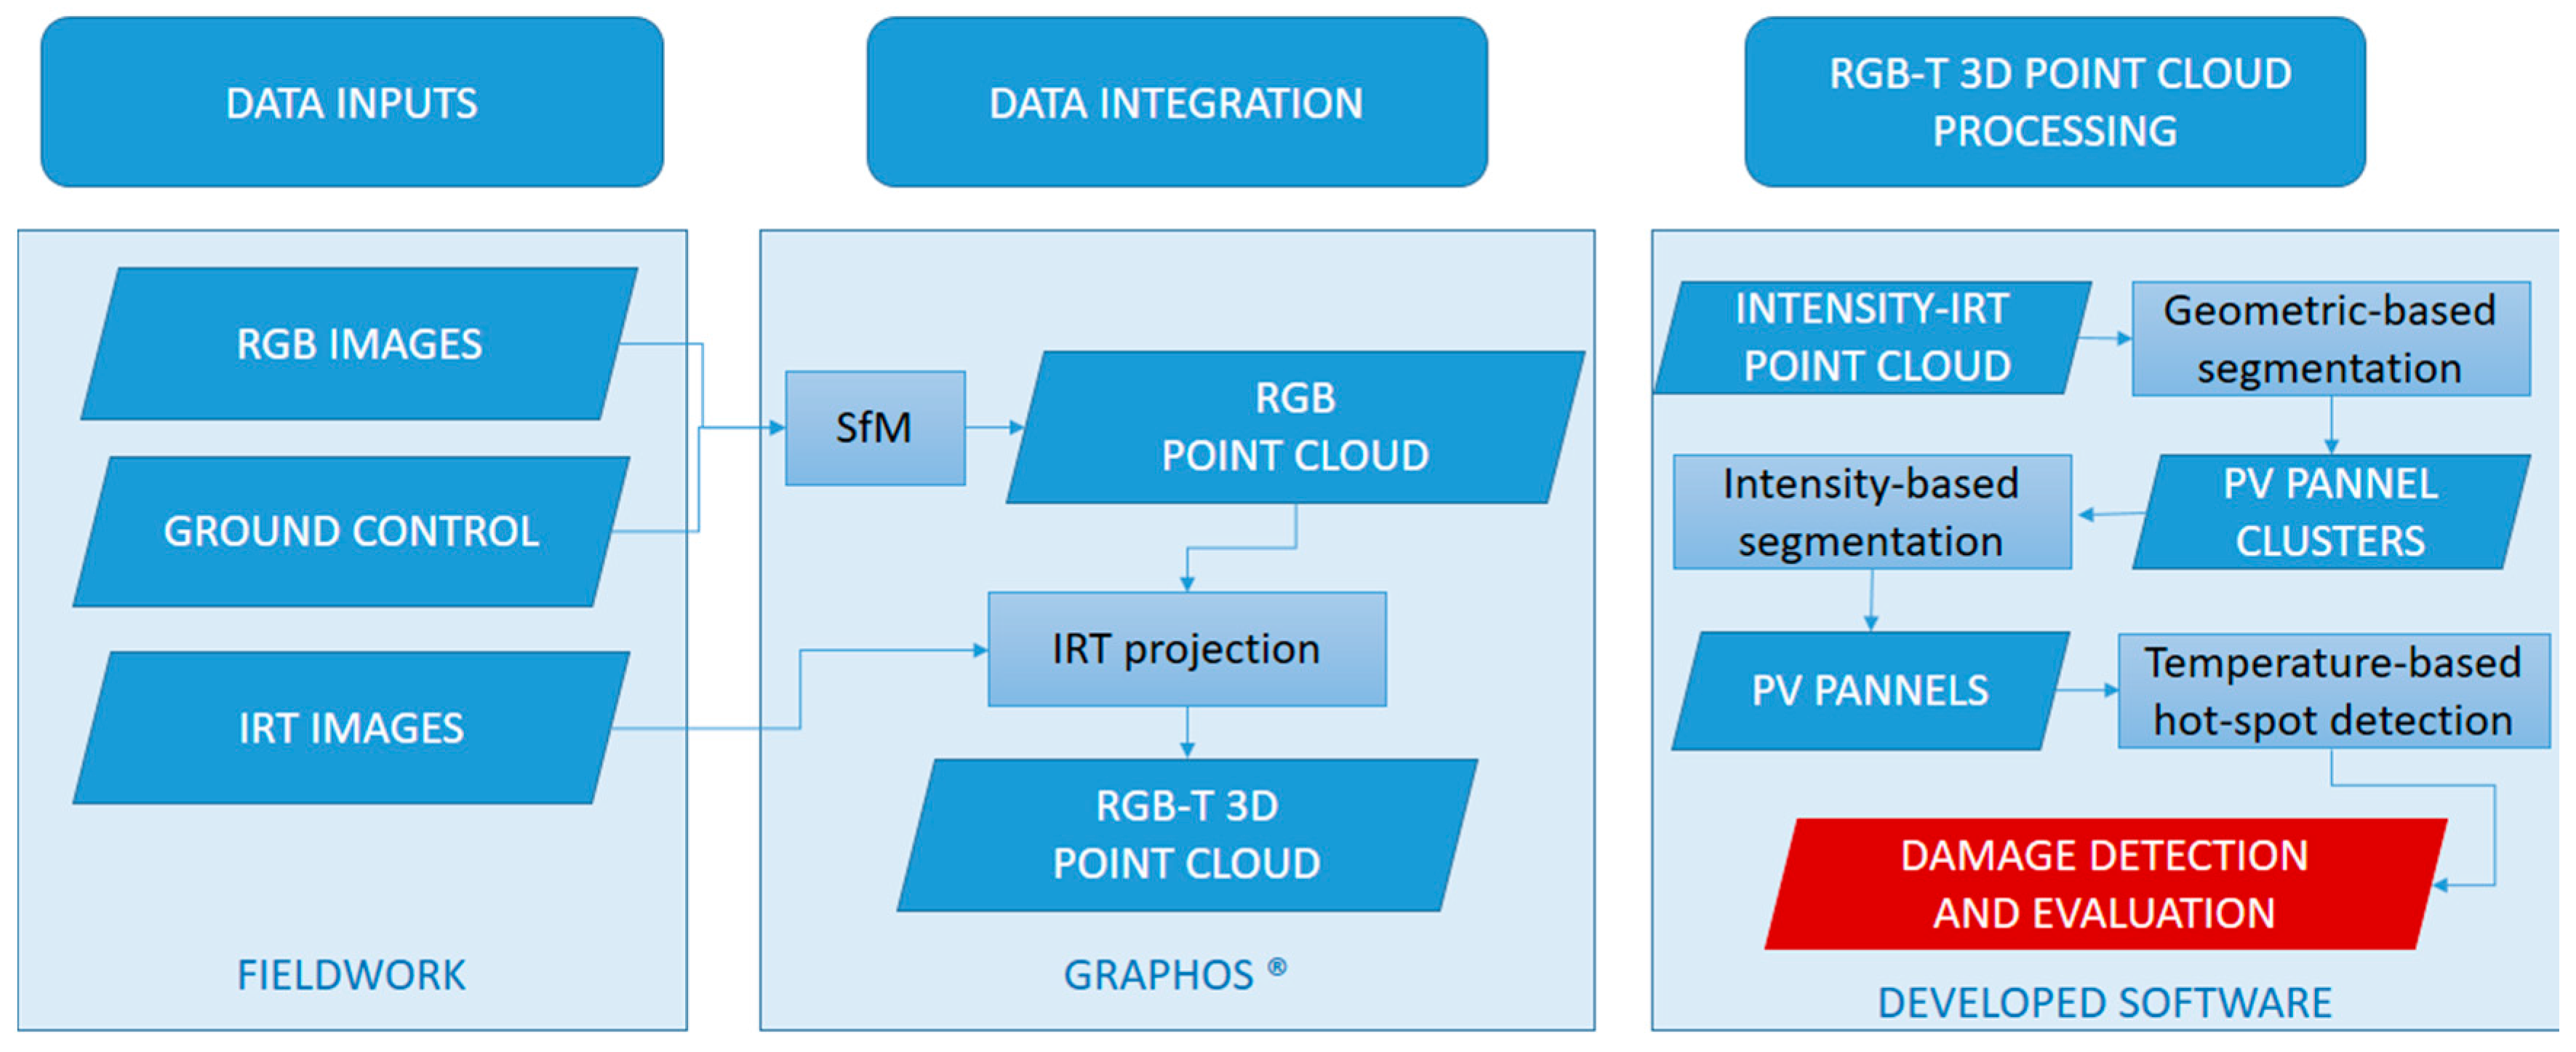
Figure 3.
Thermographic monitoring of PV panels. The color palette applied is the same as in Figure 2 (from 0 to 60 °C).
Figure 3.
Thermographic monitoring of PV panels. The color palette applied is the same as in Figure 2 (from 0 to 60 °C).

Figure 4.
Image preprocessing filters: (a) contrast preserving decolorization algorithm; and (b) Wallis local contrast enhancement algorithm.
Figure 4.
Image preprocessing filters: (a) contrast preserving decolorization algorithm; and (b) Wallis local contrast enhancement algorithm.

Figure 5.
Multidimensional metric product: (a) hybrid 4D point cloud with intensity radiometry; and (b) hybrid 4D point cloud with thermographic radiometry.
Figure 5.
Multidimensional metric product: (a) hybrid 4D point cloud with intensity radiometry; and (b) hybrid 4D point cloud with thermographic radiometry.
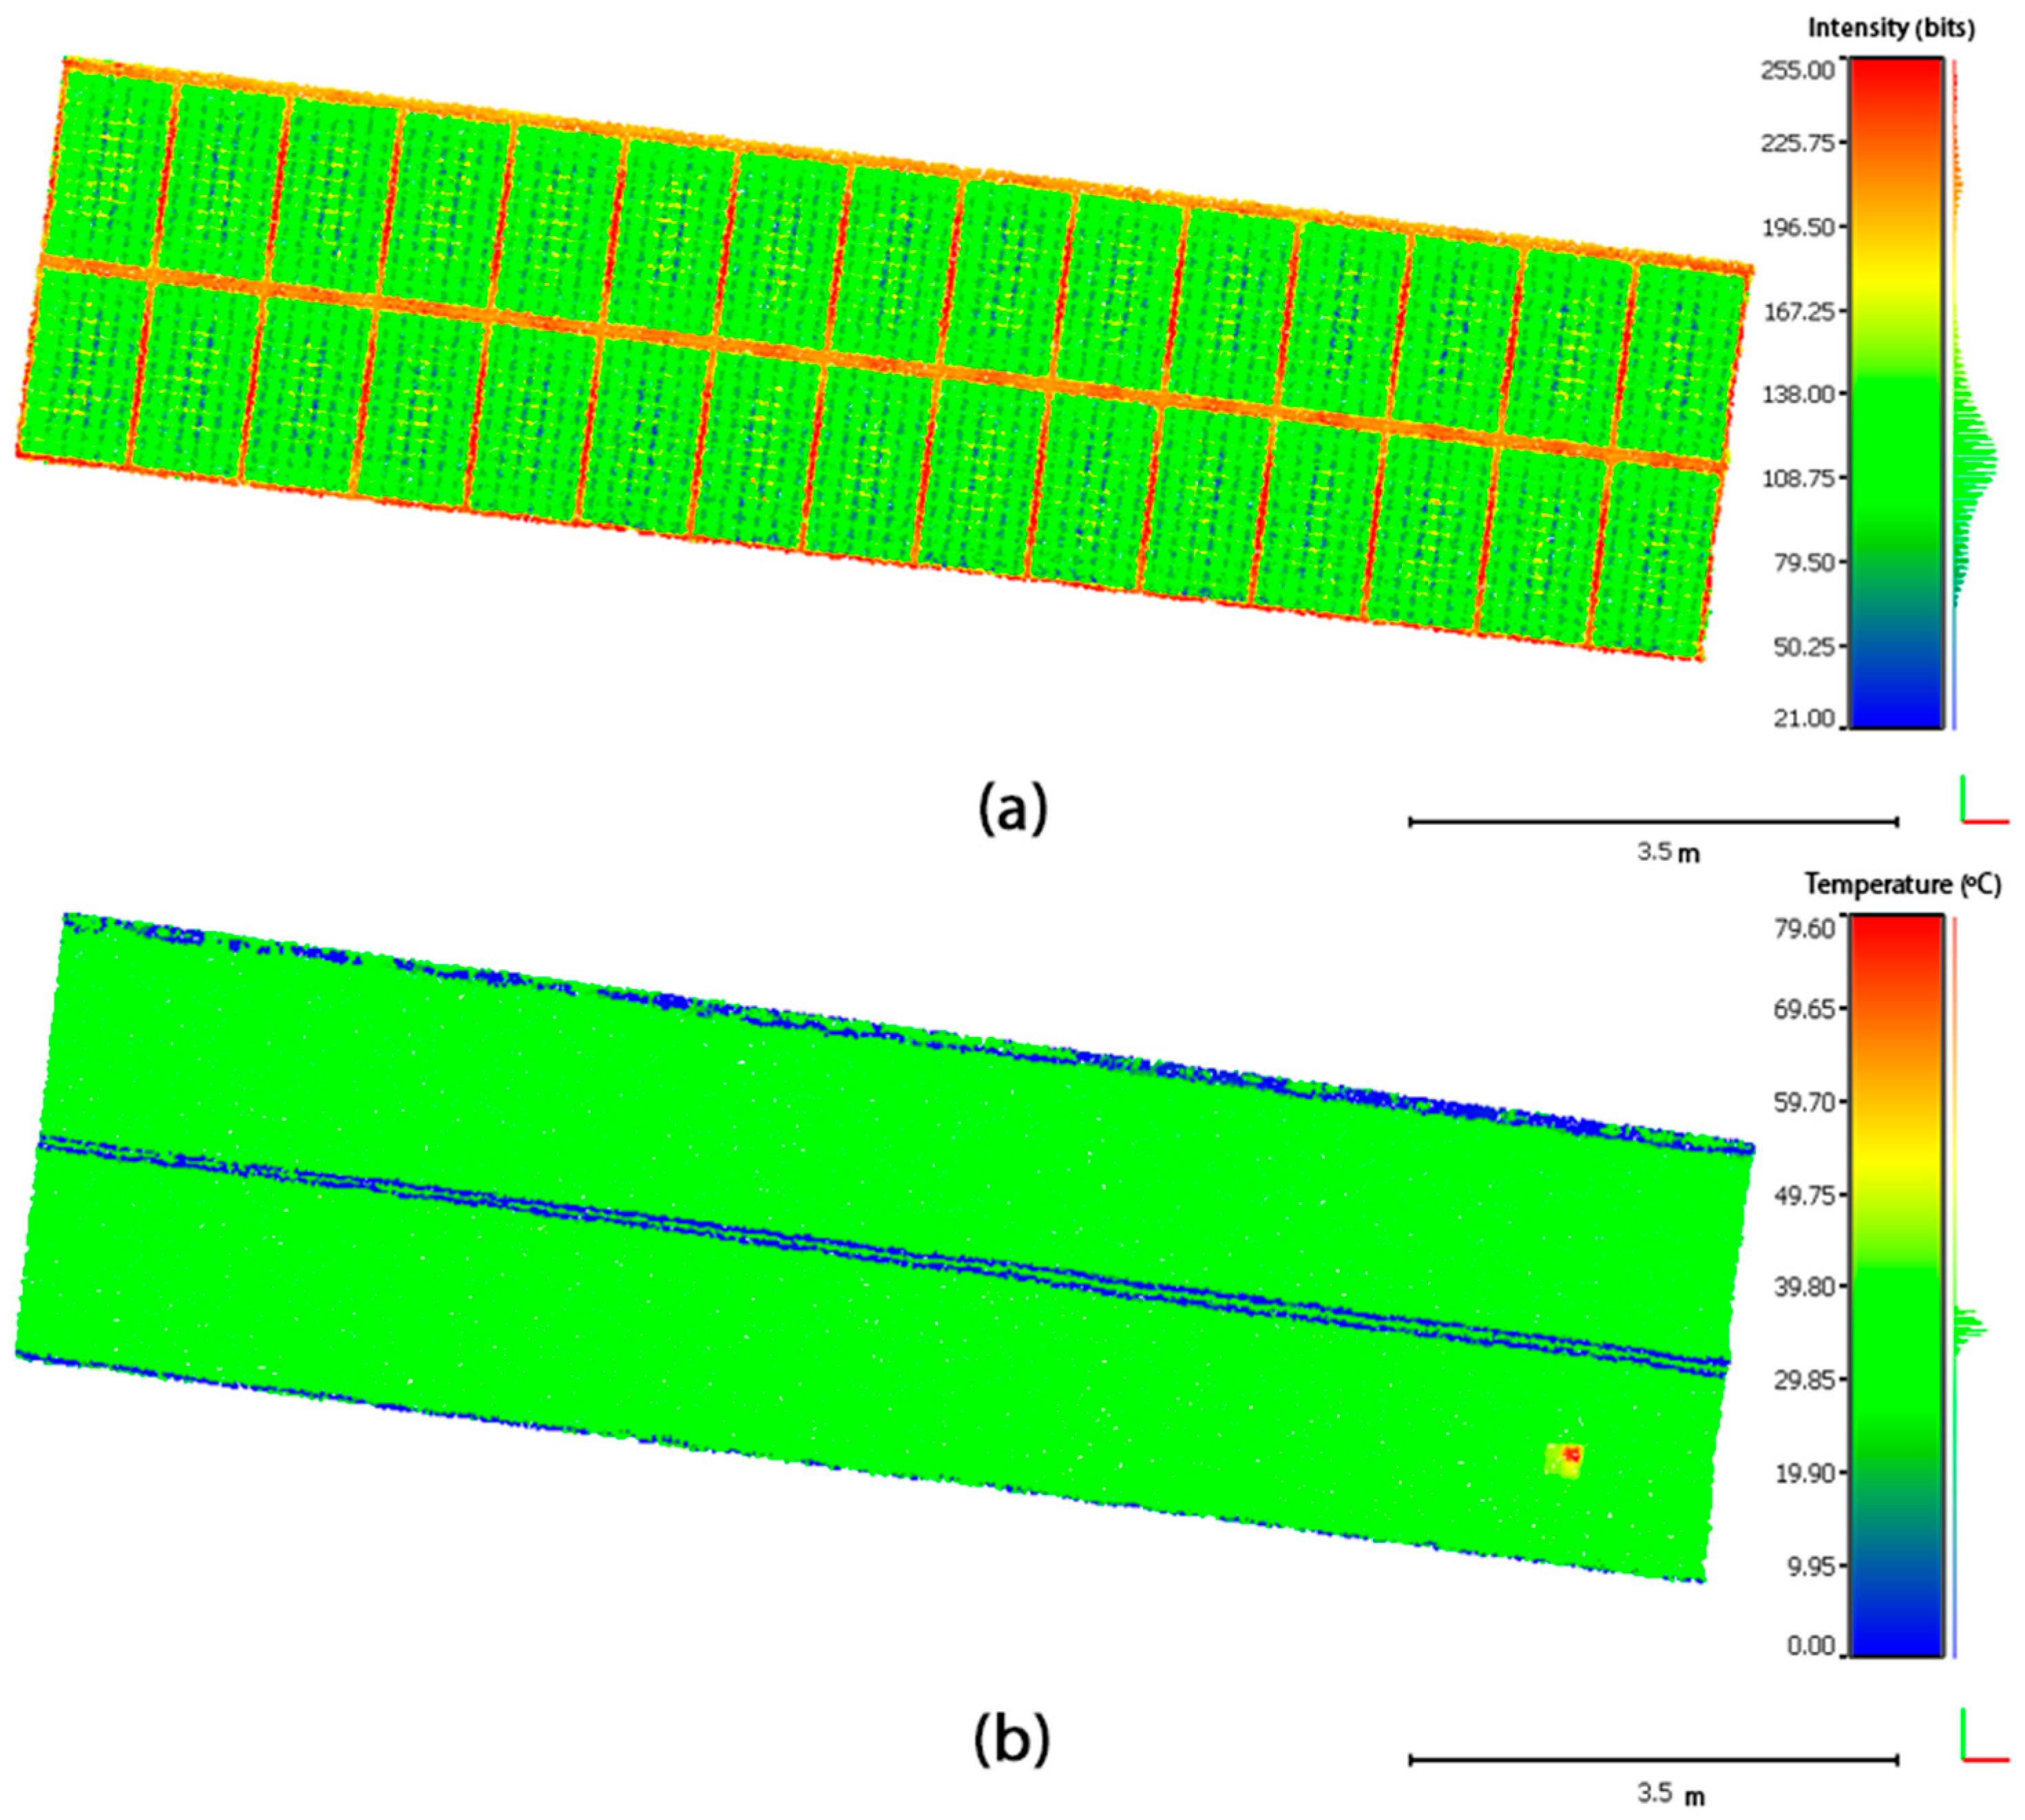
Figure 6.
Distribution of RANSAC lines parallel to PCA and eigenvectors. Projection over plane Z = 0 is used as PV panel segmentation grid.
Figure 6.
Distribution of RANSAC lines parallel to PCA and eigenvectors. Projection over plane Z = 0 is used as PV panel segmentation grid.
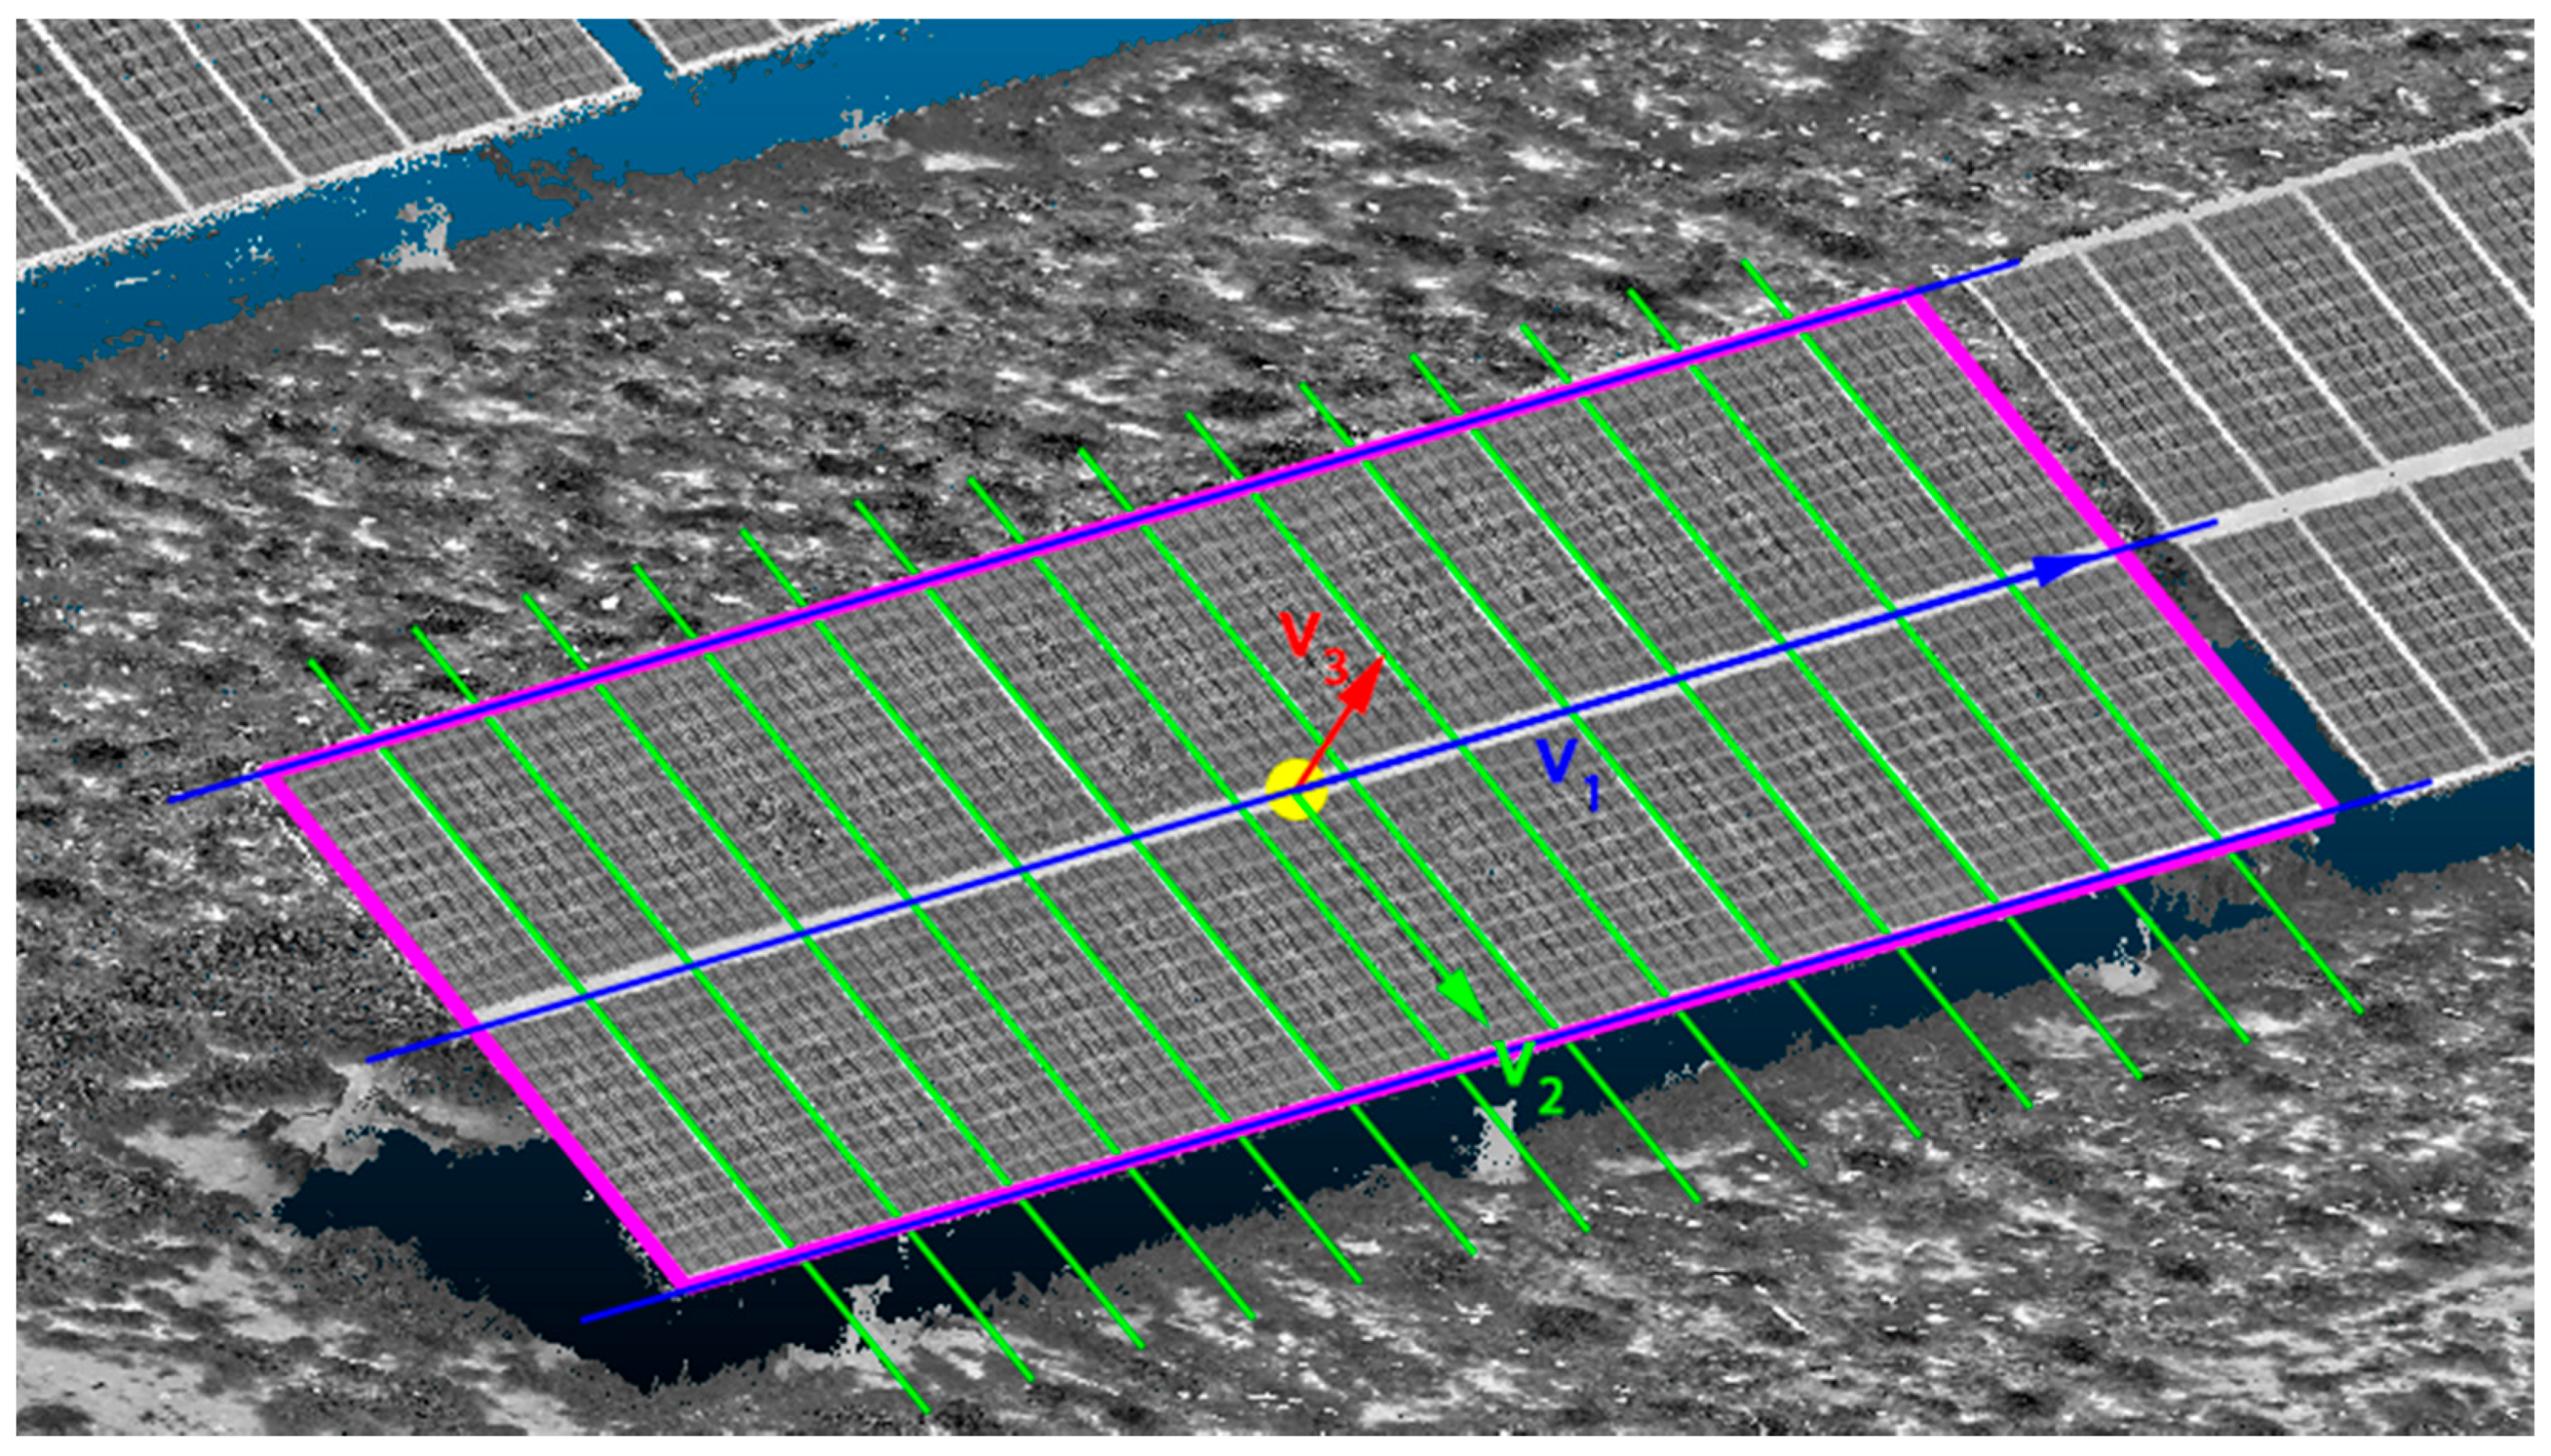
Figure 7.
(a) Flight planning designed for acquisition of RGB imagery according to the requisites. Yellow lines represent the flight path. Green labels represent way points. Color points represent image redundancy through overlapping. In particular, the number of images with overlap are indicated in the legend with a number at the left of the image. (b) GCP (Ground Control Points) homogeneously distributed over the whole study area.
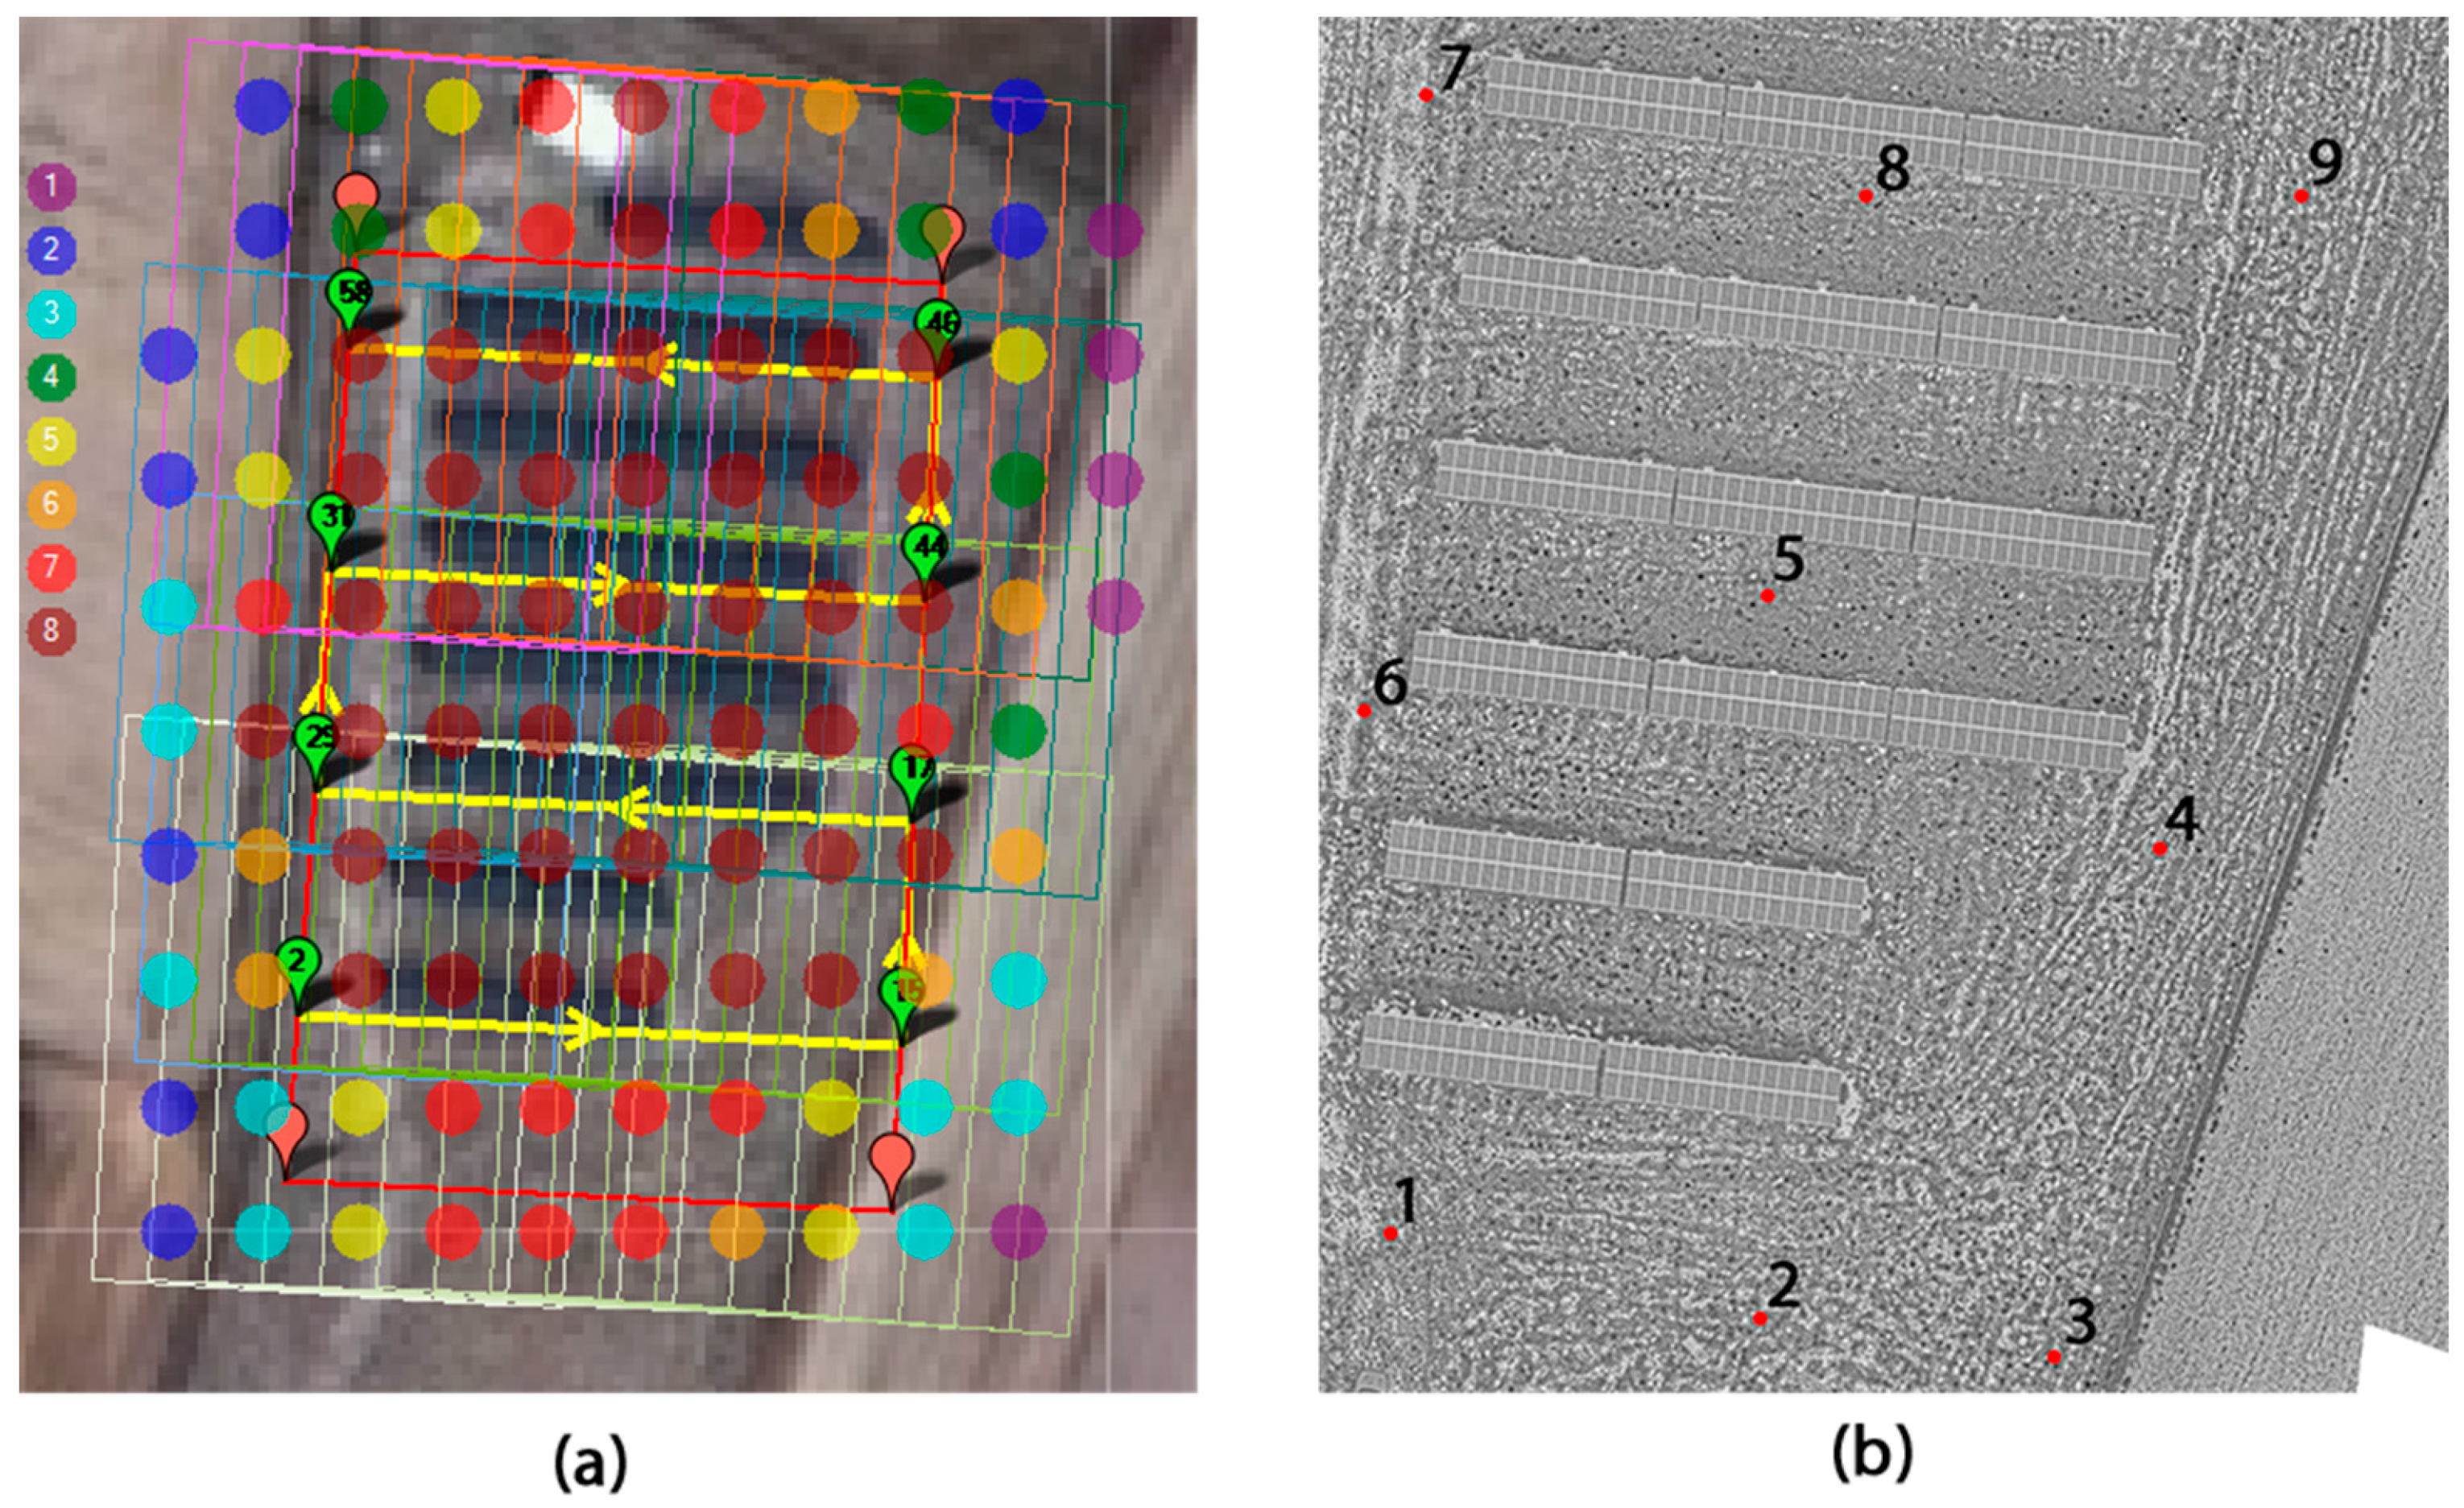
Figure 8.
(a) Result of the extraction of PV panels cluster using the Euclidean cluster extraction algorithm. (b) Results of the extraction of each PV panel with the intensity-based algorithm.
Figure 8.
(a) Result of the extraction of PV panels cluster using the Euclidean cluster extraction algorithm. (b) Results of the extraction of each PV panel with the intensity-based algorithm.
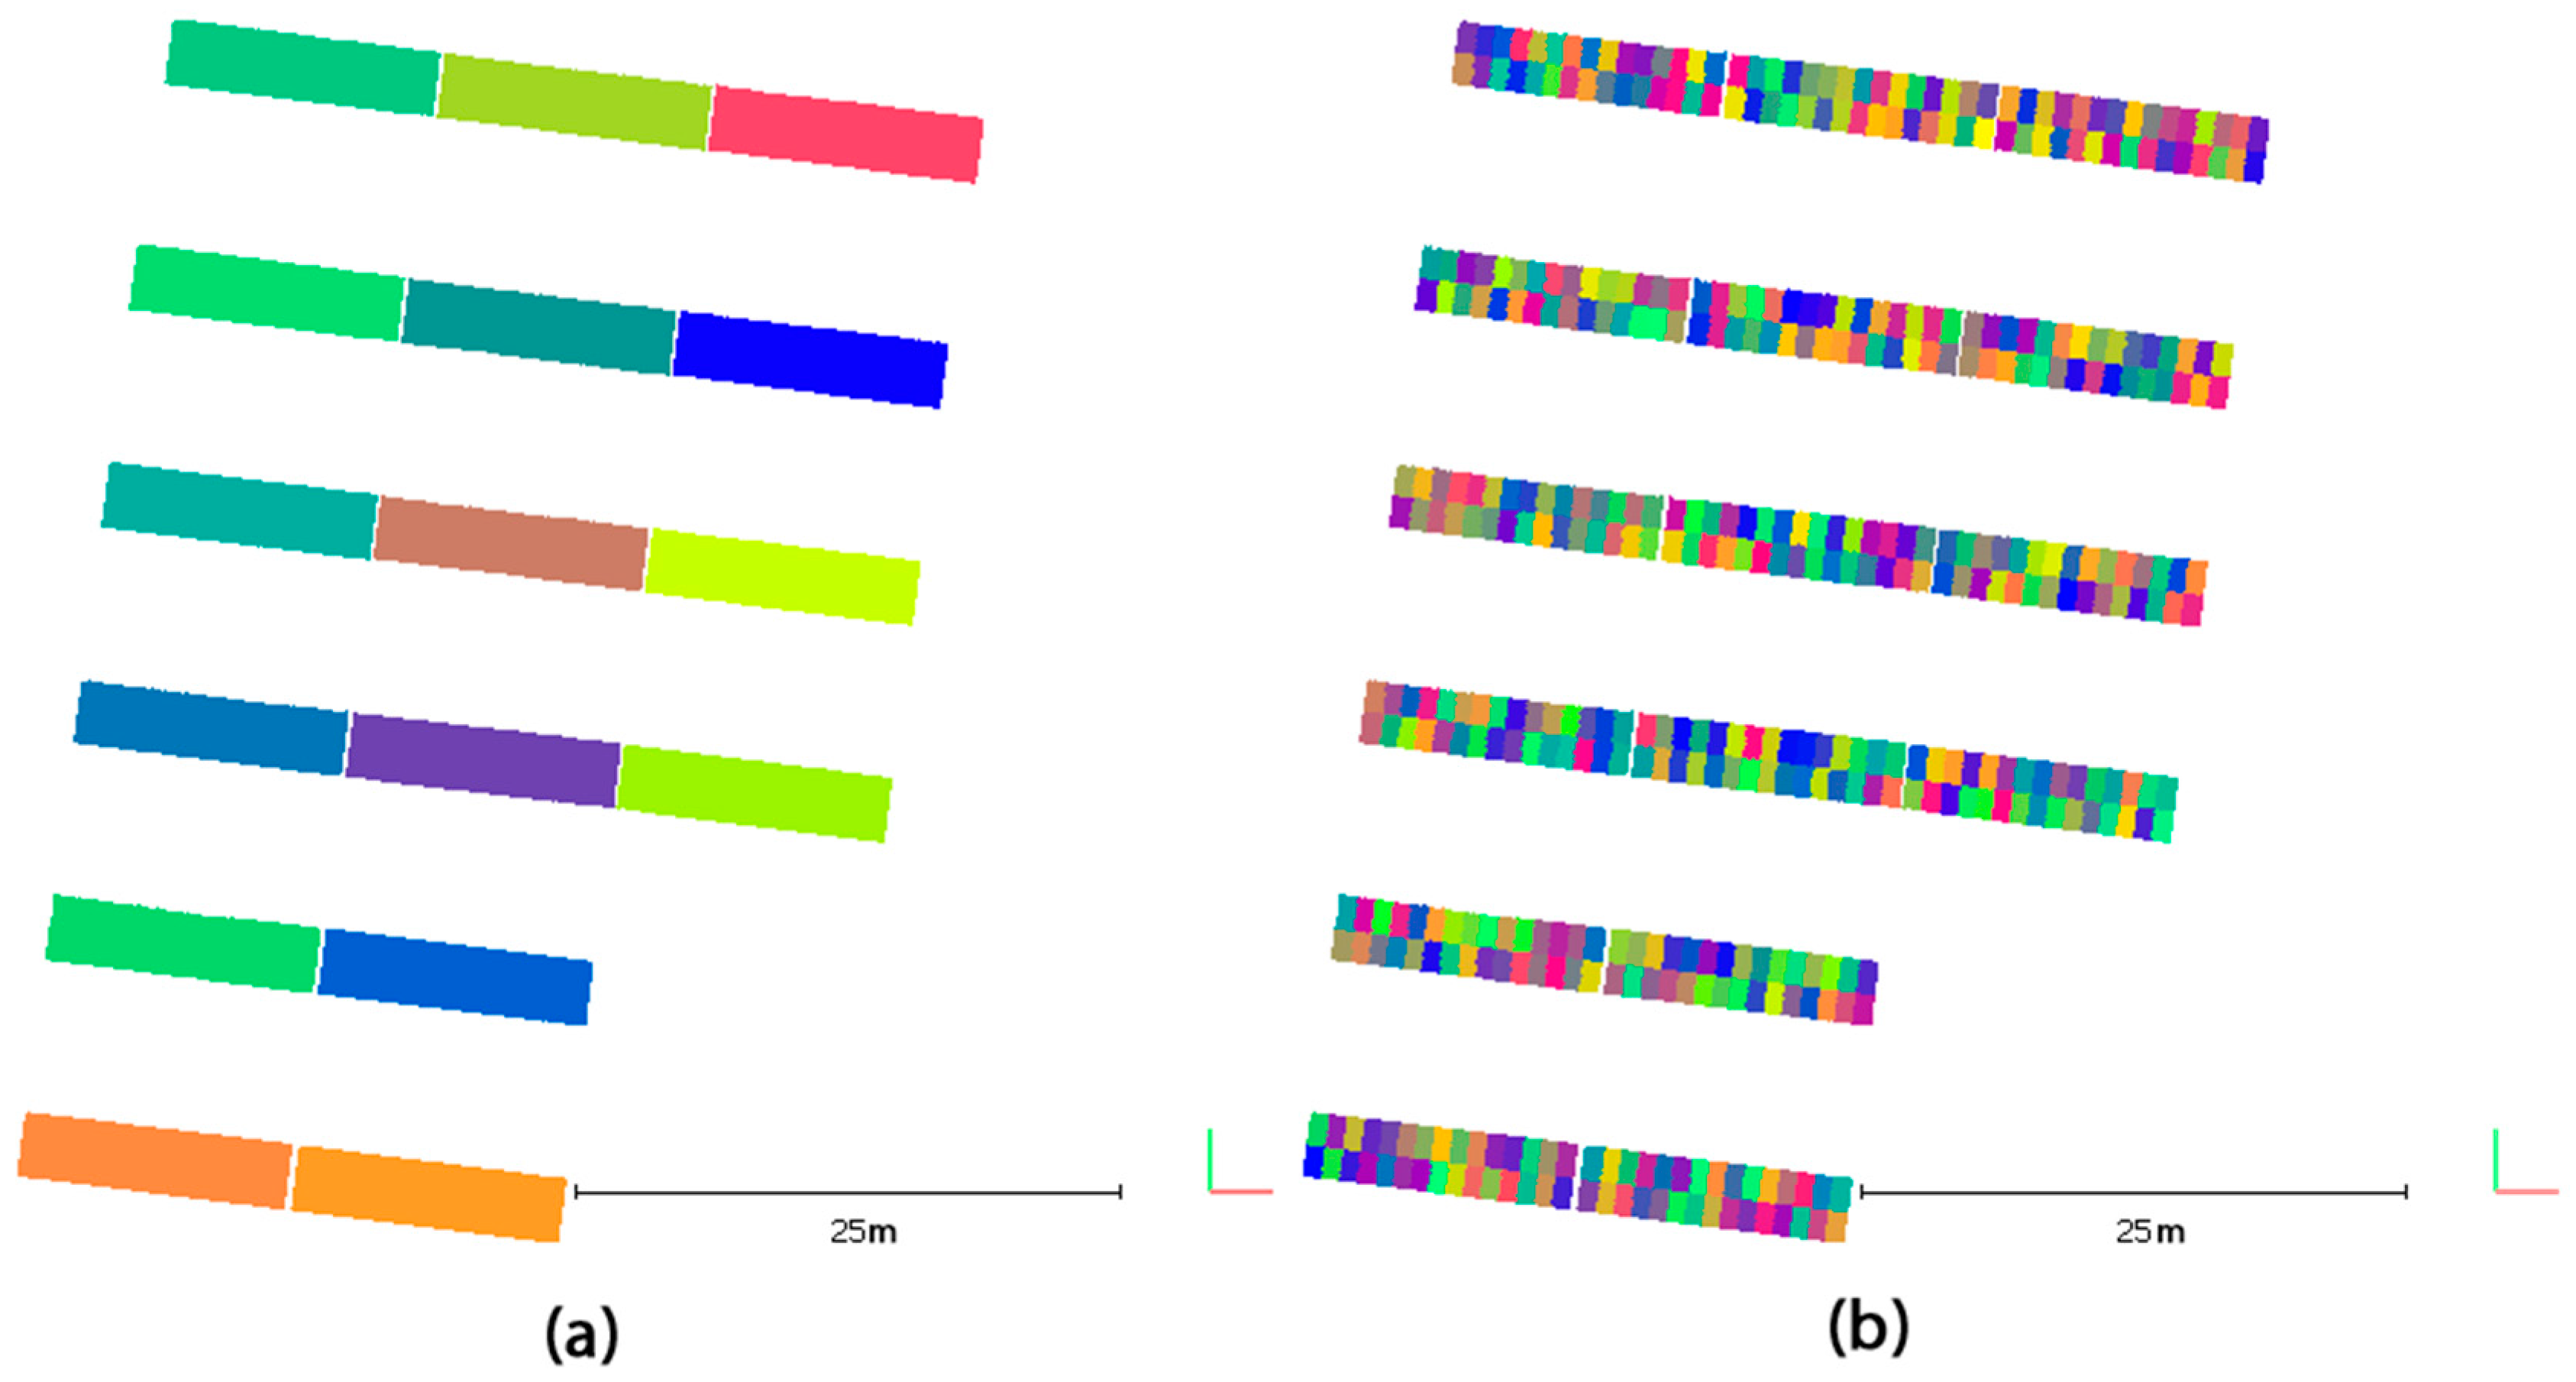
Figure 9.
Result of the temperature-based detection of thermal pathologies applied to each single PV panel: (Green) Non-Damaged PV panels; (Yellow) Damaged PV panel; and (Red) Damaged surface.
Figure 9.
Result of the temperature-based detection of thermal pathologies applied to each single PV panel: (Green) Non-Damaged PV panels; (Yellow) Damaged PV panel; and (Red) Damaged surface.
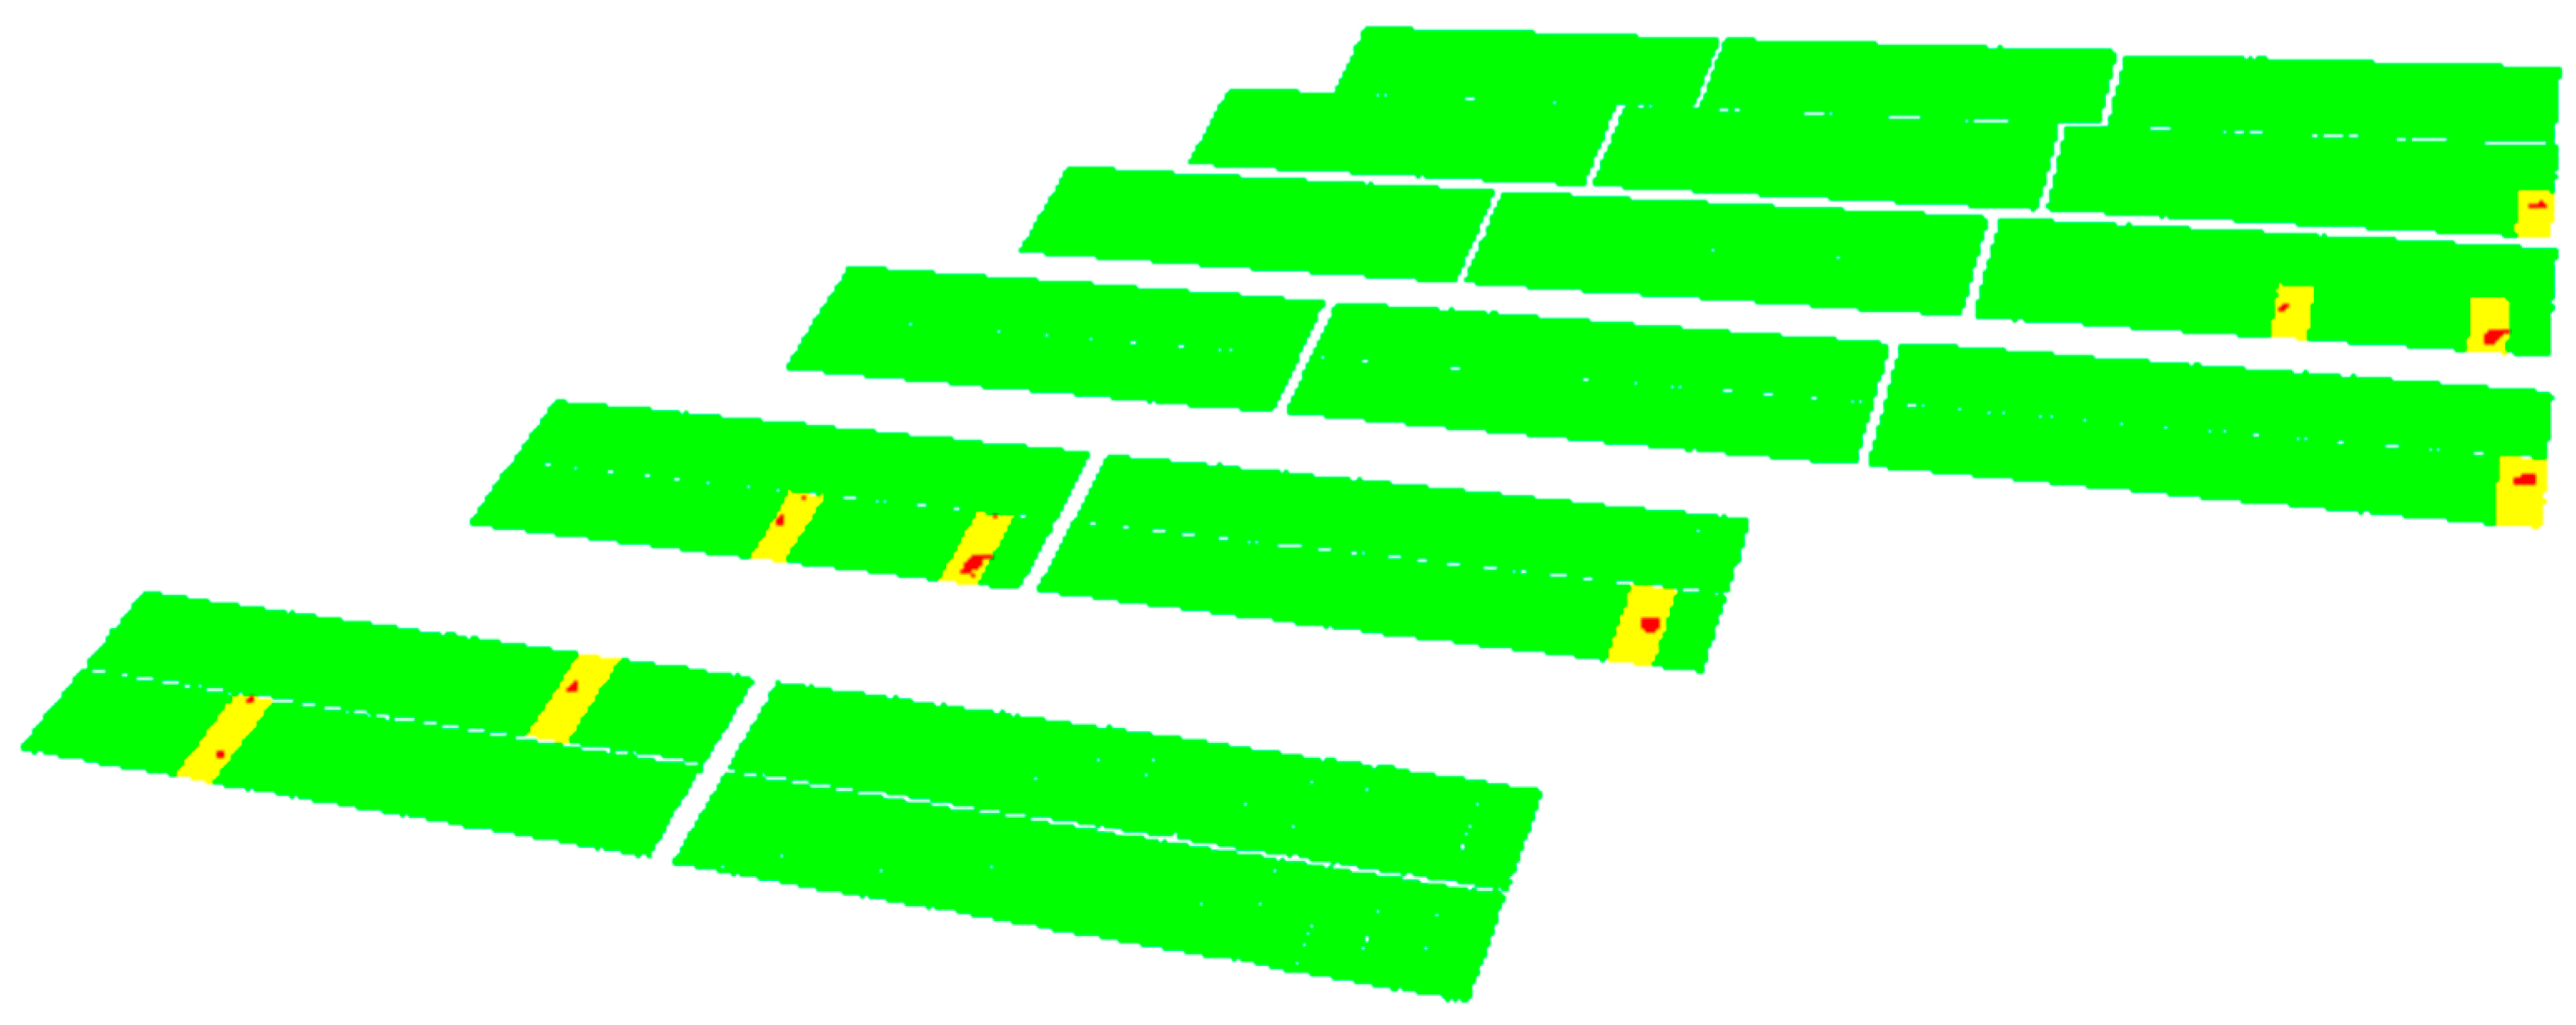
Figure 10.
Result of the proposed methodology integrated with aerial orthophotography from a WMS (Web Map Service) using a GIS (Geographic Information System) client.
Figure 10.
Result of the proposed methodology integrated with aerial orthophotography from a WMS (Web Map Service) using a GIS (Geographic Information System) client.


Table 1.
Olympus E-PM1 camera characteristics.
| Parameter | Value |
|---|---|
| Sensor Type | 4/3 CMOS (Complementary Metal-Oxide Semiconductor) Sensor |
| Sensor size | 17.3 mm × 13.0 mm |
| Effective Pixels | 12.3 Mp |
| Lens | 14–42 mm (crop factor = 2) |
Table 2.
Ground Control points. “XY error” is the root mean square error for X and Y coordinates for a GCP location, “Z error” is the error for Z coordinate for a GCP location, “RMSE” is the Root Mean Square Error for X, Y, Z coordinates for a GCP location and “Mean” implies averaging over all the GCP locations.
| Point Label | XY Error (m) | Z Error (m) | RMSE (m) |
|---|---|---|---|
| 1 | 0.013 | −0.006 | 0.015 |
| 3 | 0.013 | 0.000 | 0.013 |
| 5 | 0.008 | 0.012 | 0.014 |
| 7 | 0.005 | −0.002 | 0.005 |
| 9 | 0.008 | −0.005 | 0.010 |
| Mean | 0.010 | 0.007 | 0.012 |
Table 3.
Check points. “XY discrepancy” is the X and Y discrepancies obtained comparing the measurements provided by the GNSS system and the coordinates measured in the point cloud for a “Check point”; “Z discrepancy” is the Z coordinate discrepancy between coordinates measured with the GNSS system and the Z coordinate measured in the point cloud for a “Check point”; “Accuracy” is the root mean square discrepancy for X, Y, Z coordinates for a “Check point” and “Mean” implies averaging all the “Check points”.
| Point Label | XY Discrepancy (m) | Z Discrepancy (m) | Accuracy (m) |
|---|---|---|---|
| 8 | 0.004 | −0.014 | 0.015 |
| 2 | 0.024 | −0.043 | 0.050 |
| 4 | 0.025 | −0.030 | 0.039 |
| 6 | 0.011 | −0.001 | 0.011 |
| Mean | 0.018 | 0.027 | 0.033 |
Table 4.
PV Cluster parameters: IDs are defined in ascendant order from north to south and from west to east.
Table 4.
PV Cluster parameters: IDs are defined in ascendant order from north to south and from west to east.
| ID | PV Cluster Parameters | PV Cluster Centroid Geolocation | |||
|---|---|---|---|---|---|
| Azimut (deg) | Tilt (deg) | XUTM (m) | YUTM (m) | Height (m) | |
| 1 | 187.4 | 28.2 | 353,632.70 | 4,520,762.18 | 934.55 |
| 2 | 187.0 | 27.8 | 353,645.10 | 4,520,760.67 | 934.59 |
| 3 | 187.1 | 28.2 | 353,657.57 | 4,520,759.15 | 934.54 |
| 4 | 187.4 | 28.1 | 353,631.40 | 4,520,752.27 | 934.61 |
| 5 | 186.8 | 27.6 | 353,643.85 | 4,520,750.76 | 934.61 |
| 6 | 186.7 | 28.1 | 353,656.24 | 4,520,749.23 | 934.61 |
| 7 | 187.3 | 28.3 | 353,630.22 | 4,520,742.89 | 934.57 |
| 8 | 187.1 | 27.9 | 353,642.65 | 4,520,741.37 | 934.58 |
| 9 | 187.0 | 28.2 | 353,655.11 | 4,520,739.87 | 934.58 |
| 10 | 187.1 | 28.0 | 353,628.94 | 4,520,732.99 | 934.61 |
| 11 | 187.0 | 27.9 | 353,641.41 | 4,520,731.47 | 934.61 |
| 12 | 186.7 | 28.3 | 353,653.80 | 4,520,729.96 | 934.62 |
| 13 | 187.3 | 27.8 | 353,627.64 | 4,520,723.09 | 934.68 |
| 14 | 187.1 | 28.0 | 353,640.17 | 4,520,721.52 | 934.71 |
| 15 | 187.2 | 28.0 | 353,626.36 | 4,520,713.19 | 934.69 |
| 16 | 187.2 | 28.1 | 353,638.91 | 4,520,711.62 | 934.70 |
| Mean | 187.1 | 28.0 | |||
| Std. dev. | 0.2 | 0.2 | |||
Table 5.
Damaged PV panel parameters: IDs are defined in ascendant order from north to south and from west to east.
Table 5.
Damaged PV panel parameters: IDs are defined in ascendant order from north to south and from west to east.
| ID | Damaged PV Panel Parameters | Damaged PV Panel Centroid Geolocation | |||
|---|---|---|---|---|---|
| Area (m2) | Area (%) | XUTM (m) | YUTM (m) | Height (m) | |
| 1 | 0.1036 | 8.4 | 353,661.82 | 4,520,747.87 | 934.25 |
| 2 | 0.1335 | 12.9 | 353,655.80 | 4,520,739.10 | 934.22 |
| 3 | 0.1362 | 11.9 | 353,659.83 | 4,520,738.55 | 934.21 |
| 4 | 0.0898 | 8.1 | 353,659.37 | 4,520,728.62 | 934.28 |
| 5 | 0.1747 | 13.9 | 353,628.32 | 4,520,722.30 | 934.30 |
| 6 | 0.1474 | 12.4 | 353,632.37 | 4,520,721.81 | 934.33 |
| 7 | 0.1180 | 9.6 | 353,644.85 | 4,520,720.24 | 934.32 |
| 8 | 0.0716 | 6.5 | 353,629.66 | 4,520,713.53 | 935.10 |
| 9 | 0.0349 | 2.9 | 353,623.83 | 4,520,712.81 | 934.31 |
Table 6.
Verification of the damaged area per PV panel regarding ground truth: IDs are defined in ascendant order from north to south and from west to east.
Table 6.
Verification of the damaged area per PV panel regarding ground truth: IDs are defined in ascendant order from north to south and from west to east.
| Ground Truth | Compared Methodologies | ||||
|---|---|---|---|---|---|
| Flexometer Measurements | Visual Estimation | Proposed Workflow | |||
| ID | Damaged Area (%) | Damaged Area (%) | Discrepancy (%) | Damaged Area (%) | Discrepancy (%) |
| 1 | 9.7 | 5.0 | 4.7 | 8.4 | 1.3 |
| 2 | 13.6 | 10.0 | 3.6 | 12.9 | 0.7 |
| 3 | 13.6 | 10.0 | 3.6 | 11.9 | 1.7 |
| 4 | 9.0 | 5.0 | 4.0 | 8.1 | 0.9 |
| 5 | 15.3 | 10.0 | 5.3 | 13.9 | 1.3 |
| 6 | 14.1 | 10.0 | 4.1 | 12.4 | 1.7 |
| 7 | 11.2 | 5.0 | 6.2 | 9.6 | 1.6 |
| 8 | 7.1 | 5.0 | 2.1 | 6.5 | 0.6 |
| 9 | 3.1 | 2.0 | 1.1 | 2.9 | 0.2 |
Table 7.
Geometric attributes verification regarding ground truth.
| Proposed Workflow | Ground Truth | Discrepancies | ||||
|---|---|---|---|---|---|---|
| ID | Azimut (deg) | Tilt (deg) | Azimut (deg) | Tilt (deg) | Azimut (deg) | Tilt (deg) |
| 1 | 187.4 | 28.2 | 186.5 | 28.2 | 0.9 | 0.0 |
| 2 | 187.0 | 27.8 | 186.7 | 28.2 | 0.3 | 0.4 |
| 3 | 187.1 | 28.2 | 186.4 | 28.6 | 0.7 | 0.4 |
| 4 | 187.4 | 28.1 | 186.6 | 28.5 | 0.8 | 0.4 |
| 5 | 186.8 | 27.6 | 187.2 | 28.5 | 0.4 | 0.9 |
| 6 | 186.7 | 28.1 | 186.9 | 28.1 | 0.2 | 0.0 |
| 7 | 187.3 | 28.3 | 186.5 | 28.3 | 0.8 | 0.0 |
| 8 | 187.0 | 27.9 | 187.0 | 28.7 | 0.0 | 0.8 |
| 9 | 187.0 | 28.2 | 186.6 | 28.2 | 0.4 | 0.0 |
| 10 | 187.1 | 28.0 | 186.5 | 28.5 | 0.6 | 0.5 |
| 11 | 187.0 | 27.9 | 186.6 | 28.3 | 0.4 | 0.4 |
| 12 | 186.7 | 28.3 | 186.8 | 27.9 | 01 | 0.4 |
| 13 | 187.3 | 27.8 | 186.4 | 28.2 | 0.9 | 0.4 |
| 14 | 187.1 | 28.0 | 186.8 | 28.2 | 0.3 | 0.2 |
| 15 | 187.2 | 28.0 | 186.7 | 28.5 | 0.5 | 0.5 |
| 16 | 187.2 | 28.1 | 186.7 | 28.3 | 0.5 | 0.2 |
© 2017 by the authors. Licensee MDPI, Basel, Switzerland. This article is an open access article distributed under the terms and conditions of the Creative Commons Attribution (CC BY) license (http://creativecommons.org/licenses/by/4.0/).
Share and Cite
MDPI and ACS Style
López-Fernández, L.; Lagüela, S.; Fernández, J.; González-Aguilera, D. Automatic Evaluation of Photovoltaic Power Stations from High-Density RGB-T 3D Point Clouds. Remote Sens. 2017, 9, 631. https://doi.org/10.3390/rs9060631
AMA Style
López-Fernández L, Lagüela S, Fernández J, González-Aguilera D. Automatic Evaluation of Photovoltaic Power Stations from High-Density RGB-T 3D Point Clouds. Remote Sensing. 2017; 9(6):631. https://doi.org/10.3390/rs9060631
Chicago/Turabian StyleLópez-Fernández, Luis, Susana Lagüela, Jesús Fernández, and Diego González-Aguilera. 2017. "Automatic Evaluation of Photovoltaic Power Stations from High-Density RGB-T 3D Point Clouds" Remote Sensing 9, no. 6: 631. https://doi.org/10.3390/rs9060631
Note that from the first issue of 2016, this journal uses article numbers instead of page numbers. See further details here.