Article

Aerosol Optical Properties and Associated Direct Radiative Forcing over the Yangtze River Basin during 2001–2015

1
School of Resource and Environmental Science, Wuhan University, Wuhan 430079, China
2
Laboratory of Critical Zone Evolution, School of Earth Sciences, China University of Geosciences, Wuhan 430074, China
3
State Key Laboratory of Information Engineering in Surveying, Mapping and Remote Sensing, Wuhan University, Wuhan 430079, China
4
Department of Land Surveying and Geo-Informatics, The Hong Kong Polytechnic University, Hung Hom, Kowloon, Hong Kong, China
5
State Key Laboratory of Remote Sensing Science, Institute of Remote Sensing and Digital Earth, Chinese Academy of Sciences, Beijing 100101, China
*
Authors to whom correspondence should be addressed.
These authors contributed equally to this work.
Remote Sens. 2017, 9(7), 746; https://doi.org/10.3390/rs9070746
Submission received: 31 May 2017 / Revised: 7 July 2017 / Accepted: 17 July 2017 / Published: 20 July 2017

Abstract

:
The spatiotemporal variation of aerosol optical depth at 550 nm (AOD550), Ångström exponent at 470–660 nm (AE470–660), water vapor content (WVC), and shortwave (SW) instantaneous aerosol direct radiative effects (IADRE) at the top-of-atmosphere (TOA) in clear skies obtained from the Moderate Resolution Imaging Spectroradiometer (MODIS) and Clouds and the Earth’s Radiant Energy System (CERES) are quantitatively analyzed over the Yangtze River Basin (YRB) in China during 2001–2015. The annual and seasonal frequency distributions of AE470–660 and AOD550 reveal the dominance of fine aerosol particles over YRB. The regional average AOD550 is 0.49 ± 0.31, with high value in spring (0.58 ± 0.35) and low value in winter (0.42 ± 0.29). The higher AOD550 (≥0.6) is observed in midstream and downstream regions of YRB and Sichuan Basin due to local anthropogenic emissions and long-distance transport of dust particles, while lower AOD550 (≤0.3) is in high mountains of upstream regions. The IADRE is estimated using a linear relationship between SW upward flux and coincident AOD550 from CERES and MODIS at the satellite passing time. The regional average IADRE is −35.60 ± 6.71 Wm−2, with high value (−40.71 ± 6.86 Wm−2) in summer and low value (−29.19 ± 7.04 Wm−2) in winter, suggesting a significant cooling effect at TOA. The IADRE at TOA is lower over Yangtze River Delta (YRD) (≤−30 Wm−2) and higher in midstream region of YRB, Sichuan Basin and the source area of YRB (≥−45 Wm−2). The correlation coefficient between the 15-year monthly IADRE and AOD550 values is 0.63, which confirms the consistent spatiotemporal variation patterns over most of the YRB. However, a good agreement between IADRE and AOD is not observed in YRD and the source area of YRB, which is probably due to the combined effects of aerosol and surface properties.

Graphical Abstract

1. Introduction

Aerosol is one of the crucial factors contributing to regional and global climate change [1]. It can directly absorb and scatter solar radiation at the top-of-atmosphere (TOA) and surface, which is defined as Aerosol Direct Radiative Effect (ADRE). The ADRE can be quantitatively calculated through the difference of upward shortwave (SW) solar fluxes without (Fclr) and with (Faero) aerosols for clear skies [2,3]. The aerosol optical properties such as the aerosol optical depth (AOD) and the Ångström exponent (AE) are key parameters for estimating ADRE on the earth–atmosphere system [4]. However, due to the diverse spatiotemporal distribution of aerosols, the ADRE remains the major source of uncertainty for assessing the regional climate [5]. Therefore, to further explore aerosol effects on regional climate and air quality, long-term systematic estimation of aerosol optical properties and associated direct radiative effects needs to be made.
Ground and satellite remote sensing are common techniques widely used for measuring aerosol optical properties. With the improvement of the spatial and temporal resolution of sensors such as Multi-angle Imaging SpectroRadiometer (MISR), the Moderate Resolution Imaging Spectroradiometer (MODIS), and Clouds and the Earth’s Radiant Energy System (CERES), the satellite remote sensing has an advantage over the ground-based approach for measuring aerosol properties at regional and global scales [6,7,8,9,10]. Besides, efforts have been also made for estimating the ADRE through satellite remote sensing or model-simulation (i.e., radiative transfer model (RTM)). For the model-simulated method, aerosol optical properties obtained from ground-based or remote-sensing observations have been used as input to the RTM to calculate ADRE at TOA and surface [11,12,13,14,15,16]. For the remote sensing method, one is to estimate ADRE by the linear relationship between AOD and concurrent upward SW flux at TOA obtained from satellite observations [17,18,19,20,21,22]; the other is to take Fclr as the minimum upward SW flux at TOA in clear sky during one month, but it is not suitable for the regions with high cloud coverage or aerosol loading such as the study region (YRB) [4]. In other words, the remote-sensing technique (linear fitting) is more suitable for estimating ADRE at regional and global scales.
During the past decades, a series of studies on aerosol optical properties and associated direct radiative effects continue to emerge over Amazonia [3,17], Southeast Asia [18,19], Northeast India [11,20,23,24,25,26,27,28,29], Central India [12], and global land [2,30,31,32,33] and ocean [4,5,21]. The results showed that the averaged ADRE at TOA was negative at global scale [4,5,6], but it varied regionally probably due to the comprehensive effects of aerosol optical properties and underlying surface characteristics. Recently, with the rapid development of urbanization and industrialization, China has become one of the major sources of anthropogenic aerosols. It triggers numerous studies for analyzing the aerosol optical and radiative properties in different regions of China. For instance, Sundström et al. [22] estimated ADRE at TOA using a linear regression of MODIS AOD and CERES SWF in Middle-East China; Xia et al. [14] analyzed the spatiotemporal distributions of aerosol optical and radiative properties at TOA and surface through ground-based data of 21 sites in China; Kang et al. [15] and Yu et al. [16] also reported the aerosol optical properties and ADREs based on RTM for Nanjing and Beijing, respectively. In general, previous studies in China mainly focused on the regions with intensive population and frequent industrial activities (short-term analyses), for example, Pearl River Delta (PRD), Yangtze River Delta (YRD) and Beijing-Tianjin-Hebei region. However, long-term systemic studies on the aerosol optical and radiative characteristics are still insufficient over the whole YRB due to the lack of observation sites, especially over the upstream and midstream regions of YRB. Furthermore, the midstream and downstream regions of YRB and Sichuan Basin have suffered from serious air pollution caused by the industrial production, vehicular emission, straw burning and the long-distance transport of dust particles from North China in spring [8,9,10,34,35,36]. The various aerosol sources and diverse surface types make the aerosol optical and radiative characteristics over YRB more complicated [37]. Therefore, to improve the knowledge of regional aerosol–climate interactions, it is necessary to estimate the aerosol optical properties and ADREs based on the satellite-retrieved method over the entire YRB.
In this study, comparisons between CARSNET and MODIS AOD550 are implemented to test the performance of satellite data over the different regions inside YRB during 2007–2011. Integrated analyses of the spatial and temporal (annual, seasonal and monthly) distributions of aerosol optical properties (AOD550, AE470–660 and WVC) retrieved from MOD08 over YRB during 2001–2015 are further performed. The spatiotemporal pattern of SW instantaneous ADRE (IADRE) at TOA for clear skies over YRB is quantitatively assessed by CERES-SFF data. Finally, a systemic uncertainty for IADRE is calculated and compared with previous studies.

2. Materials and Methods

2.1. Satellite and Ground Data

The China Aerosol Remote Sensing Network (CARSNET) is a ground-based remote sensing aerosol network with about 50 sites all over China, which is established by the China Meteorological Administration and other local meteorological institutes. Just like the Aerosol Robotic Network (AERONET), CARSNET has become a major resource for validating and analyzing aerosol properties over different areas of China [38]. There are similar accuracies for retrieving AOD between CARSNET and AERONET; for example, the bias for AOD between Lin’an (CARSNET) and ZFU (AERONET), two ground sites nearby YRD, is less than 0.02 [39]. The CARSNET retrieved AOD using the sun-photometer CE318 every 15 min at 4 wavelengths (440, 670, 870 and 1020 nm) for Level-1.0 (unscreened) and Level-1.5 (cloud-screened) data [40]. In the present study, Level-1.5 aerosol data at the three CARSNET stations (Figure 1) over different regions of YRB are selected to verify the performance of MODIS aerosol products. The time periods are 2007–2010, 2009–2011 and 2007–2011 for Chengdu (urban site), Dongtan (rural site) and Changde (rural site), respectively [38]. More details of CARSNET AOD are shown in Table 1.
The MODIS instrument aboard Terra (1999) and Aqua (2002) satellites provides land, atmosphere and ocean standard products (https://ladsweb.modaps.eosdis.nasa.gov/) in 36 spectral bands with a wide spectral range from 0.4 μm to 14.4 μm and at spatial resolutions of 250 m, 500 m and 1000 m [41]. In this study, the daily AOD550 values obtained from the Level-2.0 aerosol product (MOD04) are used. The Level-3.0 monthly atmosphere product (MOD08) at 1° × 1° spatial resolution is used to analyze the aerosol optical properties including AOD550, AE470–660 and WVC during 2001–2015. It should be noted that AOD550 and AE470–660 obtained from both MOD04 and MOD08 (Table 1) are based on the Deep Blue algorithm (DB), which is suitable for retrieving aerosol optical properties over bright surfaces like urban and desert regions [42,43].
The CERES_SSF_FM1_MODIS_Ed3A product from CERES instrument on Terra (https://ceres.larc.nasa.gov/order_data.php) used in this study is a set of Level-2.0 data (Table 1). It can provide cloud and aerosol properties derived from MODIS, meteorological information offered by the Global Modeling and Assimilation Office (GMAO) and radiances in shortwave (0.3–5.0 μm), window (8.0–12 μm) and total (0.3–200 μm) broadband channels at a spatial resolution of 20 km [44]. For this product, the measured radiances are converted to the spatiotemporal concurrent fluxes by the Angular Distribution Model (ADM) [45]. In addition, in terms of the different spatial resolutions between MODIS (10 km × 10 km) and CERES (20 km × 20 km), the cloud and aerosol properties such as the clear area percentage and AOD550 from MODIS are needed to be averaged into CERES footprint through the point spread function [45]. Notice that, in the CERES_SSF_FM1_MODIS_Ed3A product, the MODIS aerosol and cloud masking datasets have been corrected into CERES footprint and can be extracted directly.

2.2. Methodology

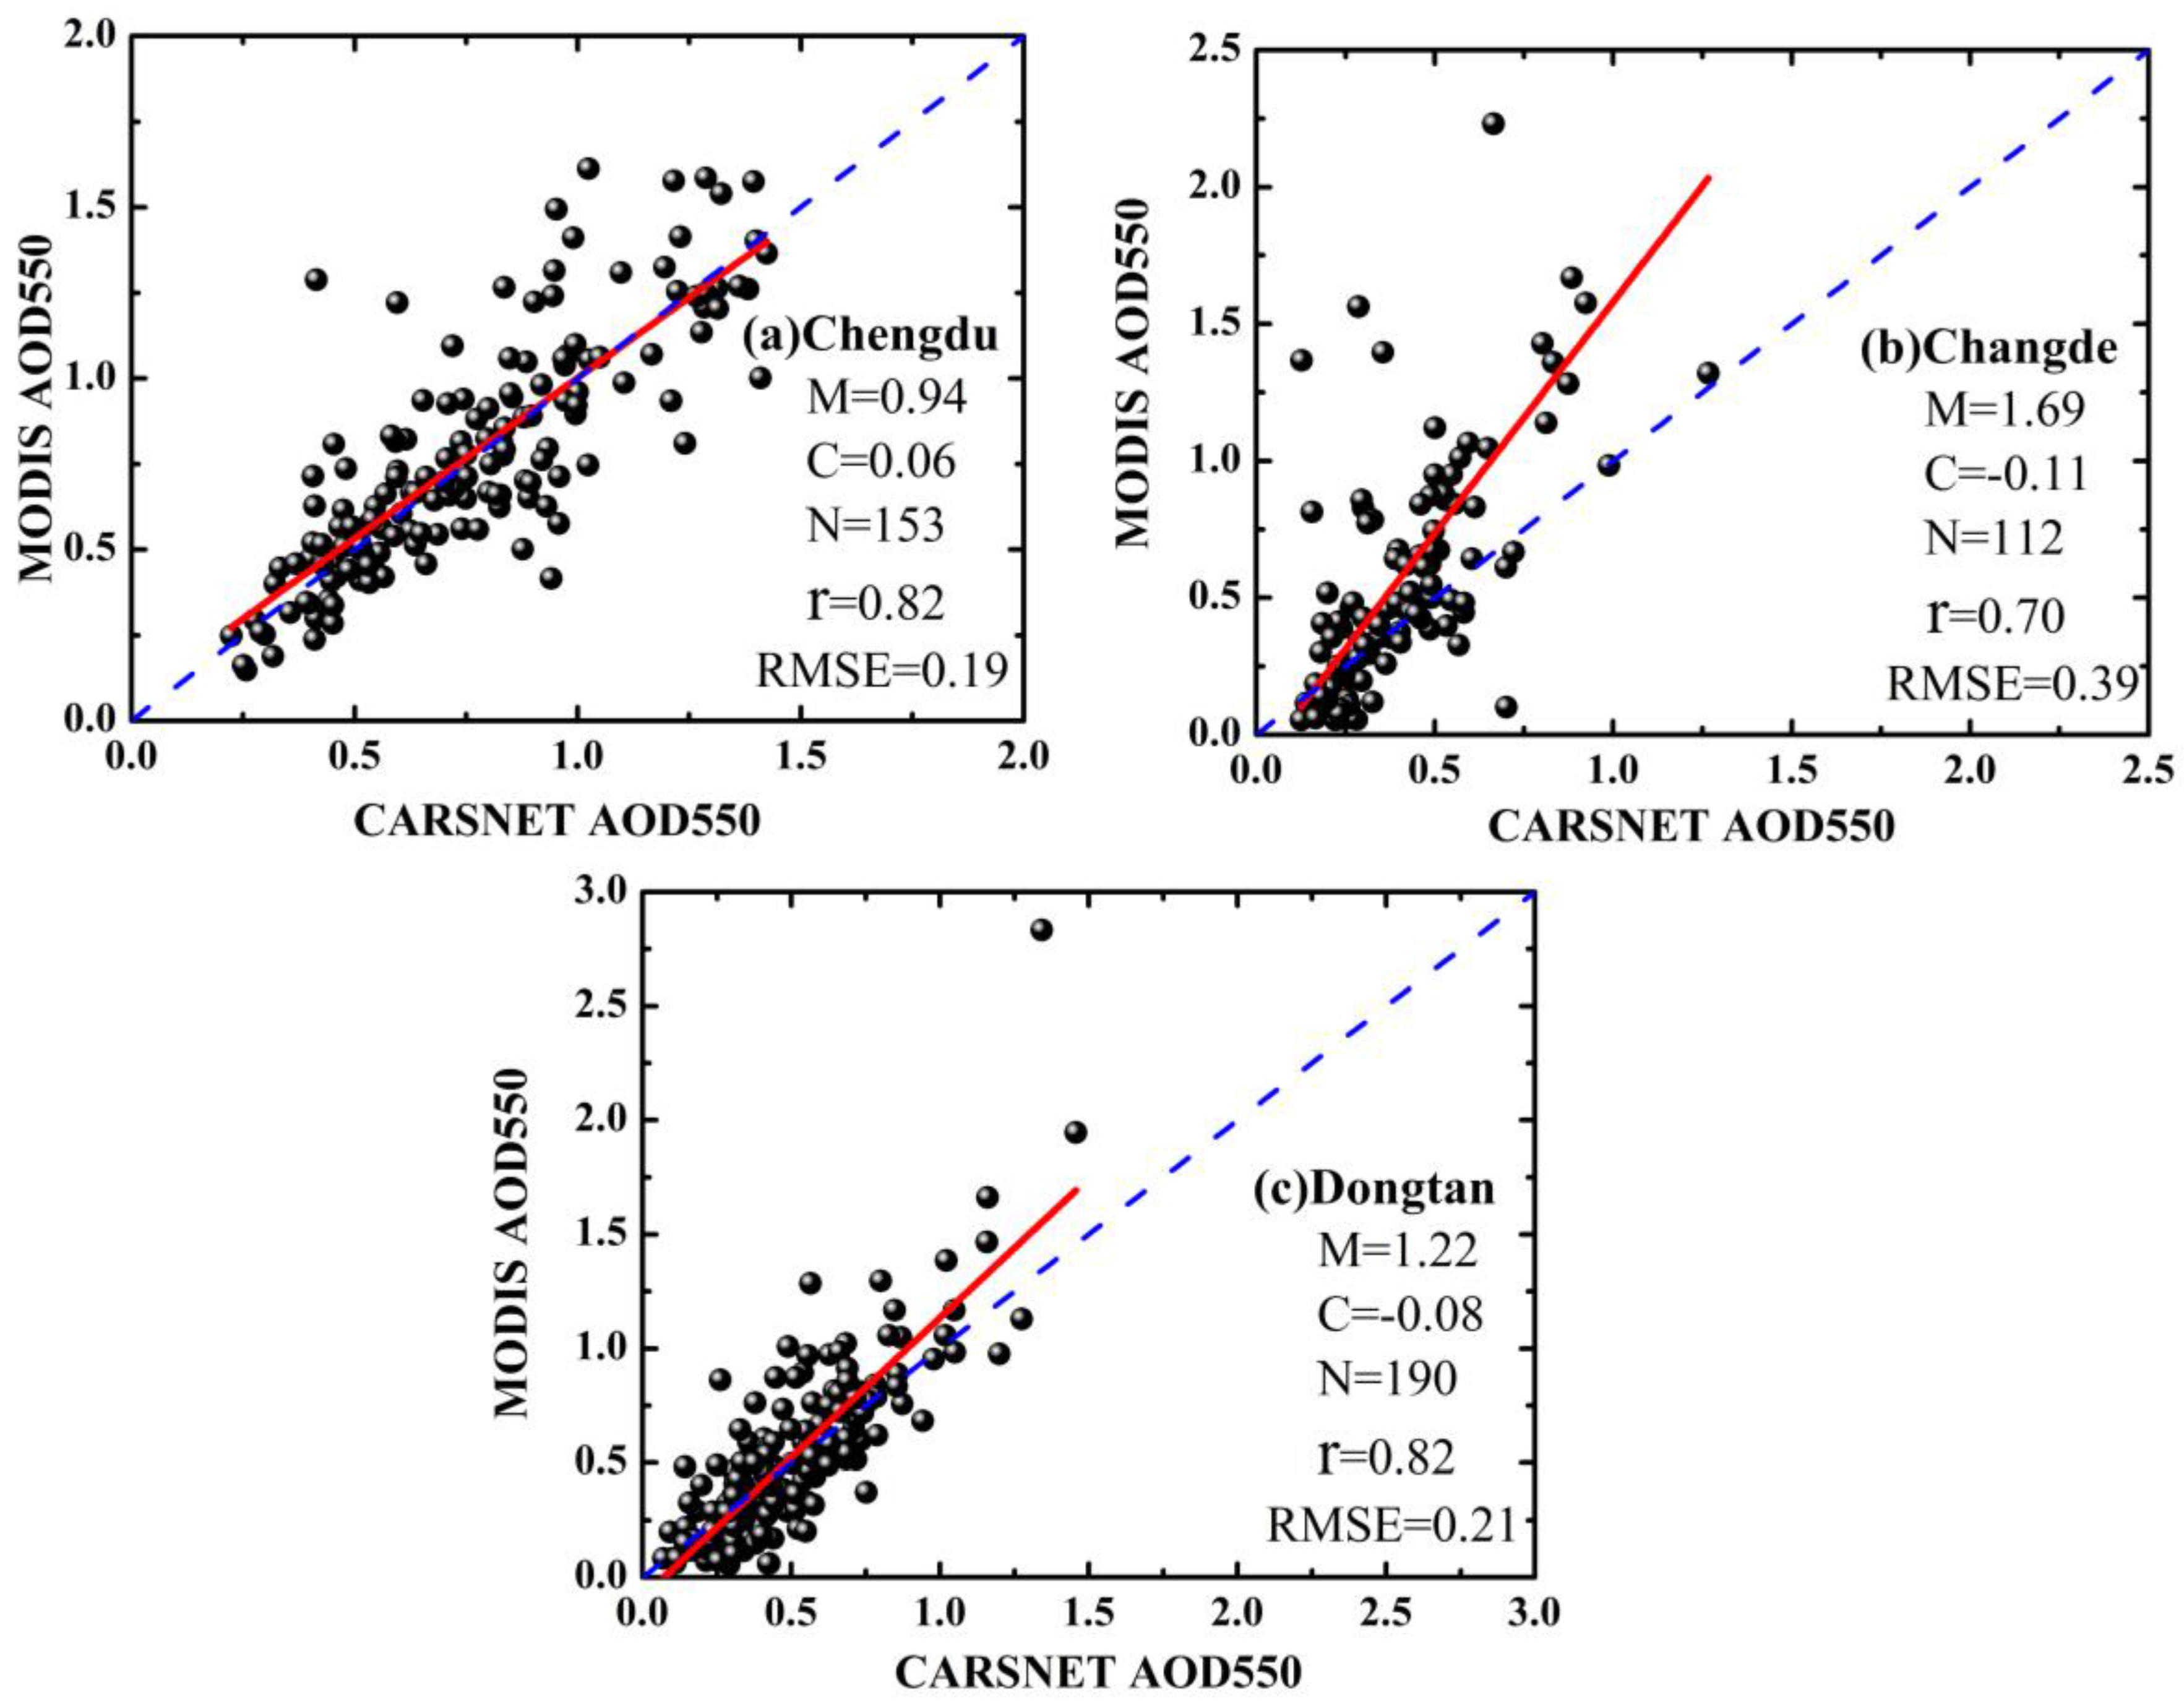
2.2.1. Validation between CARSNET and MODIS (DB) AODs

CARSNET AODs are measured at four wavelengths (440, 670, 870 and 1020 nm), while MODIS (DB) AODs are retrieved at three wavelengths (470, 550 and 660 nm). To estimate AODs at wavelength λ i , the Ångström equation is used:
A O D λ i = β λ i A E
where AE and β are the Ångström exponent and the turbidity coefficient, respectively. Considering that λ 1 (440 nm) and λ 2 (870 nm) are not affected by water vapor, AE and β can be obtained as follows:
A E = ln ( A O D λ 1 / A O D λ 2 ) ln ( λ 1 / λ 2 ) , β = A O D λ 2 λ 2 A E
Using Equations (1) and (2), we can obtain CARSNET AOD at 550 nm.
The MODIS (DB) AOD550 values are averaged over 50 km × 50 km areas centered at ground-based sites, while the CARSNET AOD550 values are averaged within ±30 min of the satellite passing time (Terra, 10:30 local time). The correlation coefficients of these two datasets at three stations (Chengdu, Dongtan and Changde) in China are analyzed.

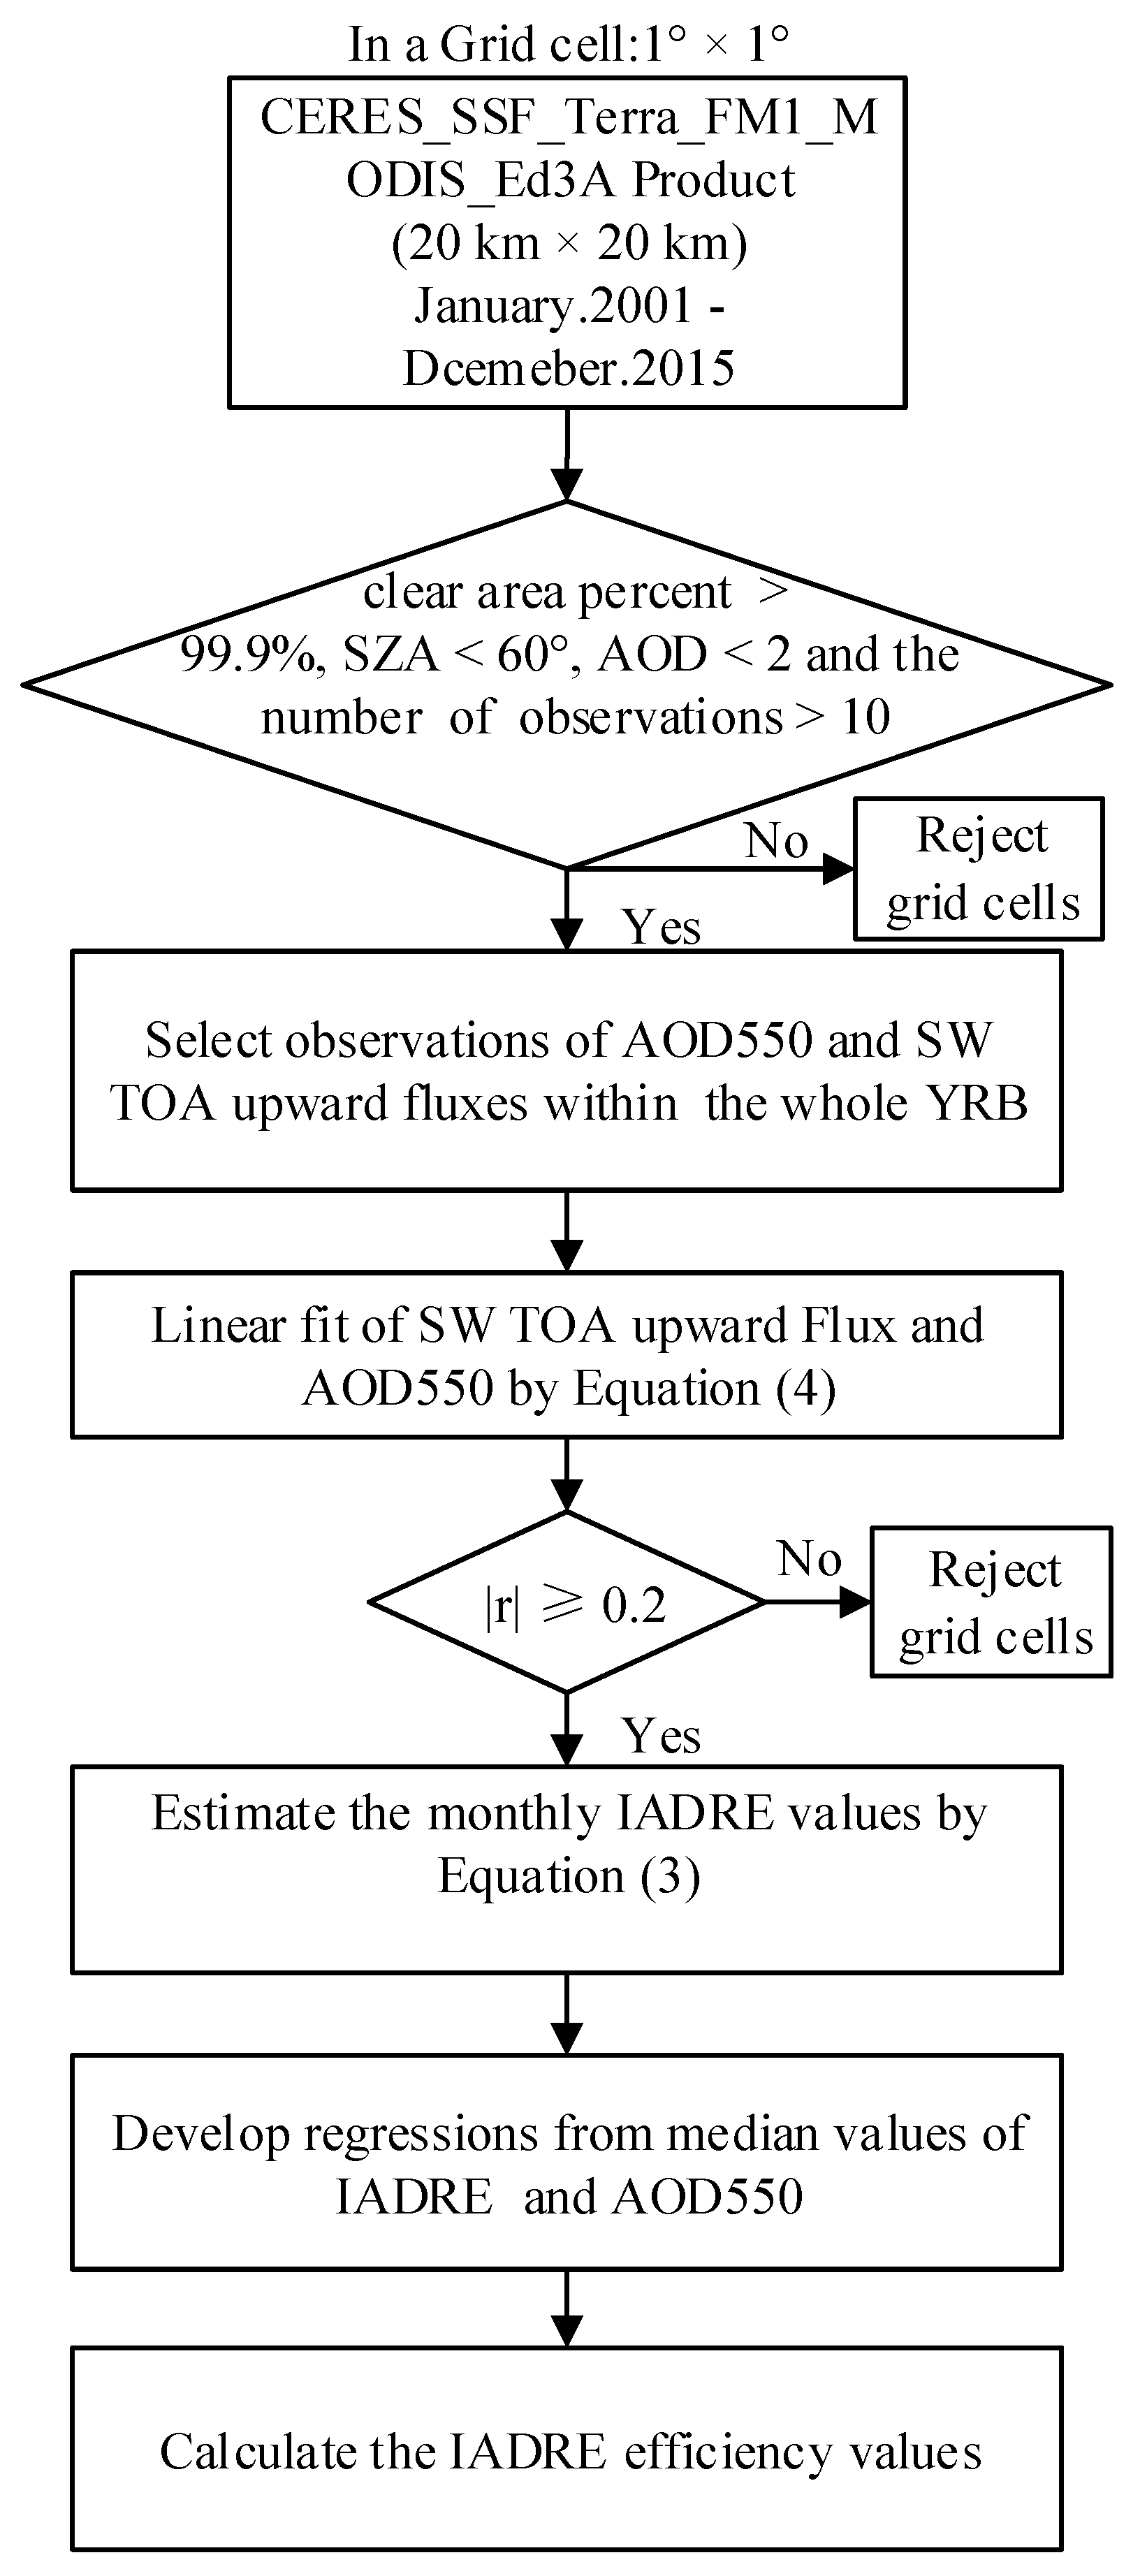
2.2.2. Calculation of Instantaneous ADRE

In clear sky, SW IADRE at TOA can be estimated by
I A D R E ( l a t , l o n ) = F c l r ( l a t , l o n ) F a e r o ( l a t , l o n )
where ( l a t , l o n ) is the given location coordinate, F a e r o ( l a t , l o n ) and F c l r ( l a t , l o n ) are upward SW fluxes with and without aerosols, respectively at the satellite’s passing time. F a e r o ( l a t , l o n ) can be directly observed from the CERES_SSF_FM1_MODIS_Ed3A product. However, since there is no case where the aerosol loading is zero at TOA in reality [4], F c l r ( l a t , l o n ) needs to be estimated using the linear regression between the upward SW flux at TOA and the concurrent AOD. The linear regression is implemented as follows:
(1) Read data: Read the upward SW flux (20 km × 20 km) at TOA and the concurrent MODIS AOD550 (20 km × 20 km) from the CERES_SSF_FM1_MODIS_Ed3A product. It should be noted that the MODIS AOD550 here has been corrected into CERES merged dataset and can be obtained directly from the CERES_SSF_FM1_MODIS_Ed3A product. According to Sena et al. [17], under the condition with excessive aerosol loadings (>2.0), multiple scattering of aerosols was likely to make the regression non-linearity, on the contrary, the relationship of upward SW flux and AOD550 was usually linear in the low AOD condition (<2.0). Therefore, the corrected MODIS AOD550 values are required to be smaller than 2.0. In addition, “longitude and colatitude of CERES FOV at surface”, “CERES solar zenith at surface” and “Clear area percentage at sub pixel resolution” are also read from the CERES_SSF_FM1_MODIS_Ed3A product for the qualifications in the following steps.
(2) Select valid observations in each 1° × 1° grid: Divide the study region (YRB) into 167 grid cells of 1° × 1°, and select the valid observations (SWFs and AODs) in each grid cells. The qualifications of valid observations are as follows: (1) The clear area percentage at sub pixel resolution (CERES footprint) is restricted to more than 99.9% for getting rid of cloud contamination. (2) According to Sundström et al. [22], the correction of CERES upward flux due to the normalization of the solar zenith angle (SZA) varied from –15 to 15 Wm–2 in Middle-East China. Therefore, SZA is limited to less than 60° for avoiding the oversized pixels. After collecting the valid observations for one month, the numbers of the valid values in each grid are counted. To build a successful linear regression, those grid cells containing less than 10 valid observations are eliminated.
(3) Build linear regression: Calculate the correlation coefficients of SWFs and AODs for each selected grid in Step (2). To build a successful linear regression, those grid cells with small absolute values of correlation coefficients (<0.2) are also eliminated [22]. After that, the linear regression in each grid is built to estimate F c l r ,
S W F = F c l r + α A O D
where S W F is the upward SW flux, F c l r is referred to the y intercept of the linear regression (i.e., the upward SW flux for AOD = 0), and α is the slope of the linear regression.
In addition, we calculate the IADRE efficiency by regressions from median values of IADRE and AOD. It is conducive to further analyze the effects of other aerosol optical prosperities except AOD on IADRE [19]. The detailed flowchart of our satellite-retrieved method for calculating IADRE at TOA over YRB during 2001–2015 is illustrated in Figure 2.

3. Results and Discussion

3.1. Validation of MODIS (DB) AOD versus CARSNET AOD

The regression analyses between MODIS (DB) and CARSNET AOD550 over Chengdu (2007–2010), Changde (2007–2011) and Dongtan (2009–2011) are shown in Figure 3. The parameters are slope (M), intercept (C), number of matched data points (N), correlation coefficient (r) and root mean square error (RMSE). The r values are 0.82, 0.70 and 0.82 over Chengdu, Changde and Dongtan, respectively, implying the good agreement between MODIS (DB) and CARSNET AOD550. The high correlations also provide possibility and confidence to analyze aerosol optical and radiative properties over YRB by MODIS DB aerosol retrievals. The MODIS (DB) AOD retrieval at Chengdu site is better than Changde and Dongtan due to the closer to 1.0 slope (M = 0.94), higher correlation (R = 0.82) and smaller error (RMSE = 0.19). The reason may be that the DB algorithm has advantage of retrieving AOD over urban region (e.g., Chengdu) than vegetated rural areas (e.g., Changde and Dongtan) [46,47]. Additionally, the non-zero intercepts (C) of the regressions may be caused by imperfect estimation in surface reflectance for 0.06 ± 0.04, –0.11 ± 0.08 and –0.08 ± 0.03, over Chengdu, Changde and Dongtan, respectively [47,48]. The validation result is consistent with previous studies over YRB; for example, Xie et al. [47] reported the validations of MODIS (DB) AOD550 versus CARENET AOD550 over 10 stations in China during 2005–2008.

3.2. Spatiotemporal Distributions of Aerosol Optical Properties

3.2.1. Temporal Variation of Regional Average

Figure 4 shows multi-year variation of monthly averaged aerosol optical properties (AOD550, AE470–660 and WVC) retrieved from monthly MOD08 during 2001–2015 over YRB. The annual mean AOD550 (Figure 4a) is about 0.49, which is higher than Kunming (0.28) [14], lower than YRD (0.61) and Anhui Province (0.63) [8]. There are distinct spatial distributions for aerosol loadings in different regions of YRB, due to the large standard deviation of AOD550 (0.31). In Figure 4b, the multi-year variation of regional average AE470–660 slightly fluctuates, indicating a stable aerosol mode over YRB. Generally, higher (lower) AE470–660 values indicate the dominance of finer (coarser) aerosol particles. Therefore, most AE470–660 values are larger than 1.0 (annual mean value is 1.42), suggesting fine aerosol particles are major aerosol types over most regions of YRB. Figure 4c shows a periodic change in WVC with the annual mean value (2.13 ± 0.94 cm), which is closely related to the rainfall pattern over YRB.
Figure 5 shows the monthly and seasonal variations of regional average aerosol optical properties, including AOD550, AE470–660 and WVC over YRB for the period 2001–2015. The monthly AOD550 (Figure 5a) is higher in April (0.61 ± 0.36) and June (0.58 ± 0.37) and lower in December (0.34 ± 0.23) and November (0.39 ± 0.26). The seasonal mean AOD550 is 0.58 ± 0.35, 0.52 ± 0.29, 0.44 ± 0.29 and 0.42 ± 0.29 (Figure 5b) for spring (MAM), summer (JJA), autumn (SON) and winter (DJF), respectively. The maximum AOD550 in spring is probably associated with frequent dust events from North China [8,9,49], while the minimum in winter and autumn may be due to the windy and dry weather affected by Mongolian anticyclone [50]. In summer, the higher rainfall reduces the presence of aerosol particles in the atmosphere, resulting in a decrease of AOD550 compared to spring, while the hygroscopic growth of fine-mode particles and the continuous biomass burning in June and July account for the increases in AOD550 compared to autumn and winter [34,35].
The monthly variation of regional average AE470–660 (Figure 5c) displays an opposite wave-like mode to AOD550, which increases from May (1.28 ± 0.38) and April (1.31 ± 0.37) to October (1.47 ± 0.24) and September (1.51 ± 0.25), indicating the dominance of fine particles over YRB. In Figure 5d, the seasonal mean AE470–660 in spring (1.33 ± 0.36) is lower than those in summer (1.42 ± 0.37), autumn (1.46 ± 0.27) and winter (1.45 ± 0.38), which is probably due to the long-distance transport of dust particles from North China in spring. Both monthly and seasonal variations of regional average WVC (Figure 5e,f) are unimodal curves, with peak values at July (4.05 ± 1.67 cm) and summer (3.79 ± 1.57 cm), which is associated with the Monsoon climate.
From the above, the monthly and seasonal variations of AOD550 over YRB are associated with the aerosol type (AE470–660), relative humidity (WVC), anthropogenic activity and terrain; these findings are consistent with previous investigations over Sichuan Basin [34] and Nanjing [15]. However, a poor correlation coefficient (<0.1) was observed among AOD, AE and WVC at Lanzhou [51].

3.2.2. Spatial Patterns of Temporal Variation of AOD

The spatial patterns of annual and seasonal mean AOD550 derived from MOD08 during 2001–2015 over YRB are illustrated in Figure 6. The high AOD550 (≥0.6) mainly appears over Sichuan Basin and the midstream and downstream regions of YRB. These high-AOD550 regions are usually centered on metropolises such as Shanghai, Wuhan and Chengdu (with intensive anthropogenic activities). Another potential reason for high aerosol loadings over Sichuan Basin is associated with its unique Basin topography, resulting in a low wind speed throughout the year, which is detrimental to the diffusion of aerosol particles. The low AOD550 (≤0.3) is mainly located in high Mountains over the upstream region of YRB, especially in Hengduan Mountains (<0.1) due to less human activities and dense forest vegetation [8]. In other words, AOD550 decreases with increasing altitude and increases with rising human activities. This result is consistent with previous studies in Nanjing [15], YRD and Anhui Province [8]. Recently, Xia et al. [14] analyzed the spatiotemporal distribution of aerosol optical properties over China using ground-based data at 21 stations; their results showed that the AOD550 over Middle-East China was generally larger than 0.5 with the lowest values (<0.1) appearing in Tibet Plateau.
Figure 7 shows the seasonal distribution of AOD550 over YRB; there is a similar spatial pattern with the annual pattern in Figure 6. However, the magnitudes vary greatly for each season. General speaking, the AODs550 in spring and summer are higher than those in autumn and winter except for the Sichuan Basin. Meanwhile, the seasonal range of AOD varies more significantly over high-value AOD areas. The highest AOD550 appears in spring over most of YRB due to the dust storms from North China. The low AOD550 in autumn and winter for most areas, expect Sichuan Basin, is probably caused by the windy and dry weather. In winter, high mountains around the Sichuan Basin block the invasion of cold air and make the local air flow inadequate, which does not aid the diffusion of the local aerosol particles. Furthermore, the high relative humidity caused by the winter morning fogs also accounts for high AOD550 in the Sichuan Basin [34].

3.2.3. Frequency Distribution of Temporal Variation

Figure 8 illustrates the frequency distribution of annual mean AOD550, AE470–660 and WVC at 1° × 1° grid cell over YRB for the period 2001–2015. Approximately 92% of AODs are less than 1.0, while only about 1% of AODs are higher than 1.4. These are similar to the observations at Wuhan, where nearly 78% of AODs range from 0.40 to 1.23 [35]. In Figure 8b, the frequency distribution of annual mean AE470–660 shows a single peak curve with the maximum frequency (32%) appearing around 1.5; AE470–660 more than 1.0 and less than 0.8 accounts for 90% and 3%, respectively. This indicates that fine aerosol particles are major aerosol types over YRB. In comparison, the annual mean AE470–660 at Wuhan roughly changes from 0.8 to 1.68, and the highest frequency (73.1%) is in the range of 1.05–1.55 [35]; the frequency of AE470–660 less than 0.6 is about 1%, while AE470–660 larger than 1.8 accounts for 0.3% over Shanghai [8]. Besides, the annual mean WVC ranges from 0.2 to 7.6 cm and 71% of the WVC values are in the range of 0.2–3 cm (Figure 8c).
Figure 9a shows the seasonal frequency of AOD550; the high AOD550 values are gathered between 0.1–0.9, and the related frequencies are 81%, 88%, 93% and 94% during spring, summer, autumn and winter, respectively. In spring, the maximum frequency (21%) appears around 0.7 and 19% of the AOD550 values are higher than 0.9. There is a wide distribution of AOD550 in the range 0.1–2.3 during summer; 4% of the AOD550 values are less than 0.1 and nearly 6% of them are larger than 1.1, which are due to various aerosol sources (e.g., dust, smoke and pollution) in this season. The highest frequencies are 23% and 28% for AOD550 around 0.4 during autumn and winter, respectively.
The frequency distribution of AE470–660 for each season display a similar unimodal curve (Figure 9b); the maximum frequency is about 26%, 30%, 35% and 32% in the range of 1.5–1.6 during spring, summer, autumn and winter, respectively. Besides, nearly 13% of the AE470–660 values are less than 1.0 in spring, but the AE470–660 values (<1.0) only account for 4%, 3% and 4% in summer, autumn and winter, respectively. This indicates that there are relatively large particles during spring compared to other seasons, mostly due to the frequent dust events in this season.
In Figure 9c, the seasonal mean WVC ranges from 1 to 8 cm in summer, while it is concentrated in a narrow range of 0–3.5 cm in winter. Approximately 64% of the WVC values are around 3–6 cm and 6% are larger than 6 cm during summer, while nearly 90% of the WVC values are less than 1.5 cm in winter. During autumn, almost 90% of WVC values vary from 0 to 4 cm and only 4% of the WVC are more than 5 cm. In spring, the highest frequency value of WVC is 20% around 2 cm and nearly 90% of the WVC values are in the range of 0–3 cm. These seasonal frequencies of WVC are consistent with the seasonal variations of monsoon climate over YRB.

3.3. Spatiotemporal Distribution of IADRE

3.3.1. Temporal Distribution of IADRE

The annual variations of SW IADRE at TOA over YRB from 2001 to 2015 are shown in Figure 10a and Table 2. The annual IADRE ranges from the highest value of −46.65 ± 11.32 Wm−2 in 2001 to the lowest value of −27.99 ± 6.12 Wm−2 in 2013, with the multi-year average value (−35.60 ± 6.71 Wm−2). The values of annual IADRE at TOA (Table 2) are all negative, indicating that aerosols scatter solar shortwave radiation back to the space and hence produce a cooling effect at TOA. In this study, the annual mean IADRE over the whole YRB based on the satellite-retrieved method is compared with previous studies (Table 3); for example, the annual mean IADRE was −12.8 ± 2.1 Wm−2 over Southeast Asia using CERES_SSF_Terra datasets from 2001–2010 [19]; similarly, the seasonal IADRE values varied from −4.43 Wm−2 in post-monsoon to −70.66 Wm−2 in monsoon using CERES_SSF_Aqua datasets over Northeast India during 2002–2013 [20]. Additionally, the linear regression between the 15-year monthly MODIS AOD550 and IADRE is also shown in Figure 10b. The IADRE has a good correlation with AOD550 (r = 0.63), representing that the cooling effect at TOA is partly caused by aerosol loading over YRB.
The monthly IADRE (Figure 11a) ranges from a maximum in April (−41.95 ± 6.38 Wm−2) to a minimum in December (−24.76 ± 7.33 Wm−2). Generally, the seasonal mean IADRE values (Figure 11b) are higher in spring (−40.01 ± 8.30 Wm−2) and summer (−40.71 ± 6.86 Wm−2), but lower in autumn (−32.52 ± 6.52 Wm−2) and winter (−29.19 ± 7.04 Wm−2), which are similar to the seasonal variation of MODIS AOD550 (Figure 5b). The relatively higher IADRE and larger AOD550 in spring and summer probably illustrate the connection between aerosol loading and cooling effect at TOA. In addition, the monthly and seasonal variations of IADRE over YRB are also associated with the periodic change of WVC (Figure 9). According to previous research [17,22], IADRE is estimated by the linear regression of CERES AOD and SWF in the condition of unrealistically low WVC. This may lead to an overestimation of IADRE due to the neglect of radiation attenuation caused by WVC [17]. Besides, the aerosol hygroscopic growth caused by WVC increases the value of AOD in summer (Figure 8 and Figure 9), hence results in the large negative IADRE in this season over YRB. Compared with other regions in China (Table 3), the seasonal variations of IADRE over YRB are consistent with previous research. For example, the 24 h-averaged ADRE values in Nanjing based on the RTM were −21.9 Wm−2, −30.0 Wm−2 and −31.5 Wm−2 during autumn, summer and spring, respectively [15]; the model-retrieved ADREs in Beijing were in the range of −66 Wm−2 to −116 Wm−2 and −13 Wm−2 to −23 Wm−2 for dust days and non-dust days, respectively [16].

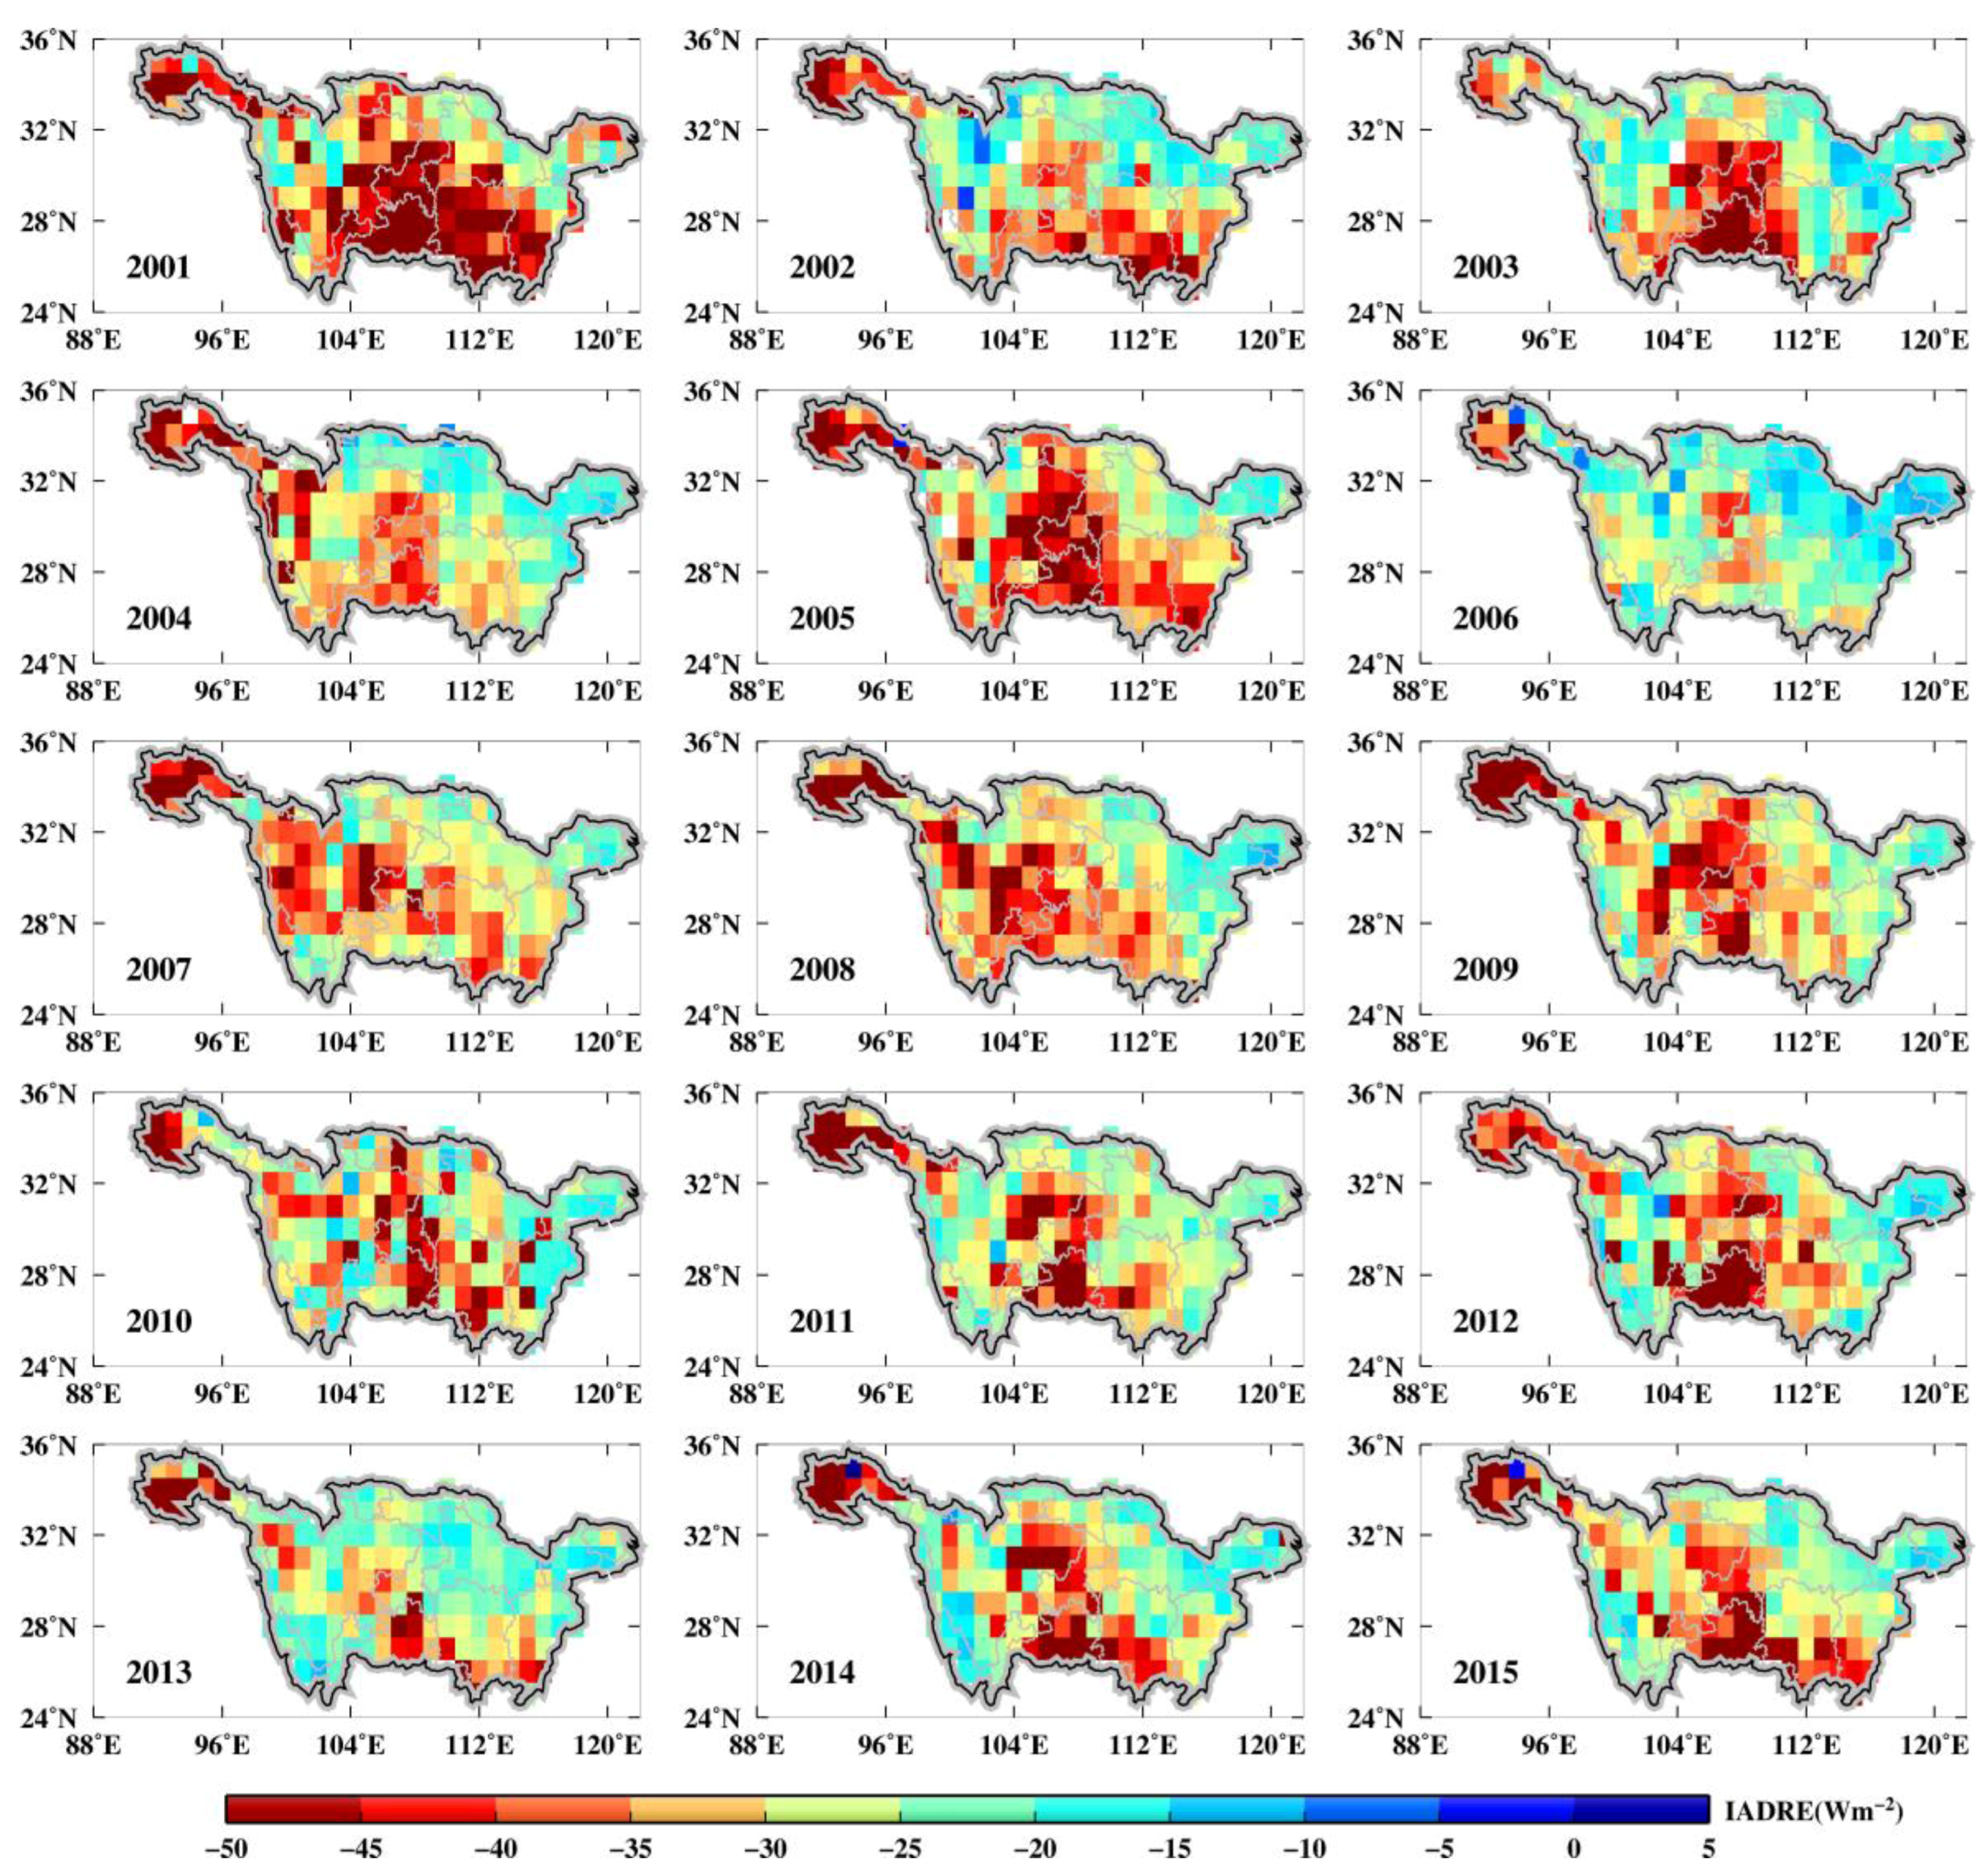
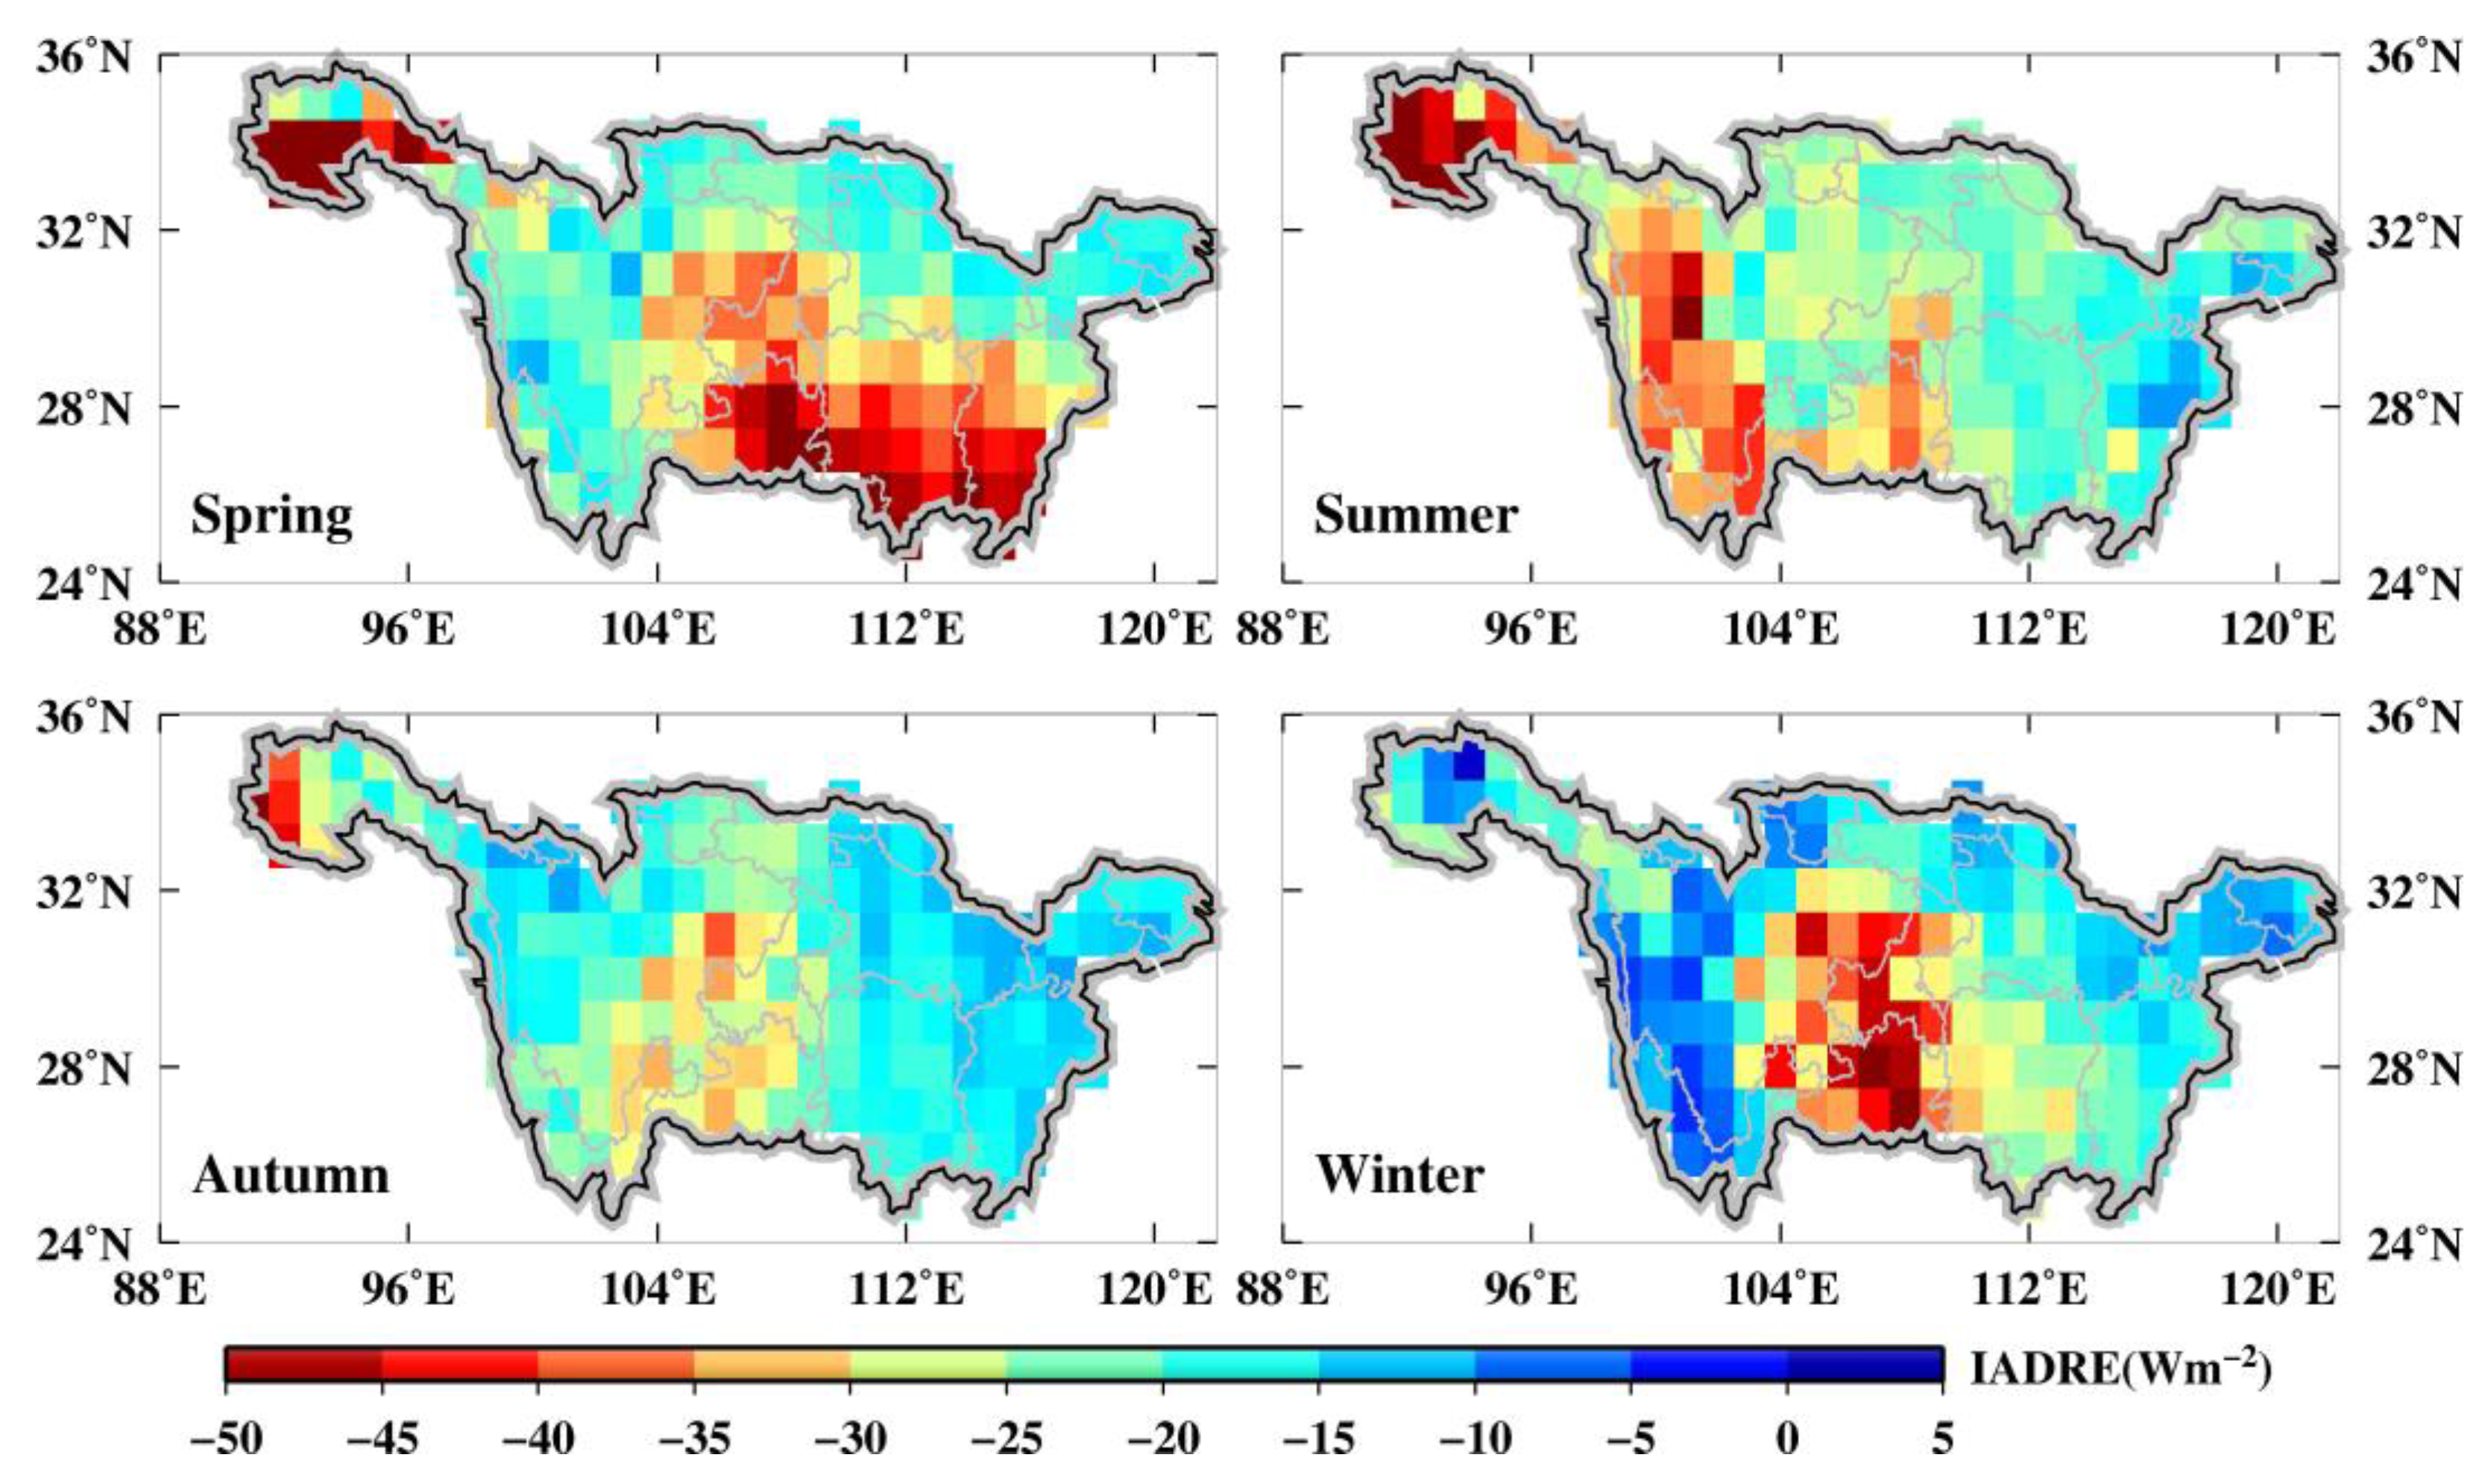
3.3.2. Spatial Patterns of IADRE

Figure 12 depicts the annual spatial distribution of IADRE at TOA under cloud-free conditions over YRB during 2001–2015. Although the regional average IADRE values (Table 2) are all negative, there are still few positive IADRE values (Figure 12) over 1° × 1° grid cells, probably due to the comprehensive effect of aerosol optical properties and surface reflectivity. Generally, positive IADRE tends to be observed over regions with strong absorbing aerosols and high surface reflectivity [2,3]. Assuming that the aerosol optical properties remain constant over bright surfaces, the aerosol layer appears “darker” than its background. This condition may reduce the upward SW flux (i.e., Faero), resulting in less negative or even positive IADRE at TOA. For example, during 2000–2009 in Amazonia, the annual mean ADRE calculated using linear regression between upward CERES SWF and MODIS AOD over cerrado (−4.6 ± 1.6 Wm−2) was less negative than the value over forest (−6.2 ± 1.9 Wm−2), mainly due to the higher surface reflectivity over cerrado [17]. In addition, the absorbing aerosols can cause a warming (positive) effect at TOA by directly absorbing solar SW radiation. Overall, more than 99% of the grid cells in YRB have negative IADRE values (Figure 12), indicating cooling effects at TOA.
The spatial distribution of IADRE in Figure 12 matches well with AOD over Sichuan Basin and the midstream region of YRB, indicating that the high IADRE (>−45 Wm−2) is mainly due to the large aerosol loading (AOD550 > 0.5) over these areas. On the other hand, the IADRE values remain largely negative (>−45 Wm−2), while the AOD550 values are generally extremely low (<0.1) over the source area of YRB. In contrast, the large aerosol loadings (AOD550 > 0.6) over YRD do not translate into high IADRE values (<−30 Wm−2). These interesting phenomena may be due to the reason that IADRE is influenced by the combination of aerosol optical properties and surface reflectivity over different ecosystems of YRB. Usually, the IADRE values are more negative over dark surfaces with low reflectivity such as forest areas in the Southeast Tibet Plateau, than those over high reflective surface such as urban areas within YRD. Besides, the absorbing aerosols (e.g., black carbon particles) gradually increase with the rapid development of industrial activities over urban areas within YRD, which are helpful to absorb solar radiation and hence change IADRE from negative to less negative or even positive values.
The spatial distribution of IADRE over each 1° × 1° grid cell within YRB (Figure 13) differs greatly for each season, and this is not well consistent with the seasonal spatial pattern of AOD550. In spring, the high IADRE values (>−45 Wm−2) appear in the midstream region of YRB, Sichuan Basin and the source area of YRB; the magnitude of negative IADRE in spring is higher than that in other seasons. In summer, the high IADRE values (>−45 Wm−2) are gathered from the source region of YRB to the Hengduan Mountain, which is possibly due to the comprehensive effects of surface properties and dust aerosols [52]. It is revealed that dust aerosols in the Tibet Plateau were transported from the Taklimakan Desert during summer, resulting in a significantly cooling (negative) effect at TOA [53]. However, IADRE over the Sichuan Basin in summer is less negative than that in winter, which may be due to larger aerosol loadings in winter than summer over the Sichuan Basin. There is a decreasing trend for IADRE except the Sichuan Basin from autumn to winter; then the IADRE values over the upstream region of YRB and the northern YRB are decreasing to the minimum (<−10 Wm−2) in winter. One reason for the above may be that the surface reflectivity rises with the decreasing vegetation coverage in autumn and the presence of snow in winter [54]. The relatively high concentration of absorbing black carbon aerosols in winter may be another reason [55].

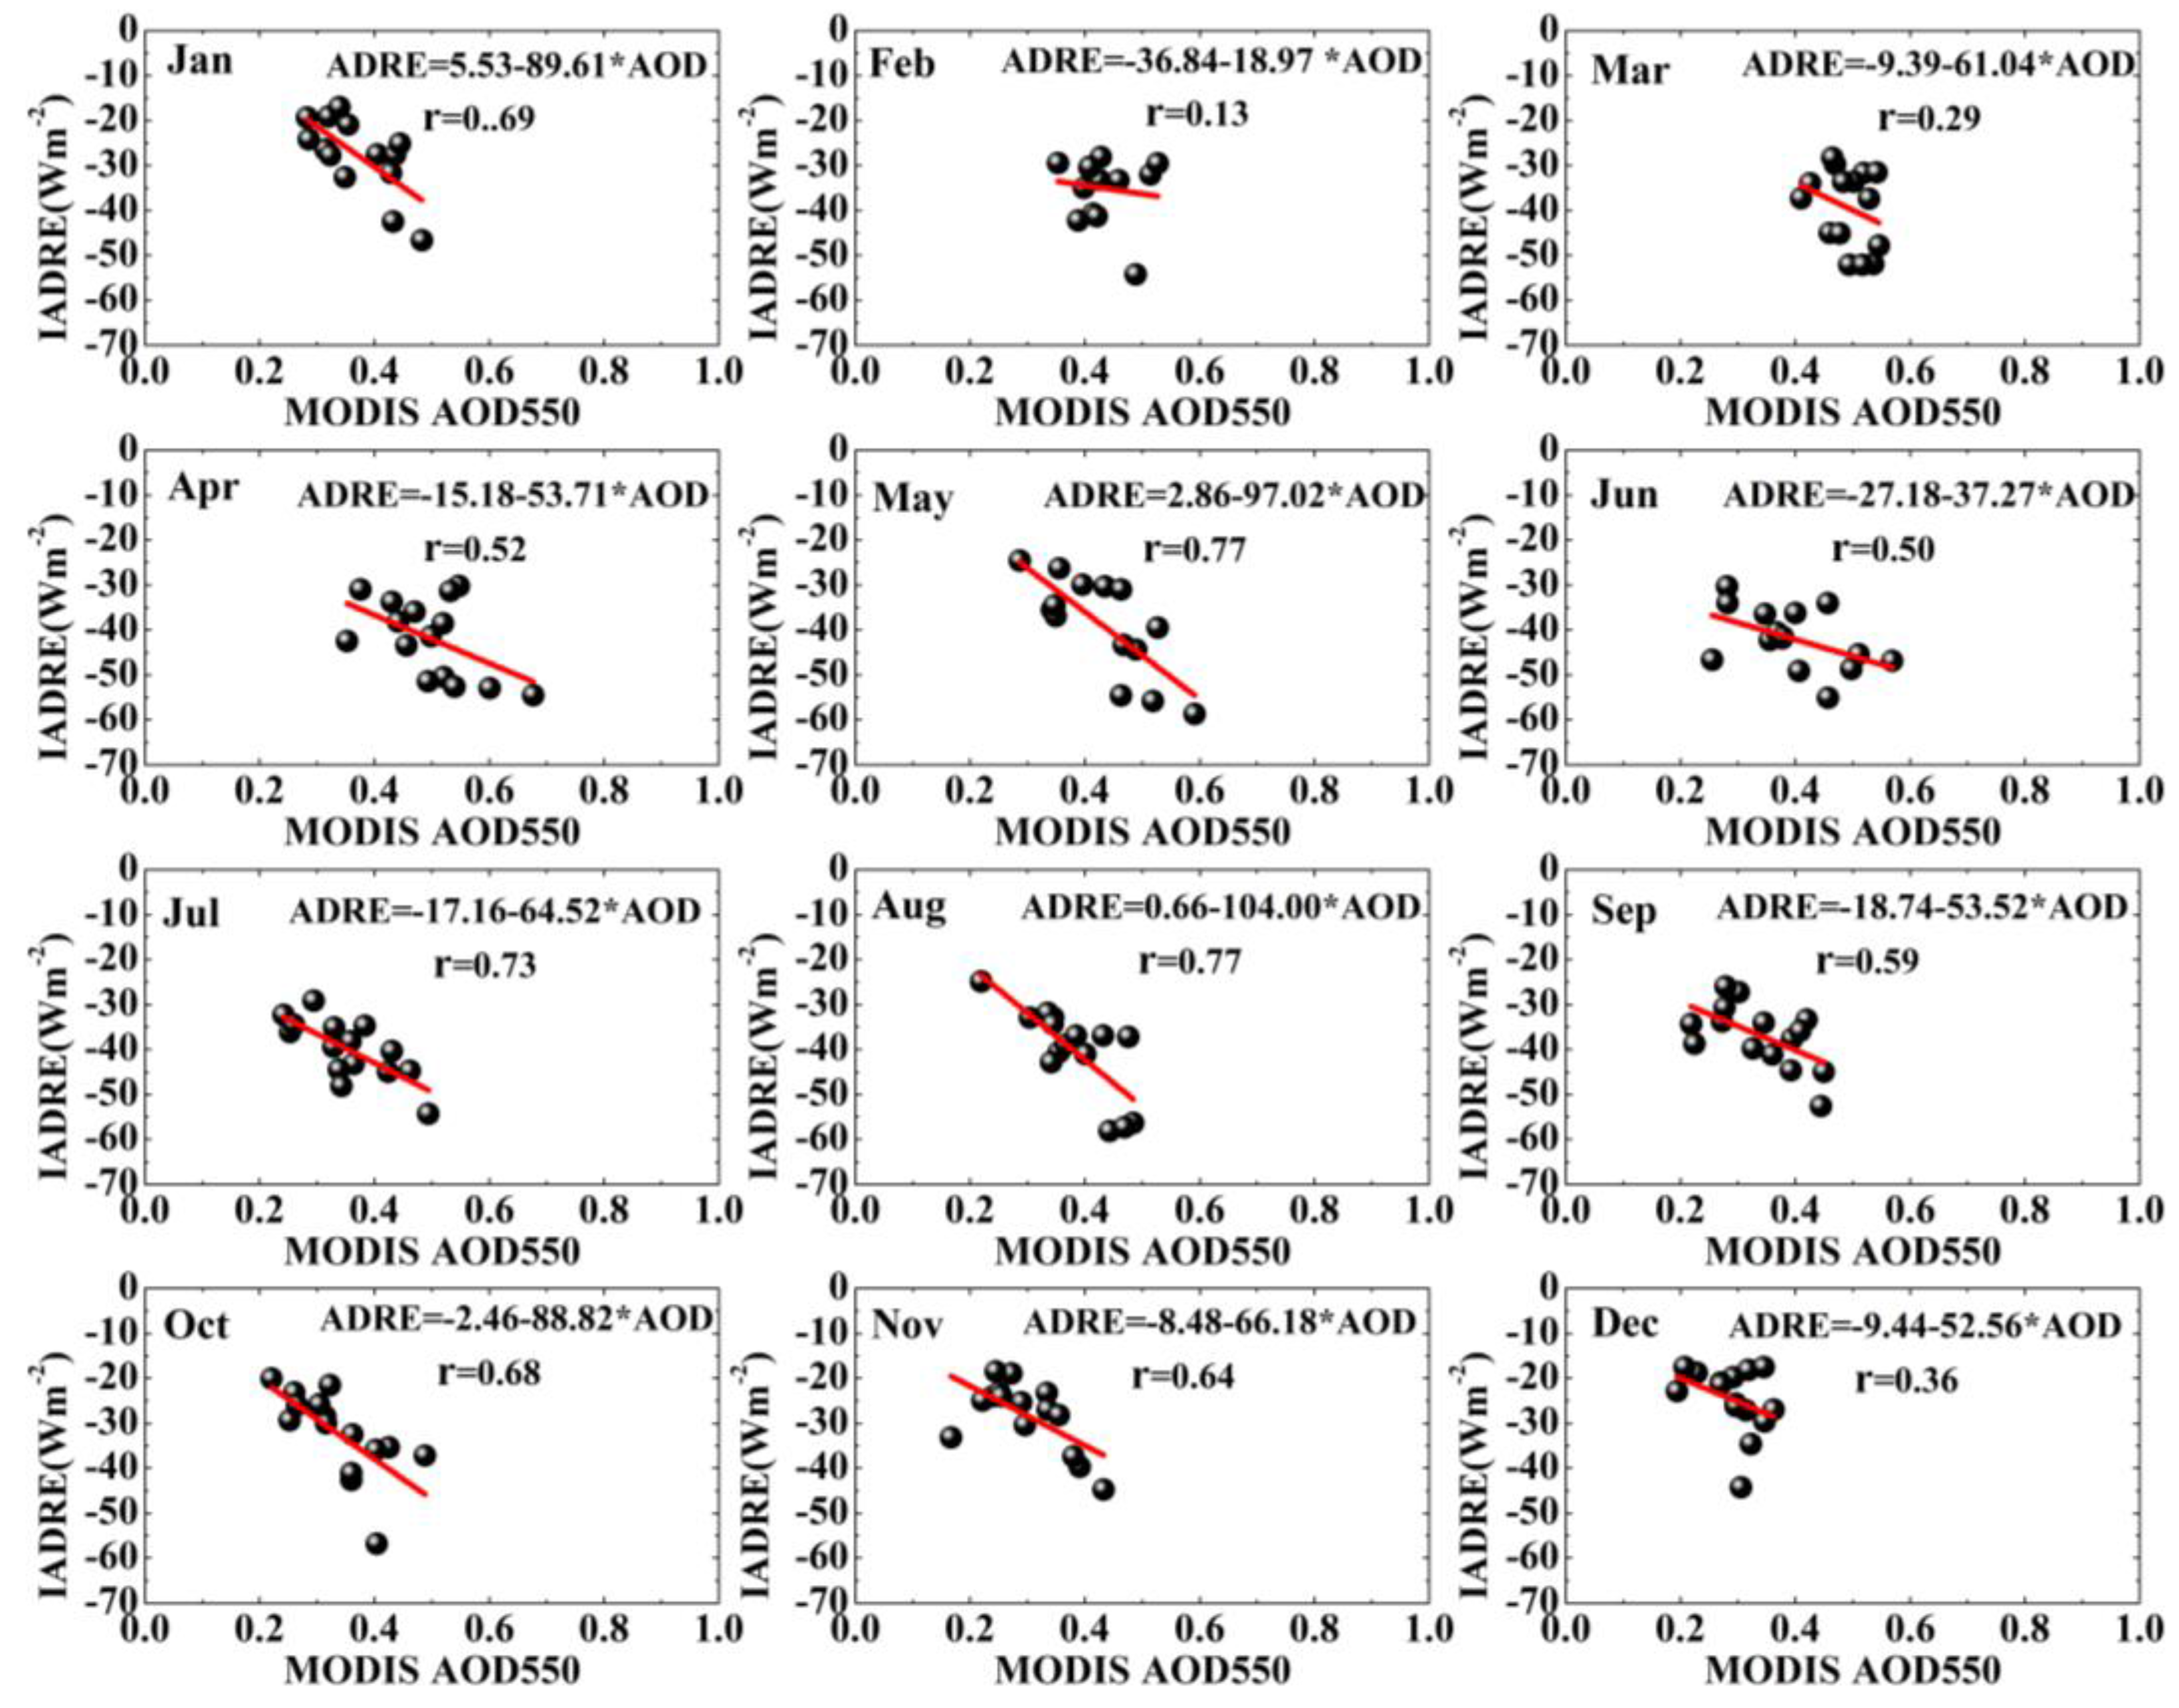
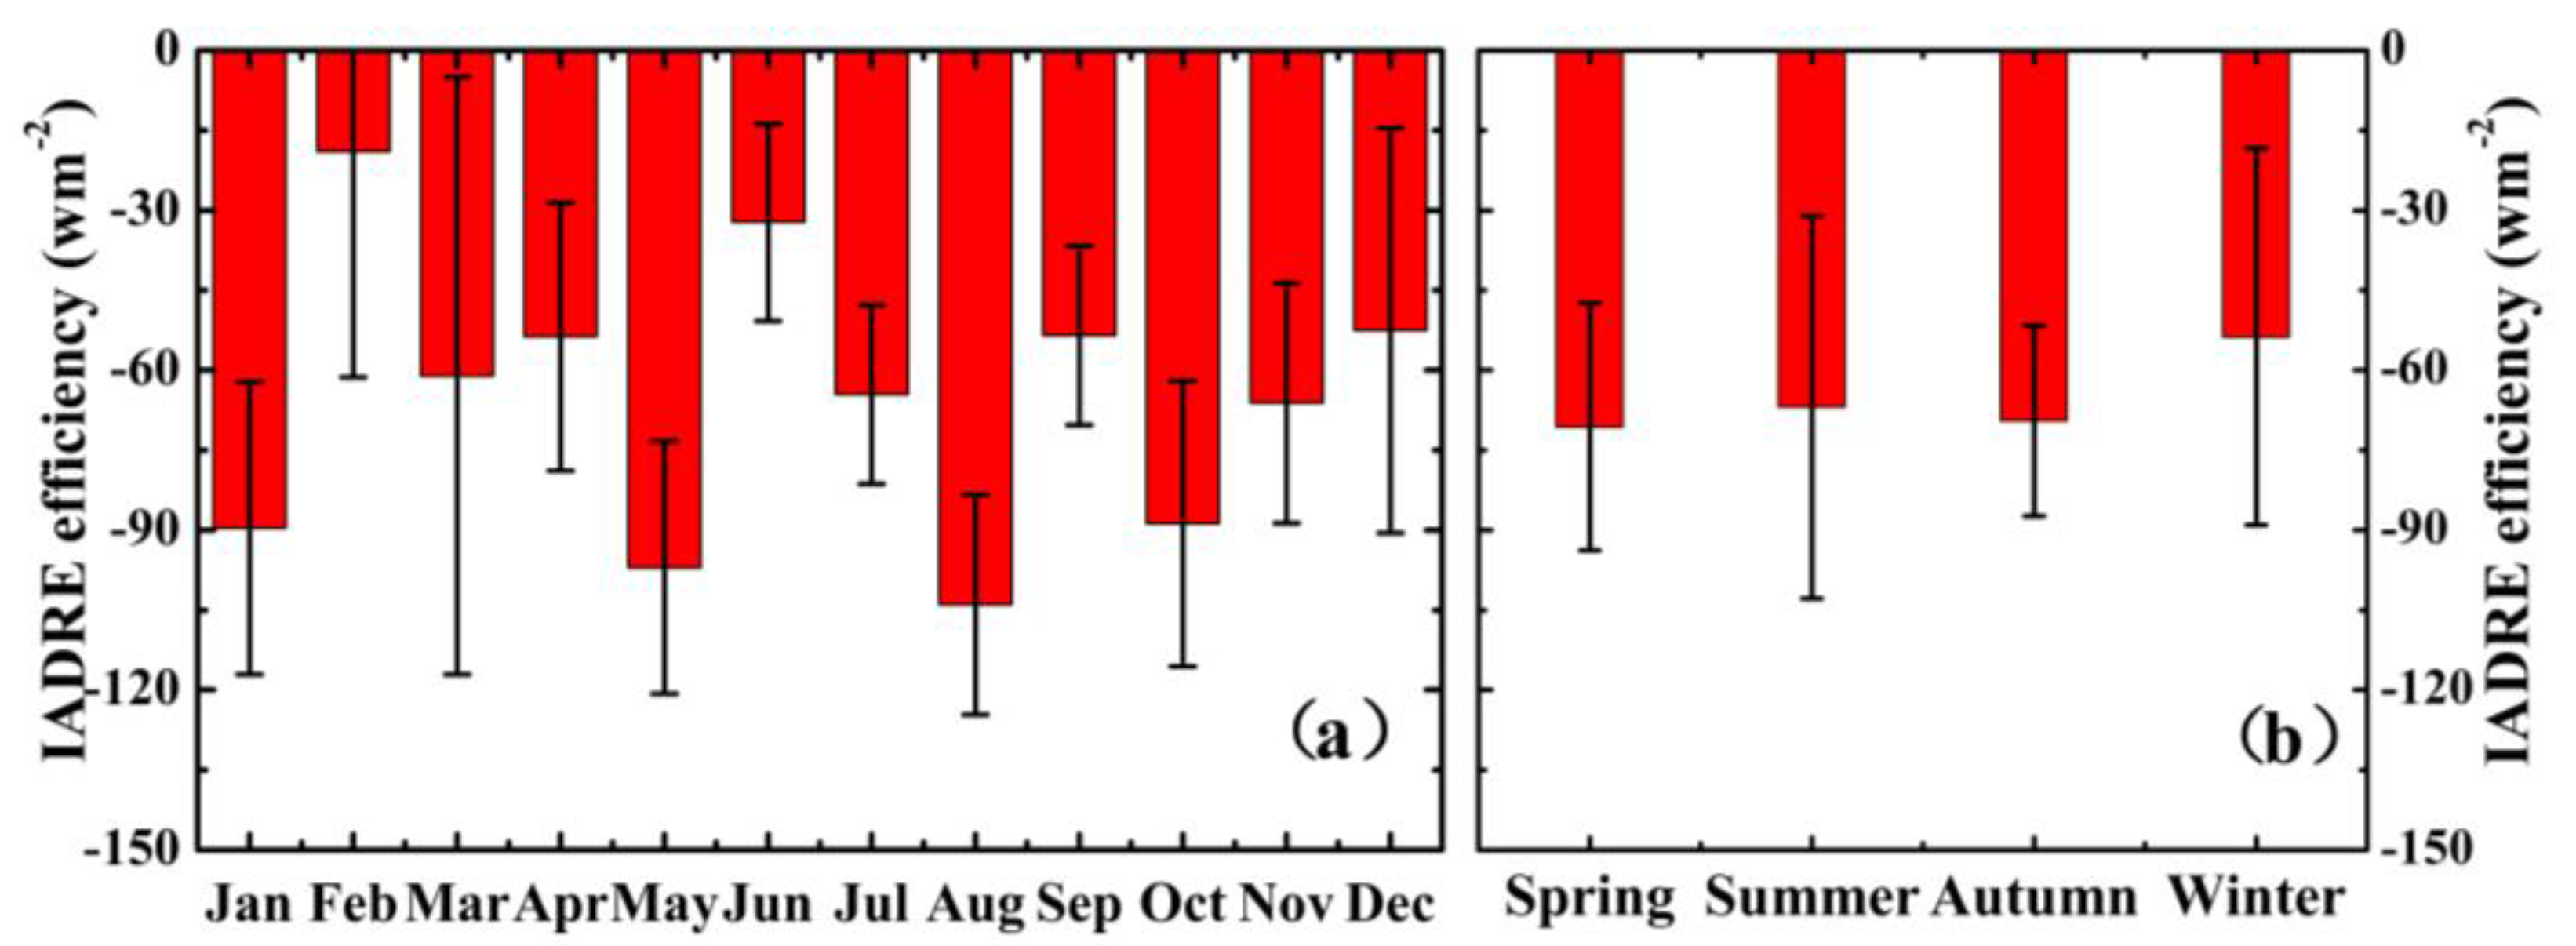
3.3.3. Temporal Distribution of IADRE Efficiency

The IADRE efficiency is defined as the value of IADRE per unit AOD (Wm−2τ−1), which is a key parameter to analyze the climatic effect of aerosol. It can be estimated from the slope of linear regression between IADRE and concurrent AOD550 (from CERES_SSF product) in clear skies. However, the slopes are likely to be affected by outliers probably due to SZA, WVC, aerosol type and surface reflectivity [22]. In order to minimize these effects, the median values of IADRE and AOD550 over each 1° × 1° grid cell are used for the linear regressions. The procedure for calculating the monthly IADRE efficiency over YRB for the period 2001–2015 is illustrated in Figure 14. The values of IADRE in each month appear more negative with increasing AODs. Generally, the IADRE efficiency becomes more negative with the lower fine mode fraction [19]. Meanwhile, the lower surface reflectivity can also increase the magnitude of IADRE efficiency [20].
Figure 15 shows the monthly and seasonal shifts of regional average IADRE efficiency over YRB during 2001–2015. The monthly mean IADRE efficiency (Figure 15a) varies from the largest negative value in August (−104 ± 20.65 Wm−2τ−1) and May (−97.01 ± 23.97 Wm−2τ−1) to the smallest negative value in February (−18.96 ± 42.33 Wm−2τ−1) and June (−32.27 ± 18.46 W−2τ−1). The seasonal mean IADRE efficiency (Figure 15b) is −70.58 Wm−2τ−1, −66.93 Wm−2τ−1, −69.51 Wm−2τ−1 and −53.71 Wm−2τ−1 in spring, summer, autumn and winter, respectively. The 15-year mean IADRE efficiency over YRB is −65.18 Wm−2τ−1, which is similar to previous results over YRD (Table 3) in the range of −48 to −59 Wm−2τ−1 [14] and −26.05 to −45.46 Wm−2τ−1 at Nanjing [15]. Furthermore, the error bars for the monthly and seasonal mean IADRE efficiencies exhibit large values in Figure 15, revealing large regional differences within YRB.

4. Uncertainty Analysis

In this section, the uncertainty in IADRE from CERES and MODIS datasets is quantitatively assessed using the satellite-retrieved method. Obviously, it is a challenge due to diverse systematic uncertainties in calibration of CERES radiances (±0.4 Wm−2), unfiltering of CERES radiances at TOA (±0.4 Wm−2), conversion of CERES TOA radiances to fluxes by ADMs (±0.4 Wm−2), cloud contamination (±0.5 Wm−2) and estimation of SW fluxes at TOA without aerosols in clear sky (i.e., Fclr) [2,3,18,45]. Among them, the calculation of Fclr is the largest error source for uncertainty. Since Fclr is estimated from the linear regression between CERES upward SW flux and concurrent MODIS AOD550, the systematic bias in MODIS AOD retrieval (i.e., the data on the “x-axis”) will lead to a systematic uncertainty of the intercept (Fclr). According to previous studies [3,5,18], the systematic MODIS AOD bias is about ±0.05. Besides, the 15-year mean IADRE efficiency (the median value of slope for the regression) is estimated to be 65.18 Wm−2τ−1. Therefore, the systemic uncertainty in Fclr caused by the linear regression is approximately translated to ±1.6 Wm−2. Furthermore, assuming that the above-mentioned uncertainties (Table 4) are uncorrelated, the total uncertainty in IADRE can be estimated to be (0.42 + 0.42 + 0.42 + 0.52 + 1.62)1/2 = 1.8 Wm−2 in the present study as estimated by [56]:
U t = exp [ ( log U i ) 2 ] 1 2
where U t and U i represent the combined uncertainty and the independent uncertainty in IADRE, respectively [3,5,18]. Based on the same methodology of estimating systematic uncertainties in IADRE, the Fclr (total) uncertainty was ±1.1 Wm−2 (±1.39 Wm−2) in Amazonia [3] and ±1.05 Wm−2 (±1.2 Wm−2) in Southeast Asia [18].
Undoubtedly, apart from the above-mentioned sources of uncertainties, the total uncertainties for IADRE are also affected by other complex factors such as WVC, Sun–Earth distance, aerosol type and surface reflectivity [57,58]. To reduce uncertainties in the IADRE, instrument calibrations, retrieved algorithms and multivariate data fusion need to be further improved.

5. Summary and Conclusions

Long-term spatiotemporal distributions of the aerosol optical properties and IADREs at TOA over YRB were investigated using MODIS and CERES datasets. MODIS DB observations were also validated by CARSNET AOD550 during 2007–2011 to verify the performance of satellite-retrieved aerosol data. The key findings in this study are summarized as follows:
  • High correlation coefficients between MODIS (DB) and CARSNET AOD550 were observed at Chengdu (0.82), Changde (0.70) and Dongtan (0.82), which provided possibility and confidence to estimate aerosol optical and radiative properties over YRB using MODIS (DB) aerosol retrievals.
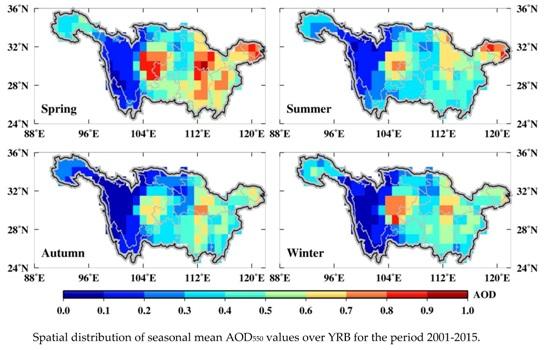
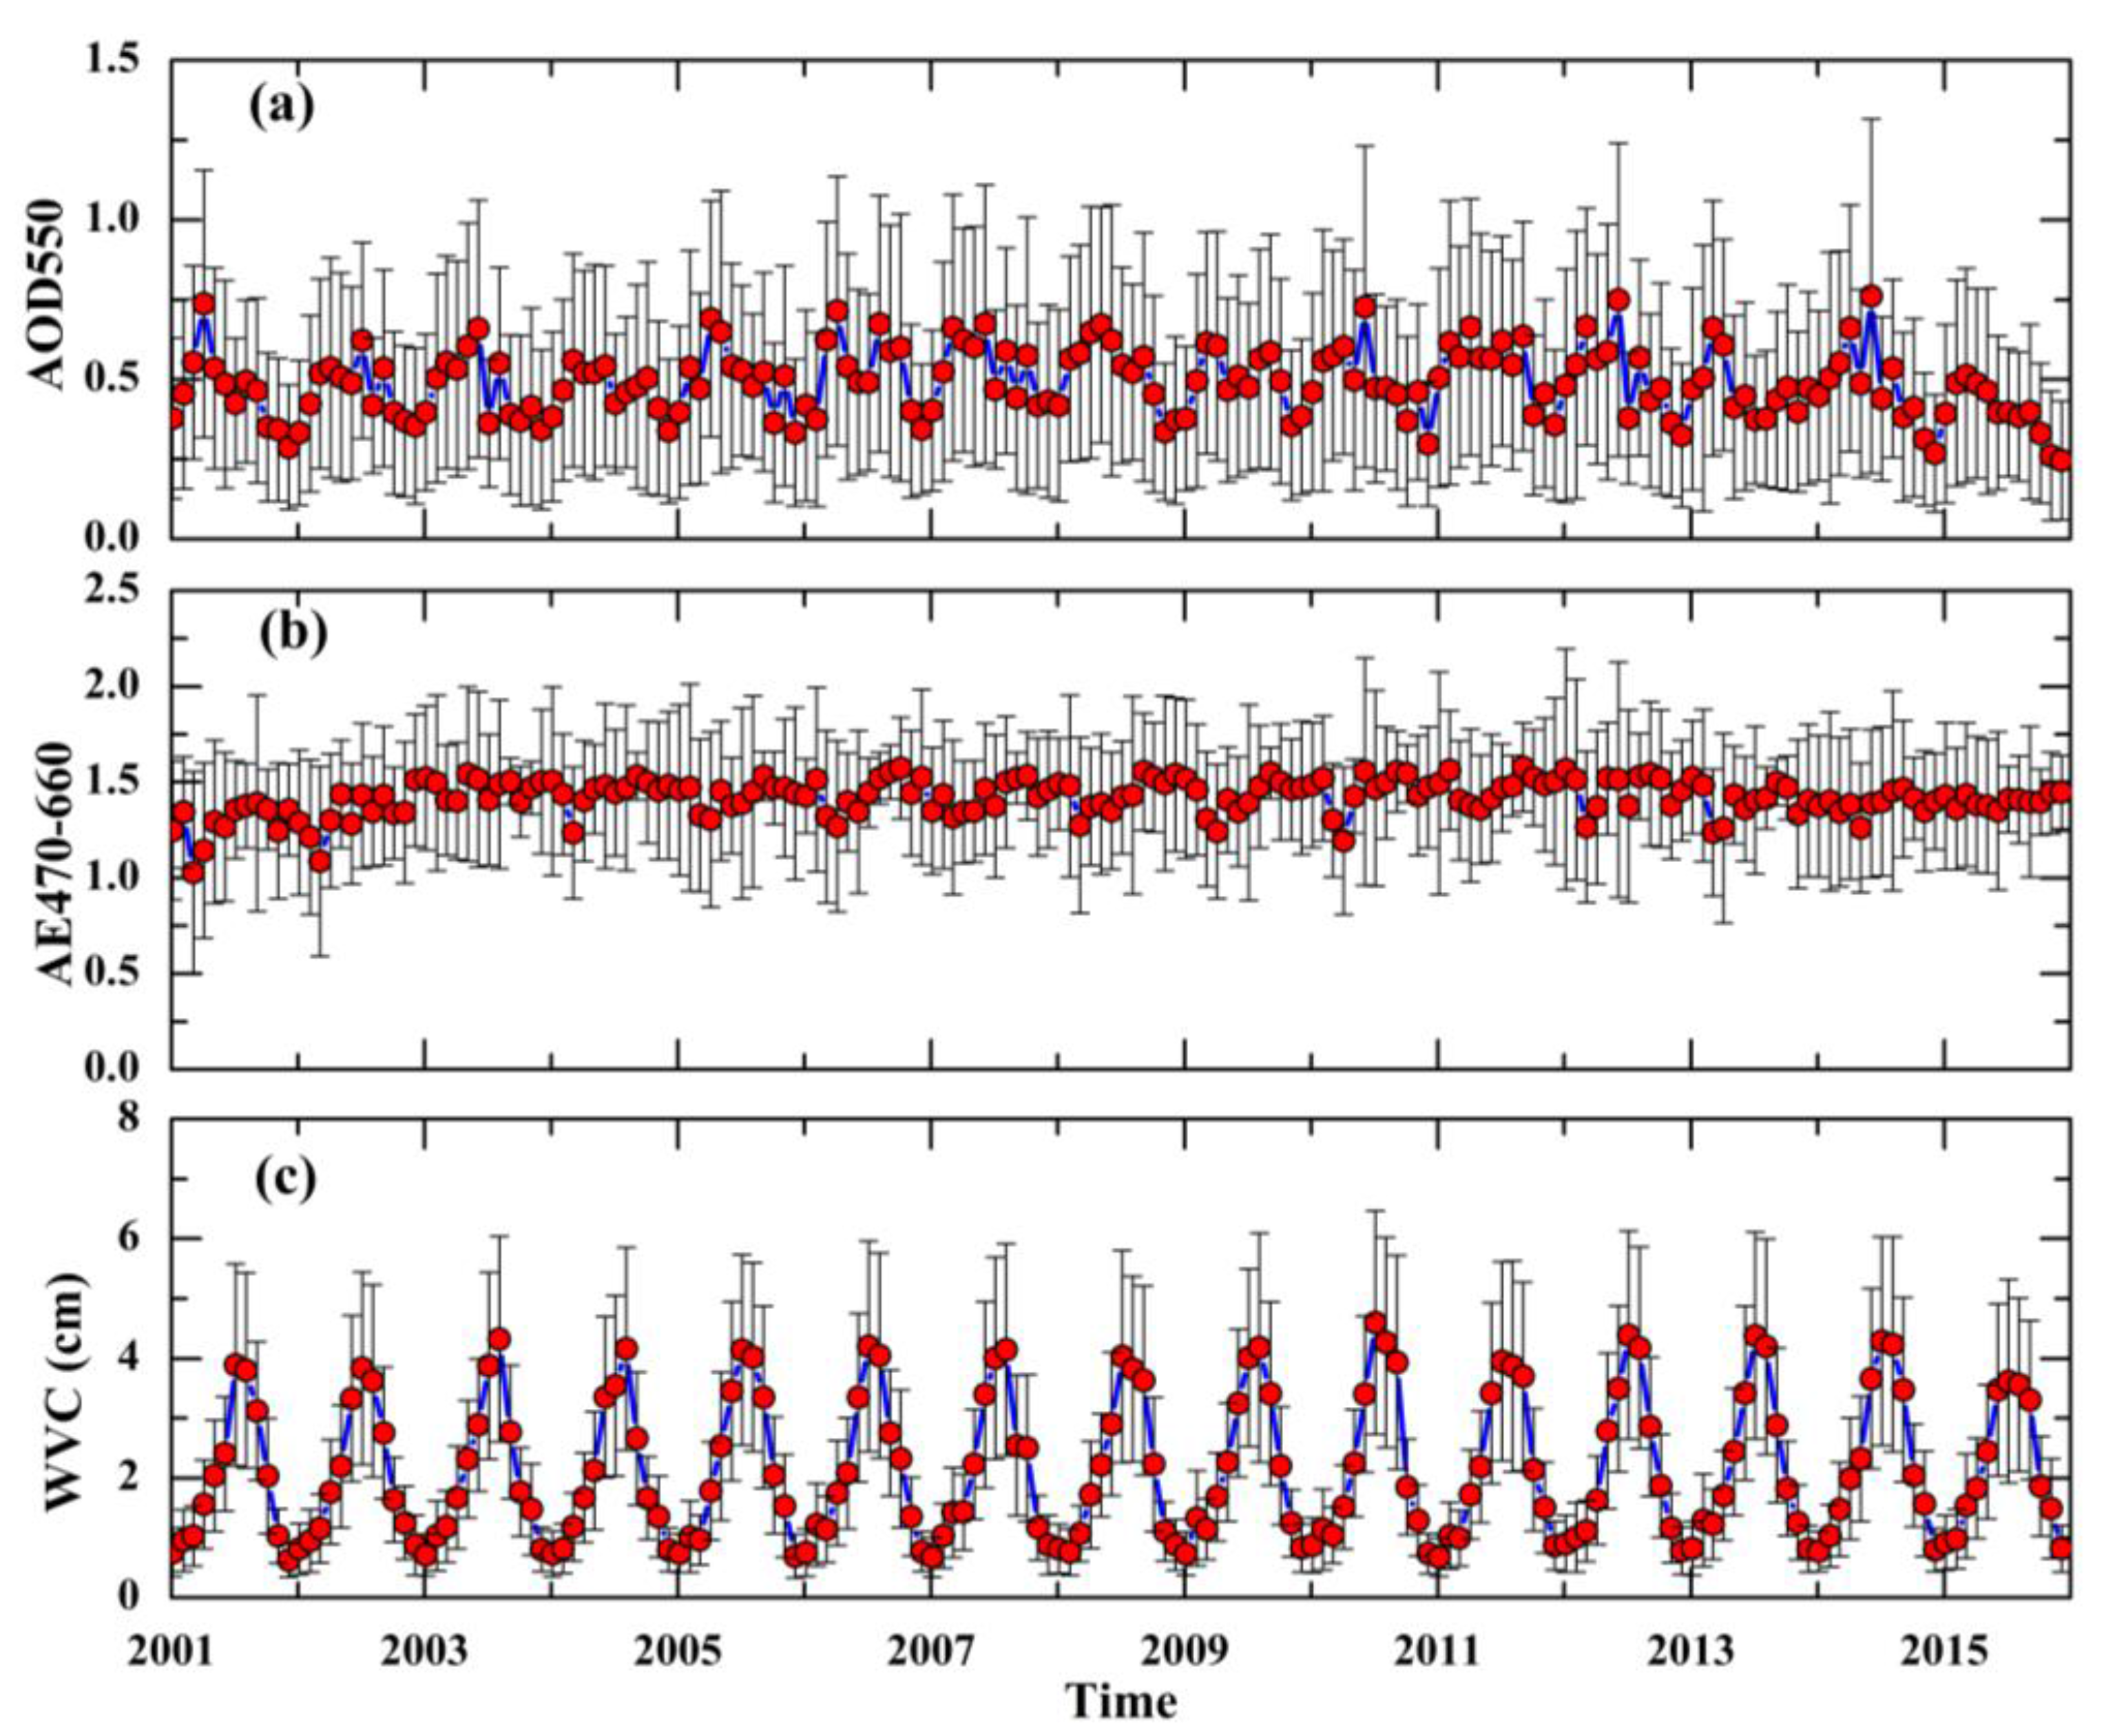
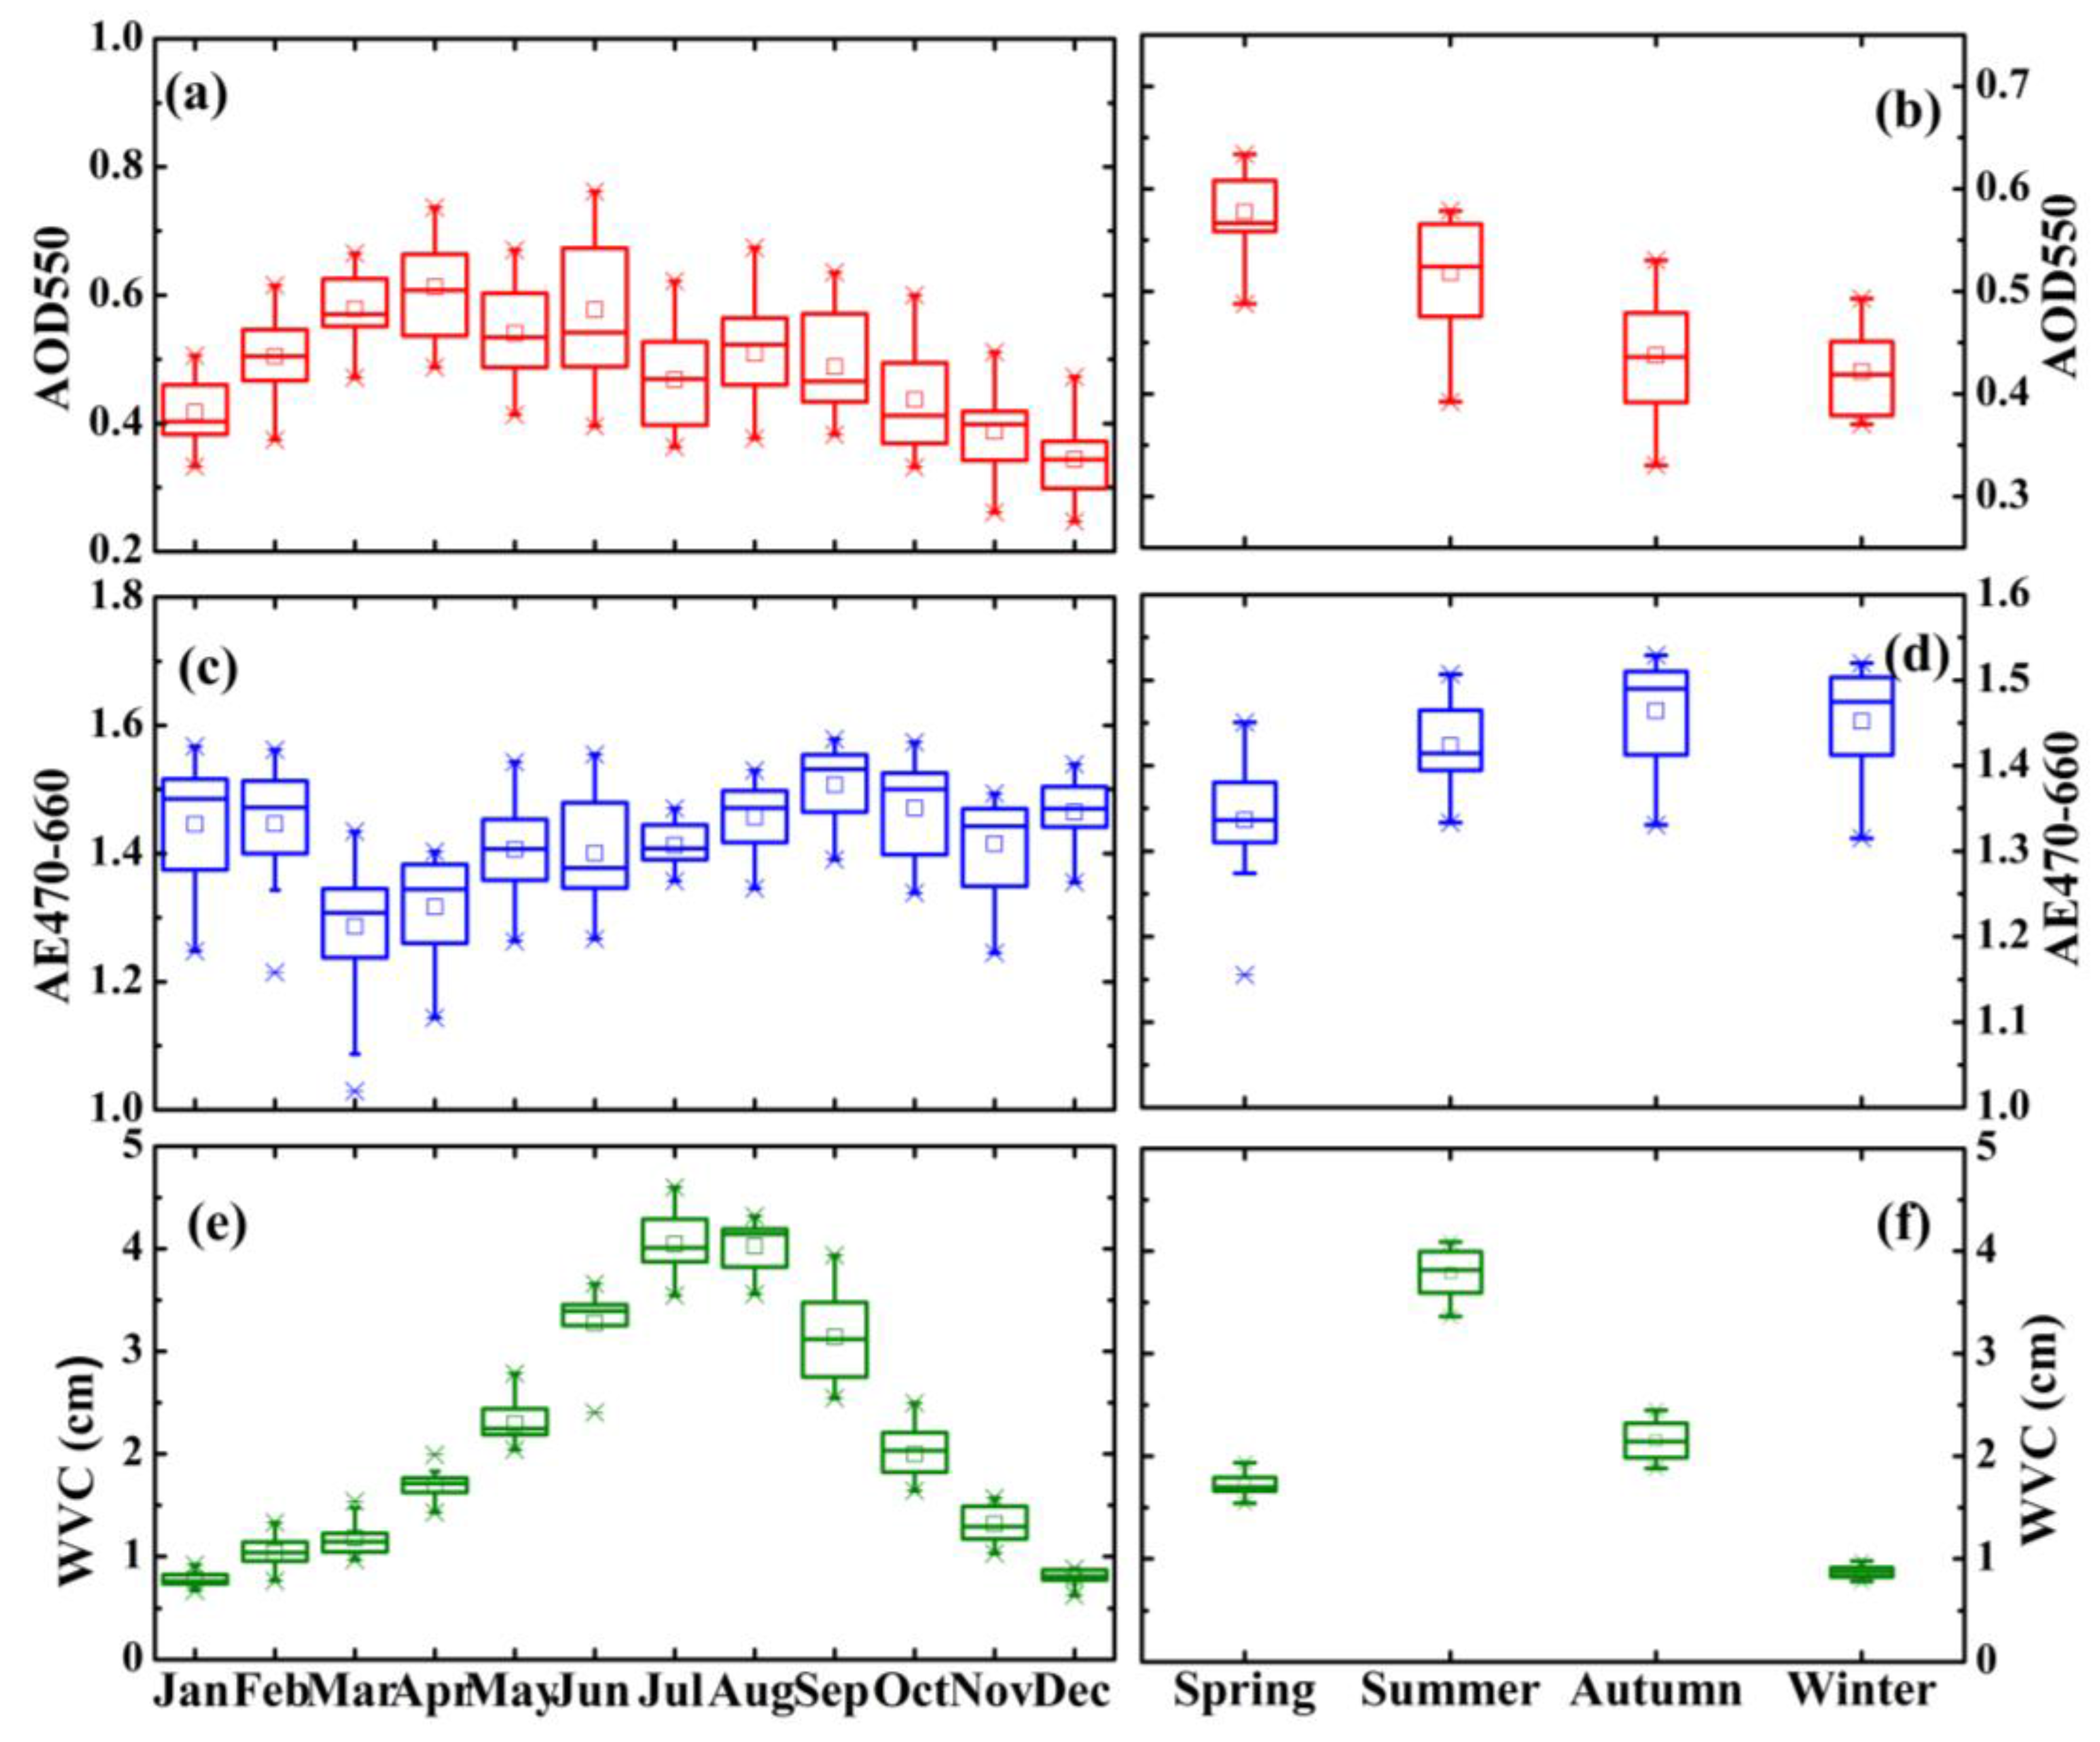
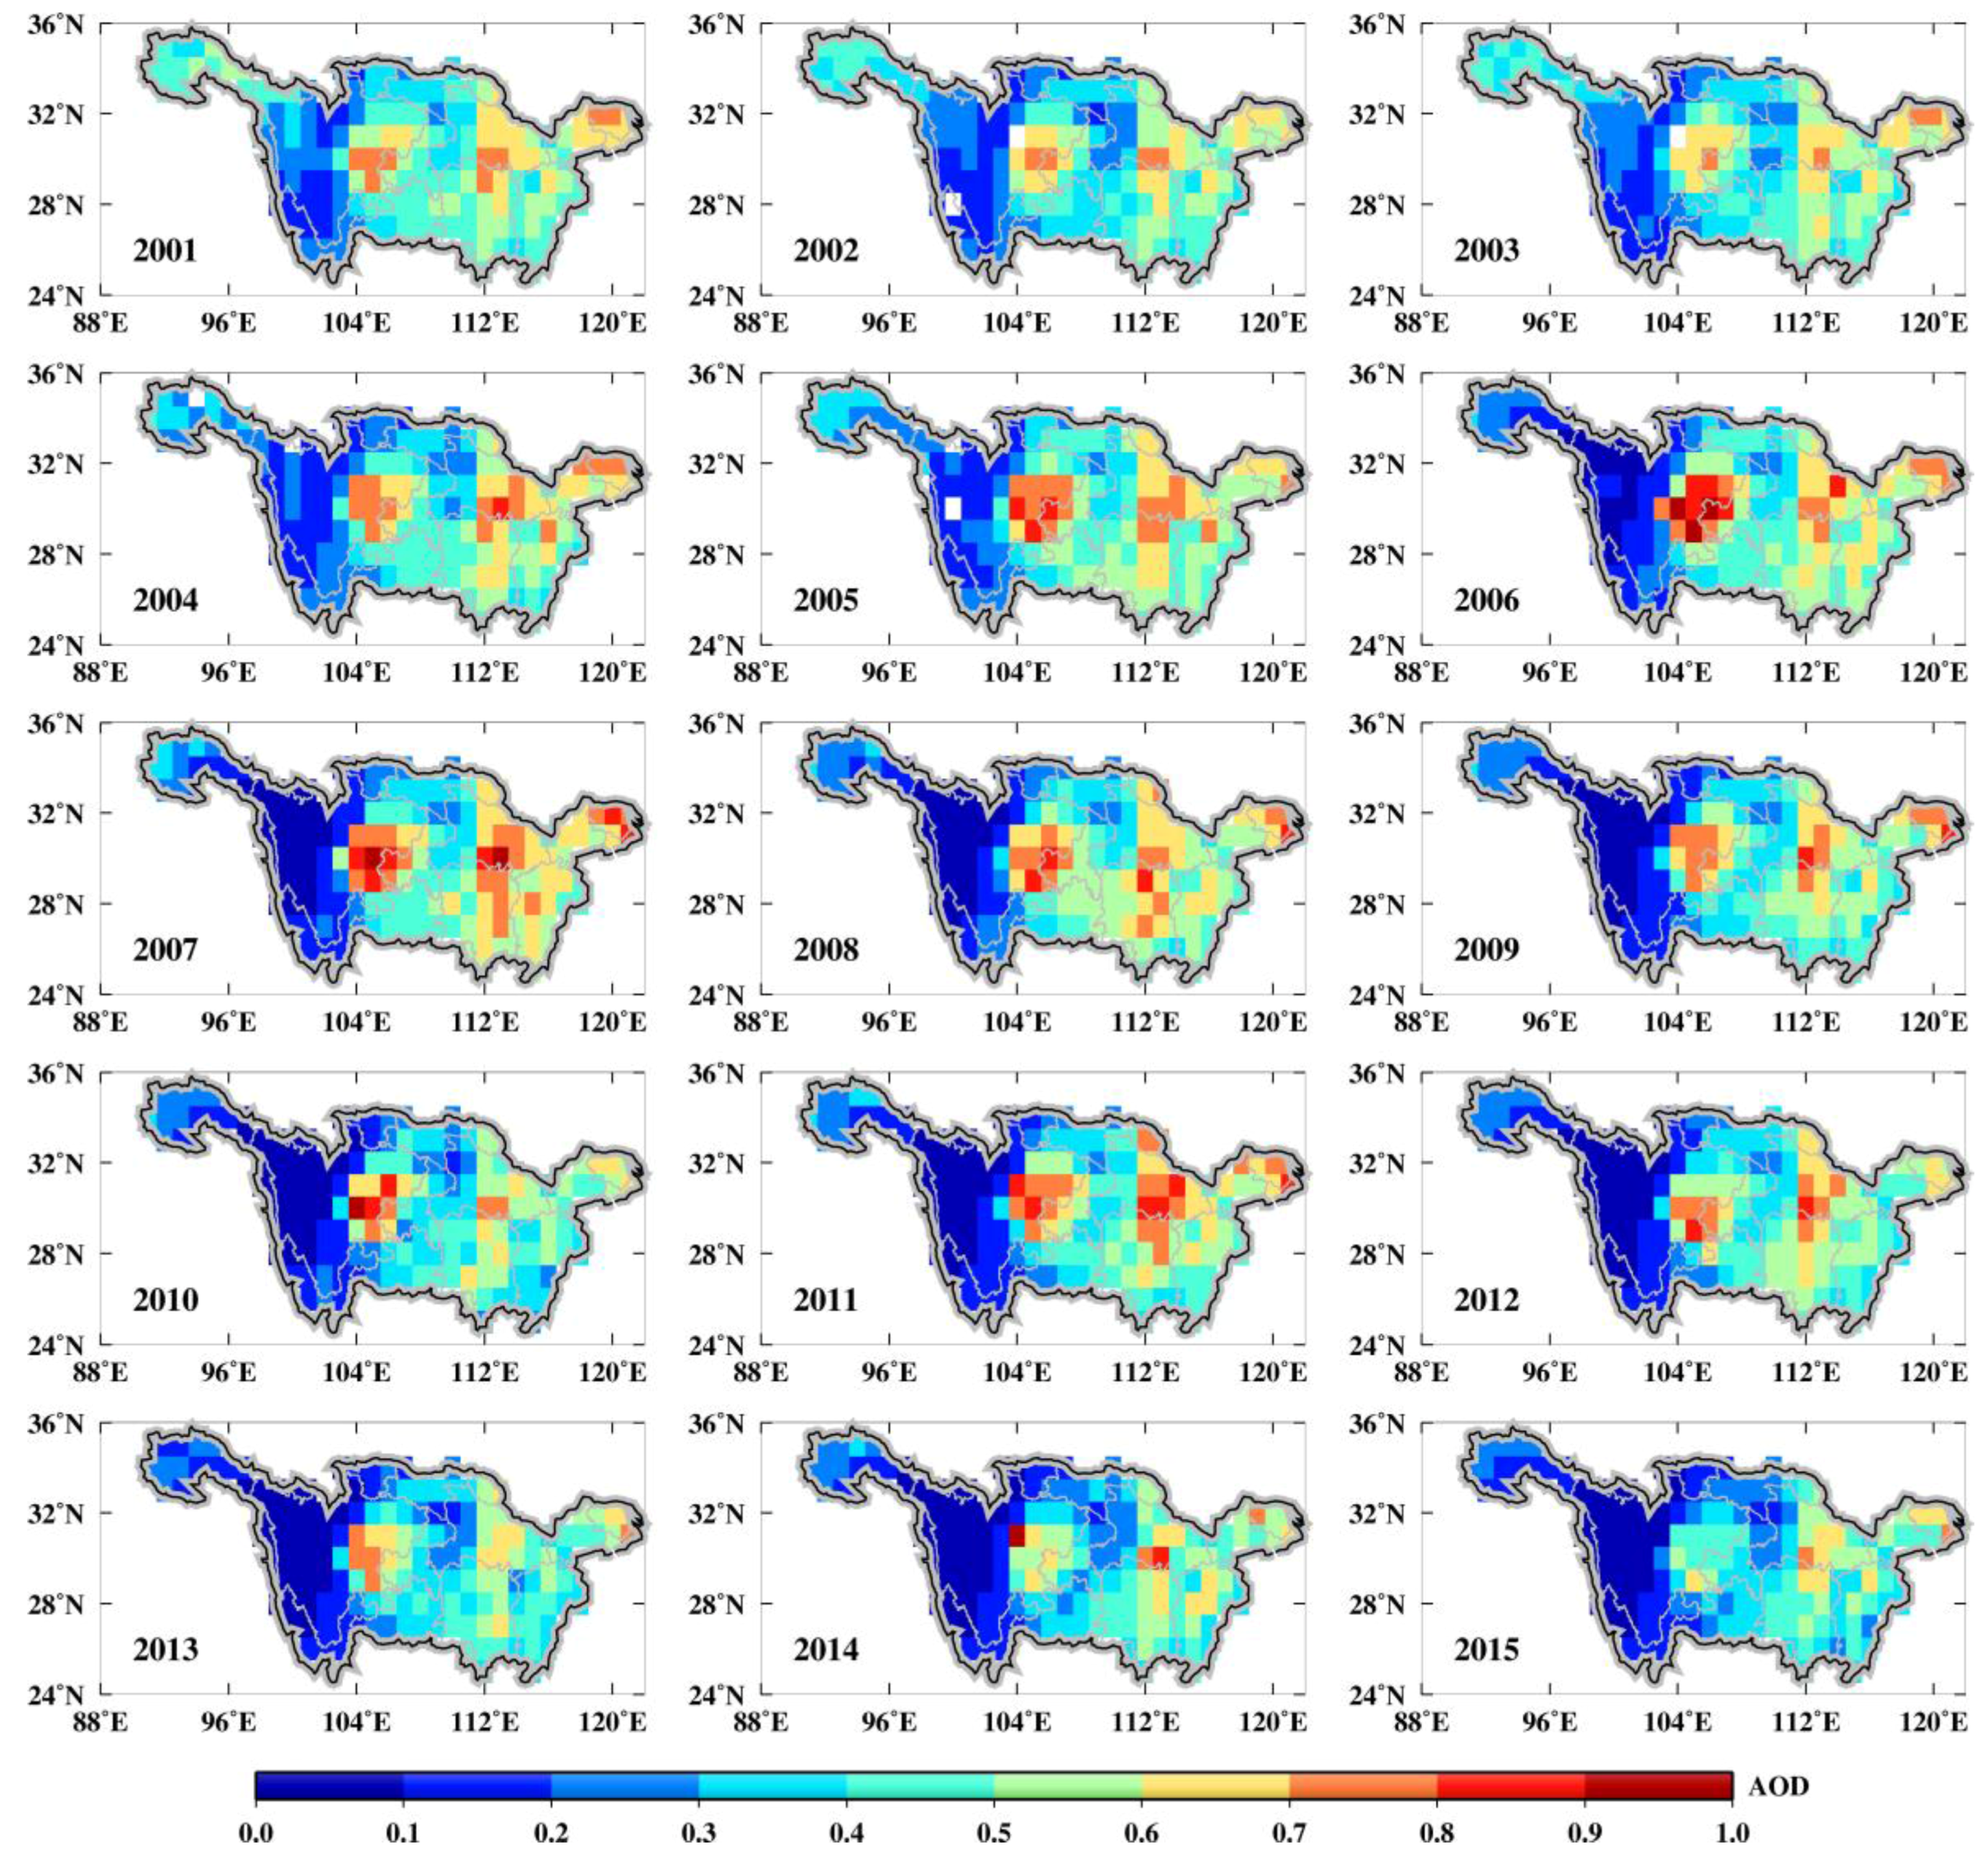
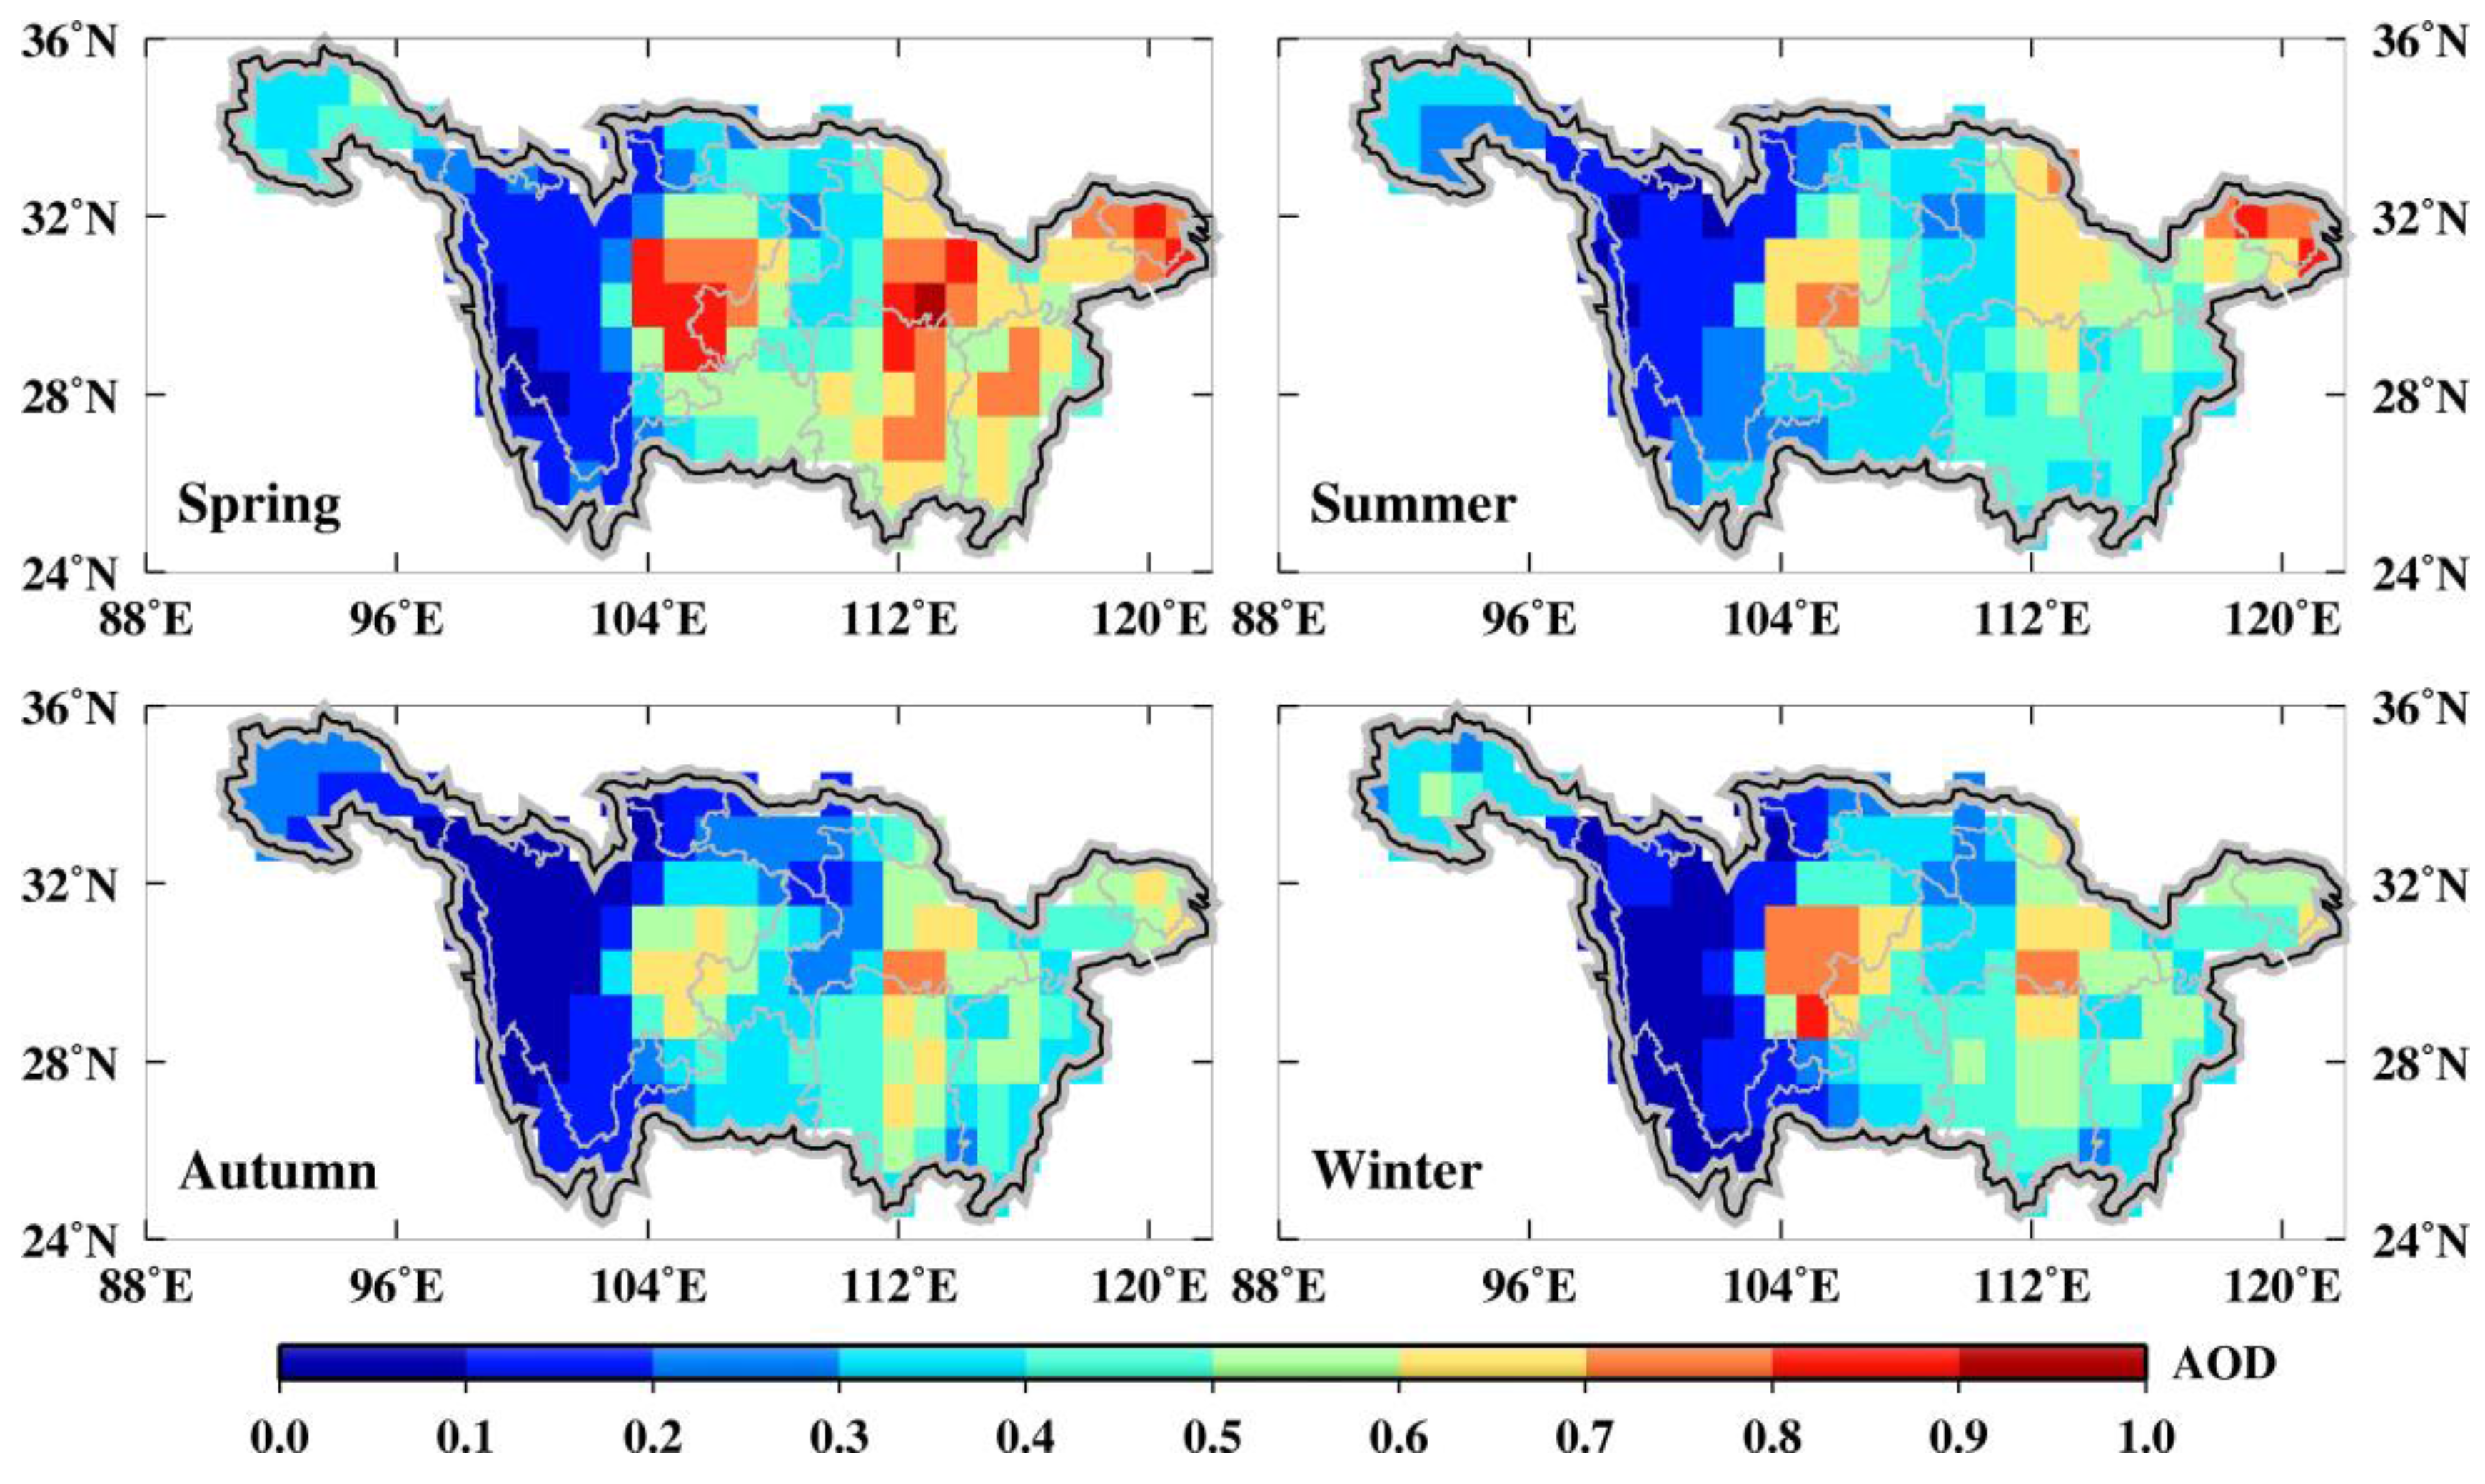
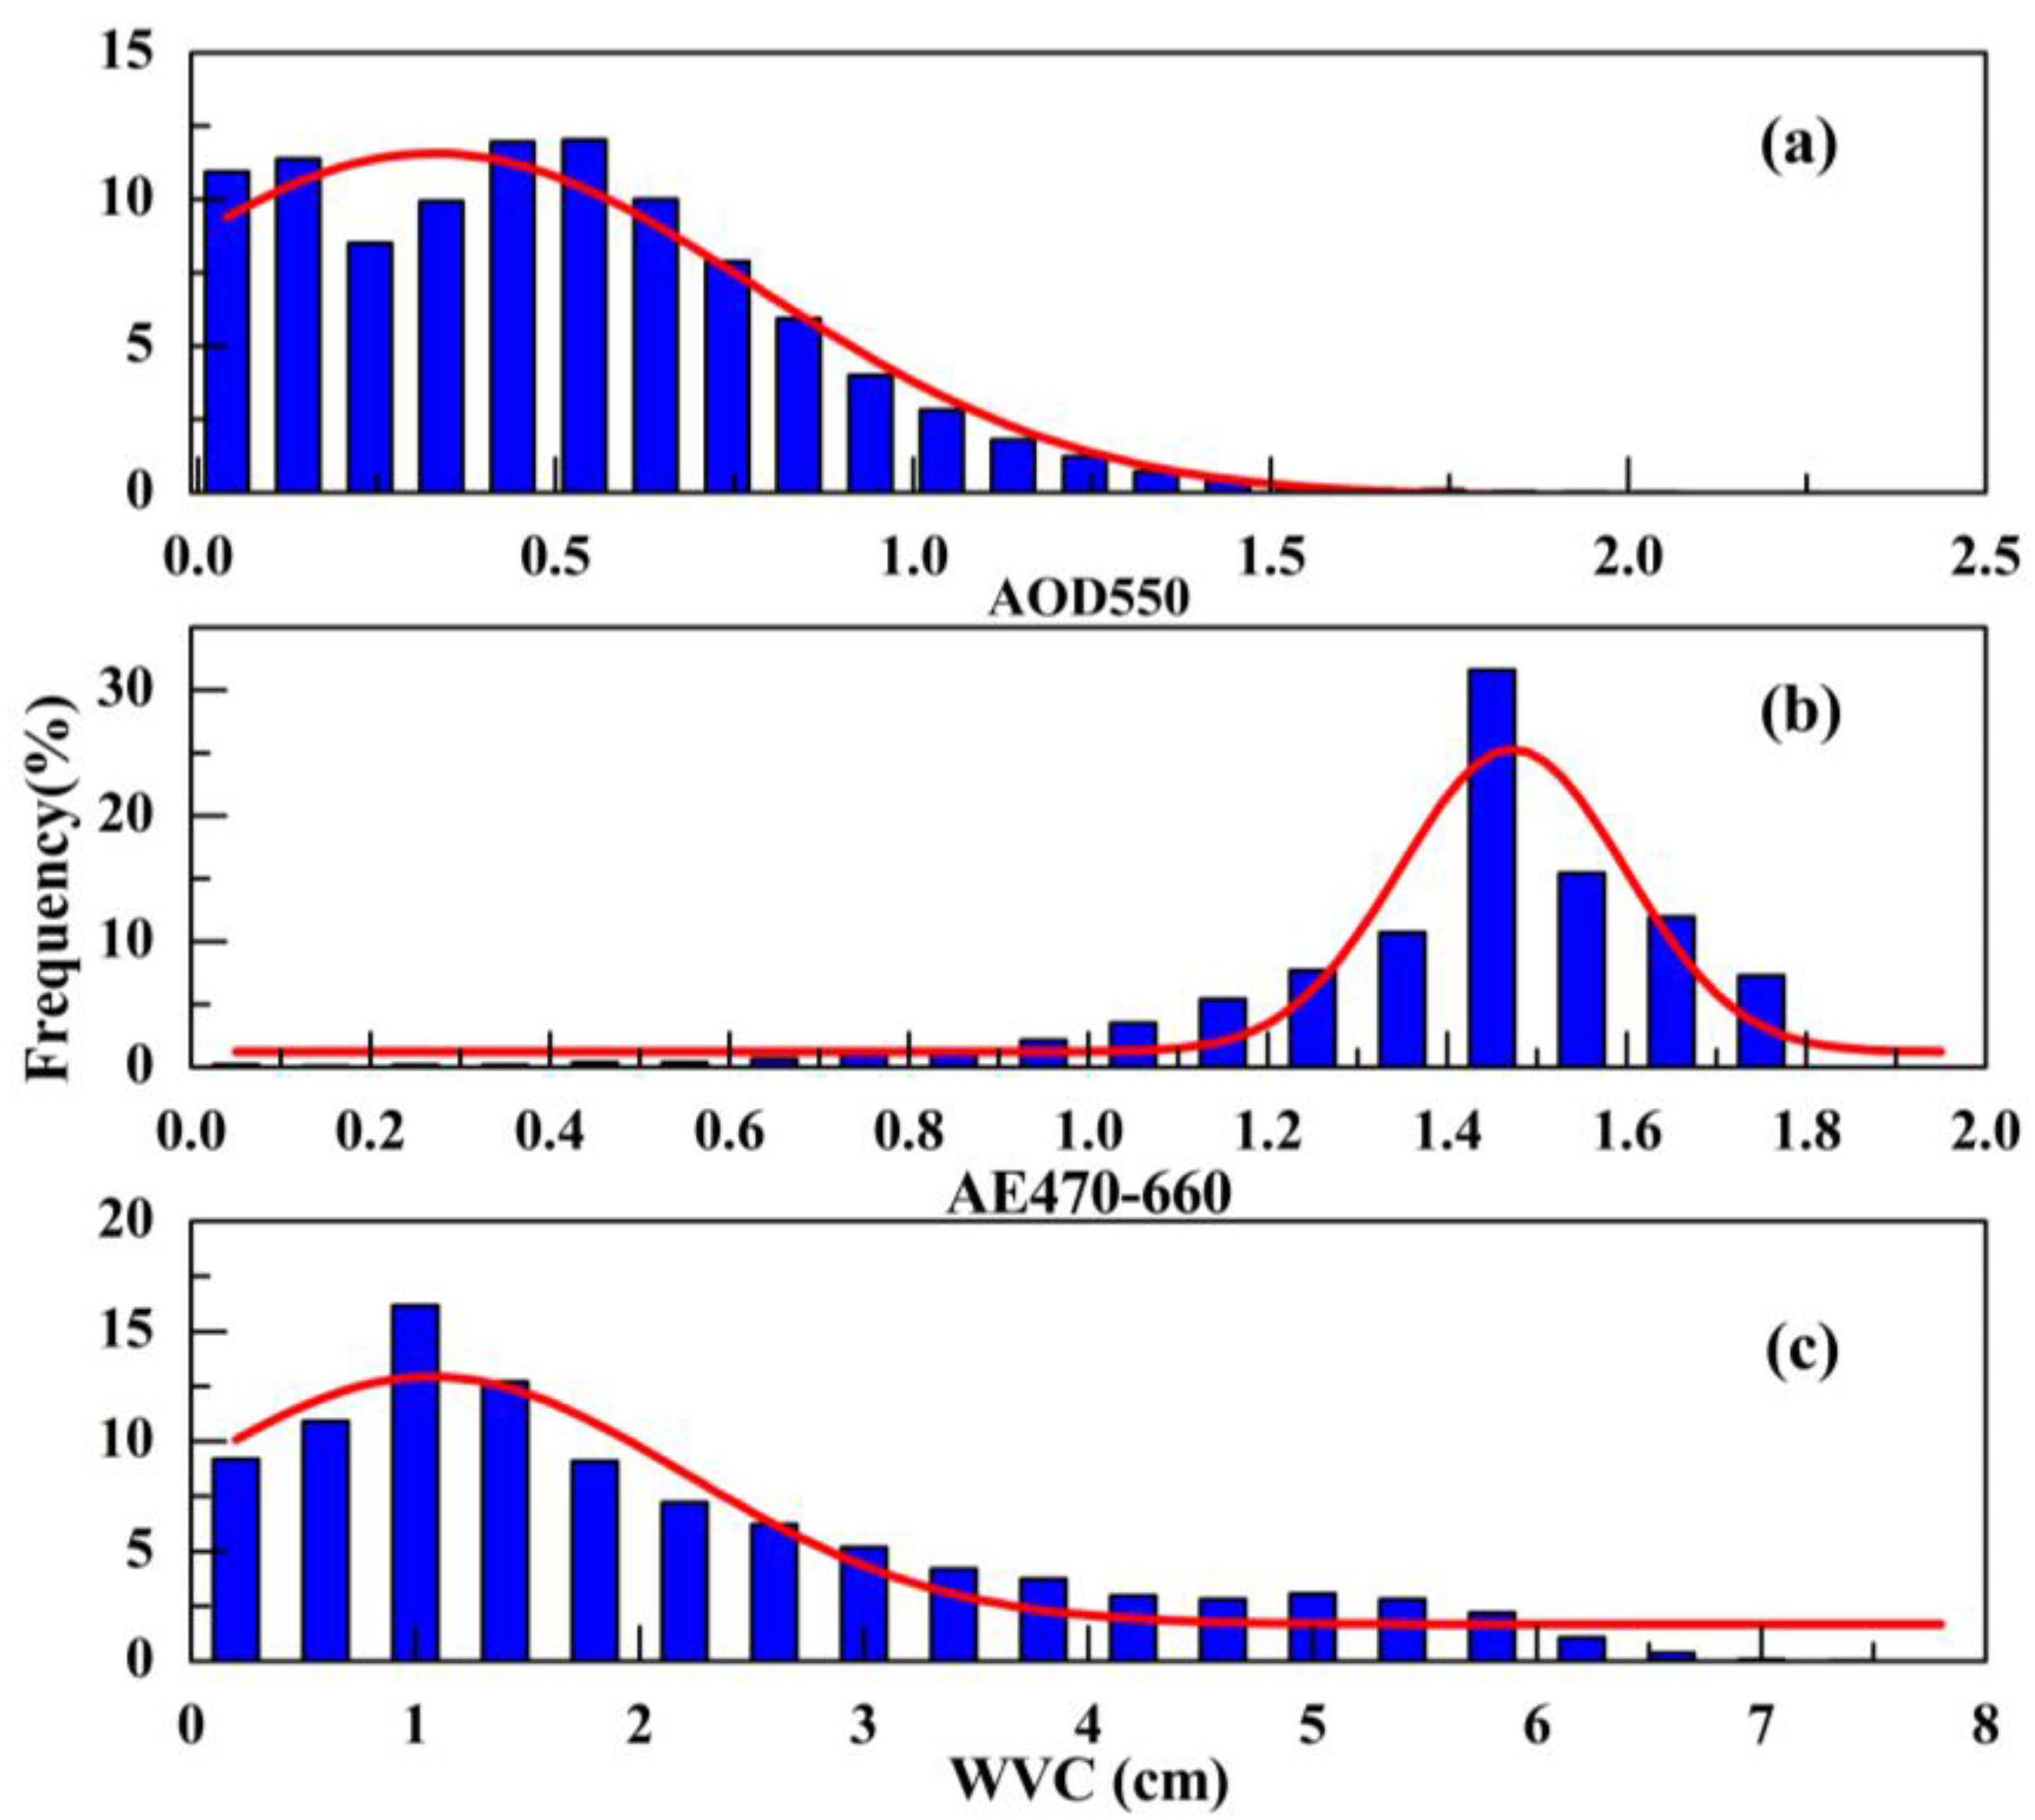
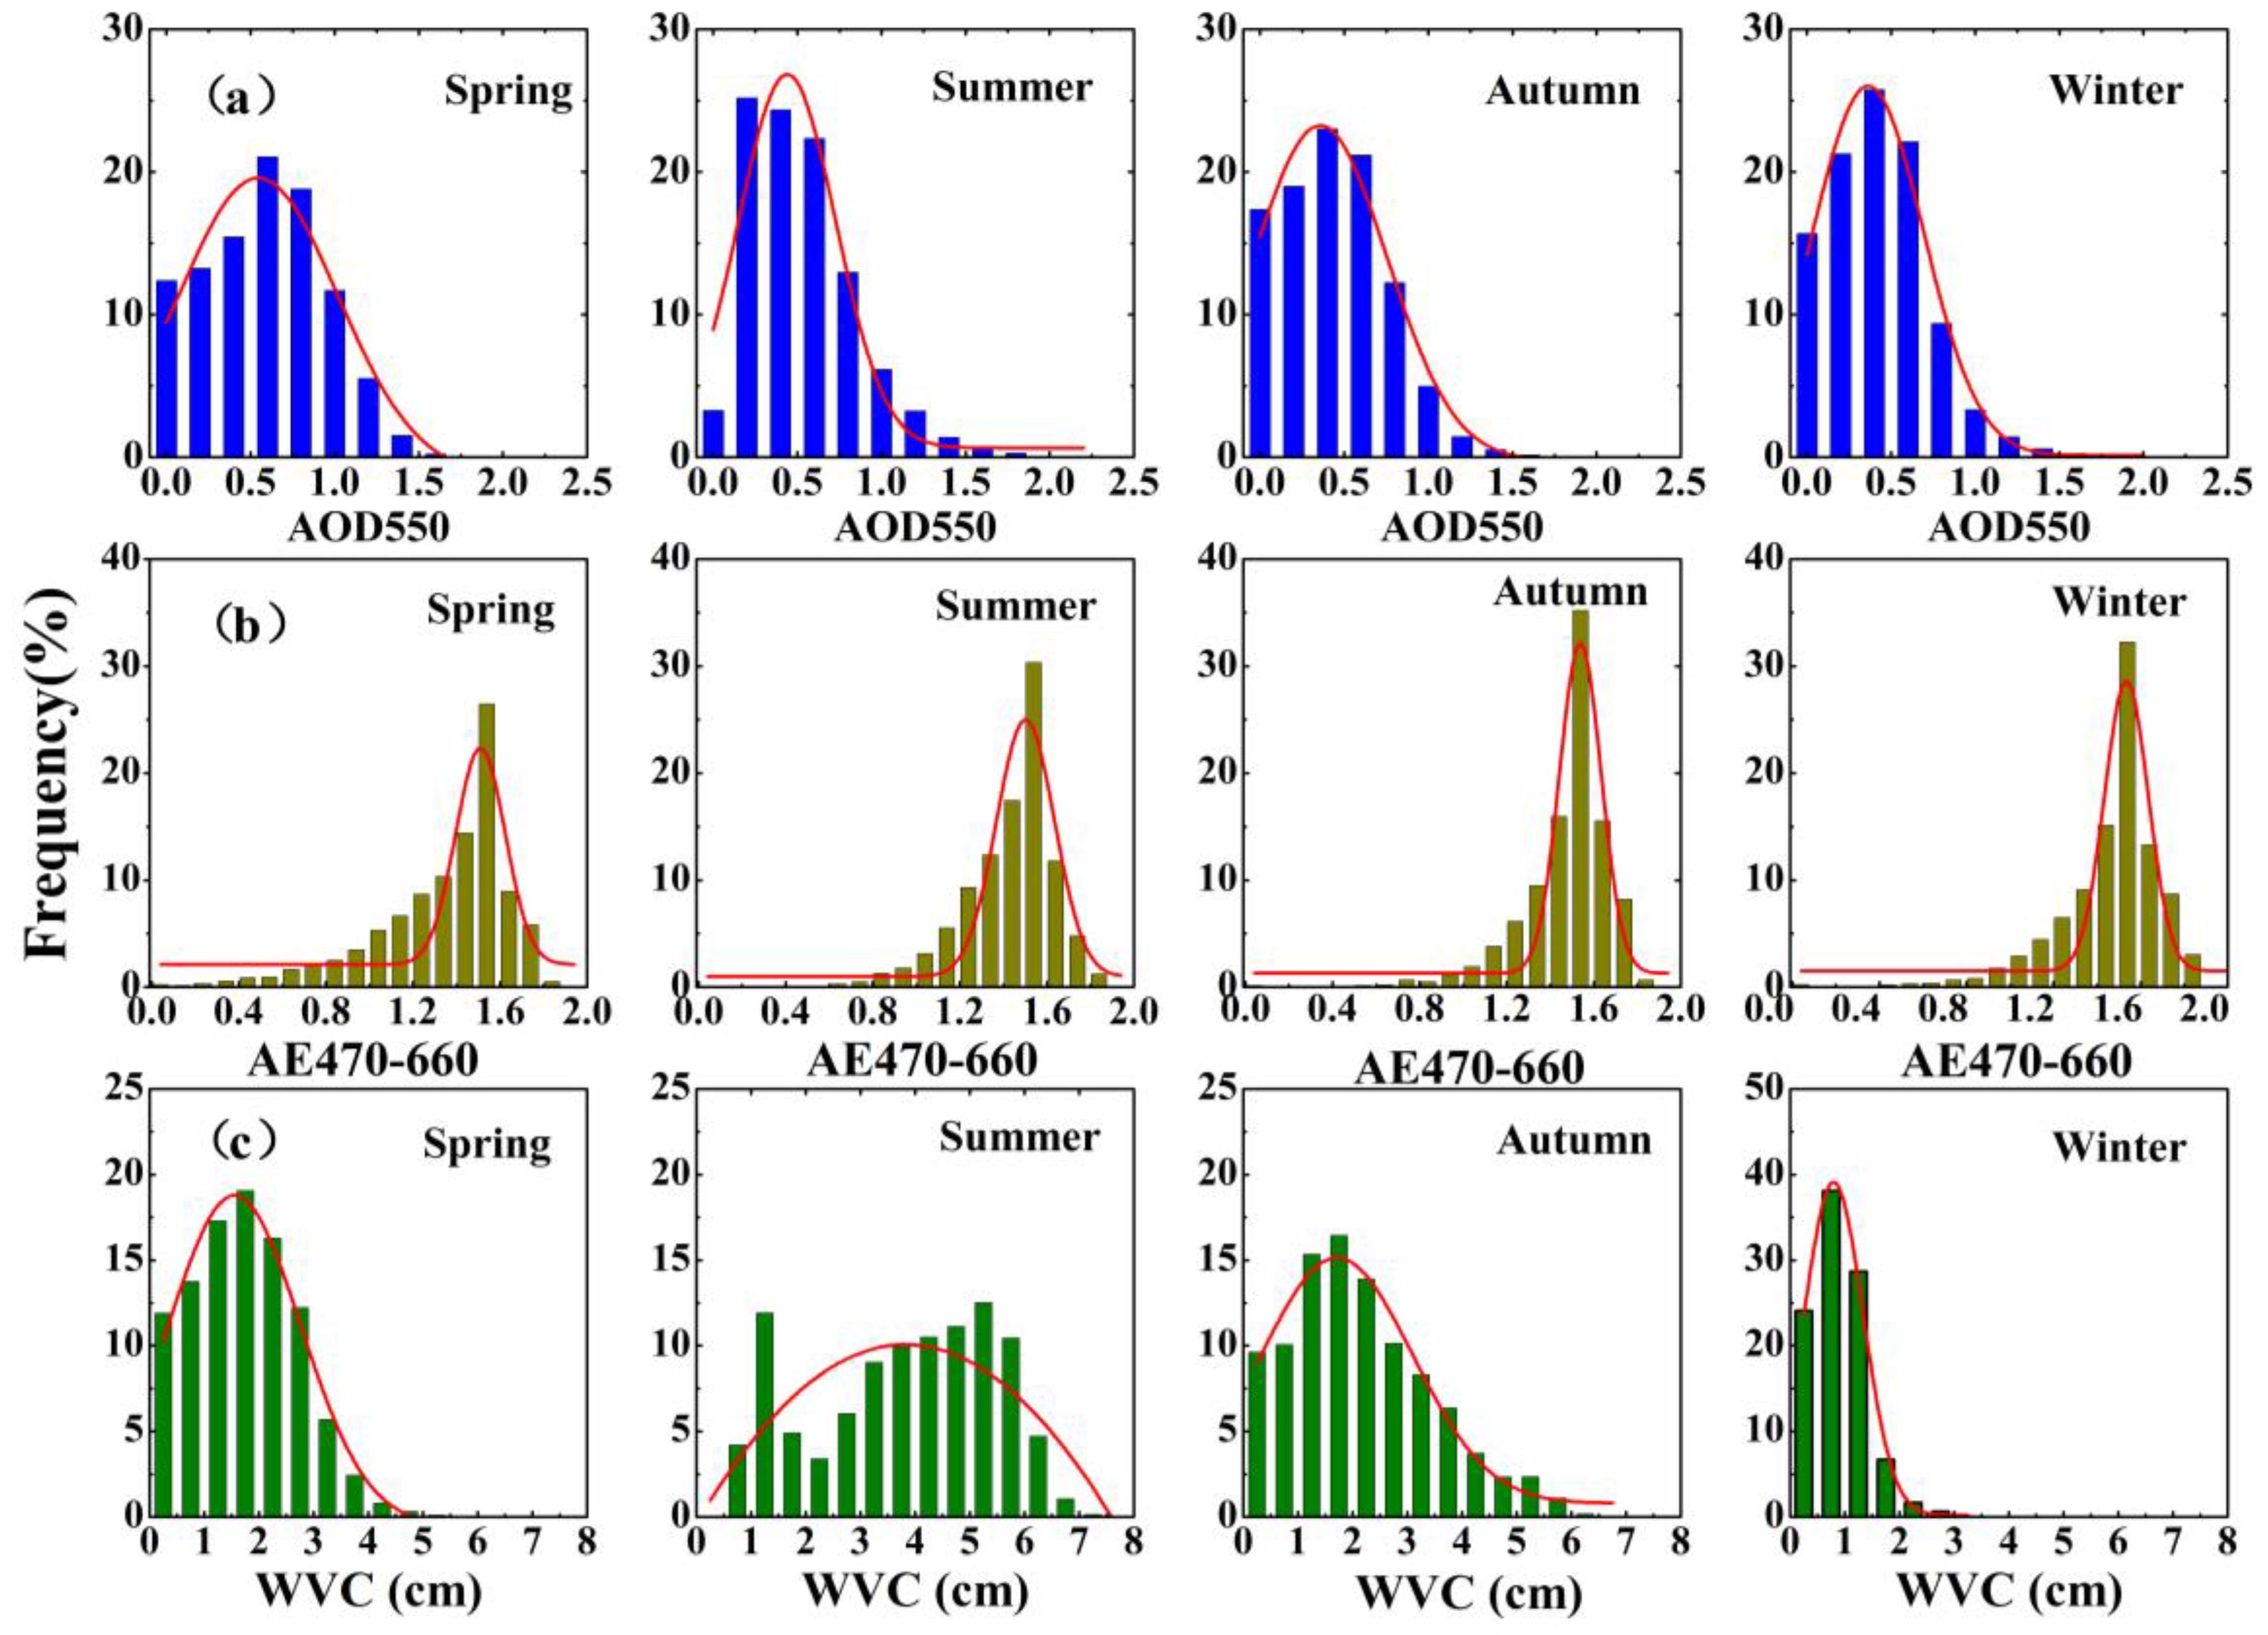
  • The 15-year averaged AOD550, AE470–660 and WVC values were 0.49, 1.42 and 2.13 cm, respectively. High AOD550 values generally appeared in spring and summer due to long-distance dust transport from North China and the local biomass burning, while low AOD550 values were observed in winter and autumn as a result of dry and windy weather conditions. Seasonal AE470–660 values were all larger than 1.0 with the minimum (1.33 ± 0.36) in spring, indicating the dominance of fine-mode particles over YRB. Spatially, high AOD550 values (>0.6) were observed over the midstream and downstream regions of YRB and Sichuan Basin because of intensive industrial and urban activities, while low AOD550 values (<0.3) were in high mountains over the upstream region of YRB.
  • Approximately 92% of the AOD550 values were less than 1.0; there was a wide distribution of AOD550 in the range 0.1–2.3 in summer, probably due to the variety of aerosol sources. The frequency analyses indicated 90% of the AE470–660 values to be higher than 1.0, and about 71% of the WVC values were in the range of 0.2–3 cm, and 64% of the WVC values were around 3–6 cm in summer.
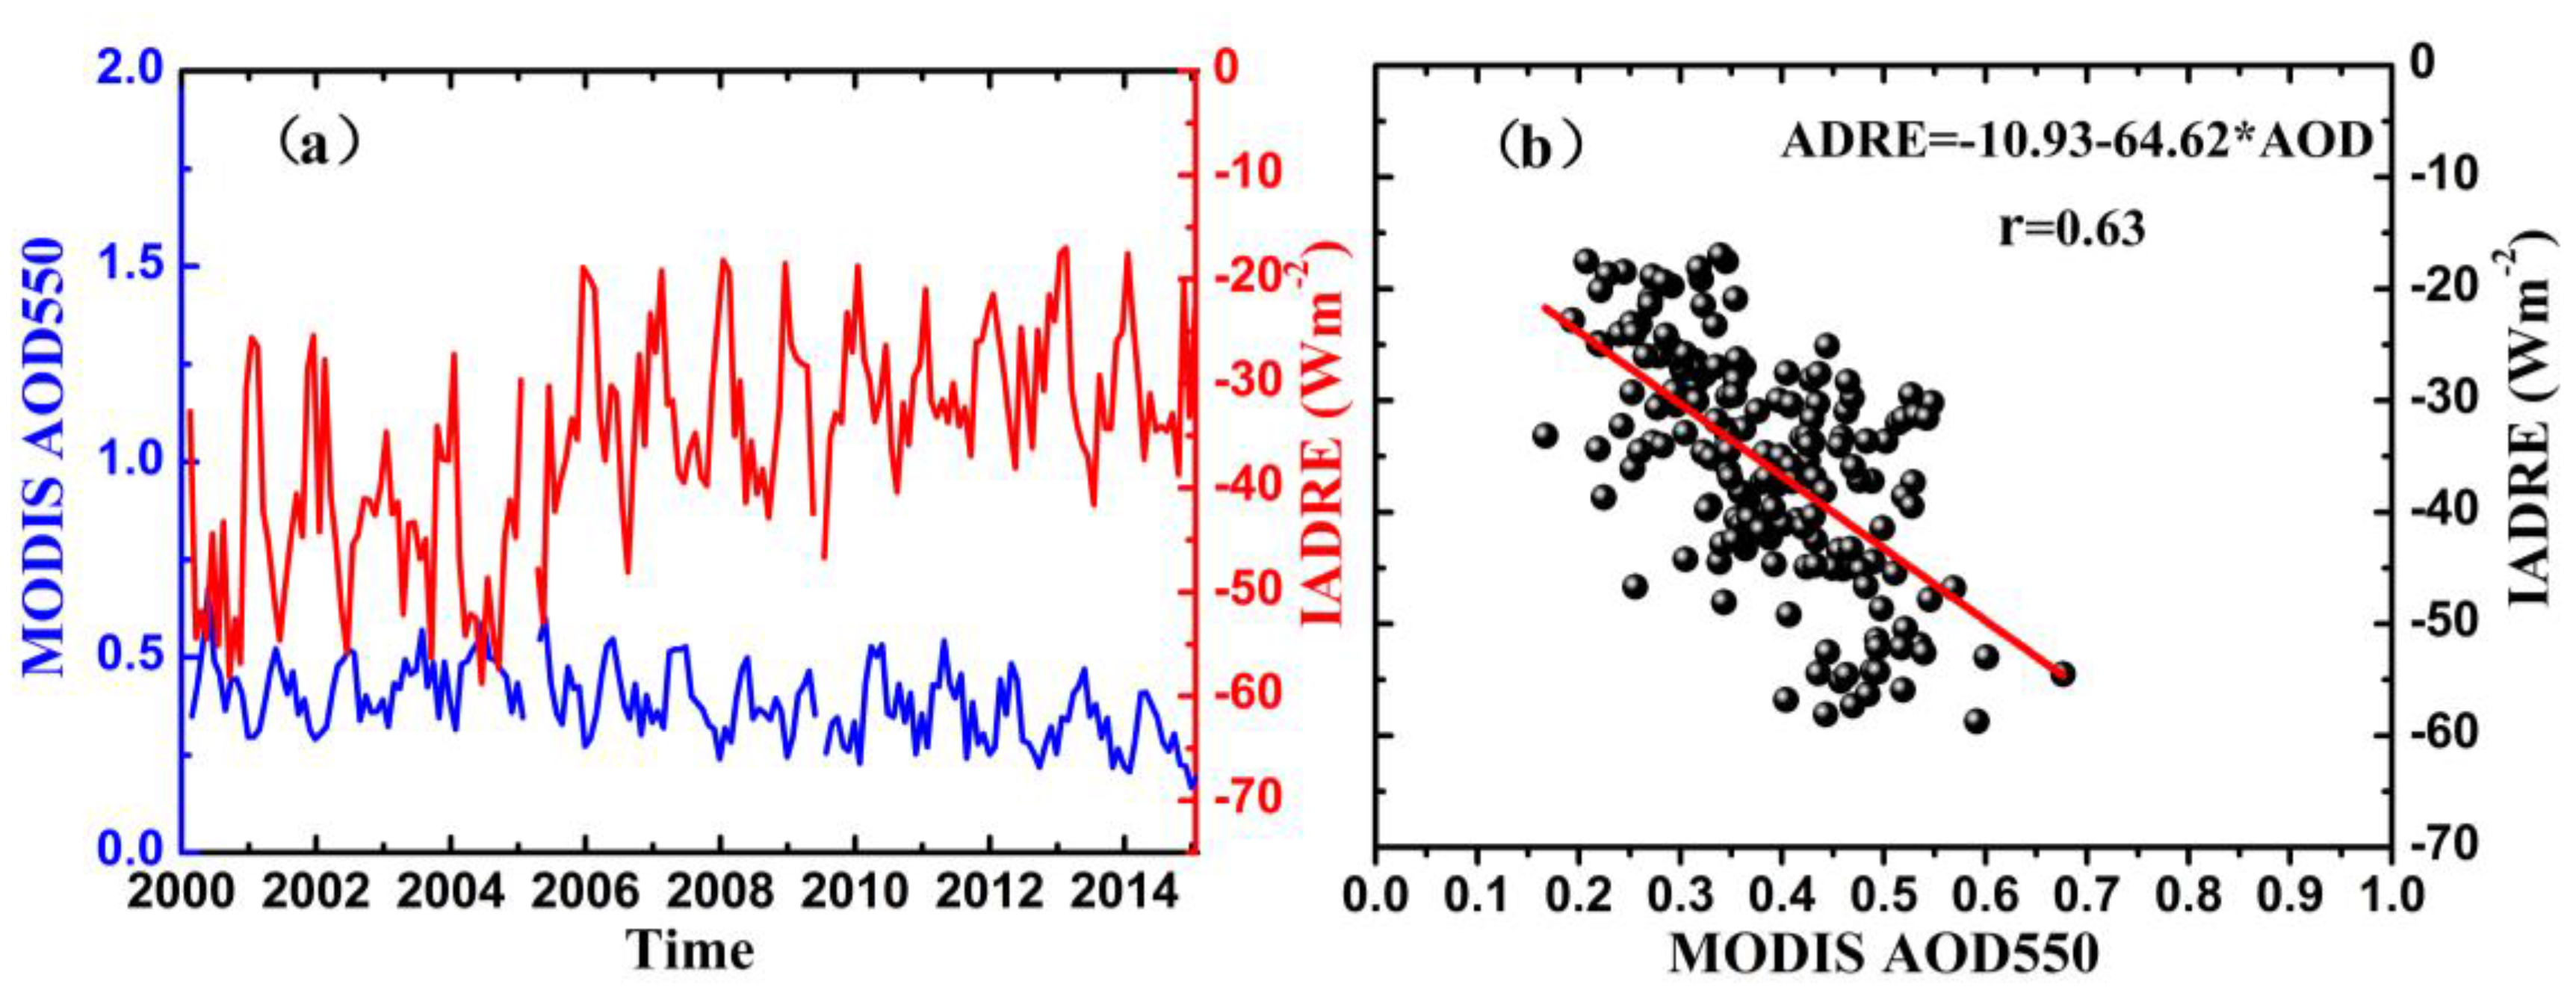
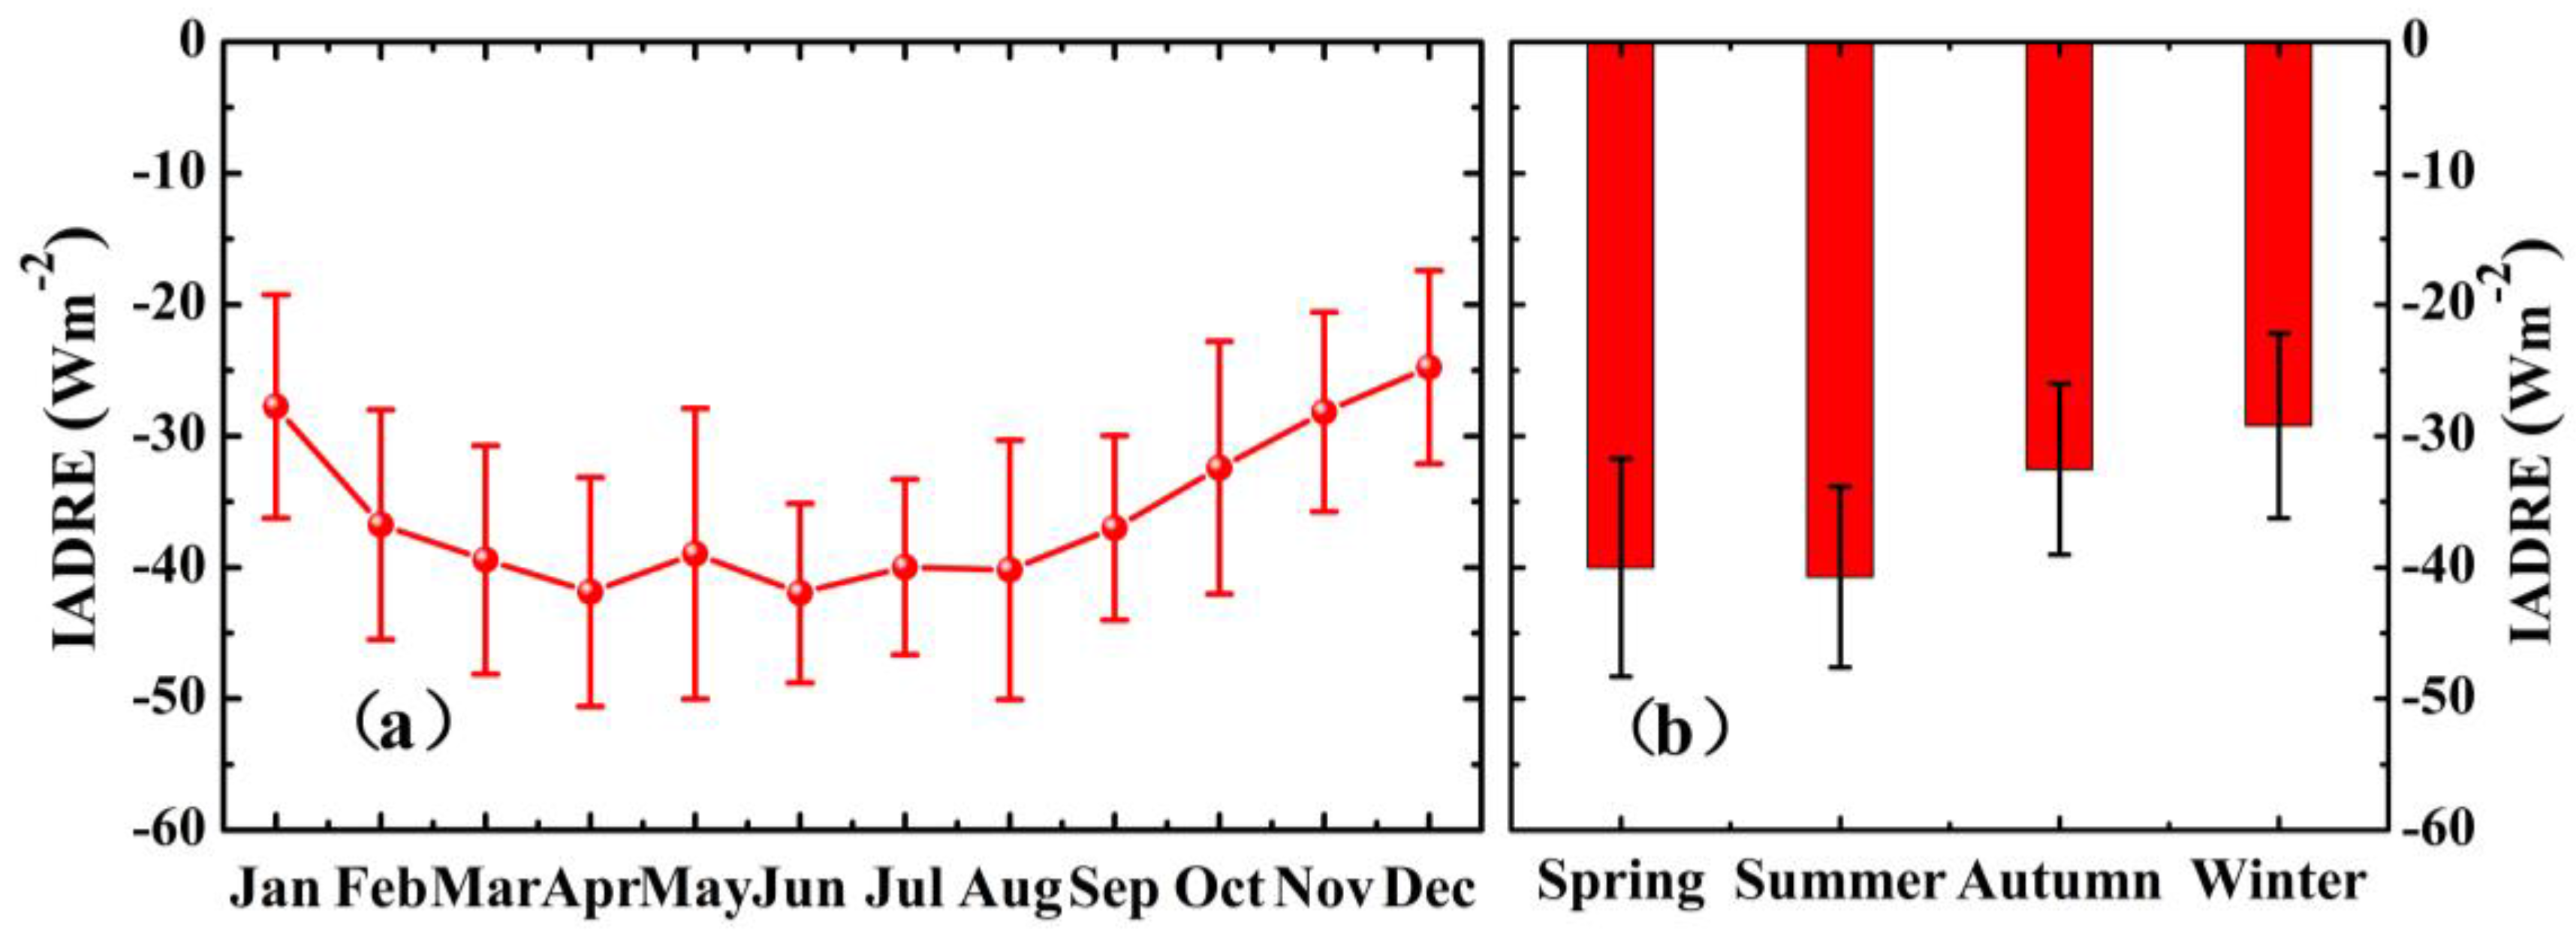
  • The IADRE values were generally higher in spring (−40.01 ± 8.30 Wm−2) and summer (−40.71 ± 6.86 Wm−2), and lower in autumn (−32.52 ± 6.52 Wm−2) and winter (−29.19 ± 7.04 Wm−2). The spatial distribution of IADRE over each 1° × 1° grid is in agreement with AOD550 over the Sichuan Basin and the midstream region of YRB. However, large aerosol loadings (AOD550 > 0.6) over the YRD did not transfer into high IADRE values (<−30 Wm−2).
  • The total uncertainty of IADRE was estimated to be ±1.8 Wm−2, from the calculation of Fclr, CERES radiances unfiltered, conversion of CERES TOA radiances to fluxes and cloud contamination.
This study clearly revealed how to estimate SW aerosol radiative effects at TOA using satellite-retrieved method without any RTM. To explore SW aerosol radiative effects on the earth–atmosphere system more thoroughly, combinations of model-simulated approaches and satellite-retrieved methods should be considered in next study.

Acknowledgments

This work was financially supported by the National Natural Science Foundation of China (No. 41601044); the Special Fund for Basic Scientific Research of Central Colleges, China University of Geosciences, Wuhan (Nos. CUG15063 and CUGL170401); and the Natural Science Foundation for Distinguished Young Scholars of Hubei Province of China (No. 2016CFA051).

Author Contributions

Lunche Wang, Lijie He and Aiwen Lin designed the research; Lijie He and Ming Zhang performed the experiments and analyzed the data; Lijie He and Lunche Wang wrote the manuscript; and Lunche Wang, Muhammad Bilal and Minghui Tao revised the manuscript.

Conflicts of Interest

The authors declare no conflict of interest.

References

  1. Intergovernmental Panel on Climate Change. Climate Change 2013—The Physical Science Basis: Working Group I Contribution to the Fifth Assessment Report of the IPCC, Climate Change 2013; Cambridge University Press: Cambridge, UK; New York, NY, USA, 2013. [Google Scholar]
  2. Patadia, F.; Gupta, P.; Christopher, S.A. First observational estimates of global clear sky shortwave aerosol direct radiative effect over land. Geophys. Res. Lett. 2008, 35, 228–236. [Google Scholar] [CrossRef]
  3. Patadia, F.; Gupta, P.; Christopher, S.A.; Reid, J.S. A Multisensor satellite-based assessment of biomass burning aerosol radiative impact over Amazonia. J. Geophys. Res. Atmos. 2008, 113, 1113–1126. [Google Scholar] [CrossRef]
  4. Christopher, S.A.; Zhang, J. Shortwave Aerosol Radiative Forcing from MODIS and CERES observations over the oceans. Geophys. Res. Lett. 2002, 29, 6:1–6:4. [Google Scholar] [CrossRef]
  5. Christopher, S.A.; Zhang, J. Cloud-free shortwave aerosol radiative effect over oceans: Strategies for identifying anthropogenic forcing from Terra satellite measurements. Geophys. Res. Lett. 2004, 31, 169–188. [Google Scholar] [CrossRef]
  6. Levy, R.C.; Remer, L.A.; Kleidman, R.G.; Mattoo, S.; Ichoku, C.; Kahn, R.; Eck, T.F. Global evaluation of the Collection 5 MODIS dark-target aerosol products over land. Atmos. Chem. Phys. 2010, 10, 10399–10420. [Google Scholar] [CrossRef] [Green Version]
  7. Levy, R.C.; Mattoo, S.; Munchak, L.A.; Remer, L.A.; Sayer, A.M.; Patadia, F.; Hsu, N.C. The Collection 6 MODIS aerosol products over land and ocean. Atmos. Meas. Tech. 2013, 6, 2989–3034. [Google Scholar] [CrossRef]
  8. He, Q.; Li, C.; Geng, F.; Lei, Y.; Li, Y. Study on long-term aerosol distribution over the land of East China using MODIS data. Aerosol Air Qual. Res. 2012, 12, 304–319. [Google Scholar] [CrossRef]
  9. Li, C.; Mao, J.; Lau, K.H.A.; Chen, J.C.; Yuan, Z.; Liu, X.; Liu, G. Characteristics of distribution and seasonal variation of aerosol optical depth in eastern China with MODIS products. Chin. Sci. Bull. 2003, 48, 2488–2495. [Google Scholar]
  10. Tian, P.; Cao, X.; Zhang, L.; Sun, N.; Sun, L.; Logan, T.; Huang, Z. Aerosol vertical distribution and optical properties over China from long-term satellite and ground-based remote sensing. Atmos. Chem. Phys. 2017, 17, 2509–2523. [Google Scholar] [CrossRef]
  11. Pathak, B.; Kalita, G.; Bhuyan, K.; Bhuyan, P.K.; Moorthy, K.K. Aerosol temporal characteristics and its impact on shortwave radiative forcing at a location in the northeast of India. J. Geophys. Res. Atmos. 2010, 115, 5548–5554. [Google Scholar] [CrossRef]
  12. Jose, S.; Gharai, B.; Niranjan, K.; Rao, P.V.N. Investigation on seasonal variations of aerosol properties and its influence on radiative effect over an urban location in central India. Atmos. Environ. 2016, 133, 41–48. [Google Scholar] [CrossRef]
  13. Wu, Y.; Zhu, J.; Che, H.; Xia, X.; Zhang, R. Column-integrated aerosol optical properties and direct radiative forcing based on sun photometer measurements at a semi-arid rural site in Northeast China. Atmos. Res. 2015, 157, 56–65. [Google Scholar] [CrossRef]
  14. Xia, X.; Che, H.; Zhu, J.; Chen, H.; Cong, Z.; Deng, X.; Liu, Q. Ground-based remote sensing of aerosol climatology in China: Aerosol optical properties, direct radiative effect and its parameterization. Atmos. Environ. 2015, 124, 243–251. [Google Scholar] [CrossRef]
  15. Kang, N.; Kumar, K.R.; Yu, X.; Yin, Y. Column-integrated aerosol optical properties and direct radiative forcing over the urban-industrial megacity Nanjing in the Yangtze River Delta, China. Environ. Sci. Pollut. Res. 2016, 23, 17535–17552. [Google Scholar] [CrossRef] [PubMed]
  16. Yu, X.; Lü, R.; Kumar, K.R.; Ma, J.; Zhang, Q.; Jiang, Y.; Li, M. Dust aerosol properties and radiative forcing observed in spring during 2001–2014 over urban Beijing, China. Environ. Sci. Pollut. Res. 2016, 23, 15432–15442. [Google Scholar] [CrossRef] [PubMed]
  17. Sena, E.T.; Artaxo, P.; Correia, A.L. Spatial variability of the direct radiative forcing of biomass burning aerosols and the effects of land use change in Amazonia. Atmos. Chem. Phys. 2013, 13, 1261–1275. [Google Scholar] [CrossRef]
  18. Feng, N.; Christopher, S.A. Satellite and surface-based remote sensing of Southeast Asian aerosols and their radiative effects. Atmos. Res. 2013, 122, 544–554. [Google Scholar] [CrossRef]
  19. Feng, N.; Christopher, S.A. Clear sky direct radiative effects of aerosols over Southeast Asia based on satellite observations and radiative transfer calculations. Remote Sens. Environ. 2014, 152, 333–344. [Google Scholar] [CrossRef]
  20. Biswas, J.; Pathak, B.; Patadia, F.; Bhuyan, P.K.; Gogoi, M.M.; Babu, S.S. Satellite-retrieved direct radiative forcing of aerosols over North-East India and adjoining areas: Climatology and impact assessment. Int. J. Climatol. 2017. [Google Scholar] [CrossRef]
  21. Remer, L.A.; Kaufman, Y.J. Aerosol direct radiative effect at the top of the atmosphere over cloud free ocean derived from four years of MODIS data. Atmos. Chem. Phys. 2006, 6, 237–253. [Google Scholar] [CrossRef]
  22. Sundström, A.M.; Arola, A.; Kolmonen, P.; Xue, Y.; de Leeuw, G.; Kulmala, M. On the use of satellite remote sensing based approach for determining aerosol direct radiative effect over land: A case study over China. Atmos. Chem. Phys. 2015, 15, 505–518. [Google Scholar] [CrossRef]
  23. Badarinath, K.V.S.; Kharol, S.K.; Kaskaoutis, D.G.; Kambezidis, H.D. Case study of a dust storm over Hyderabad area, India: Its impact on solar radiation using satellite data and ground measurements. Sci. Total Environ. 2007, 384, 316–332. [Google Scholar] [CrossRef] [PubMed]
  24. Badarinath, K.V.S.; Kharol, S.K.; Krishna Prasad, V.; Kaskaoutis, D.G.; Kambezidis, H.D. Variation in aerosol properties over Hyderabad, India during intense cyclonic conditions. Int. J. Remote Sens. 2008, 29, 4575–4597. [Google Scholar] [CrossRef]
  25. Badarinath, K.V.S.; Kharol, S.K.; Sharma, A.R.; Ramaswamy, V.; Kaskaoutis, D.G.; Kambezidis, H.D. Investigations of an intense aerosol loading during 2007 cyclone SIDR—A study using satellite data and ground measurements over Indian region. Atmos. Environ. 2009, 43, 3708–3716. [Google Scholar] [CrossRef]
  26. Kalapureddy, M.C.R.; Kaskaoutis, D.G.; Ernest Raj, P.; Devara, P.C.S.; Kambezidis, H.D.; Kosmopoulos, P.G.; Nastos, P.T. Identification of aerosol type over the Arabian Sea in the premonsoon season during the Integrated Campaign for Aerosols, Gases and Radiation Budget (ICARB). J. Geophys. Res. Atmos. 2009, 114, D17203. [Google Scholar] [CrossRef]
  27. Kaskaoutis, D.G.; Badarinath, K.V.S.; Kharol, S.K.; Sharma, A.R.; Kambezidis, H.D. Variations in the aerosol optical properties and types over the tropical urban site of Hyderabad, India. J. Geophys. Res. Atmos. 2009, 114, 2191–2196. [Google Scholar] [CrossRef]
  28. Badarinath, K.V.S.; Kharol, S.K.; Kaskaoutis, D.G.; Sharma, A.R.; Ramaswamy, V.; Kambezidis, H.D. Long-range transport of dust aerosols over the Arabian Sea and Indian region—A case study using satellite data and ground-based measurements. Glob. Planet. Chang. 2010, 72, 164–181. [Google Scholar] [CrossRef]
  29. Kharol, S.K.; Badarinath, K.V.S.; Sharma, A.R.; Kaskaoutis, D.G.; Kambezidis, H.D. Multiyear analysis of Terra/Aqua MODIS aerosol optical depth and ground observations over tropical urban region of Hyderabad, India. Atmos. Environ. 2011, 45, 1532–1542. [Google Scholar] [CrossRef]
  30. Kaskaoutis, D.; Kosmopoulos, P.; Kambezidis, H.; Nastos, P. Aerosol climatology and discrimination of different types over Athens, Greece, based on MODIS data. Atmos. Environ. 2007, 41, 7315–7329. [Google Scholar] [CrossRef]
  31. Kambezidis, H.D.; Kaskaoutis, D.G. Aerosol climatology over four AERONET sites: An overview. Atmos. Environ. 2008, 42, 1892–1906. [Google Scholar] [CrossRef]
  32. Kaskaoutis, D.G.; Kalapureddy, M.C.R.; Devara, P.C.S.; Kosmopoulos, P.G.; Nastos, P.T.; Krishna Moorthy, K.; Kambezidis, H.D. Spatiotemporal aerosol optical characteristics over the Arabian Sea during the pre monsoon season. Atmos. Chem. Phys. Discuss. 2009, 9, 22223–22269. [Google Scholar] [CrossRef]
  33. Kaskaoutis, D.; Nastos, P.; Kosmopoulos, P.; Kambezidis, H. The combined use of satellite data, air-mass trajectories and model applications for monitoring dust transport over Athens, Greece. Int. J. Remote Sens. 2010, 31, 5089–5109. [Google Scholar] [CrossRef]
  34. Tao, R.; Che, H.Z.; Chen, Q.L.; Tao, J.; Wang, Y.Q.; Sun, J.Y.; Zhang, X.Y. Study of Aerosol Optical Properties Based on Ground Measurements over Sichuan Basin, China. Aerosol Air Qual. Res. 2014, 14, 905–915. [Google Scholar] [CrossRef]
  35. Wang, L.; Gong, W.; Xia, X.; Zhu, J.; Li, J.; Zhu, Z. Long-term observations of aerosol optical properties at Wuhan, an urban site in Central China. Atmos. Environ. 2015, 101, 94–102. [Google Scholar] [CrossRef]
  36. Liu, B.; Cong, Z.; Wang, Y.; Xin, J.; Wan, X.; Pan, Y.; Wang, Y. Background aerosol over the Himalayas and Tibetan Plateau: Observed characteristics of aerosol mass loading. Atmos. Chem. Phys. 2017, 17, 449–463. [Google Scholar] [CrossRef]
  37. Zhang, Y.; Song, C.; Zhang, K.; Cheng, X.; Band, L.E.; Zhang, Q. Effects of land use/land cover and climate changes on terrestrial net primary productivity in the Yangtze River Basin, China, from 2001 to 2010. J. Geophys. Res. Biogeosci. 2014, 119, 1092–1109. [Google Scholar] [CrossRef]
  38. Che, H.; Zhang, X.Y.; Xia, X.; Goloub, P.; Holben, B.; Zhao, H.; Damiri, B. Ground-based aerosol climatology of China: Aerosol optical depths from the China Aerosol Remote Sensing Network (CARSNET) 2002–2013. Atmos. Chem. Phys. 2015, 15, 7619–7652. [Google Scholar] [CrossRef]
  39. Pan, L.; Che, H.; Geng, F.; Xia, X.; Wang, Y.; Zhu, C.; Guo, J. Aerosol optical properties based on ground measurements over the Chinese Yangtze Delta Region. Atmos. Environ. 2010, 44, 2587–2596. [Google Scholar] [CrossRef]
  40. Che, H.; Shi, G.; Uchiyama, A.; Yamazaki, A.; Chen, H.; Goloub, P.; Zhang, X. Intercomparison between aerosol optical properties by a PREDE skyradiometer and CIMEL sunphotometer over Beijing, China. Atmos. Chem. Phys. 2008, 8, 3199–3214. [Google Scholar] [CrossRef]
  41. Remer, L.A.; Kleidman, R.G.; Levy, R.C.; Kaufman, Y.J.; Tanré, D.; Mattoo, S.; Martins, J.V.; Ichoku, C.; Koren, I.; Yu, H.; et al. Global aerosol climatology from the MODIS satellite sensors. J. Geophys. Res. Atmos. 2008, 113, 752–775. [Google Scholar] [CrossRef]
  42. Hsu, N.C.; Jeong, M.J.; Bettenhausen, C.; Sayer, A.M.; Hansell, R.; Seftor, C.S.; Huang, J.; Tsay, S.C. Enhanced Deep Blue aerosol retrieval algorithm: The second generation. J. Geophys. Res. Atmos. 2013, 118, 9296–9315. [Google Scholar] [CrossRef]
  43. Ichoku, C.; Chu, D.A.; Mattoo, S.; Kaufman, Y.J.; Remer, L.A.; Tanré, D.; Holben, B.N. A spatio-temporal approach for global validation and analysis of MODIS aerosol product. Geophys. Res. Lett. 2002, 29. [Google Scholar] [CrossRef]
  44. Christopher, S.A. Satellite remote sensing methods for estimating clear Sky shortwave Top of atmosphere fluxes used for aerosol studies over the global oceans. Remote Sens. Environ. 2011, 115, 3002–3006. [Google Scholar] [CrossRef]
  45. Loeb, N.G.; Kato, S.; Loukachine, K.; Manalo-Smith, N.; Doelling, D.R. Angular distribution models for top-of-atmosphere radiative flux estimation from the Clouds and the Earth’s Radiant Energy System instrument on the Terra satellite. Part II: Validation. J. Atmos. Ocean. Technol. 2007, 24, 564–584. [Google Scholar] [CrossRef]
  46. Zhang, Q.; Xin, J.; Yin, Y.; Wang, L.; Wang, Y. The Variations and Trends of MODIS C5 & C6 Products’ Errors in the Recent Decade over the Background and Urban Areas of North China. Remote Sens. 2016, 8, 754. [Google Scholar]
  47. Xie, Y.; Zhang, Y.; Xiong, X.; Qu, J.J.; Che, H. Validation of MODIS aerosol optical depth product over China using CARSNET measurements. Atmos. Environ. 2011, 45, 5970–5978. [Google Scholar] [CrossRef]
  48. Boiyo, R.; Kumar, K.R.; Zhao, T.; Bao, Y. Climatological analysis of aerosol optical properties over East Africa observed from space-borne sensors during 2001–2015. Atmos. Environ. 2017, 152, 298–313. [Google Scholar] [CrossRef]
  49. Wang, L.; Gong, W.; Singh, R.P.; Xia, X.; Che, H.; Zhang, M.; Lin, H. Aerosol optical properties over Mount Song, a rural site in central China. Aerosol Air Qual. Res. 2015, 15, 2051–2064. [Google Scholar] [CrossRef]
  50. Yang, K.; Wu, H.; Qin, J.; Lin, C.; Tang, W.; Chen, Y. Recent climate changes over the Tibetan Plateau and their impacts on energy and water cycle: A review. Glob. Planet. Chang. 2014, 112, 79–91. [Google Scholar] [CrossRef]
  51. Yu, X.; Zhu, B.; Fan, S.; Yin, Y.; Bu, X. Ground-based observation of aerosol optical properties in Lanzhou, China. J. Environ. Sci. 2009, 21, 1519–1524. [Google Scholar] [CrossRef]
  52. Huang, J.; Minnis, P.; Yi, Y.; Tang, Q.; Wang, X.; Hu, Y.; Winker, D. Summer dust aerosols detected from CALIPSO over the Tibetan Plateau. Geophys. Res. Lett. 2007, 34, 529–538. [Google Scholar] [CrossRef]
  53. Chen, S.; Huang, J.; Zhao, C.; Qian, Y.; Leung, L.R.; Yang, B. Modeling the transport and radiative forcing of Taklimakan dust over the Tibetan Plateau: A case study in the summer of 2006. J. Geophys. Res. Atmos. 2013, 118, 797–812. [Google Scholar] [CrossRef]
  54. Wang, K.; Liu, J.; Zhou, X.; Sparrow, M.; Ma, M.; Sun, Z.; Jiang, W. Validation of the MODIS global land surface albedo product using ground measurements in a semidesert region on the Tibetan Plateau. J. Geophys. Res. Atmos. 2004, 109, D05107. [Google Scholar] [CrossRef]
  55. Cao, J.J.; Lee, S.C.; Chow, J.C.; Watson, J.G.; Ho, K.F.; Zhang, R.J.; Zou, S.C. Spatial and seasonal distributions of carbonaceous aerosols over China. J. Geophys. Res. Atmos. 2007, 112. [Google Scholar] [CrossRef]
  56. Penner, J.E.; Charlson, R.J.; Schwartz, S.E.; Hales, J.M.; Laulainen, N.S.; Travis, L.; Radke, L.F. Quantifying and minimizing uncertainty of climate forcing by anthropogenic aerosols. Bull. Am. Meteorol. Soc. 1994, 75, 375–400. [Google Scholar] [CrossRef]
  57. Wang, L.; Chen, Y.; Niu, Y.; Salazar, G.; Gon, W. Analysis of Atmospheric Turbidity in Clear Skies at Wuhan, Central China. J. Earth Sci. 2017, 28, 729–738. [Google Scholar] [CrossRef]
  58. Zhang, M.; Ma, Y.; Gong, W.; Wang, L.; Xia, X.; Che, H.; Hu, B.; Liu, B. Aerosol radiative effect in UV, VIS, NIR, and SW spectra under haze and high-humidity urban conditions. Atmos. Environ. 2017. [Google Scholar] [CrossRef]
Figure 1. The location of Yangtze River Basin (YRB) over China. The urban (Chengdu) and rural (Dongtan and Changde) China Aerosol Remote Sensing Network (CARSNET) stations are marked with red point and red square, respectively.
Remotesensing 09 00746 g001
Figure 2. The flow diagram for calculating the Shortwave (SW) instantaneous aerosol direct radiative effect (IADRE) at the top-of-atmosphere (TOA). The IADRE is estimated by linear fitting the concurrent Clouds and the Earth’s Radiant Energy System (CERES) SW TOA fluxes and Moderate Resolution Imaging Spectroradiometer (MODIS) aerosol optical depth at 550nm (AOD550) selected from the CERES_SSF_FM1_MODIS_Ed3A product in each 1° × 1° grid cell over YRB for the period 2001–2015.
Remotesensing 09 00746 g002
Figure 3. Scatter plots of MODIS (DB) AOD550 and CARSNET AOD550 over: (a) Chengdu (2007–2010); (b) Changde (2007–2011); and (c) Dongtan (2009–2011). The red solid line indicates the regression line and the blue dash line indicates 1:1 line.
Remotesensing 09 00746 g003
Figure 4. Variations of monthly averaged AOD550 (a), Ångström exponent at 470–660 nm (AE470–660 (b)), and water vapor content (WVC (c)) over YRB during 2001–2015. The error bars represent the standard deviations of AOD550, AE470660 and WVC in each month.
Remotesensing 09 00746 g004
Figure 5. Monthly and seasonal variations of regional average AOD550 (a,b), AE470–660 (c,d), and WVC (e,f) over YRB for the period 2001–2015. The error bars represent the standard deviations of AOD550, AE470–660 and WVC in each month or season.
Remotesensing 09 00746 g005
Figure 6. Spatial distribution of annual mean AOD550 over YRB for the period 2001–2015.
Remotesensing 09 00746 g006
Figure 7. Spatial distribution of seasonal mean AOD550 values over YRB for the period January 2001–December 2015.
Remotesensing 09 00746 g007
Figure 8. Frequency distribution of annual mean AOD550 (a), AE470–660 (b) and WVC (c) values over YRB during 2001–2015.
Remotesensing 09 00746 g008
Figure 9. Frequency distribution of seasonal mean AOD550 (a), AE470–660 (b), and WVC (c) values over YRB during 2001–2015.
Remotesensing 09 00746 g009
Figure 10. Annual variation (a) and linear regression (b) of AOD550 and SW TOA IADRE over YRB for the period 2001–2015.
Remotesensing 09 00746 g010
Figure 11. Monthly (a) and seasonal (b) variation of SW TOA IADRE over YRB for the period 2001–2015. The error bars represent the standard deviations of IADRE in each month or season.
Remotesensing 09 00746 g011
Figure 12. Annual spatial distribution of SW TOA IADRE over YRB during 2001–2015.
Remotesensing 09 00746 g012
Figure 13. Seasonal spatial distribution of SW TOA IADRE over YRB during 2001–2015.
Remotesensing 09 00746 g013
Figure 14. Calculation of the monthly IADRE efficiency using the median values of IADRE and AOD550 over YRB for the period 2001–2015.
Remotesensing 09 00746 g014
Figure 15. Monthly (a) and seasonal (b) variation of IADRE efficiency over YRB during 2001–2015. The bars indicate the relative error in each month or season.
Remotesensing 09 00746 g015
Table 1. Characteristics of satellite and ground-based data used in this study.
SensorProductLevelParameterSpatial ResolutionTemporal ResolutionTemporal CoverageApplication
CARSNET-1.5AOD-Daily2007–2011Validation of MODIS AOD and CARSNET AOD
MODISMOD042.0AOD (DB)10 kmDaily2007–2011
MODISMOD083.0AOD, AE WVCMonthly2001–2015Analysis of aerosol optical properties
CERESSSF2.0AOD, SW Flux20 kmInstantaneous2001–2015Estimation of aerosol direct radiative effect
Table 2. Statistics of multi-year monthly, seasonal and annual mean Shortwave (SW) instantaneous aerosol direct radiative effect (IADRE) at the top-of-atmosphere (TOA).
MonthIADRE (Wm−2)YearIADRE (Wm−2)
January−27.74 ± 8.512001−46.65 ± 11.32
February−36.74 ± 8.752002−41.35 ± 9.56
March−39.42 ± 8.702003−42.50 ± 7.22
April−41.95 ± 6.382004−42.22 ± 7.80
May−38.96 ± 11.072005−48.76 ± 8.08
June−41.87 ± 8.702006−33.06 ± 10.93
July−39.98 ± 6.682007−32.75 ± 7.81
August−40.19 ± 9.862008−31.89 ± 7.73
September−36.98 ± 7.022009−33.12 ± 8.20
October−32.41 ± 9.602010−31.59 ± 8.13
November−28.18 ± 7.582011−30.96 ± 5.20
December−24.76 ± 7.332012−29.98 ± 4.79
Spring−40.01 ± 8.302013−27.99 ± 6.12
Summer−40.71 ± 6.862014−30.20 ± 7.61
Autumn−32.52 ± 6.522015−31.13 ± 5.82
Winter−29.19 ± 7.04Annual−35.60 ± 6.71
Table 3. Comparison with previous reports on multi-year annual mean values of AOD550, SW TOA flux with aerosol (Faero), without (Fclr), IADRE and IADRE efficiency.
ReferenceStudy AreaData/Time CoverageMethodAOD550Fclr (Wm−2)Faero (Wm−2)IADRE (Wm−2)IADRE Efficiency (Wm−2τ−1)
Jhuma Biswas et al. [20]Northeast IndiaCERES-SSF-XTPK-Aqua July 2002–December 2013Satellite-retrieved0.09~0.67131~270150~340−4.43~−70.66 (seasonal)−19.9~−435.97 (seasonal)
Feng and Christopher [19]Southeast AsiaCERES-SSF-Terra 2001–2010Satellite-retrieved0.24 ± 0.04 (land)150.0 ± 8.6 (land)160.9 ± 2.6 (land)−12.8 ± 2.1 (land)−32.9 ± 9.6 (land)
Sundström et al. [22]East ChinaCERES-SSF-Terra March–October 2009Satellite-retrievedN/AN/AN/A−8.8N/A
Kang et al. [15]Nanjing ChinaAERONET/OMI September 2007–August 2008Model-simulated0.95 ± 0.41 (500 nm)N/AN/A−21.85~33.85−26.05~−45.46
Xia et al. [14]YRD ChinaSunphotometer ground-based dataModel-simulated0.04~0.74N/AN/A−16~−37−48~−59
Yu et al. [16]Beijing ChinaAERONETModel-simulated1.2 (dust) 0.7 (non) (440 nm)N/AN/A−66~−116 (dust day) −13~−23 (non-dust)−33~−50 (dust day) −15~−27 (non-dust)
This studyYangtze River ChinaCERES-SSF-Terra 2001–2015Satellite-retrieved0.39 ± 0.48151.59 ± 3.76192.31 ± 11.39−35.60 ± 6.71−65.18 ± 7.79
Table 4. Statistics of the sources and magnitudes of diverse uncertainties in IADRE.
ReferenceSource of Uncertainty in IADREUncertainty in IADRE (Wm−2)
Loeb et al. [45]Calibration of CERES radiances±0.4
CERES radiances unfiltering±0.4
Patadia et al. [2]Conversion of CERES TOA radiances to fluxes±0.4
Feng et al. [18]Cloud contamination±0.5
This studyEstimation of the Fclr caused by linear regression±1.6
This studyTotal uncertainty±1.8

