Article

Influence of Ecological Factors on Estimation of Impervious Surface Area Using Landsat 8 Imagery

1
Key Lab of Urban Environment and Health, Institute of Urban Environment, Chinese Academy of Sciences, Xiamen 361021, China
2
University of Chinese Academy of Sciences, Beijing 100049, China
*
Author to whom correspondence should be addressed.
Remote Sens. 2017, 9(7), 751; https://doi.org/10.3390/rs9070751
Submission received: 25 May 2017 / Revised: 16 July 2017 / Accepted: 18 July 2017 / Published: 21 July 2017
(This article belongs to the Section Remote Sensing in Geology, Geomorphology and Hydrology)

Abstract

:
Estimation of impervious surface area is important to the study of urban environments and social development, but surface characteristics, as well as the temporal, spectral, and spatial resolutions of remote sensing images, influence the estimation accuracy. To investigate the effects of regional environmental characteristics on the estimation of impervious surface area, we divided China into seven sub-regions based on climate, soil type, feature complexity, and vegetation phenology: arid and semi-arid areas, Huang-Huai-Hai winter wheat production areas, typical temperate regions, the Pearl River Delta, the middle and lower reaches of the Yangtze River, typical tropical and subtropical regions, and the Qinghai Tibet Plateau. Impervious surface area was estimated from Landsat 8 images of five typical cities, including Yinchuan, Shijiazhuang, Shenyang, Ningbo, and Kunming. Using the linear spectral unmixing method, impervious and permeable surface areas were determined at the pixel-scale based on end-member proportions. We calculated the producer’s accuracy, user’s accuracy, and overall accuracy to assess the estimation accuracy, and compared the accuracies among images acquired from different seasons and locations. In tropical and subtropical regions, vegetation canopies can confound the identification of impervious surfaces and, thus, images acquired in winter, early spring, and autumn are most suitable; estimations in the Pearl River Delta, the middle and lower reaches of the Yangtze River are influenced by soil, vegetation phenology, vegetation canopy, and water, and images acquired in spring, summer, and autumn provide the best results; in typical temperate areas, images acquired from spring to autumn are most effective for estimations; in winter wheat-growing areas, images acquired throughout the year are suitable; and in arid and semi-arid areas, summer and early autumn, during which vegetation is abundant, are the optimal seasons for estimations. Knowledge of optimal time frames, multi-source data, and intelligent algorithms should be integrated to reduce spectral confusion and improve the estimation of impervious surface area from Landsat 8 OLI imagery.

Graphical Abstract

1. Introduction

The spatial distribution of impervious surfaces influences surface hydrology, heat accumulation, and conduction. Thus, these land types are a source of environmental concern in developed areas. The high density of impervious areas in urban centers corresponds to low vegetation density, and the temperature of urban areas is significantly higher than in surrounding suburbs, causing a heat island effect [1,2,3]. Due to the lack of surface water infiltration, urban water resources are growing increasingly sparse [4]. During the rainy season, storm runoff stresses urban drainage systems, reduces flood duration, increases peak flow, and causes a large number of problems associated with urban waterlogging [5]. To cope with common ecological and environmental problems, scientists have introduced the concept of sustainable urban construction, such as “sponge cities”, “ecological cities”, etc. Impervious surfaces also are an important entity of human life and production, and their extensive spatial distribution reflects the intensive use of urban land [6]. Time series of impervious surface areas provide information on urban expansion and development [7,8,9].
Since the 1970s, remote sensing imagery has become a main tool for estimations of impervious surface area [10,11], and medium-resolution products from Landsat 5 and 7 have been widely employed [12,13,14,15,16,17]. Although Landsat 7 imagery is limited due to stripe noise, Landsat 8 has filled the gaps and provides higher quality data. The average apparent reflectance and surface reflectance of each band of images obtained by the Operational Land Imager (OLI) are greater than the corresponding values for the Enhanced Thematic Mapper (ETM+). Vegetation indices calculated from reflectance are correlated with the vegetation index ETM+ and can be used to distinguish between impervious surfaces and soil [18,19,20,21,22,23].
Identification of impervious surfaces depends on the satellite's return period, as well as its spectral and spatial resolutions [24]. These parameters are important because they influence the ability to distinguish between impervious surfaces and other land-cover types. Analysis of environmental conditions can help one choose images acquired at the ideal time for accurately estimating impervious surface area. Researchers have reported that images acquired in summer (June to September) result in higher extraction accuracy relative to other seasons in temperate cities of the United States [25,26,27]. Sung and Li [28] proposed that winter images are more suitable for tropical and subtropical regions. Ecological and geographical conditions, as well as city development modes in China differ from those in the United States, so local conditions should be considered.
Research on urbanization and environmental problems in China would benefit from estimations of the impervious surface area for a greater number of urban cities [7]. In this study, we divided China into several regions based on climate, soil type, terrain complexity, and vegetation phenology, and estimated impervious surface area from Landsat 8 images of typical cities in these regions. The main goal was to determine appropriate time frames for image selection by comparing the estimation accuracy for images acquired from different seasons.

2. Impervious Surface Factors

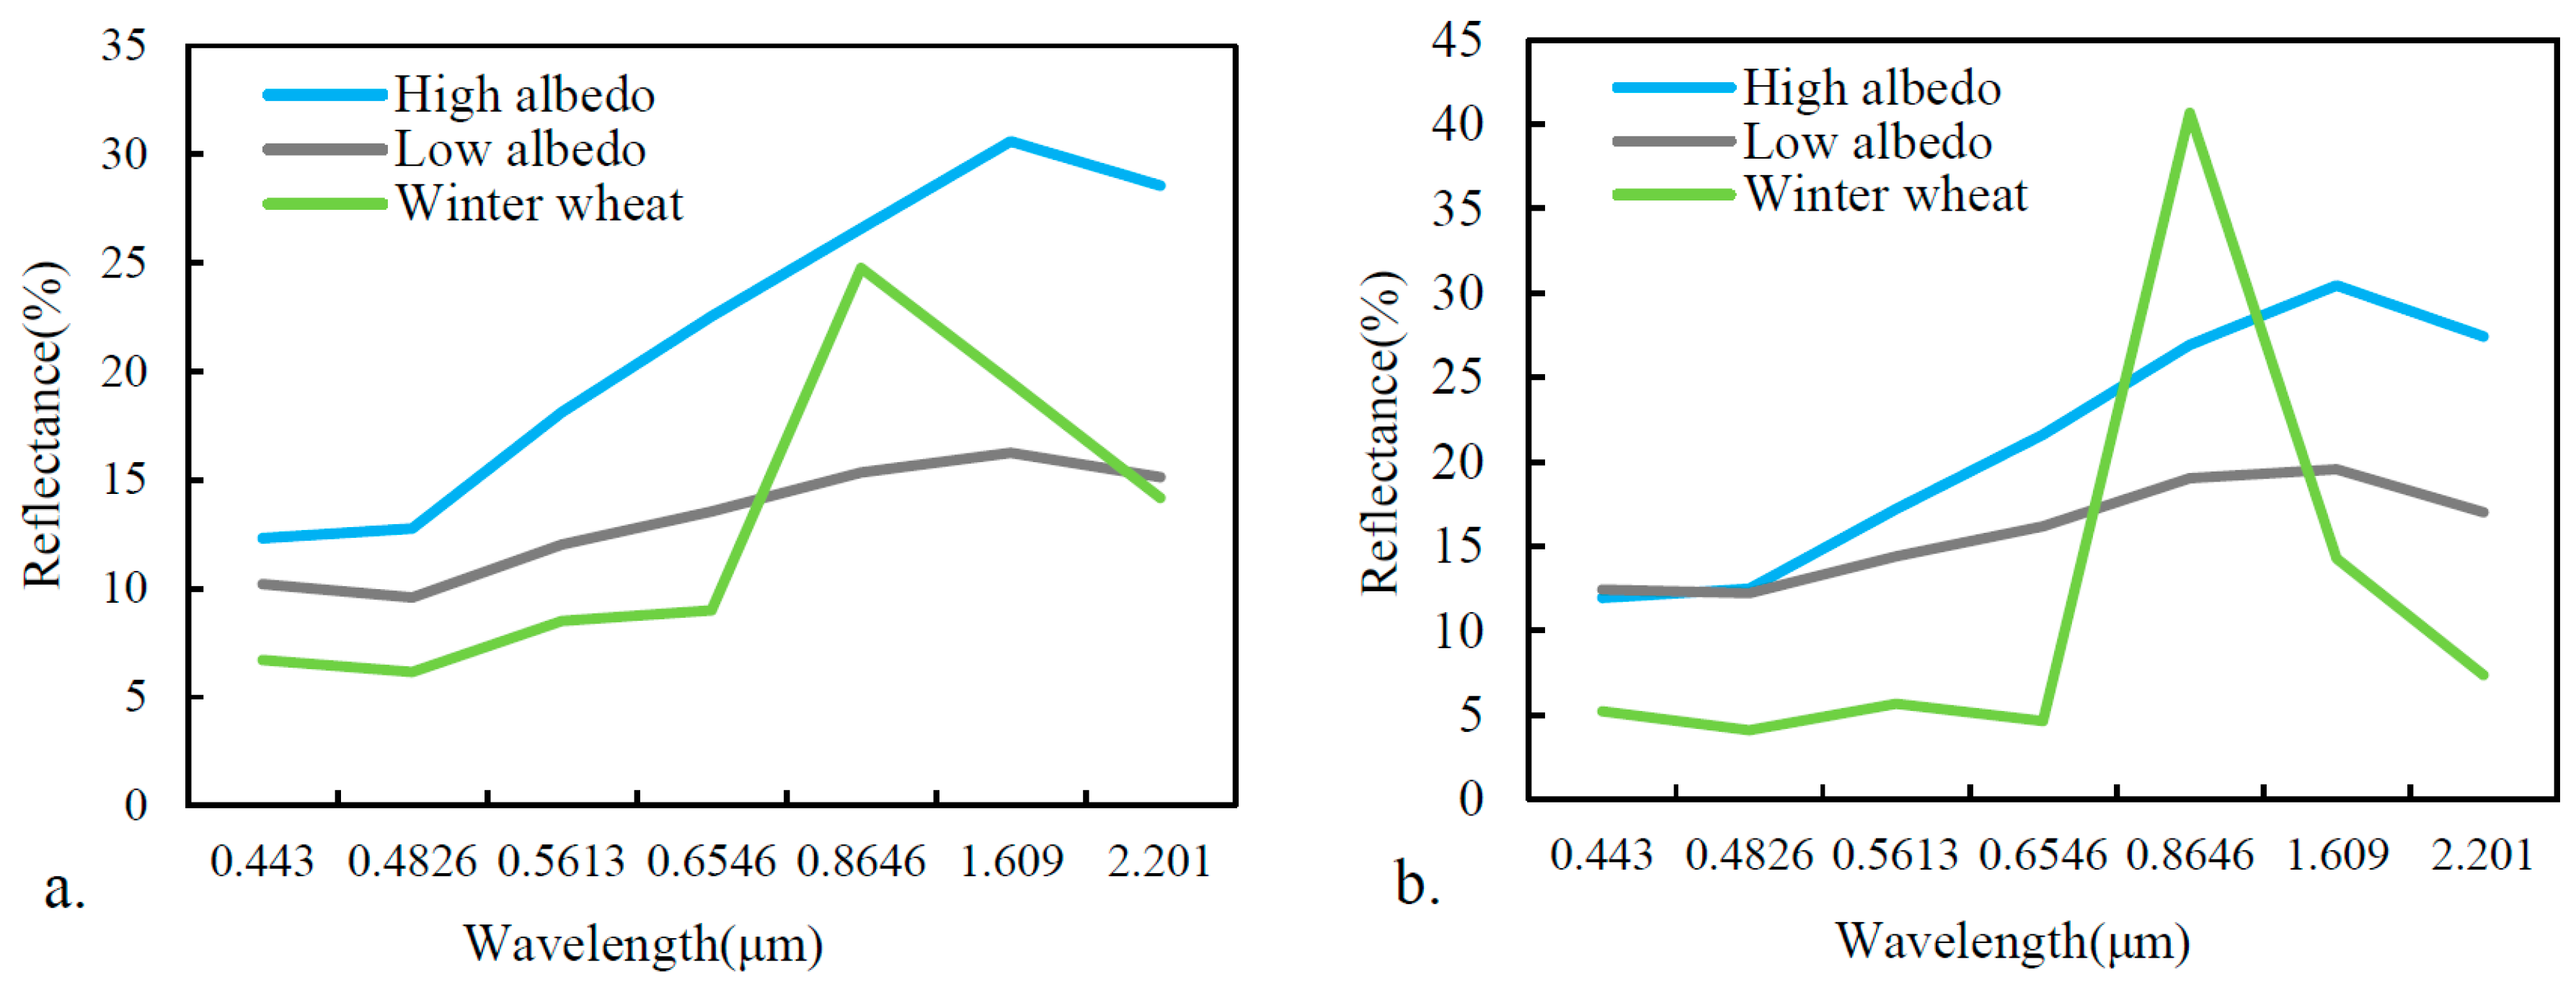
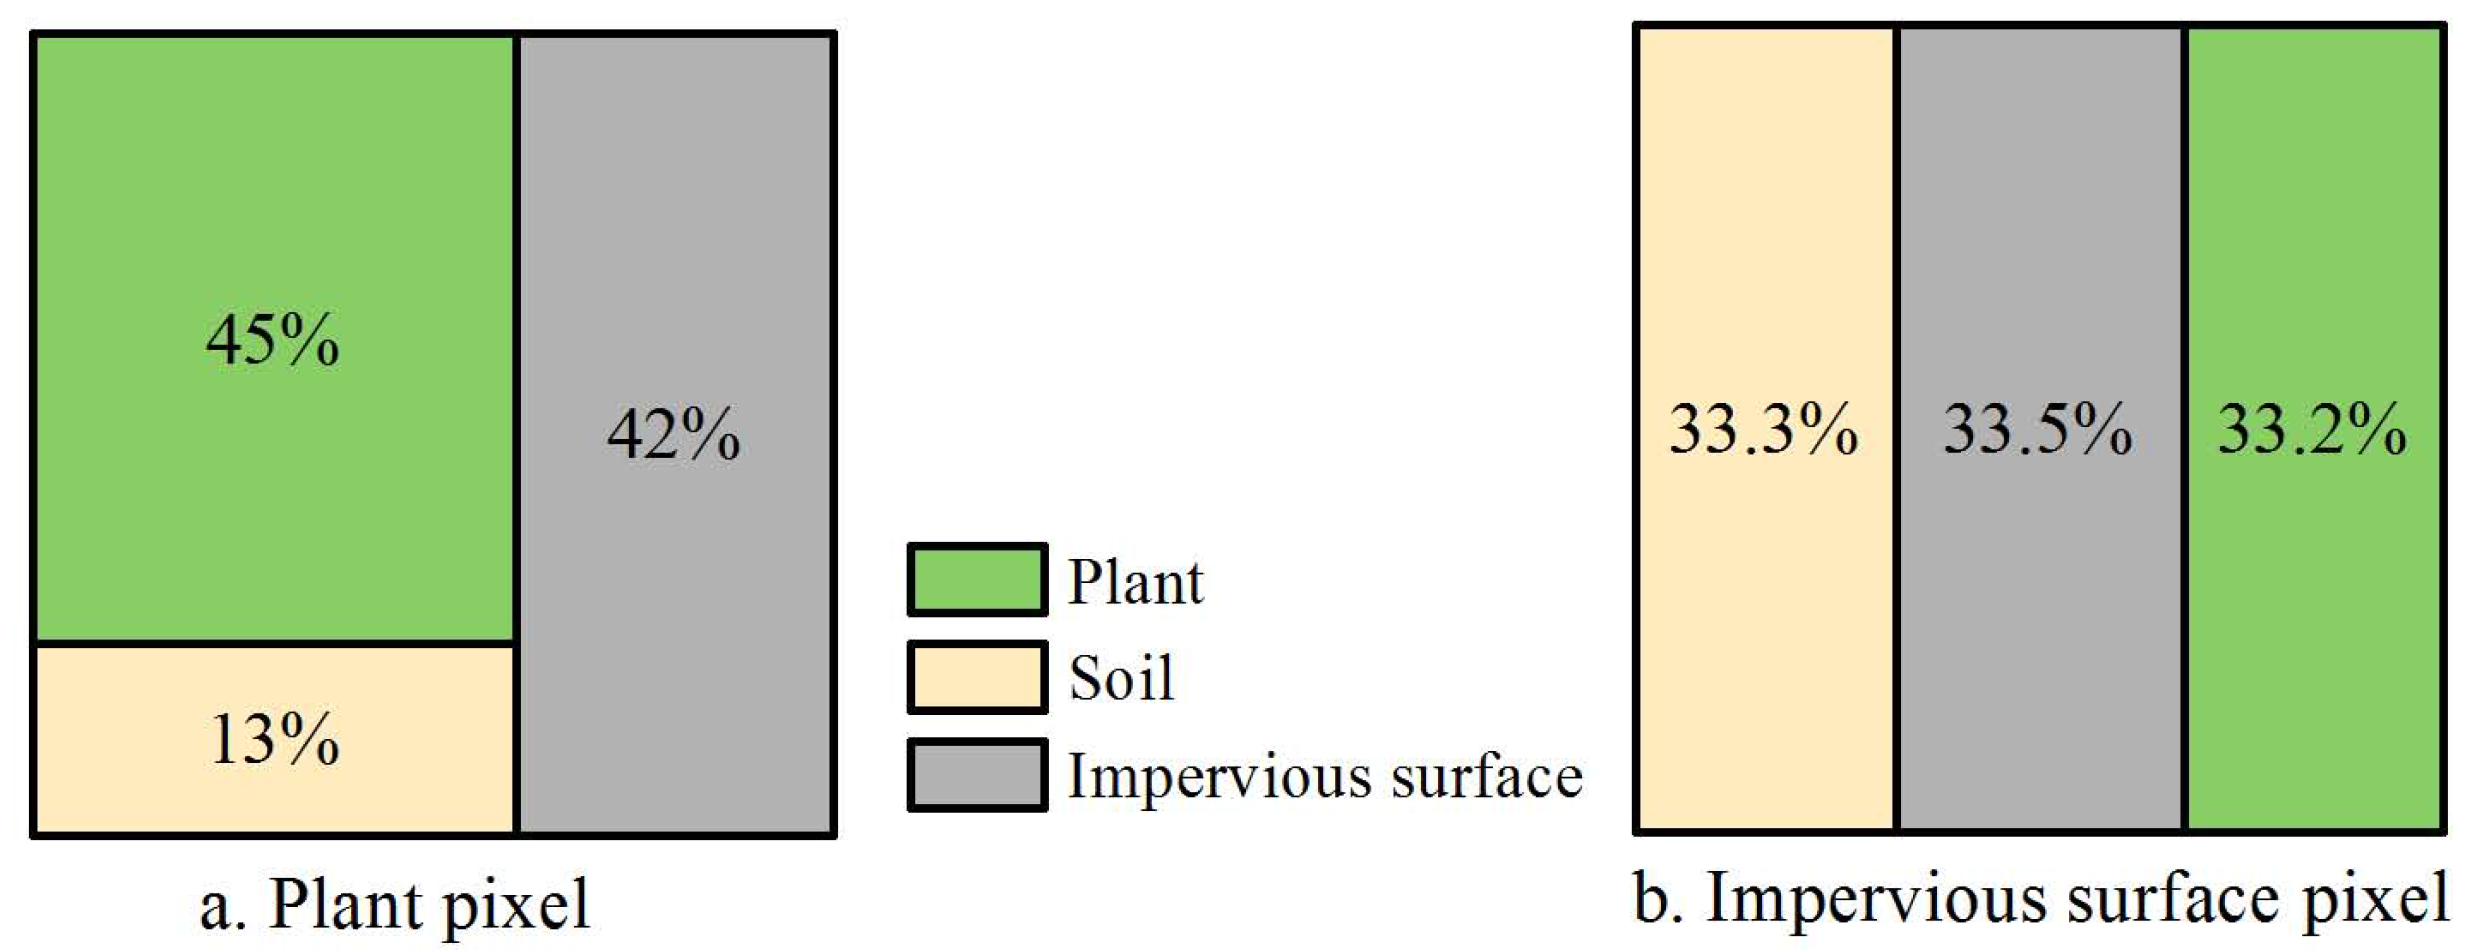
2.1. Vegetation and Impervious Surfaces

The reflectance of photosynthetic vegetation increases rapidly in the near infrared (NIR) region, but decreases sharply in the shortwave infrared (SWIR) region. This behavior results in unique spectral curves for vegetation, which helps distinguish between impervious cover and vegetation. In addition, it is easier to distinguish between impervious surfaces and vegetation in images acquired in summer. However, the characteristics of vegetation growth vary between the north and the south of China. Evergreens in tropical and subtropical areas are easily distinguishable any time of year, whereas the reflectance of deciduous vegetation in temperate zones vary seasonally. In temperate agricultural areas, winter wheat is sown in October and harvested in early June. As shown in an image of Shijiazhuang taken on 1 January (Figure 1), during the over-wintering period, winter wheat growth is arrested and biomass is low, causing lower NIR reflectance than during the heading stage (23 April). However, in both images, vegetation and impervious surfaces display unique spectral curves. Harvesting of winter wheat in early June results in increased bare land, and further study is required to assess the suitability of the July image for land type estimations. Hence, vegetation phenology should be considered when selecting images for land cover estimations.
Seasonal vegetation causes the proportion of mixed pixels in an image to fluctuate, especially in temperate cities. Sung and Li [28] mentioned that vegetation canopies can cause underestimation of impervious surface areas, particularly in summer. For improved accuracy, Yang and Li [29] used auxiliary road data to account for this problem. In imagery of temperate cities, deciduous vegetation is conducive to the classification of roads and buildings, but changes in other environmental conditions (e.g., soil) may cause other problems. In addition to seasonal changes, the height and density of vegetation influences the proportion of mixed pixels in an image. As new area of modern cities have a lot of vegetation coverage, the underestimation of impervious surfaces will become a more serious issue.

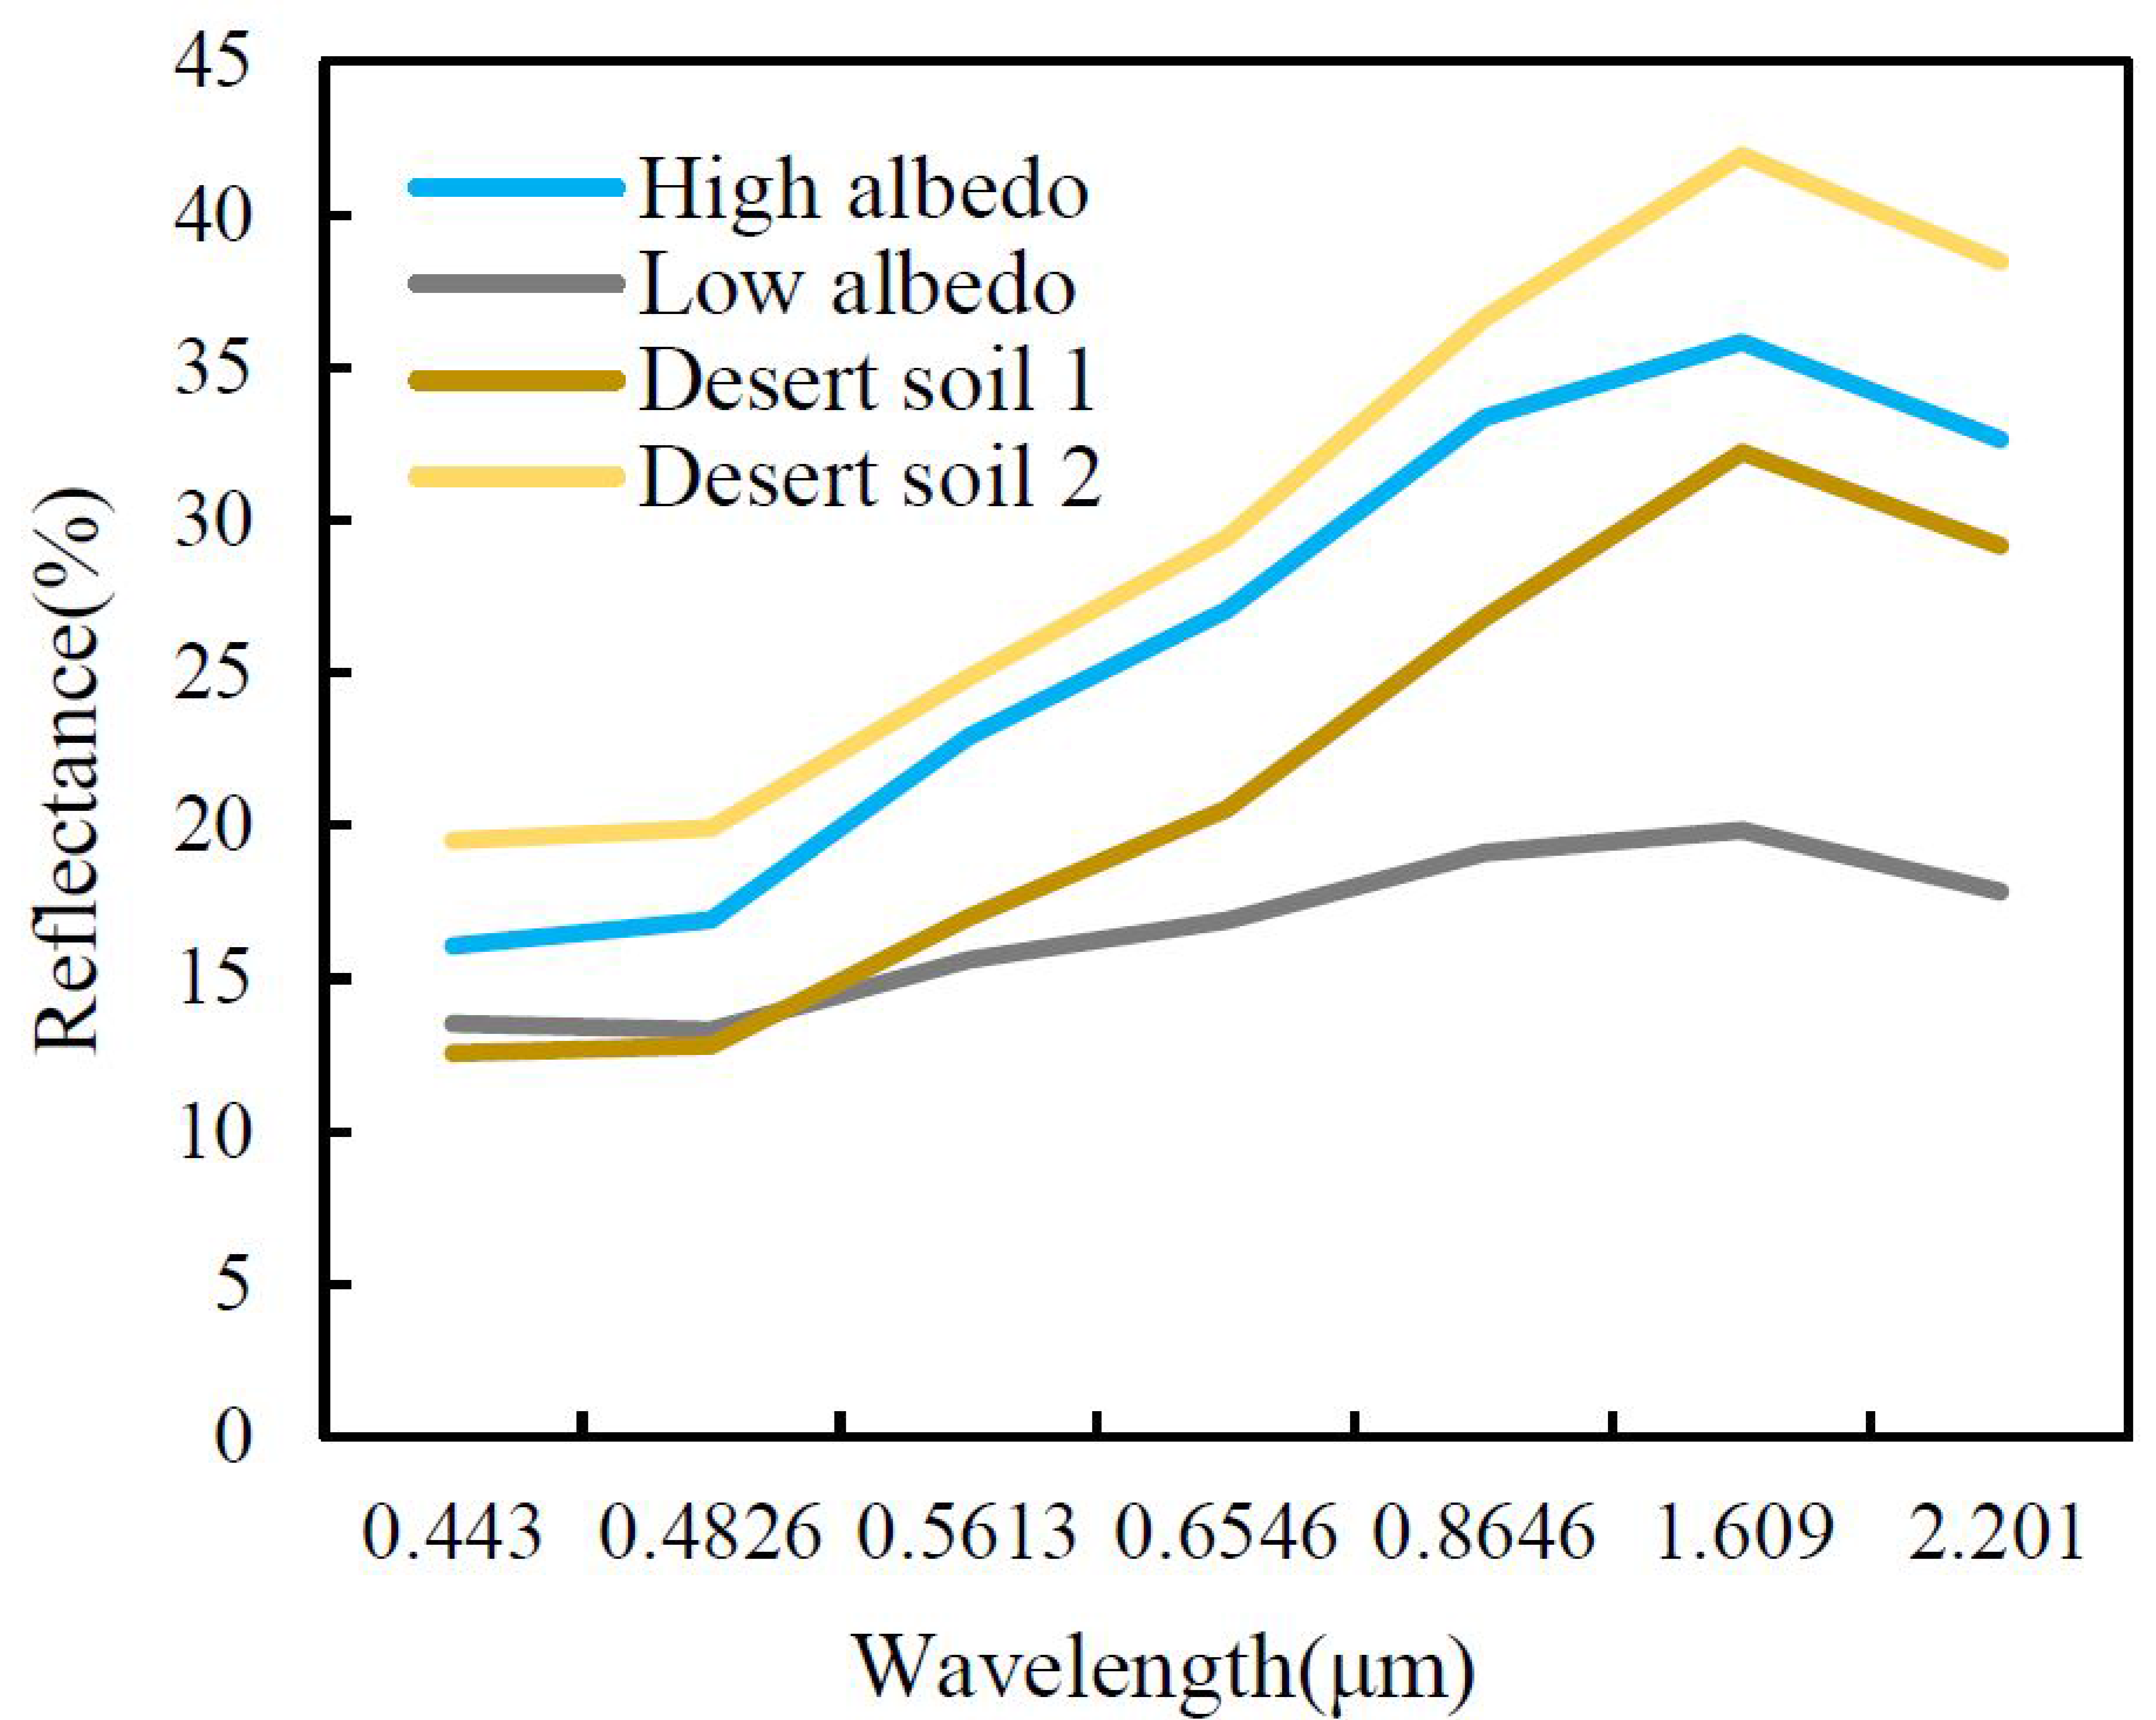
2.2. Soil and Impervious Surfaces

Ridd [30] developed the vegetation-impervious surface-soil model for mixed pixels based on soil compositions of clay, sand, and silt. In particular, the spectral curves of sandy soils with low moisture content are similar to those of high-albedo impervious surfaces (Figure 2); the curves of certain types of loam with high water content are similar to those of low-albedo impervious surfaces. Therefore, to assess impervious surface area, it is necessary to discuss the surrounding soil. There are many different types of soils in China, and they are characterized according to horizontal and vertical zonality. Soil water and soil organic matter content gradually change from south to north and from coastal areas to inland. Thus, districts of soils with high water content and desert soils with low water content should be paid more attention on the divisibility of impervious surfaces.

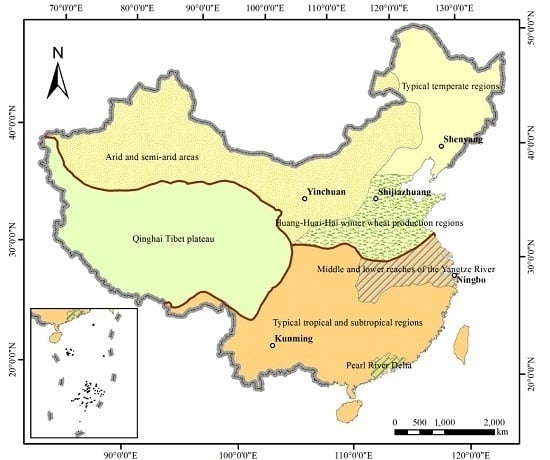
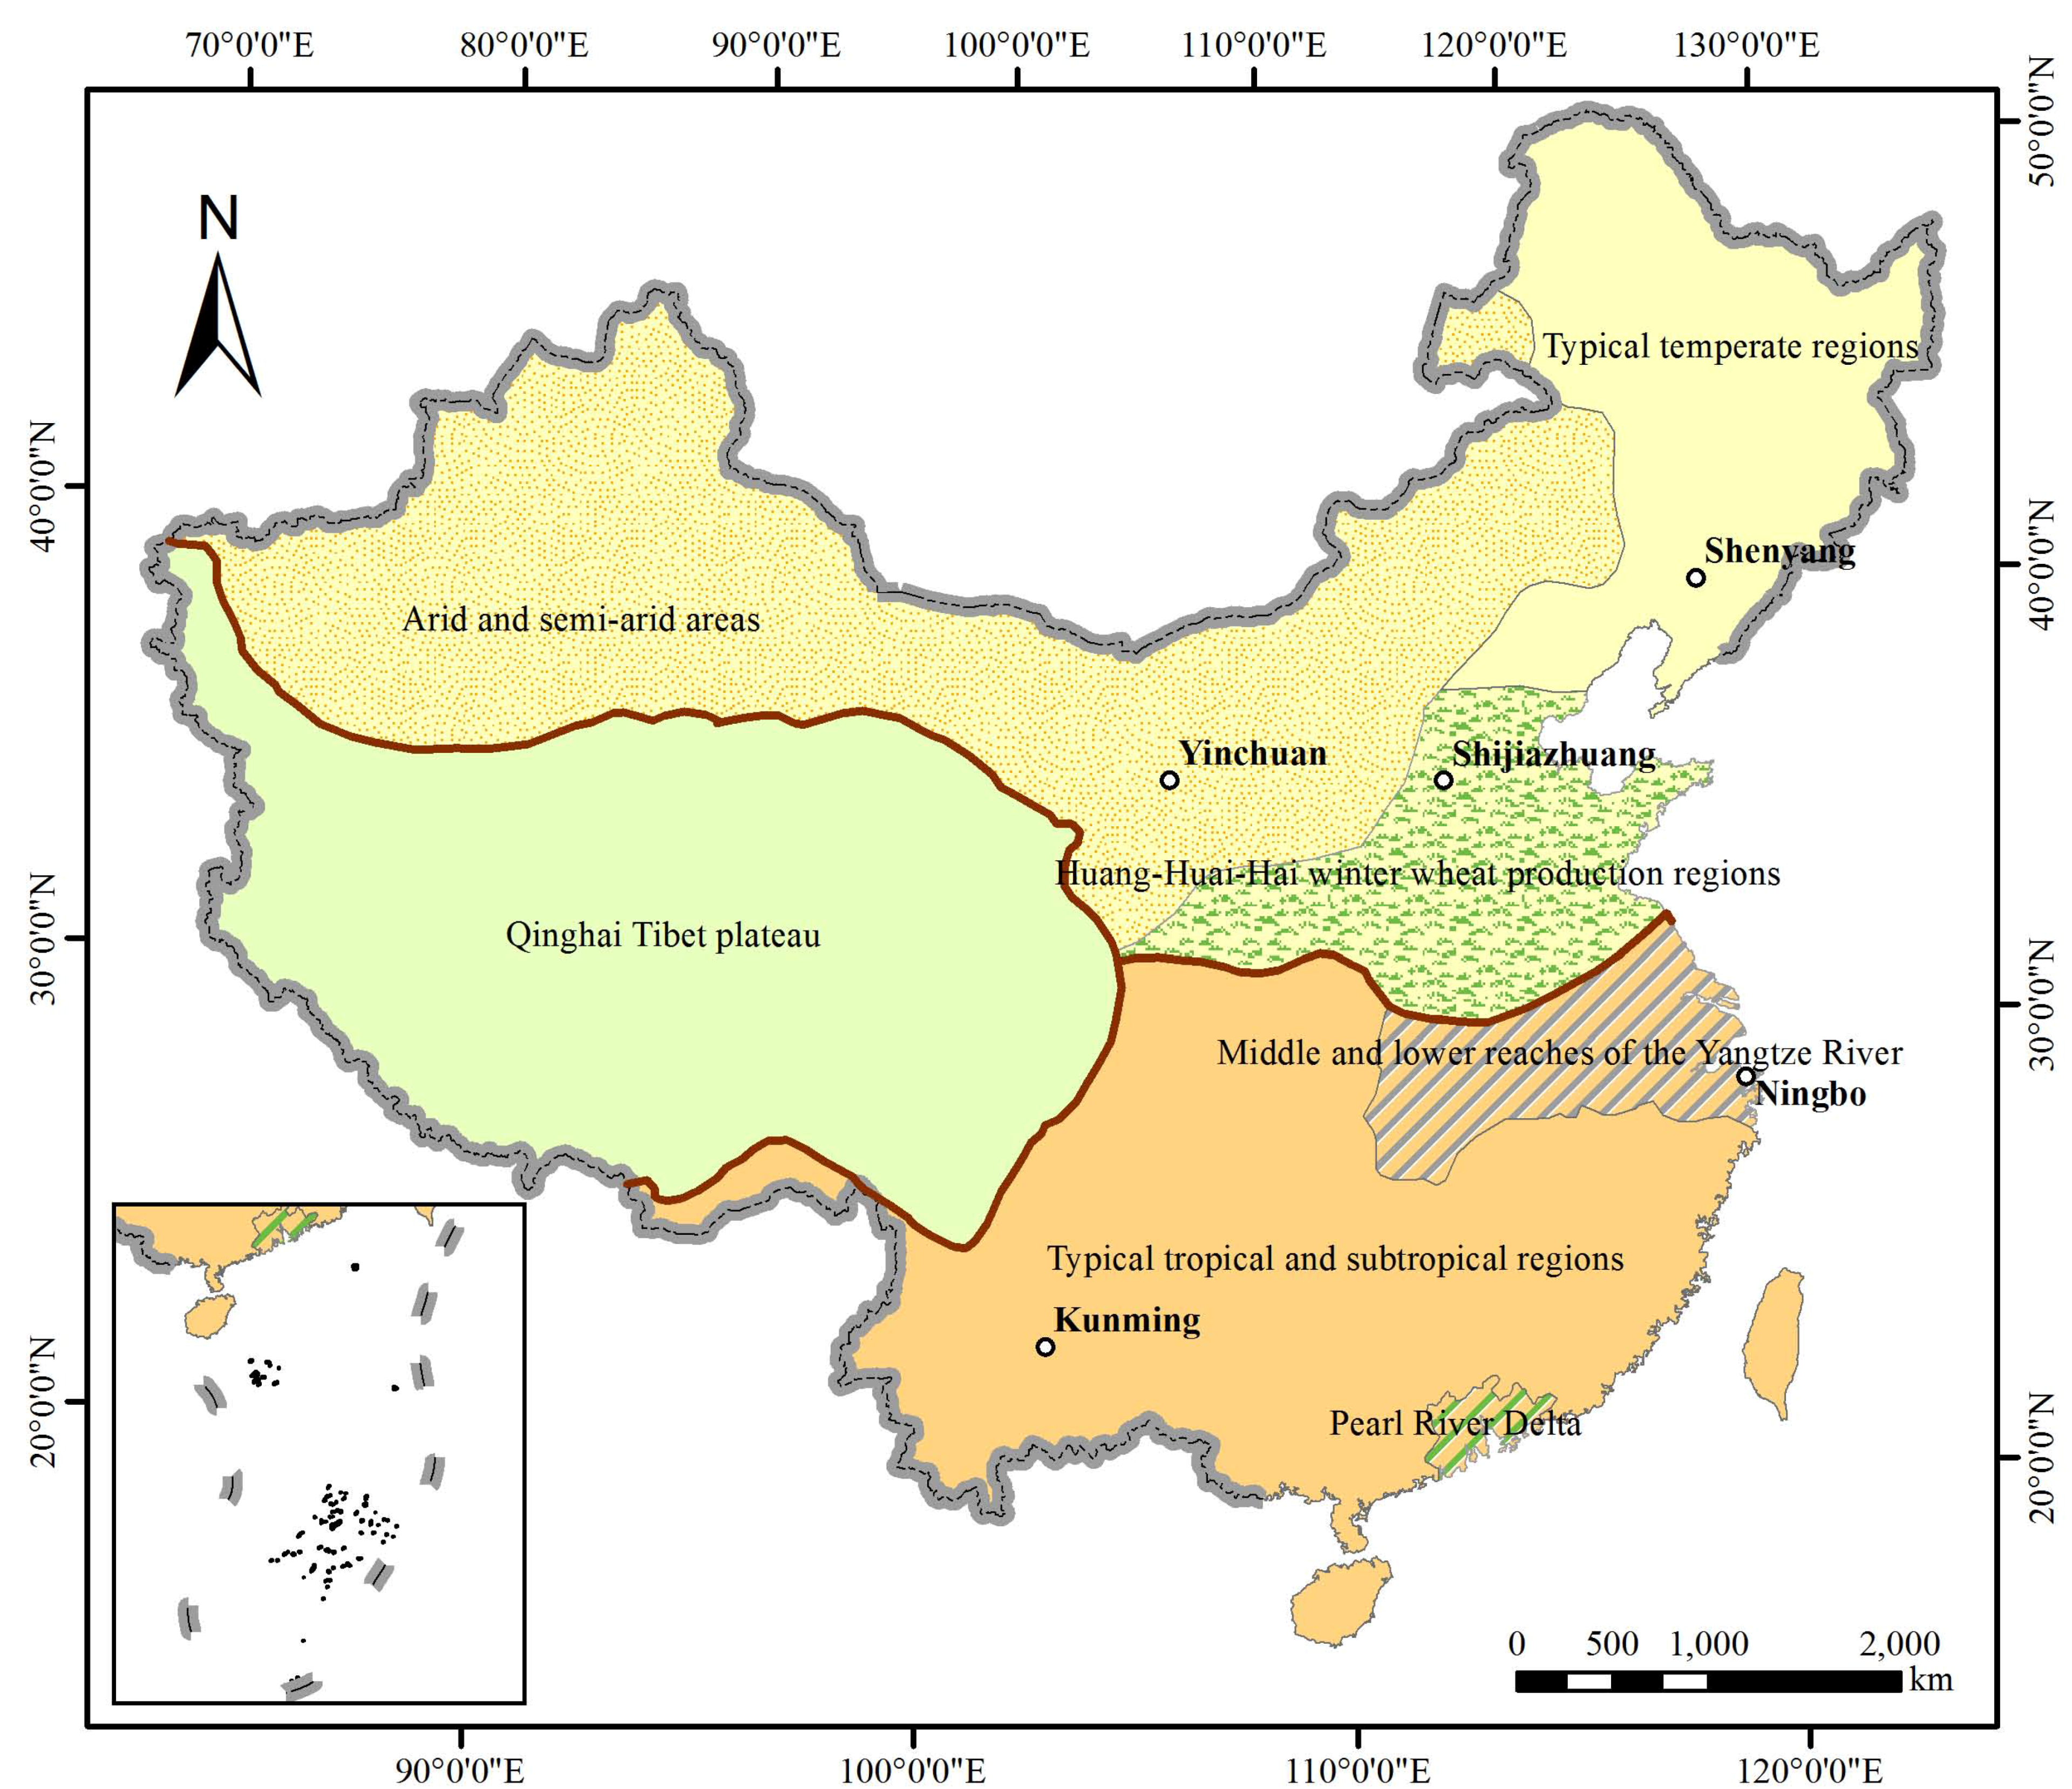
2.3. Ecological Regionalization

Impervious surfaces include a variety of materials, such as tile, metal, or glass roofs, asphalt or cement roads, and so on. At present, the spectral and spatial resolutions of Landsat 8 images are not sufficient to distinguish these materials from diverse objects. In addition, the impacts of shadows of high-rise buildings, human activities, and other factors on impervious surface extraction are uncertain, and variations exist between cities and seasons. To investigate the influence of main factors on impervious surface extraction, we divided China into several sub-regions according to climate zone, soil type, and drainage area at a large scale: arid and semi-arid areas, the Huang-Huai-Hai winter wheat production regions, typical temperate regions, the Pearl River Delta, the middle and lower reaches of the Yangtze River, typical tropical and subtropical regions, and the Qinghai–Tibet Plateau (Figure 3). Seasonal vegetation influences impervious surface areas in arid and semi-arid areas, as well as in temperate regions, and dry soil is another key factor. In the Huang-Huai-Hai winter wheat region, vegetation varies according to winter wheat phenology. In the Pearl River Delta and the middle and lower reaches of the Yangtze River, vegetation is similar to that in tropical and subtropical regions, and the land is characterized by dense river networks, discontinuous fields, and paddy soil; hence, the background of impervious surfaces is complex.

3. Methods

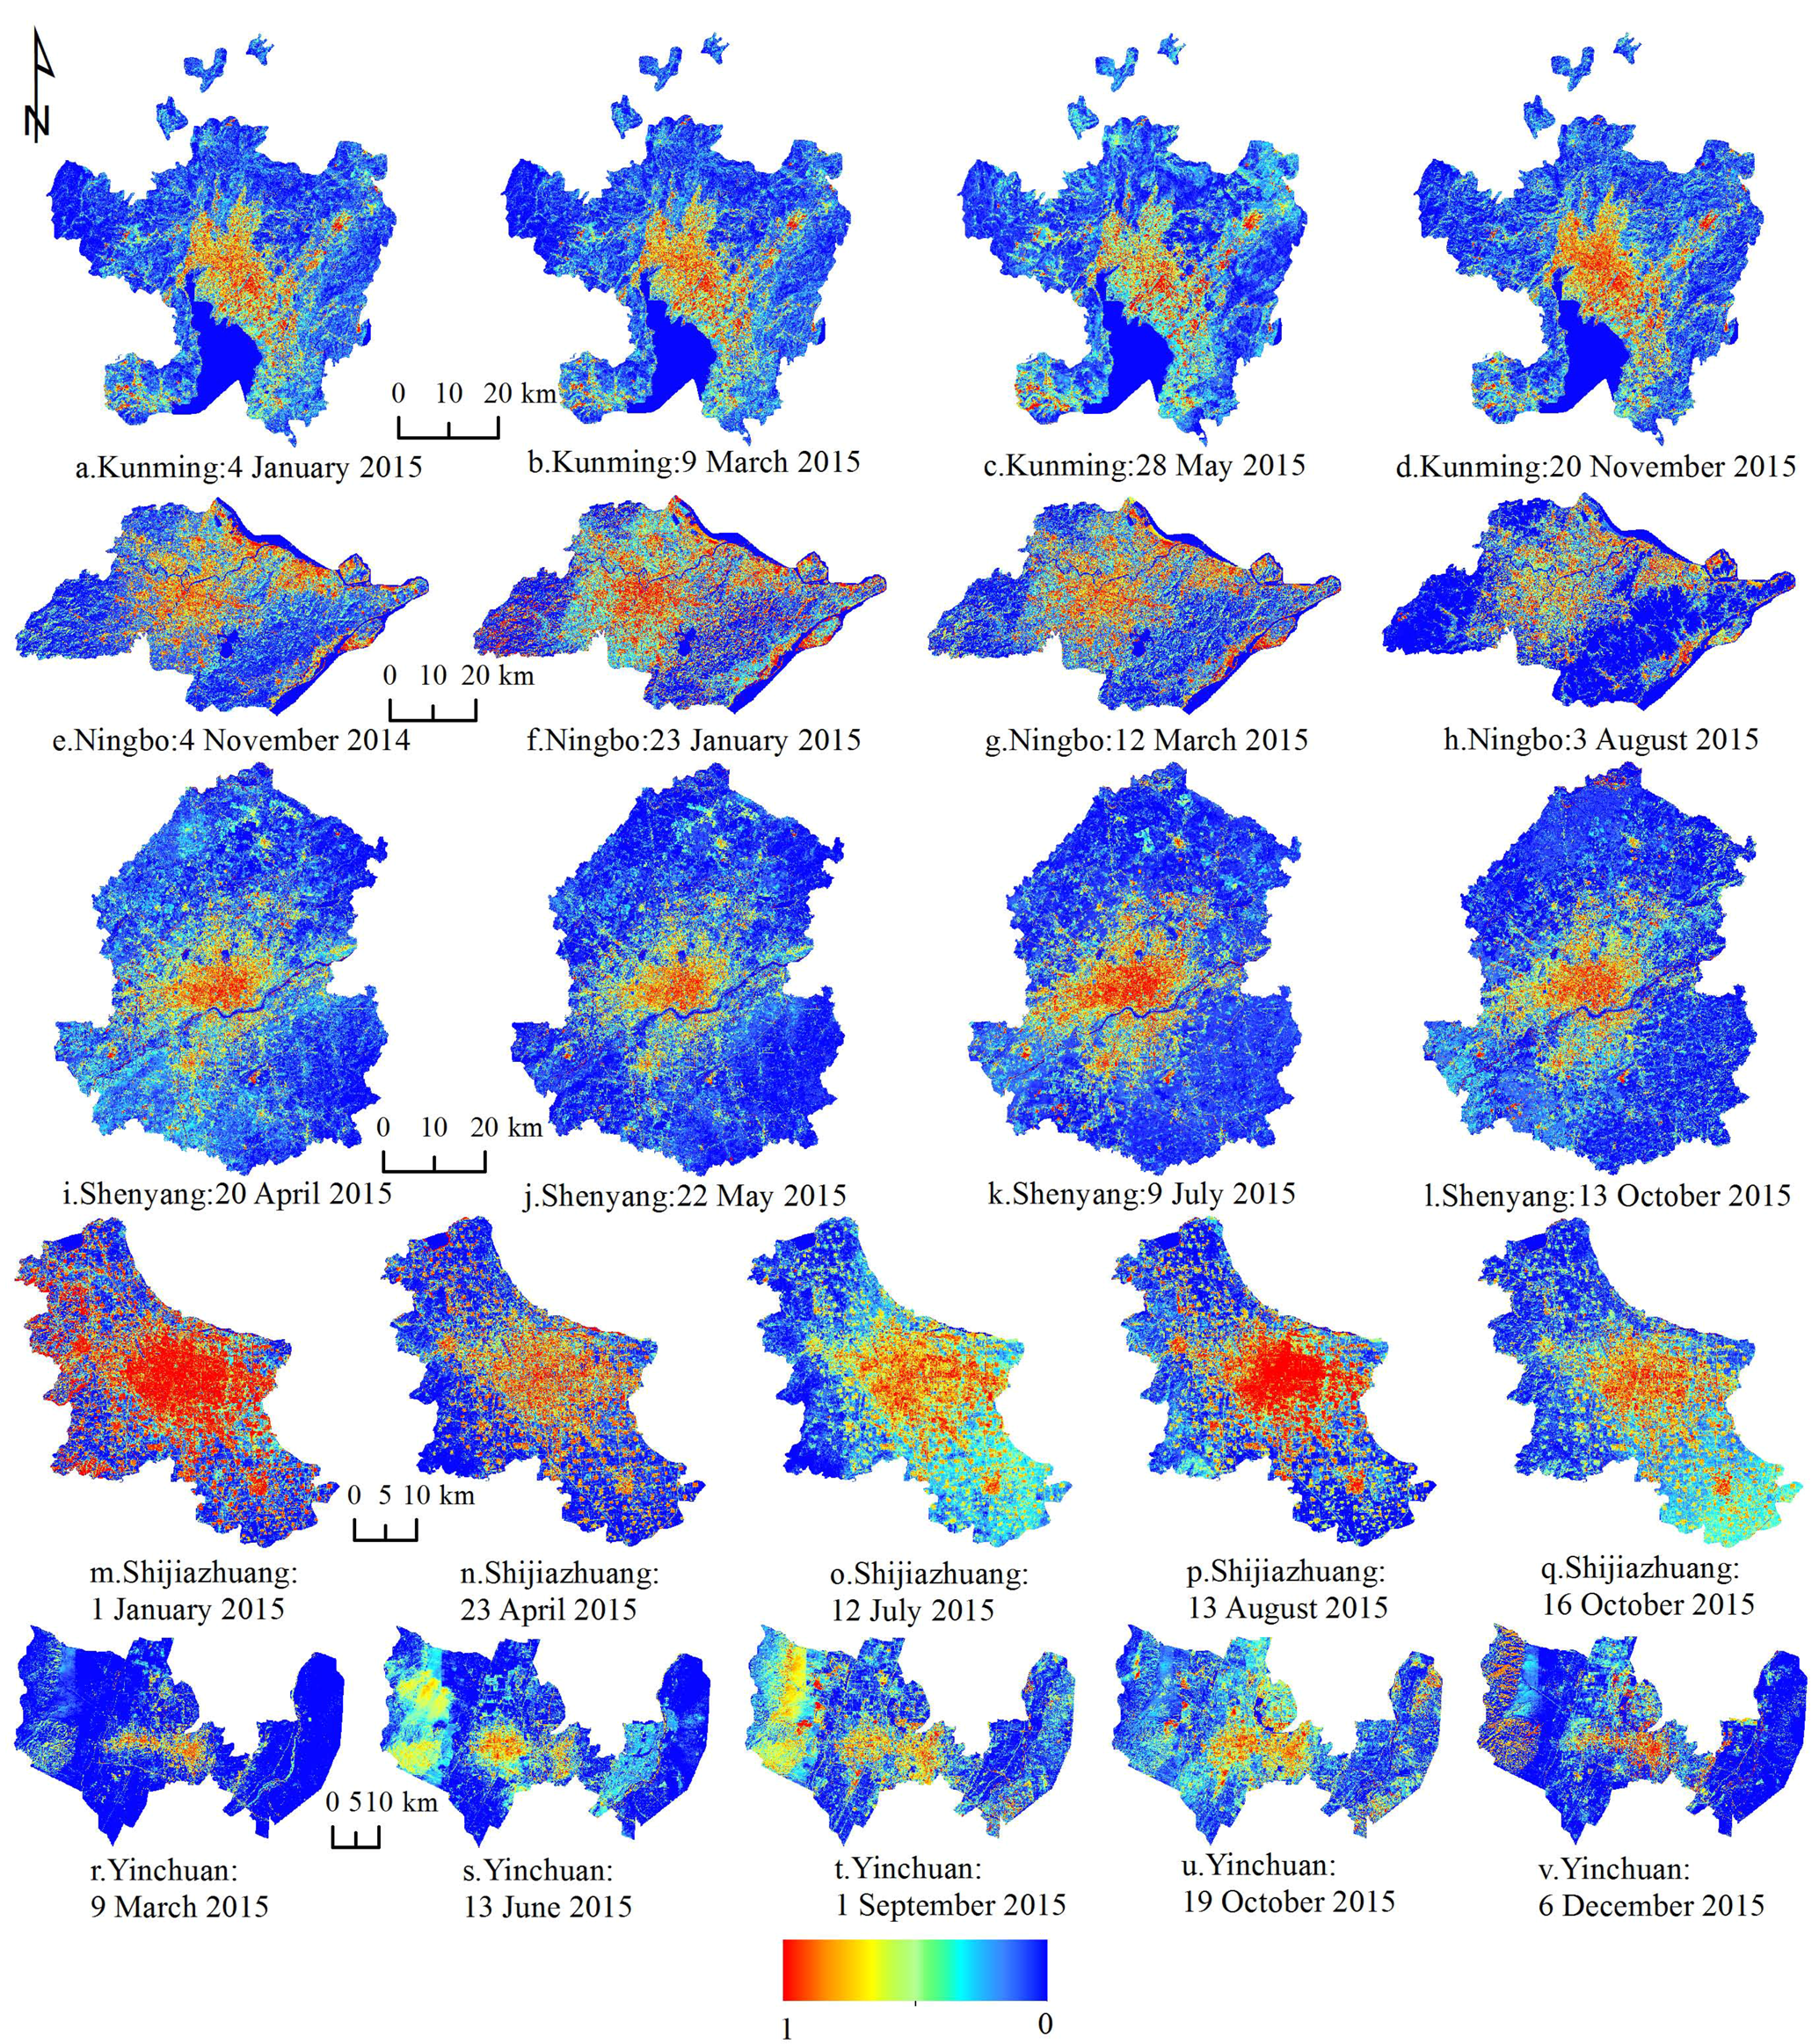
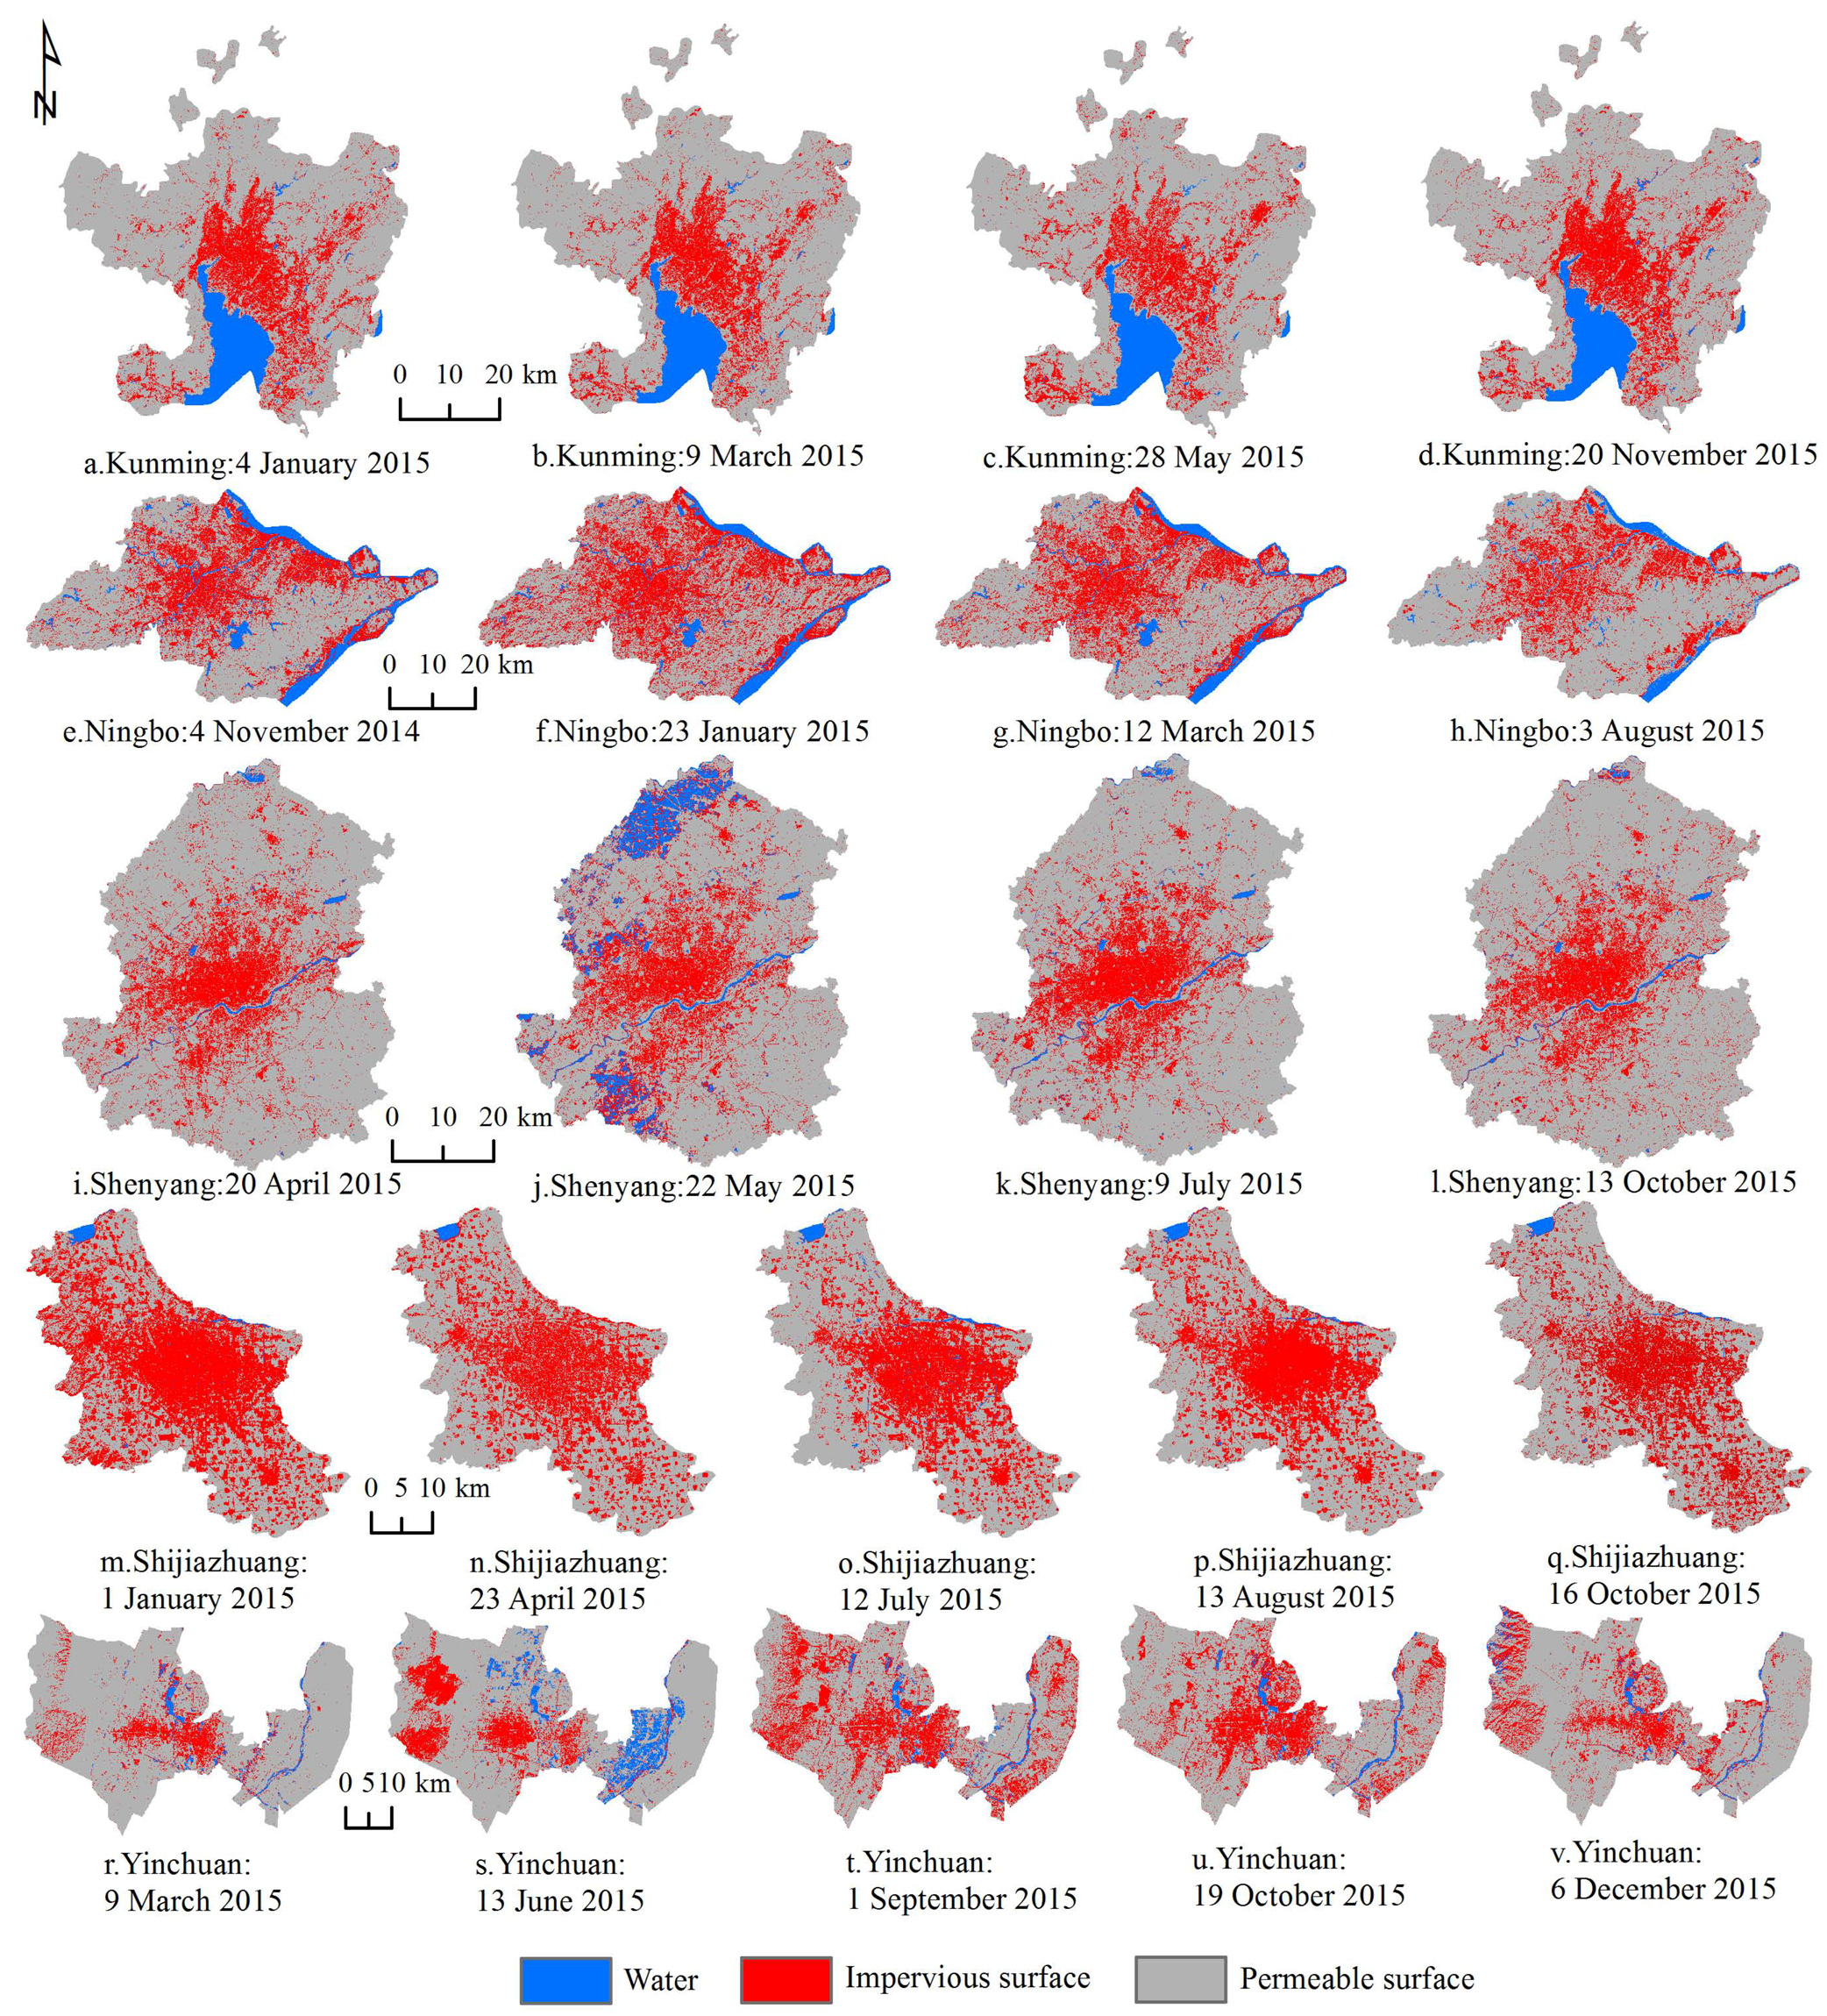
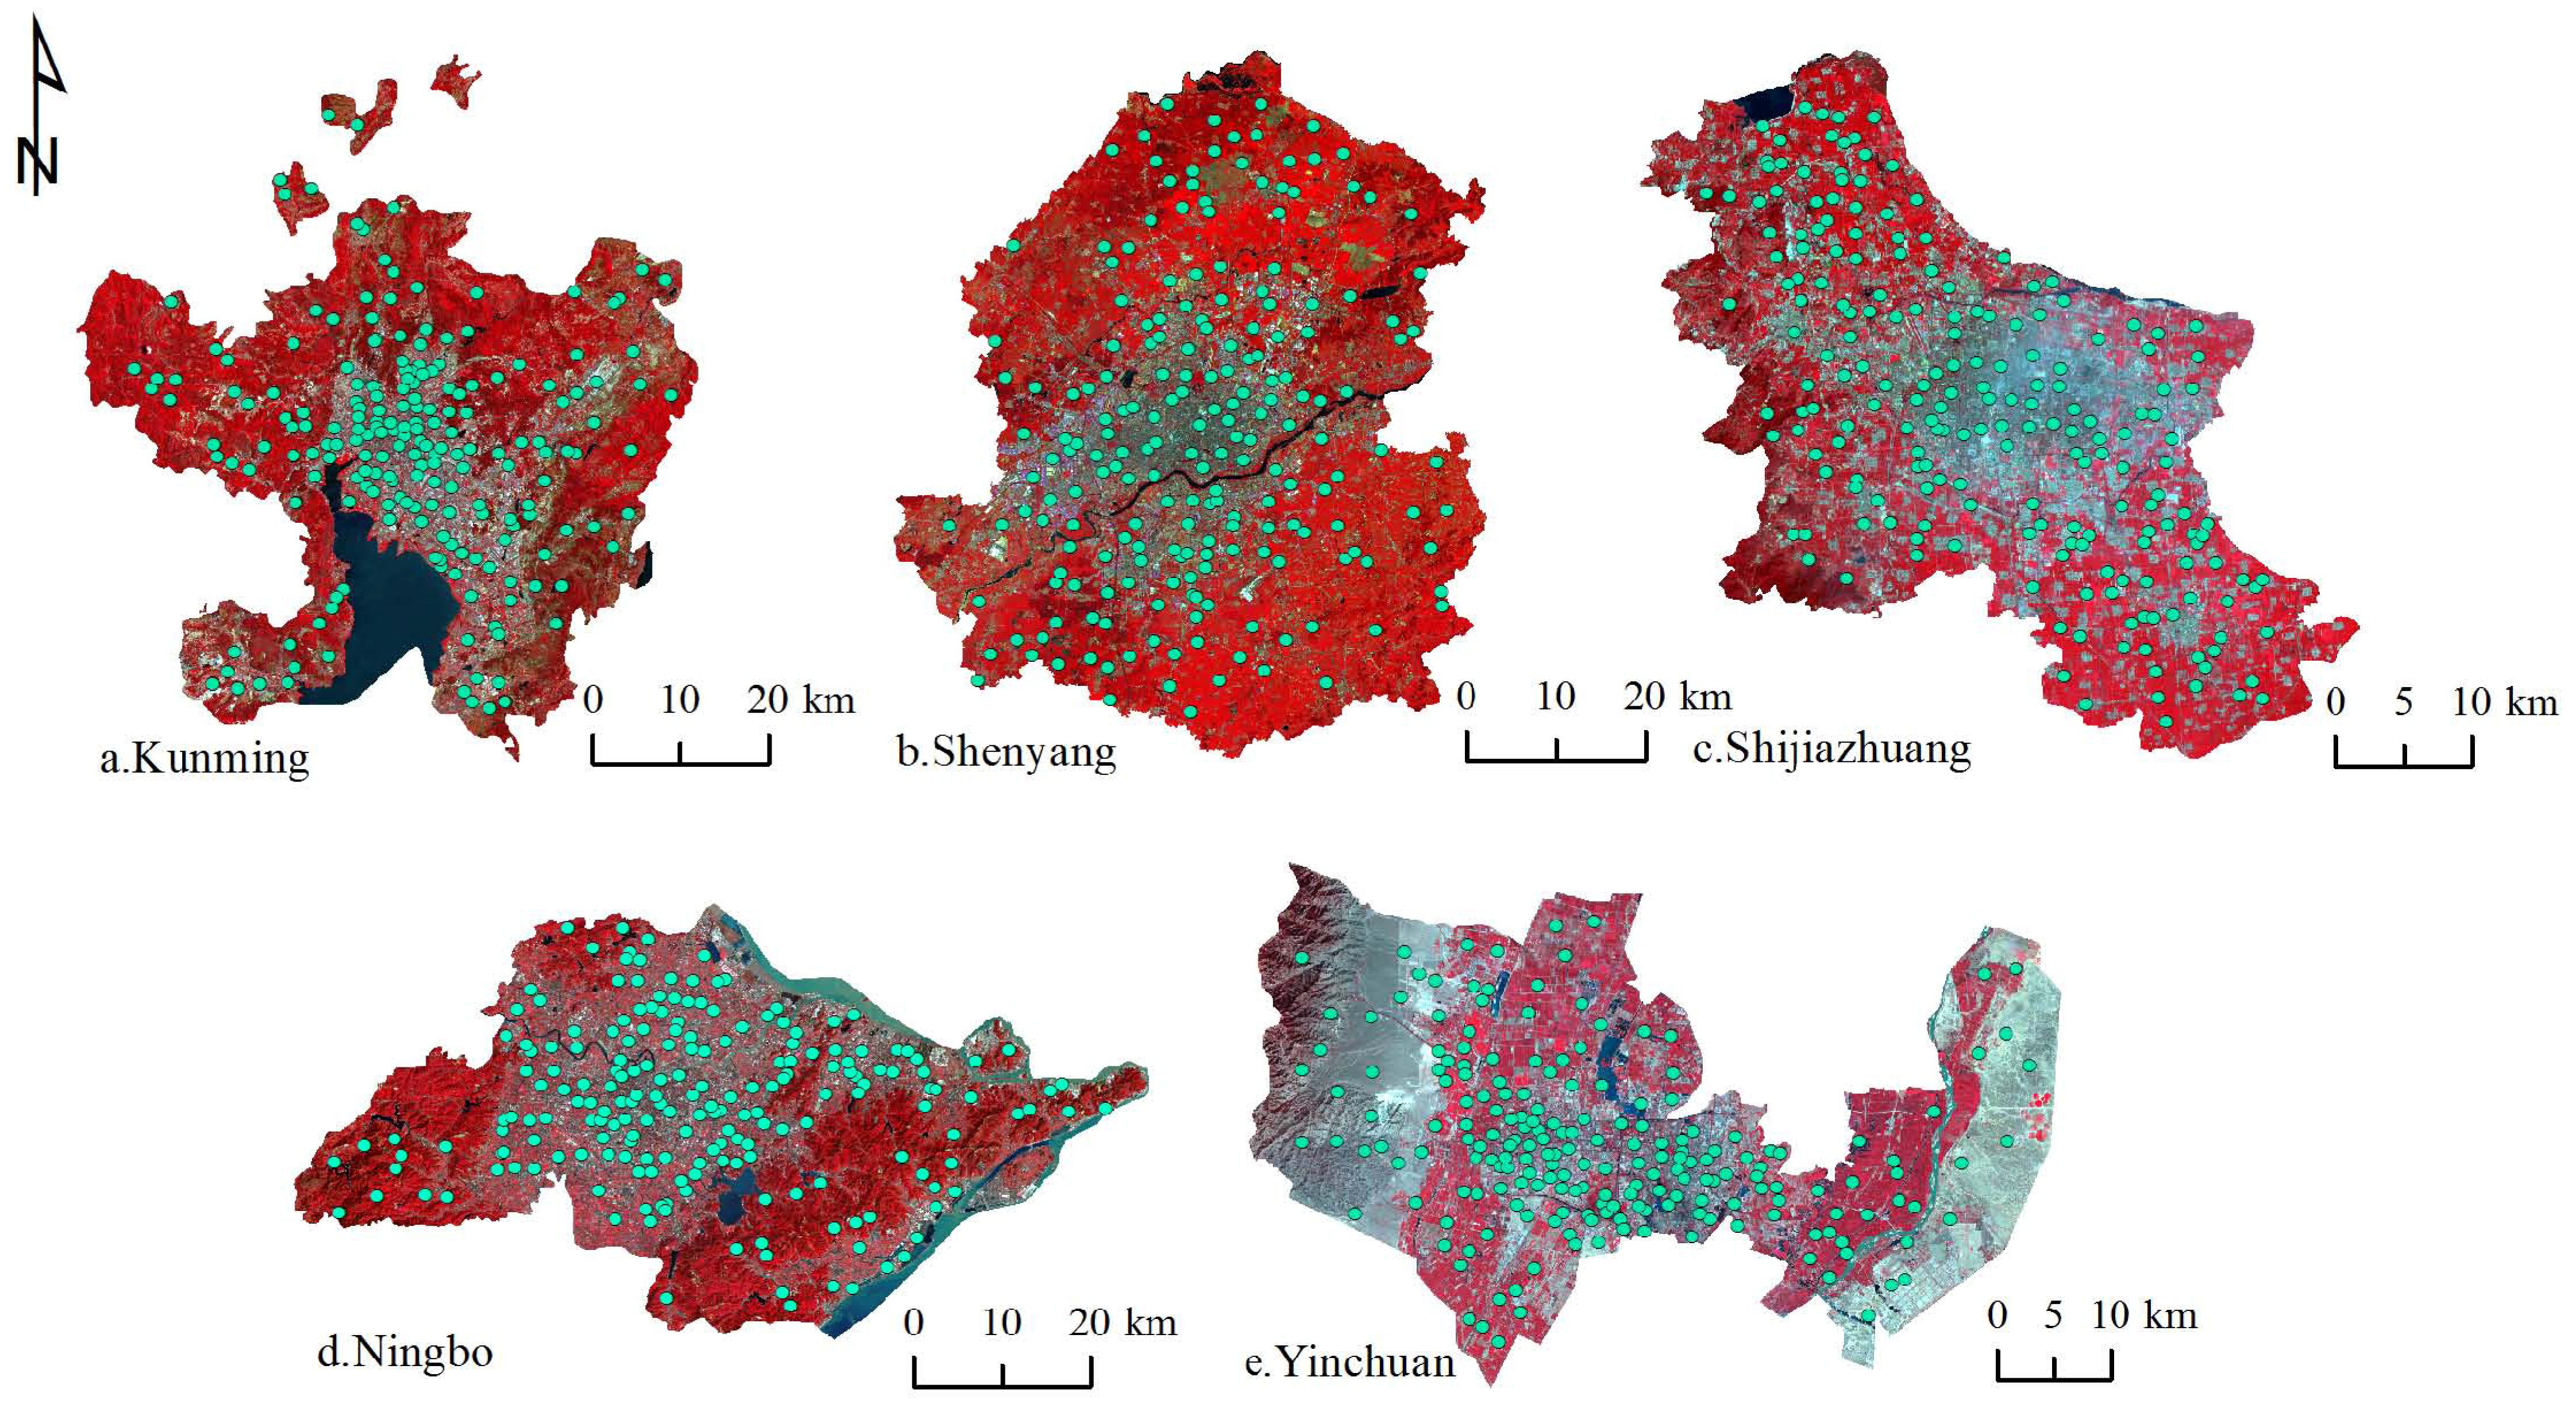
3.1. Cities and Images

The provincial capital cities of Yinchuan, Shijiazhuang, Shenyang, and Kunming, and the sub-provincial city of Ningbo were chosen to represent areas that have undergone rapid development and contain large areas of impervious cover. We did not choose to investigate the Qinghai–Tibet Plateau due to low urban development in this area. The Pearl River and Yangtze River Deltas are both located in the subtropical zone, and are characterized by a high density of river networks and urban areas. The soil type and surface complexity of the two regions are similar. Thus, the city of Ningbo could represent multiple selected factors. The main imaging factors affecting imagery-based estimations suffered in each city are shown in Table 1.
Yinchuan has a temperate continental climate with late springs, short summers, early autumns, and long winters. There are large temperature differences between day and night, and the climate is dry. The main soil types include calcareous soil, meadow soil, gray cinnamon soil from the Helan Mountains to the west main canal, and irrigation silted soil in the eastern alluvial plain.
Shijiazhuang has a temperate monsoon climate; summer and winter are long, whereas spring and autumn are short. The main soil types include mountain meadow soil, brown soil, and cinnamon soil.
Shenyang belongs to the temperate semi-humid continental climate zone and has cold winters that last nearly six months, short summers, and high precipitation. Spring and autumn are short, and temperature changes rapidly during these seasons. The main soil types are brown soil, meadow soil, and paddy soil. Snow covers the surface during winter, so we did not include winter images.
Ningbo has a subtropical monsoon climate that is mild and humid with distinct seasons. Winter and summer last up to four months, whereas spring and autumn last only about two months. The soil mainly consists of red and paddy soil.
Kunming has a subtropical plateau monsoon climate, which is mild year round. Red soil and lateritic red soil are the main soil types.
Landsat 8 OLI images from 2015 were acquired for each city. To investigate the effect of vegetation on impervious surface area estimations, images from four seasons were compared when possible. Due to cloud cover and the satellite regressive period, images could not be obtained at equal intervals; however, there were at least 30 days between images. Image acquisition times are listed in Table 1. Visible, NIR, and SWIR bands were processed with radiometric calibration [31] and Flaash (fast line-of-sight atmospheric analysis of hypercubes) atmospheric correction [32] was used to minimize atmospheric effects and retrieve estimates of surface reflectance using ENVI software v.5.1 (Exelis visual information solutions, Boulder, CO, USA). The city pixels were then clipped with vector boundaries.

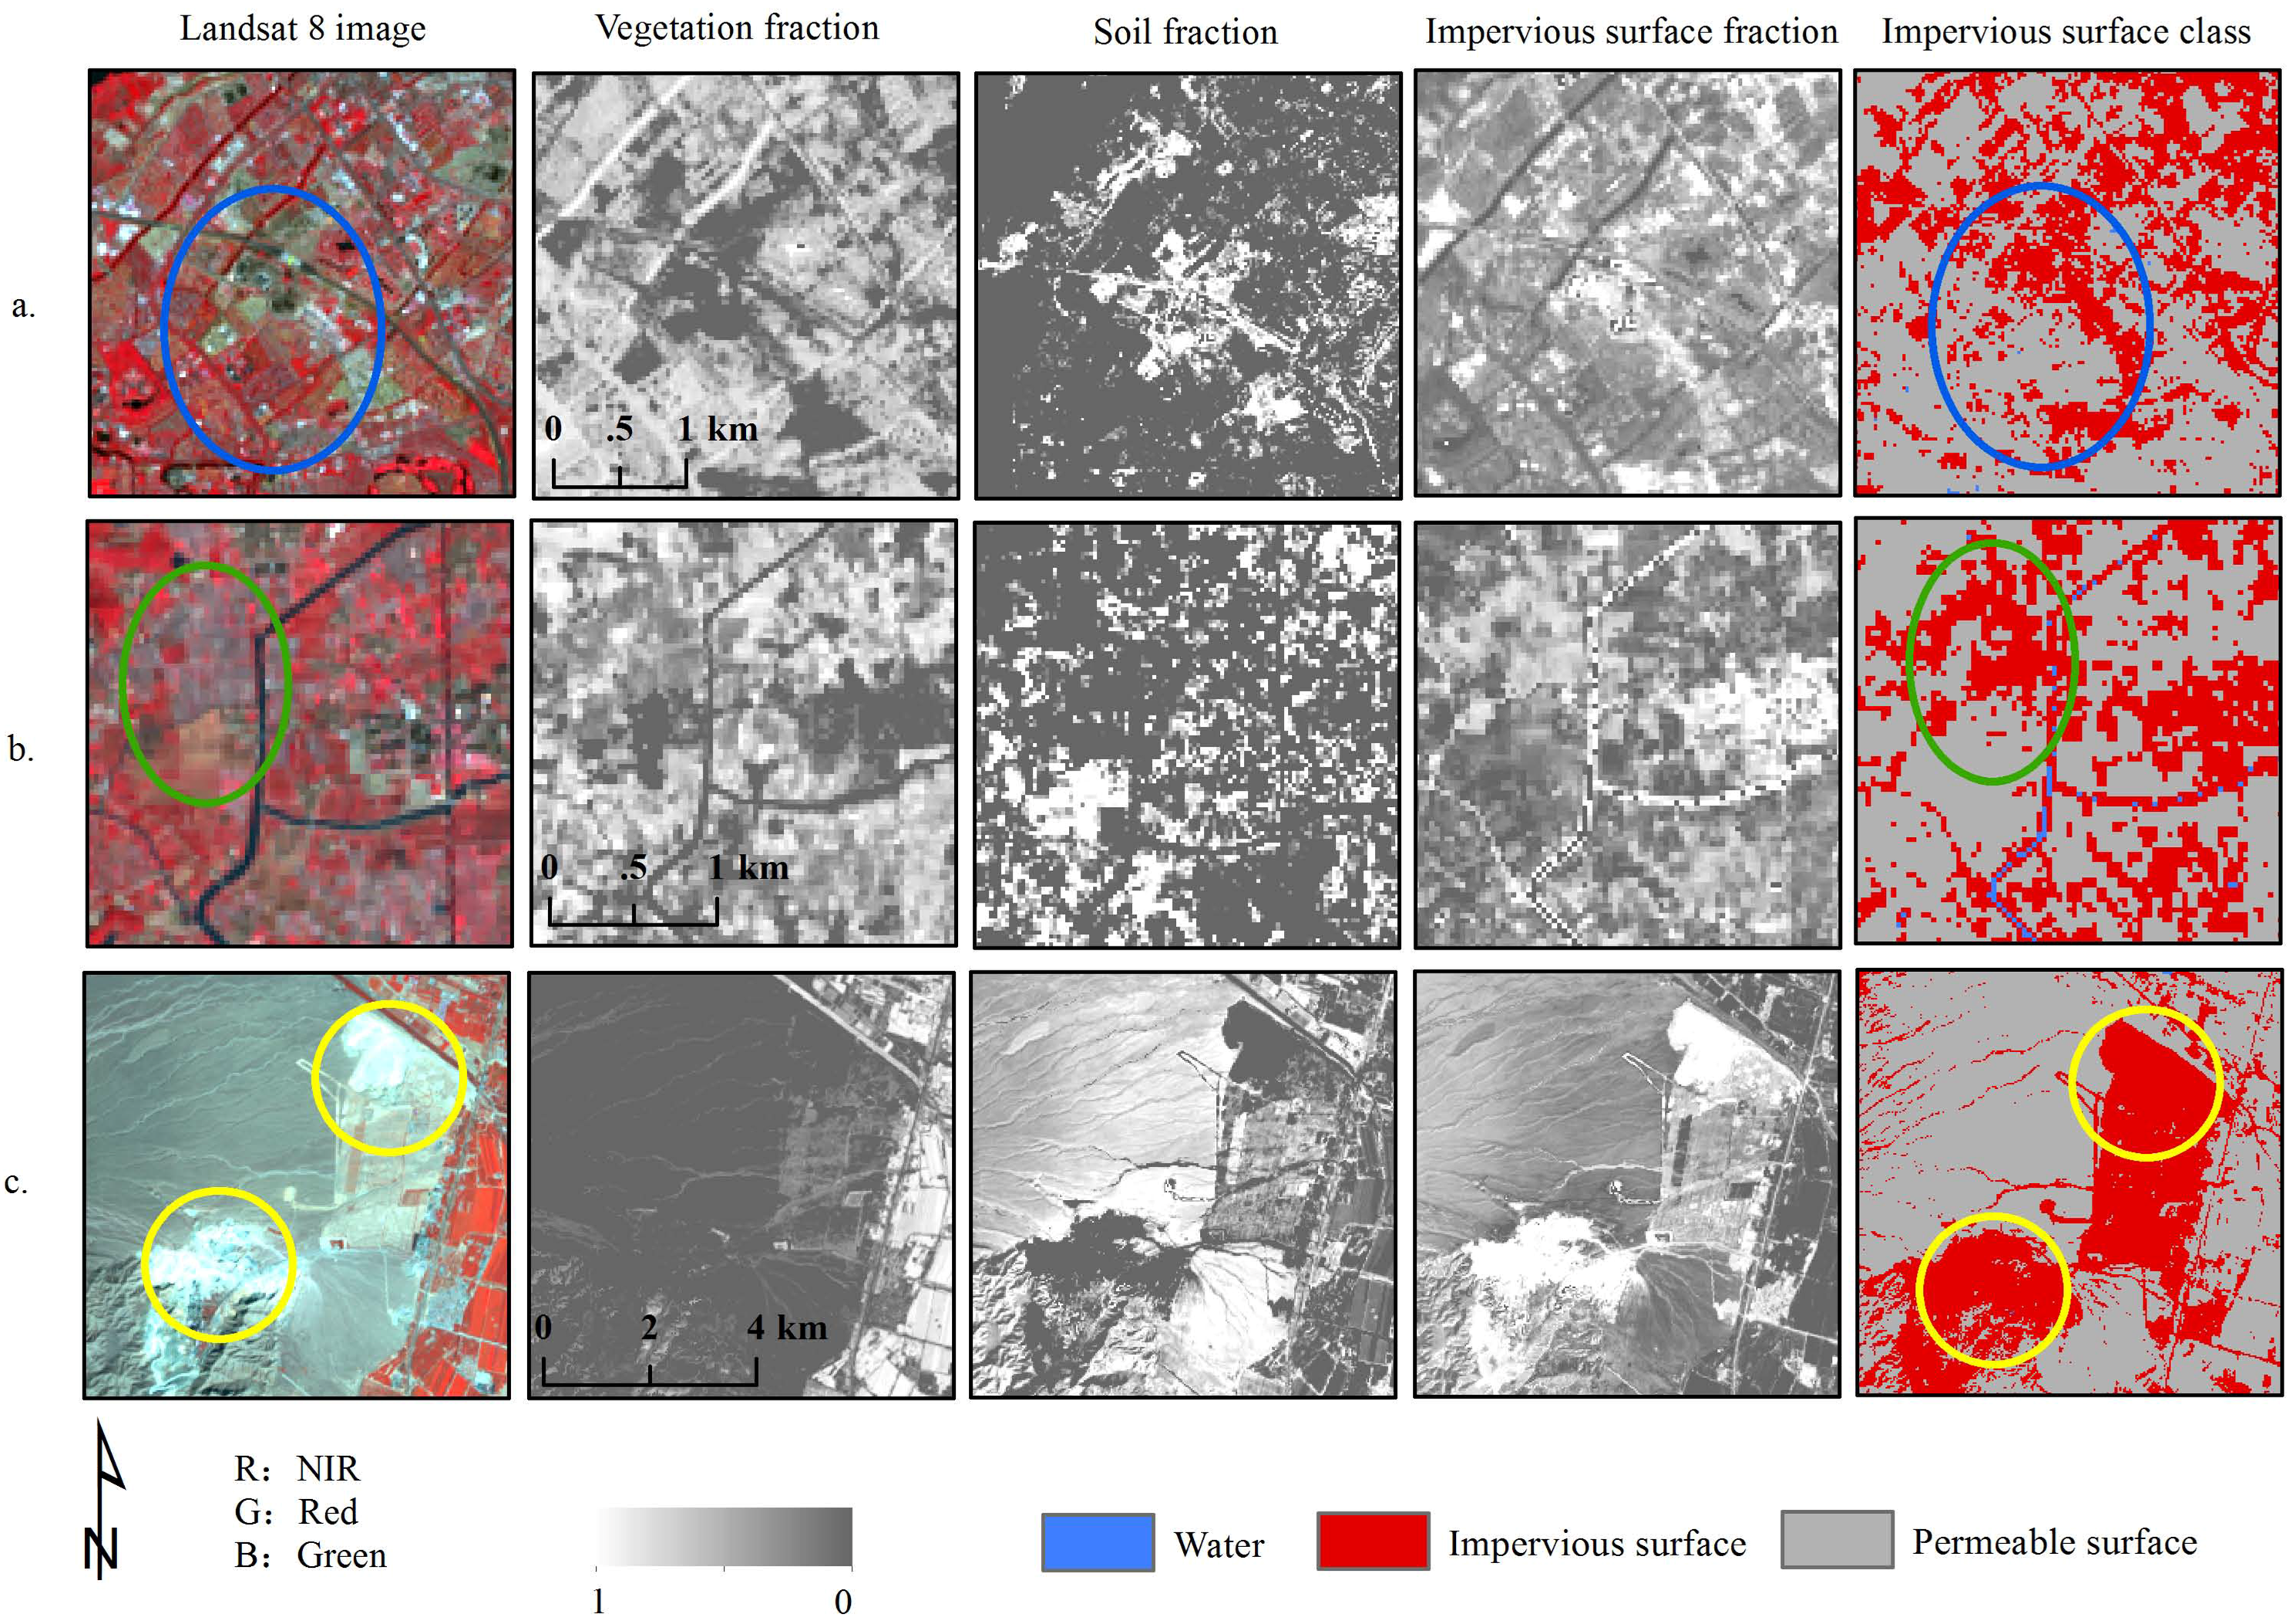
3.2. Linear Spectral Unmixing

Numerous spectral indicators have been developed for estimating impervious surface area from Landsat imagery. Traditional indices such as the normalized difference vegetation index (NDVI) and the soil-adjusted vegetation index (SAVI) have been widely employed [33,34], and indices such as the normalized difference build-up index (NDBI) [35], urban index (UI) [36], index-based built-up index (IBI) [37], biophysical composition index (BCI) [38], and normalized difference impervious surface index (NDISI) [39] have been developed more recently. Taking NDBI as an example, values greater than zero theoretically correspond to impervious surface areas, whereas values less than zero are permeable surfaces. However, complex imaging conditions often cause spectral abnormalities, so these threshold values are unreliable. In addition, for mixed pixels, a single index largely simplifies spectral information, and the accuracy of surface extractions are greatly reduced when surface features are complex.
Impervious surfaces in urban areas are mostly described by mixed pixels, as image resolution is insufficient to reflect the content of various objects within a pixel. A classification method based on sub-pixel scales can be used to describe the spectral contribution of each component in a pixel to the total value. Two methods are typically used to obtain the impervious surface area: regression modeling and spectral unmixing methods. In regression modeling, parameters of high-resolution images or ground samples are correlated with corresponding parameters (e.g., NDVI) of low-resolution images, and the resulting model is used to retrieve the impervious surface area [40,41]. Regression trees must be established to ensure the model accuracy and sample library. Linear spectral unmixing modeling is the most widely used spectral unmixing method [12,27,29]. This method determines the most effective combination of end-members within the scope of the study. In standard linear mixed pixel models, end-members are composed of vegetation, impervious surfaces, and soil [12,27,29,30]. Based on differences between spectra of impervious surfaces and surrounding features, Wu and Murray [42] defined four classic end-members: high-albedo impervious surfaces, low-albedo impervious surfaces, vegetation, and soil to estimate impervious surface area in cities. A greater number of end-members causes underestimation of the area, and fewer end-members can cause misclassification, especially if the ground is divided [43]. According to the characteristics of Landsat 8 and the selected cities, we selected high-albedo impervious surfaces, low-albedo impervious surfaces, vegetation, and soil as the four end-members for this study using a minimum noise fraction (MNF) [44] transformation and visual interpretation. The MNF transformation is helpful for end-member selections, but manual interpretation is still needed to delineate pure end-members for complex images of land surfaces. Two-dimensional scatter maps were constructed based on the first three principal components of the MNF transformation to determine the color, texture, position, and other features of pure pixels. Then, the ROI (region of interest) tool in ENVI 5.1 was used to outline the end-members using a visual interpretation method based on the features of pure pixels. Generally, vegetation end-members were selected from farmland and woodland on south-facing slopes. High-albedo impervious surface end-members included airports and industrial areas, whereas low-albedo end-members included roads, cement roofs, and open space. Soil end-members were selected from fallow farmland or permanent bare land. The ROI polygon should not be too large. There were no fewer than 100 end-member pixels per class. A fully constrained linear decomposition method was used to achieve this, in which the percentage of end-members in pixels ranged between 0 and 1, and the sum of the contribution of all land types was 1 [12]. Water bodies were relatively independent and, thus, not chosen as end-members. Removal of water bodies using the modified water body index (MNDWI) can greatly improve estimation accuracy, and values greater than 0 represent water bodies [45].

3.3. Mapping of Impervious Surface Imagery

The proportion of pixels representing impervious surfaces ranged from 0% to 100%. Song et al. [40] reported a pixel percentage of less than 20% for non-developed land, 20–49% for low-density urban land, 50–79% for medium-density urban land, and 80–100% for high-density urban land. Xiao et al. [46] reported percentages of >10% for natural surfaces, 11–40% for low-density urban land, 41–60% for medium-density urban land, and >60% for high-density construction land. Flanagan and Civco [47] used a proportion of 20% to represent roads and large impervious surface areas. However, multi-temporal images and environmental features can affect estimation accuracy and, thus, these ranges cannot be used reliably. The determination of mixed pixels must be objective. Li et al. [48] combined the unmixing method, decision tree method, and unsupervised classification method to classify mixed pixels. In this study, we classified pixels based on the dominance of three end-members (impervious surface, vegetation, and bare land). The proportion of the impervious surface fraction greater than 50% is undoubtedly an impervious surface pixel, but the decision of 33.3–50% part is crucial in the judgment of the unmixing method. In Figure 4a, the area represented by the pixel was classified as vegetation because the percentage of this land cover was greatest; likewise, in Figure 4b, the pixel area was classified as an impervious surface because the percentage of this land type was greatest. Impervious surfaces, vegetation, soil, and water bodies were classified using the decision tree with fractions and MNDWI. To focus on the hard classification of impervious surface, vegetation, and soil were considered as permeable surfaces, and the classes were recoded into three categories: permeable surfaces, impervious surfaces, and water.

3.4. Accuracy Assessment

The accuracy of impervious surface estimations was assessed using random verification. The reference sample points were manually collected from Digital Globe’s very high resolution (VHR) satellite imagery. Geolocation accuracies greater than 5.0 m for the VHR data [49] are sufficient for assessing thematic maps derived from 30-m resolution Landsat 8 imagery. First, 200 random pairs of x-y coordinates were generated in ArcGIS software v.10.2 (ESRI, Redlands, CA, USA) within the extent of each city and displayed as sample points on the thematic maps derived from the Landsat 8 images. If a point was located on a water body, it was removed and another random point was added. We repeated this procedure until there were 200 sample points and no single sample point was located on water. We then obtained category information (impervious or permeable) and coordinates for each sample point. We manually interpreted sample-point pixels of Google Earth VHR images with the majority rule at each sample point as an impervious or permeable surface. Finally, we composed a confusion matrix to assess the accuracy of impervious surface estimations, including producer’s accuracy (PA), user’s accuracy (UA), and overall accuracy (OA) [48].

4. Results

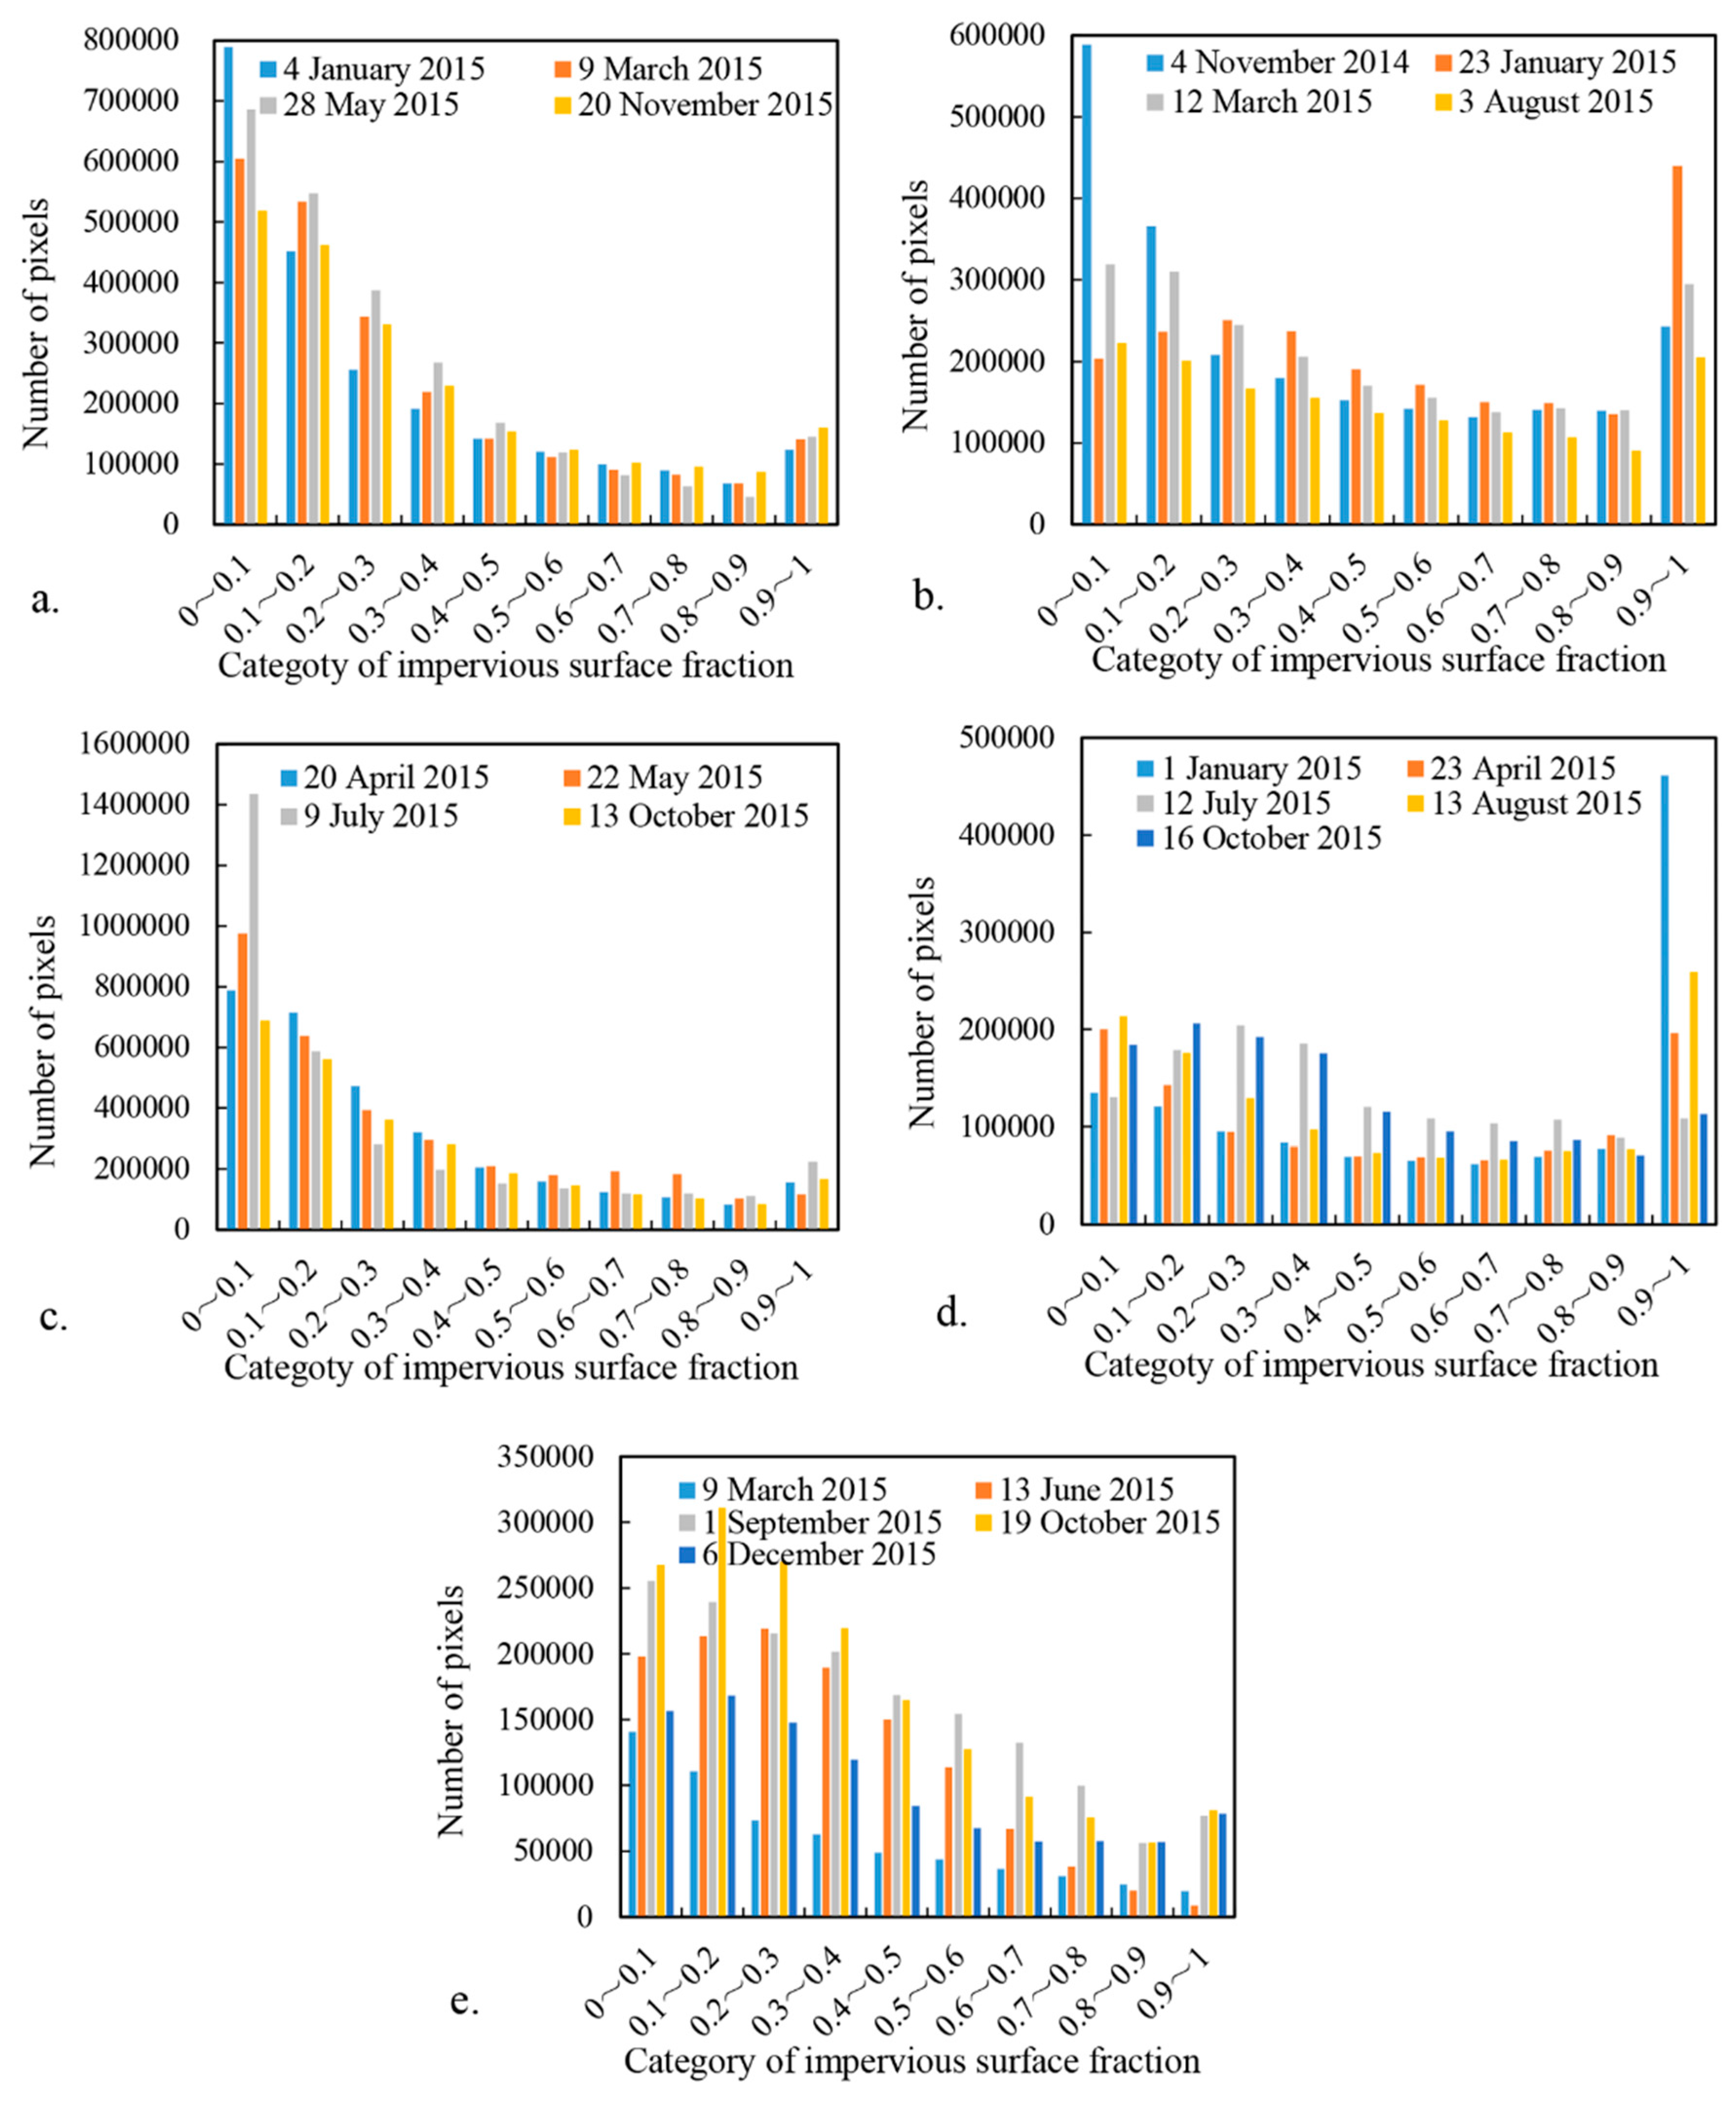
4.1. Impervious Surface Fraction

Maps of impervious surface areas in five cities are shown in Figure 5 and Figure 6. In the maps of Kunming, the majority of pixel values were below 0.4. The image taken on January 4 had more pixel values between 0 and 0.1 compared with the three other images, for which pixel distributions were similar. In the maps of Ningbo, differences were seen mostly at intervals of 0–0.1, 0.1–0.2, and 0.9–1. Seasonal variations in solar elevation and azimuth lead to changes in radiant energy in shadowed regions. The radiation was lowest on 23 January for the year. The spectral curve of shadows was similar to that of low-reflectivity impervious surfaces. Pixels with values of 0–0.1 and 0.1–0.2 were more abundant on 4 November due to mountain shadows, and there were more pixels with values of 0.9–1 on 23 January. For Shenyang City, maps for the four time intervals were similar, but there were more pixels in the range of 0–0.1 on 9 July due to vegetation. Maps of Shijiazhuang fluctuated greatly between seasons. In the image from 1 January, a large number of pixels were classified as impervious surfaces because mountain shadows were mistaken for low-albedo impervious surfaces. In the images between 12 July and 16 October, there were a greater number of pixels with values of 0.2–0.5 due to increased bare land; pixels with values ranging from 0.9 to 1 were more abundant on 1 January and 13 August. In the maps of Yinchuan, the impervious surface area was irregular. Sparsely-vegetated mountains in the northwest and bare soil were represented inconsistently. On 13 June, 1 September, and 19 October, desert and bare soil were largely represented by pixels with values below 0.7. The influence of bare soil was less evident in the 9 March and 6 December images, but the extraction of high-albedo impervious surfaces was poor.

4.2. Impervious Surface Estimation

The impervious surface area in Kunming was similar on 4 January and 9 March, the lowest on 28 May, and the highest on 20 November (Figure 7, Table 2). The coefficient of variation of impervious surface area for the four periods was 5.98%, which was the most stable value for all five cities. The greatest impervious surface area in Ningbo was found on 23 January, and the lowest on 3 August. The main reason for this difference was the influence of western mountains, and the coefficient of variation among the four points in time was 19.9%. The impervious surface area in Shenyang was the highest on 22 May and the lowest on 20 November. The coefficient of variation was 7.9%. Southern paddy fields had a large impact on the estimation accuracy. On 22 May, rice was in its early growth stages, and the spectral reflectance of soil was similar to that of low-albedo impervious surfaces, causing a large increase in estimated impervious surface area. On 9 July, rice was in the vigorous growth period, and the spectral reflectance of impervious surfaces and rice could be distinguished. On 20 November, after harvest, two types of soil with different moisture contents were exposed. The additional end-member reduced the proportion of impervious surfaces in the mixed pixel decomposition process. In Shijiazhuang, the largest impervious surface area was found on 1 January, and the smallest on 16 October. The coefficient of variation across all time points was 18.94%. Shadows of the western mountainous area greatly increased the impervious surface area on 1 January. If this image were removed, the coefficient of variation would be reduced to 3.92%. Impervious surface area in Yinchuan was the highest on 1 September, and lowest on 9 March. The coefficient of variation across all time points was 34.31%.

4.3. Accuracy of Impervious Surface Estimations

Two hundred random points from each city were used to verify the accuracy of impervious surface estimations (Figure 8, Table 3). For images of Kunming on 4 January, 9 March, and 20 November, the values of PA, UA, and OA were all above 80%. On 28 May, the values of these accuracy parameters decreased, and the overall accuracy was only 75.5%. The values of PA, UA, and OA were all above 80% for images of Ningbo on 4 November and 3 August; the lowest overall accuracy was on 23 January due to confusion between bare land and impervious surfaces. The UA of all four images of Shenyang was low, but OA was higher than 80%. The highest accuracy (87%) was found on 13 October, and the lowest (80.5%) on 22 May. The overall accuracy for images of Shijiazhuang from all five time points was above 85%. The precision for Yinchuan on 9 March, 13 June, and 6 December was low; the overall accuracy only reached 80% on 1 September and 19 October.

5. Discussion

Our analysis revealed large differences in the accuracy of impervious surface estimations among regions. Of all images, the lowest accuracy was obtained for the image of Kunming taken on 28 May due to a lot of mixed pixels with both vegetation and impervious surface characteristics (Figure 9a). Likewise, the approaching summer images of other tropical and subtropical regions were not ideal for estimations of impervious surface area. The image of Ningbo taken during winter also produced estimations with low accuracy because low solar elevation and mountains caused heavy shading that was difficult to distinguish from impervious surfaces. In addition, mixed pixels formed by small rivers and other land types led to the failure of MNDWI for water bodies. Instead, similar to low-reflectivity impervious surfaces, they caused misclassification of pixels. The number of soil end-members could be increased to eliminate the effects of two soil types (Figure 9b), but this would lead to underestimations of impervious surface areas in city centers. The summer image of Ningbo produced an estimation accuracy of 85.5%, but canopy cover was higher than that during other seasons. The Pearl River Delta region and the middle and lower reaches of the Yangtze River have similar climate, soil, and river network characteristics. For both regions, spring, summer, and autumn were the best seasons for estimating impervious surface area, whereas for Shenyang, images from all three seasons produced adequate estimations. Although the April and October images of Shenyang contained large amounts of bare land, soil could be distinguished from impervious surface areas. In winter, the image of Shijiazhuang was affected by mountain shadows, but this effect could be eliminated with auxiliary data, such as digital elevation models (DEM). Therefore, annual images of winter wheat production areas can be used to estimate impervious surface areas with reasonable accuracy. For Yinchuan, images taken from September to October produced the best estimations, though the increased impact of bare land in September reduced the accuracy somewhat (Figure 9c). Although we did not have images from July or August, the enhanced difference between impervious surfaces and vegetation is conducive to increasing the estimation accuracy for images with high vegetation biomass. In addition, vegetation canopies during summer influence the estimation accuracy of impervious surface areas in temperate regions. In tropical and subtropical regions, images taken in spring and autumn are suitable for extracting impervious surface area. Low accuracy (e.g., in the middle and lower reaches of the Yangtze River) found for winter images is in contrast to previous research [28].
The reclassification of mixed pixels increased the accuracy of impervious surface area estimations. However, end-member selection also affected the accuracy, especially for the middle and lower reaches of the Yangtze River and the Pearl River Delta. We used a linear spectral decomposition method to distinguish impervious surface areas from background features, similarities in spectral reflectance (i.e., the same objects with different spectrum or different objects with the same spectrum) reduced the accuracy of estimations from some images. In particular, in the Pearl River Delta, the middle and lower reaches of the Yangtze River, and the arid and semi-arid areas, these three sub-regions were divided in consideration of the soil factor. Soil in these areas has a higher probability of misclassification with impervious surfaces based on spectral methods, because of the spectral similarity between sandy soil and high-reflectivity impervious surfaces, and paddy soil and low-reflectivity impervious surfaces. In addition, the relationship among vegetation, soil, and impervious surfaces is dynamic and complex. During the foliage cover season, the effect of bare soil is greatly reduced [10,27]. However, the new problem is that the roads may not be classified as impervious surfaces. The degree of road loss is not only determined by the time of images but also tree species and density. In addition to spectral features, factors such as texture, shape, color, and spatial relations can cause confusion. In the future, methods for multiple features (e.g., artificial neural network analysis) should be used to eliminate interferences.
Although we identified the best seasons for estimating impervious surface area from Landsat 8 images, more effective methods should be developed to reduce the estimation error and improve remote sensing applications. Integration of multi-source data is a promising research direction. For example, land use maps and DEM can help eliminate misclassification caused by mountains and desert land, and vector data of geographic information systems (GIS) can help reduce underestimations of canopy-covered roads [29]. In addition to data products, other types of remote sensing data can be used to improve the estimation accuracy of impervious surface areas. Radar data can capture the geometric characteristics of buildings, whereas optical remote sensing imagery captures the shadows of high-rise buildings. Zhang et al. [50] showed that synthetic aperture radar (SAR) can help distinguish impervious surfaces from bare land, as well as shadowed areas and water in low-resolution images.

6. Conclusions

Landsat 8 OLI imagery can be used to distinguish among different land cover types, such as vegetation, water, impervious surfaces, and soil. China has complex and varied land surfaces, which complicate the estimation of impervious surface area. We divided China into sub-regions based on prior knowledge of ecological and geographical characteristics. Time series of Landsat 8 images were used to estimate impervious surface areas of typical cities, and estimation accuracies were compared. The main conclusions are as follows:
(1) The linear spectral unmixing method we employed was dependent on the spectral resolution of images rather than the spatial resolution. The new method proposed to classify mixed pixels based on end-member proportions allowed the separation of different land-types.
(2) To achieve the best estimation accuracy, images should be acquired in winter, early spring, and autumn for typical tropical and subtropical regions; in spring, summer and autumn for the middle and lower reaches of the Yangtze River and the Pearl River Delta; from spring to autumn for typical temperate regions; year-round for winter wheat planting areas; and in summer and early autumn for arid and semi-arid areas. This conclusion should apply to most cities, except for those with particularly unique environmental characteristics.
(3) The experiment was focused mainly on the effects of climate, soil, and biological factors, so we did not integrate more data to improve accuracy. Future studies should integrate auxiliary data and algorithms to mitigate spectral effects and obtain more accurate estimations of the spatial distribution of impervious surfaces.

Acknowledgments

This work was supported by the National Natural Science Foundation of China (41471137), the National Key Research and Development Program of China (2016YFC0502902), and the National Natural Science Foundation of China (41471366).

Author Contributions

Yuqiu Jia conceived and performed the experiments, and wrote the first draft; Lin Wang did part data processing and translation; Lina Tang revised the paper and assumed the responsibility of foundation; all authors contributed to and approved the final manuscript.

Conflicts of Interest

The authors declare no conflict of interest.

References

  1. Mallick, J.; Rahman, A.; Singh, C.K. Modeling urban heat islands in heterogeneous land surface and its correlation with impervious surface area by using night-time ASTER satellite data in highly urbanizing city, Delhi-India. Adv. Space Res. 2013, 52, 639–655. [Google Scholar] [CrossRef]
  2. Xu, H.; Lin, D.; Tang, F. The impact of impervious surface development on land surface temperature in a subtropical city: Xiamen, China. Int. J. Climatol. 2013, 33, 1873–1883. [Google Scholar] [CrossRef]
  3. Wang, W.; Yao, X.; Ji, M. Integrating seasonal optical and thermal infrared spectra to characterize urban impervious surfaces with extreme spectral complexity: A Shanghai case study. J. Appl. Remote Sens. 2016. [Google Scholar] [CrossRef]
  4. Dams, J.; Dujardin, J.; Reggers, R.; Bashir, I.; Canters, F.; Batelaan, O. Mapping impervious surface change from remote sensing for hydrological modeling. J. Hydrol. 2013, 485, 84–95. [Google Scholar] [CrossRef]
  5. Miller, J.D.; Kim, H.; Kjeldsen, T.R.; Packman, J.; Grebby, S.; Dearden, R. Assessing the impact of urbanization on storm runoff in a peri-urban catchment using historical change in impervious cover. J. Hydrol. 2014, 515, 59–70. [Google Scholar] [CrossRef] [Green Version]
  6. Van de Voorde, T.; Jacquet, W.; Canters, F. Mapping form and function in urban areas: An approach based on urban metrics and continuous impervious surface data. Landsc. Urban Plan. 2011, 102, 143–155. [Google Scholar] [CrossRef]
  7. Wang, L.; Li, C.; Ying, Q.; Cheng, X.; Wang, X.; Li, X.; Hu, L.; Liang, L.; Yu, L.; Huang, H.; et al. China’s urban expansion from 1990 to 2010 determined with satellite remote sensing. Chin. Sci. Bull. 2012, 57, 2802–2812. [Google Scholar] [CrossRef]
  8. Jat, M.K.; Garg, P.K.; Khare, D. Monitoring and modelling of urban sprawl using remote sensing and GIS techniques. Int. J. Appl. Earth Obs. Geoinf. 2008, 10, 26–43. [Google Scholar] [CrossRef]
  9. Shahtahmassebi, A.R.; Song, J.; Zheng, Q.; Blackburn, G.A.; Wang, K.; Huang, L.Y.; Pan, Y.; Moore, N.; Shahtahmassebi, G.; Sadrabadi Haghighi, R.; et al. Remote sensing of impervious surface growth: A framework for quantifying urban expansion and re-densification mechanisms. Int. J. Appl. Earth Obs. Geoinf. 2016, 46, 94–112. [Google Scholar] [CrossRef]
  10. Weng, Q. Remote sensing of impervious surfaces in the urban areas: Requirements, methods, and trends. Remote Sens. Environ. 2012, 117, 34–49. [Google Scholar] [CrossRef]
  11. Patino, J.E.; Duque, J.C. A review of regional science applications of satellite remote sensing in urban settings. Comput. Environ. Urban. Syst. 2013, 37, 1–17. [Google Scholar] [CrossRef]
  12. Deng, C.; Wu, C. A spatially adaptive spectral mixture analysis for mapping subpixel urban impervious surface distribution. Remote Sens. Environ. 2013, 133, 62–70. [Google Scholar] [CrossRef]
  13. Wu, C. Normalized spectral mixture analysis for monitoring urban composition using ETM+ imagery. Remote Sens. Environ. 2004, 93, 480–492. [Google Scholar] [CrossRef]
  14. Powell, S.; Cohen, W.; Yang, Z.; Pierce, J.; Alberti, M. Quantification of impervious surface in the Snohomish water resources inventory area of western Washington from 1972–2006. Remote Sens. Environ. 2008, 112, 1895–1908. [Google Scholar] [CrossRef]
  15. Esch, T.; Himmler, V.; Schorcht, G.; Thiel, M.; Wehrmann, T.; Bachofer, F.; Conrad, C.; Schmidt, M.; Dech, S. Large-area assessment of impervious surface based on integrated analysis of single-date Landsat-7 images and geospatial vector data. Remote Sens. Environ. 2009, 113, 1678–1690. [Google Scholar] [CrossRef]
  16. Zhou, B.; He, H.S.; Nigh, T.A.; Schulz, J.H. Mapping and analyzing change of impervious surface for two decades using multi-temporal Landsat imagery in Missouri. Int. J. Appl. Earth Obs. Geoinf. 2012, 18, 195–206. [Google Scholar] [CrossRef]
  17. Lu, D.; Moran, E.; Hetrick, S. Detection of impervious surface change with multitemporal Landsat images in an urban-rural frontier. ISPRS J. Photogram. Remote Sens. 2011, 66, 298–306. [Google Scholar] [CrossRef] [PubMed]
  18. Ke, Y.; Im, J.; Lee, J.; Gong, H.; Ryu, Y. Characteristics of Landsat 8 OLI-derived NDVI by comparison with multiple satellite sensors and in-situ observations. Remote Sens. Environ. 2015, 164, 298–313. [Google Scholar] [CrossRef]
  19. Roy, D.P.; Kovalskyy, V.; Zhang, H.K.; Vermote, E.F.; Yan, L.; Kumar, S.S.; Egorov, A. Characterization of Landsat-7 to Landsat-8 reflective wavelength and normalized difference vegetation index continuity. Remote Sens. Environ. 2016, 185, 57–70. [Google Scholar] [CrossRef]
  20. Li, P.; Jiang, L.; Feng, Z. Cross-comparison of vegetation indices derived from Landsat-7 enhanced thematic mapper plus (ETM+) and Landsat-8 operational land imager (OLI) sensors. Remote Sens. 2013, 6, 310–329. [Google Scholar] [CrossRef]
  21. Poursanidis, D.; Chrysoulakis, N.; Mitraka, Z. Landsat 8 vs. Landsat 5: A comparison based on urban and peri-urban land cover mapping. Int. J. Appl. Earth Obs. Geoinf. 2015, 35, 259–269. [Google Scholar] [CrossRef]
  22. Xu, H.; Tang, F. Analysis of new characteristics of the first Landsat 8 image and their eco-environmental significance. Acta Ecol. Sin. 2013, 33, 3249–3257. [Google Scholar]
  23. Bhatti, S.S.; Tripathi, N.K. Built-up area extraction using Landsat 8 OLI imagery. GISci. Remote Sens. 2014, 51, 445–467. [Google Scholar] [CrossRef]
  24. Li, W.; Ouyang, Z.; Zhou, W.; Chen, Q. Effects of spatial resolution of remotely sensed data on estimating urban impervious surfaces. J. Environ. Sci. 2011, 23, 1375–1383. [Google Scholar] [CrossRef]
  25. Wu, C.; Yuan, F. Seasonal sensitivity analysis of impervious surface estimation with satellite imagery. Photogramm. Eng. Remote Sens. 2007, 73, 1393–1401. [Google Scholar] [CrossRef]
  26. Weng, Q.; Hu, X.; Lu, D. Extracting impervious surfaces from medium spatial resolution multispectral and hyperspectral imagery: A comparison. Int. J. Remote Sens. 2008, 29, 3209–3232. [Google Scholar] [CrossRef]
  27. Weng, Q.; Hu, X.; Liu, H. Estimating impervious surfaces using linear spectral mixture analysis with multitemporal ASTER images. Int. J. Remote Sens. 2009, 30, 4807–4830. [Google Scholar] [CrossRef]
  28. Sung, C.Y.; Li, M.-H. Considering plant phenology for improving the accuracy of urban impervious surface mapping in a subtropical climate regions. Int. J. Remote Sens. 2012, 33, 261–275. [Google Scholar] [CrossRef]
  29. Yang, J.; Li, P. Impervious surface extraction in urban areas from high spatial resolution imagery using linear spectral unmixing. Remote Sens. Appl. 2015, 1, 61–71. [Google Scholar] [CrossRef]
  30. Ridd, M.K. Exploring a V-I-S (vegetation-impervious surface-soil) model for urban ecosystem analysis through remote sensing: Comparative anatomy for cities. Int. J. Remote Sens. 2007, 16, 2165–2185. [Google Scholar] [CrossRef]
  31. Schroeder, T.A.; Cohen, W.B.; Song, C.; Canty, M.J.; Yang, Z. Radiometric correction of multi-temporal Landsat data for characterization of early successional forest patterns in western Oregon. Remote Sens. Environ. 2006, 103, 16–26. [Google Scholar] [CrossRef]
  32. Matthew, M.W.; Adler-Golden, S.M.; Berk, A.; Richtsmeier, S.C.; Levine, R.Y.; Bernstein, L.S.; Acharya, P.K.; Anderson, G.P.; Felde, G.W.; Hoke, M.P.; et al. Status of atmospheric correction using a MODTRAN4-based algorithm. In Proceedings of the Algorithms for Multispectral, Hyperspectral, and Ultraspectral Imagery VI, Orlando, FL, USA, 24–26 April 2000; Volume 4049, pp. 199–207. [Google Scholar]
  33. Kaspersen, P.; Fensholt, R.; Drews, M. Using Landsat vegetation indices to estimate impervious surface fractions for European cities. Remote Sens. 2015, 7, 8224–8249. [Google Scholar] [CrossRef] [Green Version]
  34. Thanapura, P.; Helder, D.L.; Burckhard, S.; Warmath, E.; O’Neill, M.; Galster, D. Mapping urban land cover using QuickBird NDVI and GIS spatial modeling for runoff coefficient determination. Photogramm. Eng. Remote Sens. 2007, 73, 57–65. [Google Scholar] [CrossRef]
  35. Zha, Y.; Gao, J.; Ni, S. Use of normalized difference built-up index in automatically mapping urban areas from TM imagery. Int. J. Remote Sens. 2003, 24, 583–594. [Google Scholar] [CrossRef]
  36. Kawamura, M.; Jayamana, S.; Tsujiko, Y. Relation between social and environmental conditions in Colombo Sri Lanka and the urban index estimated by satellite remote sensing data. Int. Arch. Photogramm. Remote Sens. 1996, 31, 321–326. [Google Scholar]
  37. Xu, H.; Du, L. Fast extraction of built-up land information from remote sensing imagery. J. Geo-Inf. Sci. 2010, 12, 574–579. [Google Scholar] [CrossRef]
  38. Deng, C.; Wu, C. BCI: A biophysical composition index for remote sensing of urban environments. Remote Sens. Environ. 2012, 127, 247–259. [Google Scholar] [CrossRef]
  39. Xu, H. Analysis of impervious surface and its impact on urban heat environment using the normalized difference impervious surface index (NDISI). Photogramm. Eng. Remote Sens. 2010, 76, 557–565. [Google Scholar] [CrossRef]
  40. Sexton, J.O.; Song, X.; Huang, C.; Channan, S.; Baker, M.E.; Townshend, J.R. Urban growth of the Washington, D.C.–Baltimore, MD metropolitan region from 1984 to 2010 by annual Landsat-based estimates of impervious cover. Remote Sens. Environ. 2013, 129, 42–53. [Google Scholar] [CrossRef]
  41. Song, X.-P.; Sexton, J.O.; Huang, C.; Channan, S.; Townshend, J.R. Characterizing the magnitude, timing and duration of urban growth from time series of Landsat-based estimates of impervious cover. Remote Sens. Environ. 2016, 175, 1–13. [Google Scholar] [CrossRef]
  42. Wu, C.; Murray, A.T. Estimating impervious surface distribution by spectral mixture analysis. Remote Sens. Environ. 2003, 84, 493–505. [Google Scholar] [CrossRef]
  43. Franke, J.; Roberts, D.A.; Halligan, K.; Menz, G. Hierarchical multiple endmember spectral mixture analysis (MESMA) of hyperspectral imagery for urban environments. Remote Sens. Environ. 2009, 113, 1712–1723. [Google Scholar] [CrossRef]
  44. Green, A.A.; Berman, M.; Switzer, P.; Craig, M.D. A transformation for ordering multispectral data in terms of image quality with implications for noise removal. IEEE Trans. Geosci. Remote Sens. 1988, 26, 65–74. [Google Scholar] [CrossRef]
  45. Zhang, J.; He, C.; Zhou, Y.; Zhu, S.; Shuai, G. Prior-knowledge-based spectral mixture analysis for impervious surface mapping. Int. J. Appl. Earth Obs. Geoinf. 2014, 28, 201–210. [Google Scholar] [CrossRef]
  46. Xiao, R.; Ouyang, Z.; Cai, Y.; Li, W. Urban landscape pattern study based on sub-pixel estimation of impervious surface. Acta Ecol. Sin. 2007, 27, 3189–3197. [Google Scholar]
  47. Flanagan, M.; Civco, D.L. Subpixel impervious surface mapping. In Proceedings of the 2001 ASPRS Annual Convention, St. Louis, MO, USA, 23–27 April 2001. [Google Scholar]
  48. Li, L.; Lu, D.; Kuang, W. Examining urban impervious surface distribution and its dynamic change in Hangzhou metropolis. Remote Sens. 2016, 8, 265. [Google Scholar] [CrossRef]
  49. Aguilar, M.A.; Nemmaoui, A.; Aguilar, F.J.; Novelli, A.; García Lorca, A. Improving georeferencing accuracy of Very High Resolution satellite imagery using freely available ancillary data at global coverage. Int. J. Digital Earth. 2017, 1–15. [Google Scholar] [CrossRef]
  50. Zhang, Y.; Zhang, H.; Lin, H. Improving the impervious surface estimation with combined use of optical and SAR remote sensing images. Remote Sens. Environ. 2014, 141, 155–167. [Google Scholar] [CrossRef]
Figure 1. Spectral curves of impervious surfaces and winter wheat in Shijiazhuang from images acquired on (a) 1 January 2015 and (b) 23 April 2015. High and low albedo are the main types of impervious surfaces. Each curve was plotted using the surface reflectance means of more than 100 pixels.
Remotesensing 09 00751 g001
Figure 2. Spectral curves of impervious surfaces and desert soil in Yinchuan. The image was taken on 1 September 2015. High and low albedo are the main types of impervious surfaces. Desert soils 1 and 2 represent the two main soil types.
Remotesensing 09 00751 g002
Figure 3. Ecological regionalization of impervious surfaces for remote sensing.
Remotesensing 09 00751 g003
Figure 4. Classification of mixed pixels based on end-member contributions. The square represents a 30 m × 30 m pixel.
Remotesensing 09 00751 g004
Figure 5. Impervious surface area in five cites based on images taken during different seasons. From blue to red, the percentage of impervious surfaces gradually increase.
Remotesensing 09 00751 g005
Figure 6. Number of pixels representing impervious surfaces based on a 0.1 interval: (a) Kunming, (b) Ningbo; (c) Sheyang; (d) Shijiazhuang; and (e) Yinchuan.
Remotesensing 09 00751 g006
Figure 7. Impervious surface classification for five cities at different time points. Red indicates the impervious surface class; gray indicates permeable surfaces; and blue indicates water.
Remotesensing 09 00751 g007
Figure 8. Distribution of samples. Images are displayed in RGB color space, where R, G, and B represent NIR, red, and green, respectively.
Remotesensing 09 00751 g008
Figure 9. Examples of impervious surfaces that are misclassified. Landsat 8 images are displayed under the band combination of R = NIR, G = red, and B = green. In grayscale images, the brighter the color, the higher the percentage of the impervious surface fraction, vegetation fraction, and soil fraction. In class maps, the impervious surface class is red, the permeable class is gray, and water is blue. (a) In Kunming (28 May 2015), most of the mixed pixels (blue oval) between vegetation and impervious surface were not classified as impervious surfaces; (b) in Ningbo (23 March 2015), bare land (green oval) was misclassified; and (c) in Yinchuan (1 September 2015), bare sand soil (yellow circles) was misclassified.
Remotesensing 09 00751 g009
Table 1. Various factors and Landsat 8 OLI images of cities investigated in this study.
CityIndicated Ecological Sub-RegionsMain FactorsDate
KunmingTypical tropical and subtropical regionsVegetation canopy4 January 2015, 9 March 2015, 28 May 2015, 20 November 2015
NingboThe Pearl River Delta, the middle and lower reaches of the Yangtze RiverSoil, vegetation phenology, vegetation canopy, and water4 November 2014, 23 January 2015, 12 March 2015, 3 August 2015
ShenyangTypical temperate regionsVegetation phenology20 April 2015, 22 May 2015, 9 July 2015, 13 October 2015
ShijiazhuangThe Huang-Huai-Hai winter wheat production regionsVegetation phenology1 January 2015, 23 April 2015, 12 July 2015, 13 August 2015, 16 October 2015
YinchuanArid and semi-arid areasVegetation phenology and dry soil9 March 2015, 13 June 2015, 1 September 2015, 19 October 2015, 6 December 2015
Table 2. Number of pixels classified as impervious surfaces and the coefficient of variation across time points.
CityDate and Pixel NumberVariation Coefficient
Kunming4 January 20159 March 201528 May 201520 November 2015 5.98%
559,616552,432529,928609,758
Ningbo4 November 201423 January 201512 March 20153 August 2015 19.9%
816,0681,074,375908,824685,626
Shenyang20 April 201522 May 20159 July 201513 October 2015 7.9%
724,567845,535778,695713,090
Shijiazhuang1 January 201523 April 201512 July 201513 August 201516 October 201518.94%
768,737534,187529,869548,595499,412
Yinchuan9 March 201513 June 20151 September 201519 October 20156 December 201534.31%
227,992335,412575,642494,436361,726
Table 3. Accuracy of impervious surface estimations for each city at different time points.
CityIndexDate of Image
Kunming 4 January 20159 March 201528 May 201520 November 2015
PA (%)92.8687.878.3182.52
UA (%)81.2582.2967.7188.54
OA (%)888675.585.5
Ningbo 4 November 201423 January 201512 March 20153 August 2015
PA (%)80.9572.6578.3085.71
UA (%)90.4390.4388.382.98
OA (%)85.579.58385.5
Shenyang 20 April 201522 May 20159 July 201513 October 2015
PA (%)92.7587.6794.5995.95
UA (%)68.0968.0974.4775.53
OA (%)82.580.58687
Shijiazhuang 1 January 201523 April 201512 July 201513 August 201516 October 2015
PA (%)80.3690.789.2592.3188.76
UA (%)95.7482.9888.389.3684
OA (%)878889.591.587.5
Yinchuan 9 March 201513 June 20151 September 201519 October 20156 December 2015
PA (%)7870.977075.2764.29
UA (%)48.755087.587.545
OA (%)74738083.568
Note: PA, producer accuracy. UA, user accuracy. OA, overall accuracy.

