The n-10 Fatty Acids Family in the Lipidome of Human Prostatic Adenocarcinoma Cell Membranes and Extracellular Vesicles

 ,
,  ,
, 

Abstract
:
1. Introduction
2. Results
2.1. Fatty Acid Profiles of PC3 and LNCaP Cell Lines
2.2. Characterization, Lipid Distribution and Fatty Acid Profiles of EVs Released from PC3 and LNCaP Cells
2.3. Characterization of Fatty Acids-Related Enzyme Expressions in PC3 and LNCaP Cells
3. Discussion
4. Materials and Methods
4.1. Cell Culture
4.2. EV Isolation
4.3. Scanning Electron Microscopy
4.4. Western Blotting
4.5. Quantitative PCR
4.6. Membrane Lipid Characterization, Extraction and Fatty Acid Analysis of PC3 cells, LNCaP Cells and Their Corresponding Extracellular Vesicles.
4.7. Dimethyl disulfide (DMDS)Derivatization
4.8. Statistical Analysis
5. Conclusions
Supplementary Materials
Author Contributions
Funding
Acknowledgments
Conflicts of Interest
Abbreviations
| CHO | Cholesterol |
| DMDS | Dimethyl disulphide |
| DTT | Dithiothreitol |
| GADPH | Glyceraldehyde 3-phosphate dehydrogenase |
| ELOVL | Elongation enzyme |
| EV | Extracellular vesicle |
| FADS | Fatty acid desaturase |
| FAME | Fatty acid methyl esters |
| FBS | Fetal bovine serum |
| GC | Gas chromatography |
| HPLC | High-performance liquid chromatography |
| MUFA | Monounsaturated fatty acids |
| PBS | Phosphate buffered saline |
| PC | Phosphatidyl choline |
| PE | Phosphatidyl ethanolamine |
| PS | Phosphatidyl serine |
| PL | Phospholipid |
| PUFA | Polyunsaturated fatty acids |
| qRT-PCR | quantitative real Time polymerase chain reaction |
| SFA | Saturated fatty acids |
| SF | Sphingomyelin |
| SCD | Stearoyl CoA desaturase |
| TLC | Thin layer chromatography |
References
- Baenke, F.; Peck, B.; Meiss, H.; Schulze, A. Hooked on fat: The role of lipid synthesis in cancer metabolism and tumour development. Dis. Model. Mech. 2013, 6, 1353–1363. [Google Scholar] [CrossRef] [PubMed] [Green Version]
- Röhrig, F.; Schulze, A. The multifaceted roles of fatty acid synthesis in cancer. Nat. Rev. Cancer 2016, 16, 732–749. [Google Scholar] [CrossRef] [PubMed]
- Igal, R.A. Roles of Stearoyl Coa Desaturase-1 in the Regulation of Cancer Growth, Survival and tumorigenesis. Cancer 2011, 3, 2462–2477. [Google Scholar] [CrossRef] [Green Version]
- Kamphorst, J.J.; Cross, J.R.; Fan, J.; Methew, R.; White, E.P.; Thompson, C.B.; Rabinowitz, J.D. Hypoxic and Ras-transformed cells support growth by scavenging unsaturated fatty acids from lysophospholipids. Proc. Natl. Acad. Sci. USA 2013, 110, 8882–8887. [Google Scholar] [CrossRef] [PubMed] [Green Version]
- Peck, B.; Schug, Z.T.; Zhang, Q.; Dankworth, B.; Jones, D.T.; Smethurst, E.; Patel, R.; Mason, S.; Jiang, M.; Saunders, R.; et al. Inhibition of fatty acid desaturation is detrimental to cancer cell survival in metabolically compromised environments. Cancer Metab. 2016, 4, 6. [Google Scholar] [CrossRef] [PubMed] [Green Version]
- Mason, P.; Liang, B.; Li, L.; Fremgen, T.; Murphy, E.; Quinn, A.; Madden, S.L.; Biemann, H.P.; Wang, B.; Cohen, A.; et al. SCD1 inhibition causes cancer cell death by depleting mono-unsaturated fatty acids. PLoS ONE 2012, 7, e33823. [Google Scholar] [CrossRef] [Green Version]
- Cao, H.; Gerhold, K.; Mayers, J.R.; Wiest, M.M.; Watkins, S.M.; Hotamisligil, G.S. Identification of a lipokine, a lipid hormone linking adipose tissue to systemic metabolism. Cell 2008, 134, 933−944. [Google Scholar] [CrossRef] [Green Version]
- Koeberle, A.; Shindou, H.; Harayama, T.; Shimizu, T. Palmitoleate is a mitogen, formed upon stimulation with growth factors, and converted to palmitoleoyl phosphatidylinositol. J. Biol. Chem. 2012, 287, 27244–27254. [Google Scholar] [CrossRef] [Green Version]
- Astudillo, A.M.; Meana, C.; Guijas, C.; Pereira, L.; Lebrebro, P.; Balboa, M.A.; Balsinde, J. Occurrence and biological activity of palmitoleic isomers in phagocytic cells. J. Lipid Res. 2018, 59, 237–249. [Google Scholar] [CrossRef] [Green Version]
- Warensjo, E.; Rosell, M.; Hellenius, M.L.; Vessby, B.; De Faire, U.; Riserus, U. Associations between estimated fatty acid desaturase activities in serum lipids and adipose tissue in humans: Links to obesity and insulin resistance. Lipids Health Dis. 2009, 8, 37. [Google Scholar] [CrossRef] [Green Version]
- Lu, Y.; Vaarhorst, A.; Merry, A.H.; Dolle, M.E.; Hovenier, R.; Imholz, S.; Schouten, J.L.; Heijmans, B.T.; Müller, M.; Slagboom, P.E.; et al. Markers of endogenous desaturase activity and risk of coronary heart disease in the CAREMA cohort study. PLoS ONE 2012, 7, e41681. [Google Scholar] [CrossRef] [PubMed] [Green Version]
- Sansone, A.; Melchiorre, M.; Chatgilialoglu, C.; Ferreri, C. Hexadecenoic fatty acid isomers: A chemical biology approach for human plasma biomarker development. Chem. Res. Toxicol. 2013, 26, 1703–1709. [Google Scholar] [CrossRef]
- Sansone, A.; Tolika, E.; Louka, M.; Sunda, V.; Deplano, S.; Melchiorre, M.; Anagnostopoulos, D.; Chatgilialoglu, C.; Formisano, C.; Di Micco, R.; et al. Hexadecenoic Fatty Acid Isomers in Human Blood Lipids and Their Relevance for the Interpretation of Lipidomic Profiles. PLoS ONE 2016, 11, e0152378. [Google Scholar] [CrossRef] [PubMed] [Green Version]
- Chatgilialoglu, C.; Ferreri, C.; Melchiorre, M.; Sansone, A.; Torreggiani, A. Lipid geometrical isomerism: From chemistry to biology and diagnostics. Chem. Rev. 2014, 114, 255–284. [Google Scholar] [CrossRef] [PubMed]
- McNairn, A.J.; Doucet, Y.; Demaude, J.; Brusadelli, M.; Gordon, C.B.; Uribe Rivera, A.; Lambert, P.F.; Bouez, C.; Breton, L.; Guasch, G. TGFβ signaling regulates lipogenesis in human sebaceous glands cells. BMC Dermatol. 2013, 13, 2. [Google Scholar] [CrossRef] [PubMed] [Green Version]
- Prouty, S.M.; Pappas, A. Sapienic acid: Species-specific fatty acid metabolism of human sebaceous gland. In Lipids and Skin Health; Pappas, A., Ed.; Springer International Publisher: New York, NY, USA, 2015; pp. 139–157. [Google Scholar] [CrossRef]
- Scanferlato, R.; Bortolotti, M.; Sansone, A.; Chatgilialoglu, C.; Polito, L.; De Spirito, M.; Maulucci, G.; Bolognesi, A.; Ferreri, C. Hexadecenoic Fatty Acid Positional Isomers and De Novo PUFA Synthesis in Colon Cancer Cells. Int. J. Mol. Sci. 2019, 20, 832. [Google Scholar] [CrossRef] [Green Version]
- Vriens, K.; Christen, S.; Parik, S.; Broekaert, D.; Yoshinaga, K.; Talebi, A.; Dehairs, J.; Escalona-Noguero, C.; Schmieder, R.; Cornfield, T.; et al. Evidence for an alternative fatty acid desaturation pathway increasing cancer plasticity. Nature 2019, 566, 403–406. [Google Scholar] [CrossRef]
- Sagini, K.; Costanzi, E.; Emiliani, C.; Buratta, S.; Urbanelli, L. Extracellular Vesicles as Conveyors of Membrane-Derived Bioactive Lipids in Immune System. Int. J. Mol. Sci. 2018, 19, 1227. [Google Scholar] [CrossRef] [Green Version]
- Théry, C.; Witwer, K.W.; Aikawa, E.; Alcaraz, M.J.; Anderson, J.D.; Andriantsitohaina, R.; Antoniou, A.; Arab, T.; Archer, F.; Atkin-Smith, G.K.; et al. Minimal information for studies of extracellular vesicles 2018 (MISEV2018): A position statement of the International Society for Extracellular Vesicles and update of the MISEV2014 guidelines. J. Extracell. Vesicles 2018, 7, 1535750. [Google Scholar] [CrossRef] [Green Version]
- Sahebi, R.; Langari, H.; Fathinezhad, Z.; Bahari Sani, Z.; Avan, A.; Ghayour Mobarhan, M.; Rezayi, M. Exosomes: New insights into cancer mechanisms. J. Cell Biochem. 2020, 121, 7–16. [Google Scholar] [CrossRef]
- Llorente, A.; Skotland, T.; Sylvanne, T.; Kauhanen, D.; Rog, T.; Orlowski, A.; Vattulainen, I.; Ekroos, K.; Sandvig, K. Molecular lipidomics of exosomes released by PC-3 prostate cancer cells. Biochim. Biophys. Acta 2013, 1831, 1302–1309. [Google Scholar] [CrossRef] [PubMed]
- Brzozowski, J.S.; Helen Jankowski, H.; Bond, D.R.; McCague, S.; Munro, B.R.J.; Predebon, M.J.; Scarlett, C.J.; Skelding, K.A.; Weidenhofer, J. Lipidomic profiling of extracellular vesicles derived from prostate and prostate cancer cell lines. Lipids Health Dis. 2018, 217, 1–12. [Google Scholar] [CrossRef] [Green Version]
- Vlaeminck-Guillem, V. Extracellular vesicles in prostate cancer carcinogenesis, diagnosis, and management. Front. Oncol. 2018, 8, 222. [Google Scholar] [CrossRef] [PubMed]
- Seim, I.; Jeffery, P.L.; Thomas, P.B.; Nelson, C.C.; Chopin, L.K. Whole-Genome Sequence of the Metastatic PC3 and LNCaP Human Prostate Cancer Cell Lines. G3 Genes Genomes Genet. 2017, 7, 1731–1741. [Google Scholar] [CrossRef] [PubMed] [Green Version]
- Tai, S.; Sun, Y.; Squires, J.M.; Zhang, H.; Oh, W.K.; Liang, C.Z.; Huang, J. PC3 is a cell line characteristic of prostatic small cell carcinoma. Prostate 2011, 71, 1668–1679. [Google Scholar] [CrossRef] [PubMed] [Green Version]
- Théry, C.; Amigorena, S.; Raposo, G.; Clayton, A. Isolation and characterization of exosomes from cell culture supernatants and biological fluids. Curr. Protoc. Cell Biol. 2006. [Google Scholar] [CrossRef]
- Kowal, J.; Arras, G.; Colombo, M.; Jouve, M.; Morath, J.P.; Primdal-Bengtson, B.; Dingli, F.; Loew, D.; Tkach, M.; Théry, C. Proteomic comparison defines novel markers to characterize heterogeneous populations of extracellular vesicle subtypes. Proc. Natl. Acad. Sci. USA 2016, 113, E968–E977. [Google Scholar] [CrossRef] [Green Version]
- Buratta, S.; Urbanelli, L.; Sagini, K.; Giovagnoli, S.; Caponi, S.; Fioretto, D.; Mitro, N.; Caruso, D.; Emiliani, C. Extracellular vesicles released by fibroblasts undergoingH-Ras induced senescences how changes in lipid profile. PLoS ONE 2017, 28, e0188840. [Google Scholar] [CrossRef]
- Lydic, O.A.; Townsend, S.; Adda, C.G.; Collins, C.; Mathivanan, S.; Reid, G.E. Rapid and Comprehensive ‘Shotgun’ Lipidome Profiling of Colorectal Cancer Cell Derived Exosomes. Methods 2015, 87, 83–95. [Google Scholar] [CrossRef] [Green Version]
- Marquardt, A.; Stöhr, H.; White, K.; Weber, B.H.F. cDNA cloning, genomic structure, and chromosomal localization of three members of the human fatty acid desaturase family. Genomics 2000, 66, 176–183. [Google Scholar] [CrossRef]
- Garcia, C.; Duby, C.; Catheline, D.; Toral, P.G.; Bernard, L.; Legrand, P.; Rioux, V. Synthesis of the suspected trans-11,cis-13 conjugated linoleic acid isomer in ruminant mammary tissue by FADS3-catalyzed Δ13-desaturation of vaccenic acid. J. Dairy Sci. 2017, 100, 783–796. [Google Scholar] [CrossRef] [PubMed] [Green Version]
- Zhang, J.Y.; Qin, X.; Liang, A.; Kim, E.; Lawrence, P.; Park, W.J.; Kothapalli, K.S.D.; Brenna, J.T. Fads3 modulates docosahexaenoic acid in liver and brain. Prostaglandins Leukot. Essent. Fatty Acids 2017, 123, 25–32. [Google Scholar] [CrossRef] [PubMed]
- Karsai, G.; Lone, M.; Kutalik, Z.; Brenna, J.T.; Li, H.; Pan, D.; von Eckardstein, A.; Hornemann, T. FADS3 is a delta14Z sphingoid base desaturase that contributes to gender differences to the human plasma sphingolipidome. J. Chem. Biol. 2020, 295, 1889–1897. [Google Scholar] [CrossRef] [PubMed] [Green Version]
- Park, H.G.; Engel, M.G.; Vogt-Lowell, K.; Lawrence, P.; Kothapalli, K.S.; Brenna, J.T. The role of fatty acid desaturase (FADS) genes in oleic acid metabolism: FADS1 Δ7 desaturates 11-20:1 to 7, 11-20:2. Prostaglandins Leukot. Essent. Fatty Acids 2018, 128, 21–25. [Google Scholar] [CrossRef] [PubMed]
- Zhang, J.Y.; Kothapalli, K.S.; Brenna, J.T. Desaturase and elongase-limiting endogenous long-chain polyunsaturated fatty acid biosynthesis. Curr. Opin. Clin. Nutr. Metab. Care 2016, 19, 103–110. [Google Scholar] [CrossRef] [PubMed]
- Lattka, E.; Illig, T.; Koletzko, B.; Heinrich, J. Genetic variants of the FADS1 FADS2 gene cluster as related to essential fatty acid metabolism. Curr. Opin. Lipidol. 2010, 21, 64–69. [Google Scholar] [CrossRef]
- Guillou, H.; Zadravec, D.; Martin, P.G.; Jacobsson, A. The key roles of elongases and desaturases in mammalian fatty acid metabolism: Insights from transgenic mice. Prog. Lipid Res. 2010, 49, 186–199. [Google Scholar] [CrossRef]
- Yamashita, A.; Hayashi, Y.; Nemoto-Sasaki, Y.; Ito, M.; Oka, S.; Tanikawa, T.; Waku, K.; Sugiura, T. Acyltransferases and transacylases that determine the fatty acid composition of glycerolipids and the metabolism of bioactive lipid mediators in mammalian cells and model organisms. Prog. Lipid Res. 2014, 53, 18–81. [Google Scholar] [CrossRef]
- Park, H.G.; Kothapalli, K.S.D.; Park, W.J.; DeAllie, C.; Liu, L.; Liang, A.; Lawrence, P.; Brenna, J.T. Palmitic acid (16:0) competes with omega-6 linoleic and omega-3 α-linolenic acids for FADS2 mediated Δ6-desaturation. Biochim. Biophys. Acta 2016, 1861, 91–97. [Google Scholar] [CrossRef] [Green Version]
- Byberg, L.; Kilander, L.; Warensjö Lemming, E.; Michaëlsson, K.; Vessby, B. Cancer death is related to high palmitoleic acid in serum and to polymorphisms in the SCD-1 gene in healthy Swedish men. Am. J. Clin. Nutr. 2014, 99, 551–558. [Google Scholar] [CrossRef] [Green Version]
- Rysman, E.; Brusselmans, K.; Scheys, K.; Timmermans, L.; Derua, R.; Munck, S.; Van Veldhoven, P.P.; Waltregny, D.; Daniëls, V.W.; Machiels, J.; et al. De novo lipogenesis protects cancer cells from free radicals and chemotherapeutics by promoting membrane lipid saturation. Cancer Res. 2010, 70, 8117–8126. [Google Scholar] [CrossRef] [PubMed] [Green Version]
- Fabian, C.J.; Kimler, B.F.; Hursting, S.D. Omega-3 fatty acids for breast cancer prevention and survirorship. Breast Cancer Res. 2015, 17, 62. [Google Scholar] [CrossRef] [PubMed] [Green Version]
- Friedrichs, W.; Ruparel, S.B.; Marciniak, R.A.; deGraffenried, L. Omega-3 fatty acid inhibition of prostate cancer progression to hormone independence is associated with suppression of mTOR signaling and androgen receptor expression. Nutr. Cancer 2011, 63, 771–777. [Google Scholar] [CrossRef] [PubMed]
- Berquin, I.M.; Edwards, I.J.; Kridel, S.J. Chen, Y.Q. Polyunsaturated fatty acid metabolism in prostate cancer. Cancer Metast. Rev. 2011, 30, 295–309. [Google Scholar] [CrossRef] [PubMed] [Green Version]
- Lazar, I.; Clement, E.; Attane, C.; Muller, C.; Nieto, L. A new role for extracellular vesicles: How small vesicles can feed tumors’ big appetite. J. Lipid Res. 2018, 59, 1793–1804. [Google Scholar] [CrossRef] [Green Version]
- Bernardes, N.; Fialho, A.M. Perturbing the dynamics and or ganization of cell membrane components: A new paradigm for cancer-targeted therapies. Int. J. Mol. Sci. 2018, 19, 3871. [Google Scholar] [CrossRef] [Green Version]
- Cohen, G.; Riahi, Y.; Shamni, O.; Guichardant, M.; Chatgilialoglu, C.; Ferreri, C.; Kaiser, N.; Sasson, S. The role of lipid peroxidation and PPARδ in amplifying glucose-stimulated insulin secretion. Diabetes 2011, 60, 2830–2842. [Google Scholar] [CrossRef] [Green Version]
- Sagini, K.; Urbanelli, L.; Costanzi, E.; Mitro, N.; Caruso, D.; Emiliani, C.; Buratta, S. Ocongenic H-Ras expression indices fatty acid profile changes in human fibroblasts and extracellular vesicles. Int. J. Mol. Sci. 2018, 19, 3515. [Google Scholar] [CrossRef] [Green Version]
- Folch, J.; Less, M.; Sloane Stanley, G.H. A simple method for the isolation and purification of total lipids from animal tissues. J. Biol. Chem. 1957, 226, 497–509. [Google Scholar]
- Liang, P.; Henning, S.M.; Guan, J.; Grogan, T.; Elashoff, D.; Cohen, P.; Aronson, W.J. Effect of dietary omega-3 fatty acids on castrate-resistant prostate cancer and tumor-associated macrophages. Prostate Cancer Prostatic Dis. 2019. [Google Scholar] [CrossRef]
- Chajès, V.; Bougnoux, P. Omega-6/omega-3 polyunsaturated fatty acid ratio and cancer. In Omega-6/Omega-3 Essential Fatty Acid Ratio: The Scientific Evidence; Simoupoulos, A.P., Cleland, L.G., Eds.; Karger: Basel, Switzerland, 2003; Volume 92, pp. 133–215. [Google Scholar]
- Ferreri, C.; Chatgilialoglu, C. Membrane Lipidomics for Personalized Health; John Wiley & Sons: New York, NY, USA, 2015. [Google Scholar]
- Freitas, R.; Campos, M.M. Protective Effects of Omega-3 Fatty Acids in Cancer-Related Complications. Nutrients 2019, 11, 945. [Google Scholar] [CrossRef] [PubMed] [Green Version]


| FAME 1 | PC3 (n = 8) 2 | LNCaP (n = 8) 2 |
|---|---|---|
| C14:0 | 3.26 ± 0.32 | 3.44 ± 0.17 |
| C16:0 | 33.20 ± 1.33 | 33.60 ± 0.49 |
| 6trans-C16:1 | 0.36 ± 0.04 | 0.56 ± 0.03 ** |
| 6cis-C16:1 n-10 | 7.41 ± 0.35 | 7.81 ± 0.33 |
| 9 cis-C16:1 n-7 | 2.36 ± 0.17 | 1.96 ± 0.05 * |
| C18:0 | 10.92 ± 0.54 | 11.48 ± 0.25 |
| 9trans-C18:1 | 0.09 ± 0.01 | 0.11 ± 0.02 |
| 8cis-C18:1 n-10 | 5.98 ± 0.75 | 4.55 ± 0.12 |
| 9cis-C18:1 n-9 | 19.47 ± 0.72 | 18.62 ± 0.24 |
| 11cis-C18:1 n-7 | 3.92 ± 0.30 | 3.90 ± 0.08 |
| 5cis,8cis-C18:2 n-10 | 0.47 ± 0.03 | 0.52 ± 0.04 |
| mono-trans C18:2 n-6 | 0.27 ± 0.05 | 0.24 ± 0.02 |
| C18:2 n-6 | 2.48 ± 0.19 | 1.97 ± 0.08 * |
| C20:3 n-6 | 1.62 ± 0.16 | 1.73 ± 0.18 |
| C20:4 n-6 | 2.86 ± 0.23 | 4.01 ± 0.14 *** |
| mono-trans C20:4 | 0.10 ± 0.01 | 0.11 ± 0.05 |
| C20:5 n-3 | 0.47 ± 0.06 | 0.37 ± 0.07 |
| C22:5 n-3 | 1.77 ± 0.19 | 1.53 ± 0.14 |
| C22:6 n-3 | 2.98 ± 0.18 | 3.49 ± 0.20 |
| SFA | 47.38 ± 1.39 | 48.52 ± 0.46 |
| MUFA | 39.14 ± 1.13 | 36.84 ± 0.59 |
| PUFA | 12.65 ± 0.37 | 13.62 ± 0.42 |
| n-6 | 6.96 ± 0.34 | 7.70 ± 0.31 |
| n-3 | 5.22 ± 0.15 | 5.40 ± 0.38 |
| n-6/n-3 | 1.34 ± 0.07 | 1.52 ± 0.19 |
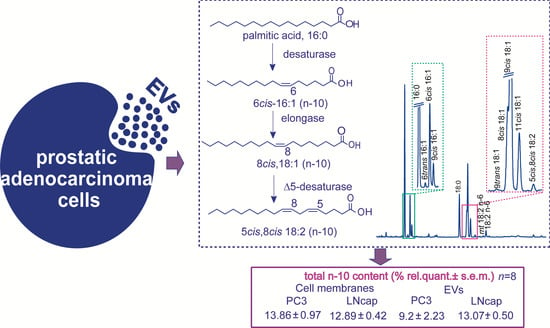
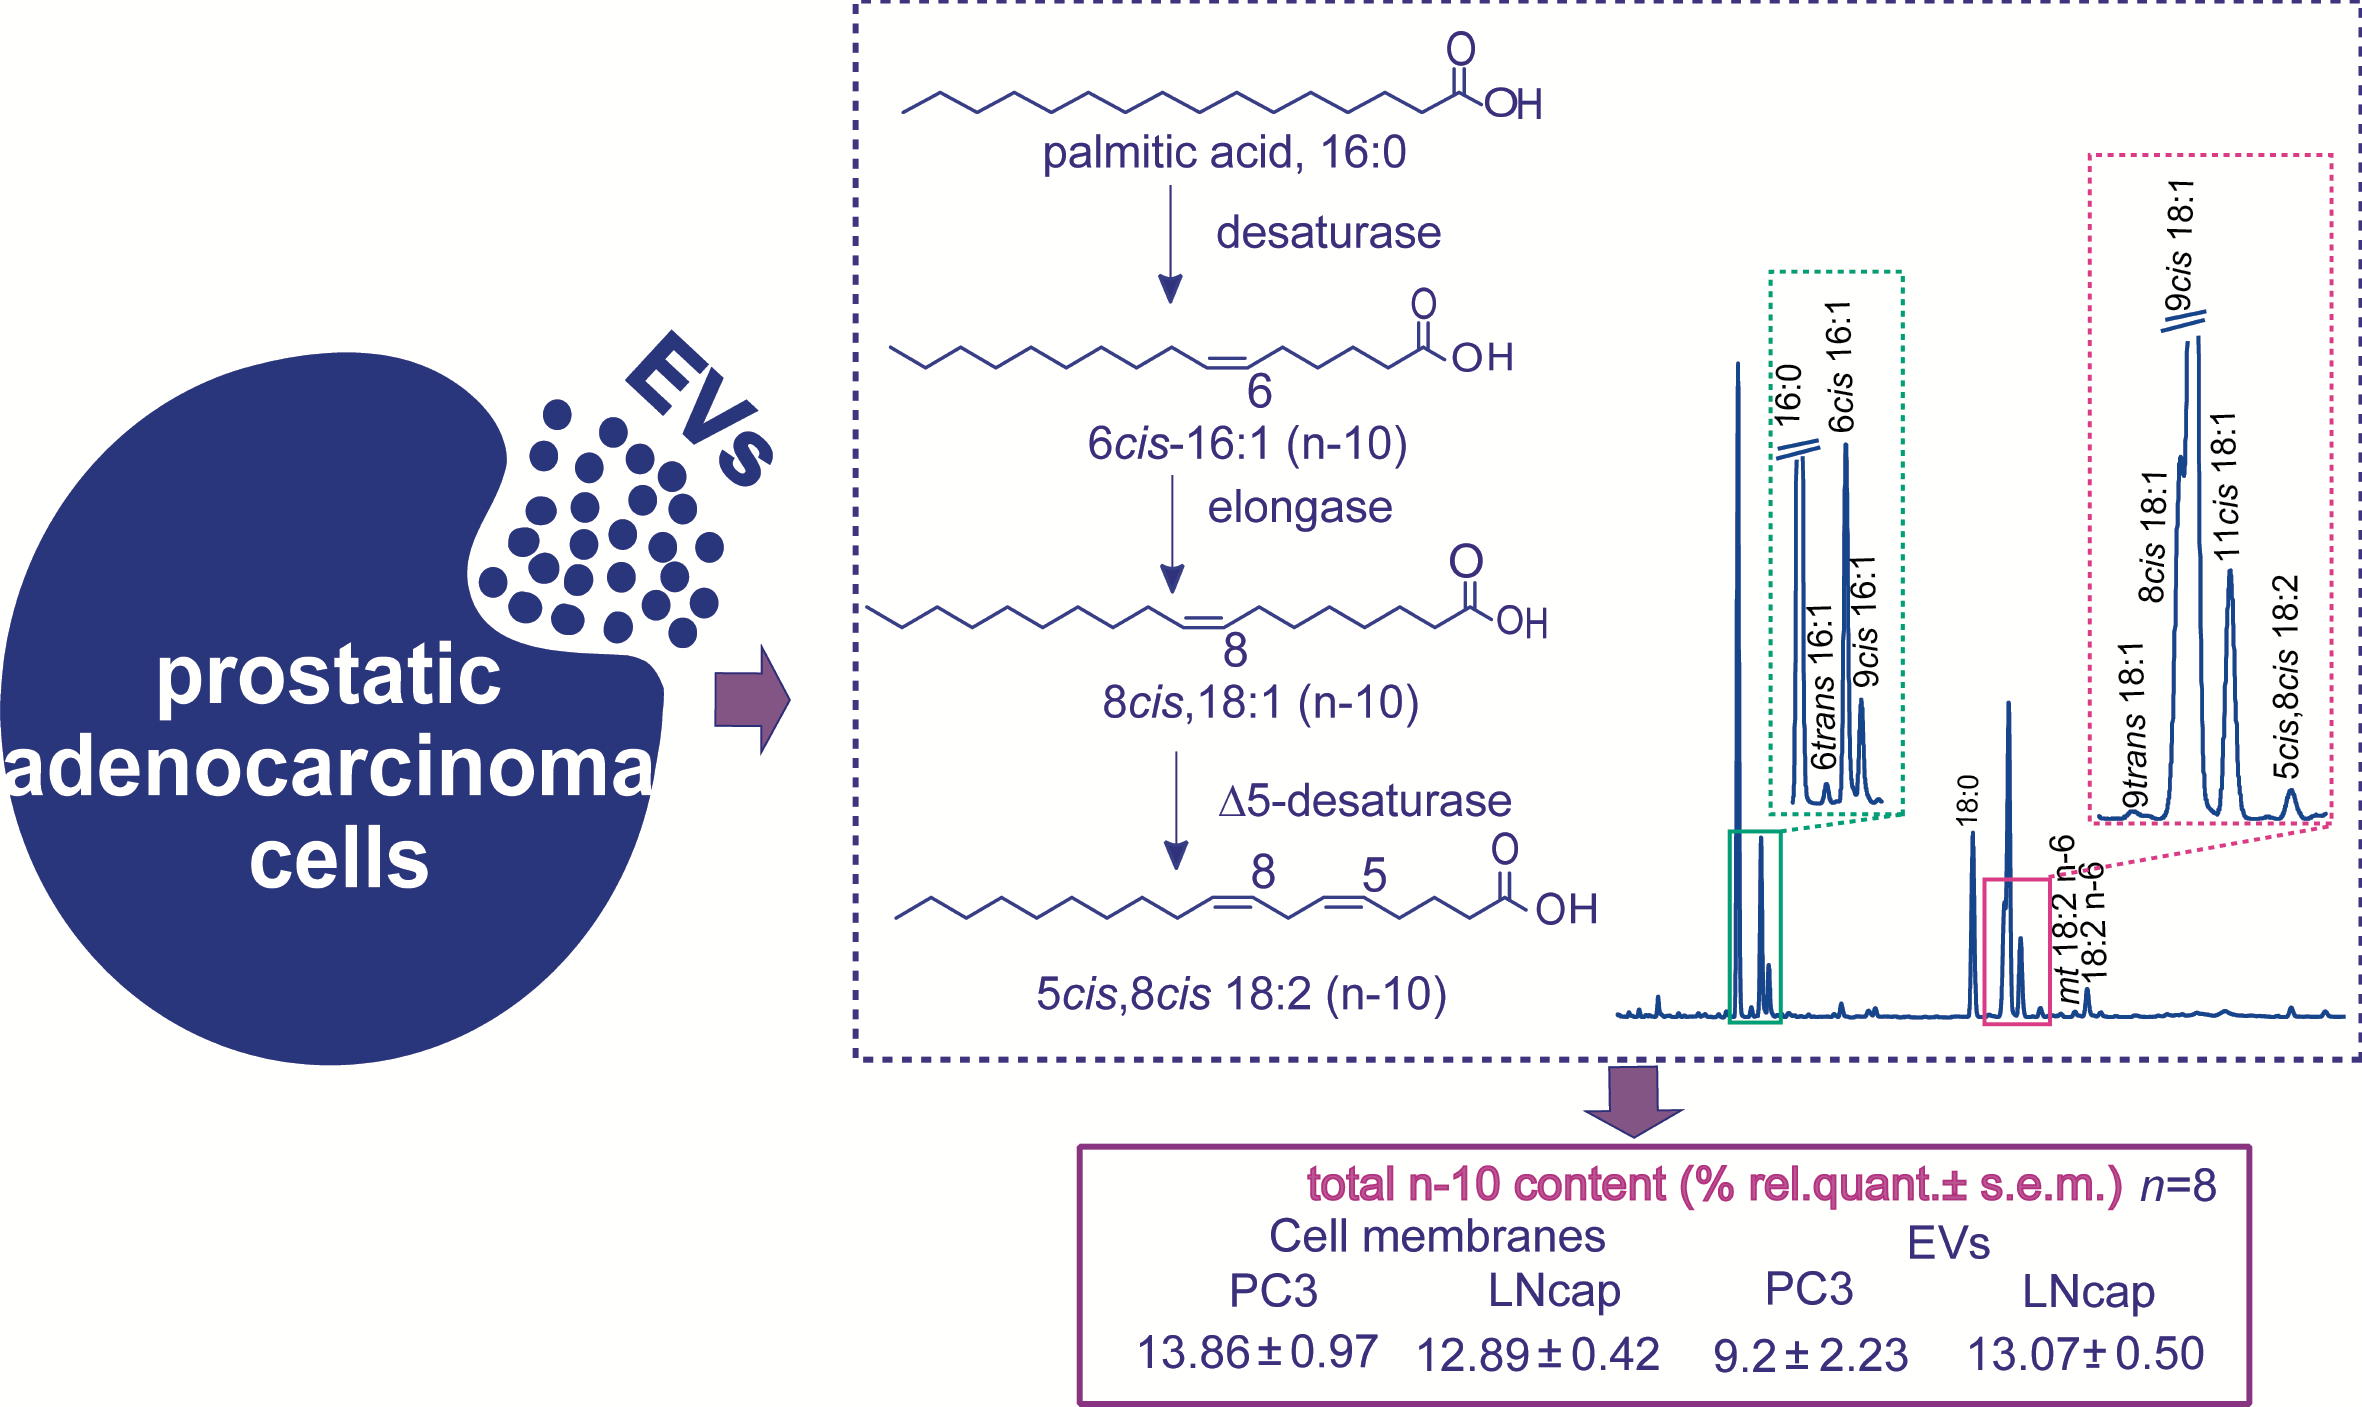
| n-10 | 13.86 ± 0.97 | 12.89 ± 0.42 |
| Total trans | 0.83 ± 0.07 | 1.02 ± 0.06 |
| FAME 1 | PC3-EVs (n = 8) 2 | LNCaP-EVs (n = 8)2 |
|---|---|---|
| C14:0 | 4.38 ± 1.17 | 5.27 ± 0.25 |
| C16:0 | 33.32 ± 0.74 | 35.62 ± 0.96 |
| 6trans-C16:1 | 0.10 ± 0.02 | 0.48 ± 0.03 *** |
| 6cis-C16:1 n-10 | 6.10 ± 1.59 | 8.13 ± 0.28 |
| 9cis-C16:1 n-7 | 1.10 ± 0.26 | 1.59 ± 0.08 |
| C18:0 | 12.35 ± 0.52 | 15.34 ± 0.66 ** |
| 9trans-C18:1 | 0.18 ± 0.04 | 0.22 ± 0.04 |
| 8cis-C18:1 n-10 | 2.85 ± 0.67 | 4.32 ± 0.27 * |
| 9cis-C18:1 n-9 | 30.83 ± 4.41 | 15.43 ± 0.66 ** |
| 11cis-C18:1 n-7 | 1.21 ± 0.08 | 1.57 ± 0.24 |
| 5cis,8cis-C18:2 n-10 | 0.25 ± 0.03 | 0.62 ±0.07 *** |
| mono-trans C18:2 n-6 | 0.15 ± 0.03 | 0.20 ± 0.06 |
| C18:2 n-6 | 3.43 ± 0.50 | 2.91 ± 0.18 |
| C20:3 n-6 | 0.49 ± 0.08 | 0.98 ± 0.16 * |
| C20:4 n-6 | 0.70 ± 0.15 | 2.05 ± 0.13 *** |
| mono-trans C20:4 | 0.05 ± 0.02 | 0.08 ± 0.02 |
| C20:5 n-3 | 0.29 ± 0.05 | 0.55 ± 0.09 * |
| C22:5 n-3 | 0.54 ± 0.14 | 1.41 ± 0.19 ** |
| C22:6 n-3 | 1.68 ± 0.24 | 3.22 ± 0.23 *** |
| SFA | 50.05 ± 1.50 | 56.23 ± 0.61 ** |
| MUFA | 42.08 ± 2.25 | 31.05 ± 0.49 *** |
| PUFA | 7.39 ± 0.94 | 11.74 ± 0.41 *** |
| n-6 | 4.62 ± 0.57 | 5.94 ± 0.22 * |
| n-3 | 2.51 ± 0.38 | 5.18 ± 0.32 *** |
| n-6/n-3 | 1.97 ± 0.17 | 1.18 ± 0.08 *** |
| n-10 | 9.20 ± 2.23 | 13.07 ± 0.50 |
| Total trans | 0.48 ± 0.08 | 0.98 ± 0.09 |
© 2020 by the authors. Licensee MDPI, Basel, Switzerland. This article is an open access article distributed under the terms and conditions of the Creative Commons Attribution (CC BY) license (http://creativecommons.org/licenses/by/4.0/).
Share and Cite
Ferreri, C.; Sansone, A.; Buratta, S.; Urbanelli, L.; Costanzi, E.; Emiliani, C.; Chatgilialoglu, C. The n-10 Fatty Acids Family in the Lipidome of Human Prostatic Adenocarcinoma Cell Membranes and Extracellular Vesicles. Cancers 2020, 12, 900. https://doi.org/10.3390/cancers12040900
Ferreri C, Sansone A, Buratta S, Urbanelli L, Costanzi E, Emiliani C, Chatgilialoglu C. The n-10 Fatty Acids Family in the Lipidome of Human Prostatic Adenocarcinoma Cell Membranes and Extracellular Vesicles. Cancers. 2020; 12(4):900. https://doi.org/10.3390/cancers12040900
Chicago/Turabian StyleFerreri, Carla, Anna Sansone, Sandra Buratta, Lorena Urbanelli, Eva Costanzi, Carla Emiliani, and Chryssostomos Chatgilialoglu. 2020. "The n-10 Fatty Acids Family in the Lipidome of Human Prostatic Adenocarcinoma Cell Membranes and Extracellular Vesicles" Cancers 12, no. 4: 900. https://doi.org/10.3390/cancers12040900