Reciprocity Effects in the Trust Game

Department of Social Science and Policy Studies (SSPS), Worcester Polytechnic Institute (WPI), 100 Institute Road, Worcester, MA 01605, USA
Games 2013, 4(3), 367-374; https://doi.org/10.3390/g4030367
Submission received: 19 June 2013
/
Revised: 18 July 2013
/
Accepted: 25 July 2013
/
Published: 31 July 2013
Abstract
:I use data from a previous experiment for classifying subjects based on their behavior in the trust game. Prior literature defines a “reciprocity effect” as the tendency for Second Movers to return proportions increasing in the amounts that they receive. In the data that I use, 31% of Second Movers show reciprocity effects, 31% are neutral, and 25% consistently free-ride, indicating that the aggregate reciprocity effect for the sample as a whole is attributable to a minority of the subjects.
1. Introduction
In the trust game of Berg et al. [1], two subjects are provided with endowments of money by the experimenter. The First Mover chooses how much of her endowment to send to the Second Mover, the amount is tripled before being received by the Second Mover, and the Second Mover decides how much of the amount received to return to the First Mover. The amounts First Movers send measure trust. The literature frequently interprets the proportions that Second Movers return as a measure of trustworthiness, but they could reflect inequity aversion or even pure altruism.
Returning positive amounts is consistent with inequity aversion [2], since Second Movers receiving positive amounts have more money than First Movers when making their return decisions. However, Second Movers may also return positive amounts to reciprocate the kindness of First Movers, as suggested by theories of reciprocity [3,4]. Trust game experiments indicate that inequity aversion and reciprocity are both important determinants of return decisions [5].
Regarding reciprocity, an interpretation of the trust game using Rabin’s [3] theory of reciprocity is that the amounts sent represent the kindness of First Movers and the proportions returned represent the kindness of Second Movers. The relationship between the two variables thus captures the strength of the Second Mover’s reciprocity toward the First Mover. Consistent with this view, Cochard et al. [6] define a “reciprocity effect” as the tendency for Second Movers to return proportions increasing with the amounts that they receive.
Cochard et al. [6] show that, on average, Second Movers who receive high amounts return high proportions. They interpret the aggregate level reciprocity for the sample as a whole as evidence supporting the existence of reciprocity effects. In this paper, I follow an approach similar to that of Fischbacher et al. [7], who classify subjects according to how they play public good games. I show that while some subjects in the trust game return proportions increasing in the amounts that they receive, many others do not behave in this manner. In fact, less than half of the Second Movers in the sample for this paper demonstrate individual level reciprocity effects, even though there are reciprocity effects in aggregate. Therefore, aggregating responses over individuals can be misleading. One can observe reciprocity effects in aggregate even if most subjects do not show individual level reciprocity effects.
I conducted my analysis using data from a previous trust experiment that was run using the strategy method [8]. The rich data set allowed me to construct a response function for each subject and determine whether each subject showed an individual level reciprocity effect. In addition, in the data that I used, subjects made decisions for multiple trust games, indicating whether response functions are similar for different plays of the game.
I categorized individual subjects according to their average behavior in the six games that they played and found that only 31% demonstrate reciprocity effects. 31% are neutral—having average response functions that are neither increasing nor decreasing in the amounts that they received, 13% have decreasing average response functions, and the remaining 25% free-ride—meaning that for most plays of the game they chose to return nothing for every possible amount received. Examining individual subjects’ different response functions for different plays of the game indicates that it was quite common for subjects to use different strategies for different plays of the game despite the fact that they received no feedback until all decisions had been made.
2. Experimental Section
The data is from a previous experiment by Eckel and Petrie [8] (EP). EP examine whether people behave differently when they see their partners’ photos and whether they are willing to pay to see the photos. The experiment consists of three treatments: a control treatment in which subjects do not see their partners, a treatment in which subjects are shown photos of their partners, and a treatment in which subjects can buy the opportunity to see the photos. To avoid the confounding effects of the photos, which are not of interest in this study, I focus on EP's control treatment. For a full explanation of the original experiment, see EP.
In the control treatment, subjects played the trust game with randomly assigned partners using endowments of 10 tokens, each worth $1.50. Subjects were paired with six different partners and made their decisions simultaneously without feedback. They were randomly assigned to a role (First Mover or Second Mover), informed of their roles before making any decisions, and kept their roles for the duration of the experiment. First Movers decided how many tokens to send to each of six Second Movers. Second Movers made decisions using the strategy method. Specifically, for each possible amount received from each of the six First Movers, Second Movers decided how many tokens to return. Thus, each Second Mover submitted six different response functions—one for each of her partners—for a total of 60 decisions per Second Mover. Subjects submitted decisions without knowing what any of their partners decided to do. At the end of the experiment, one of the six games was randomly chosen for determining actual payoffs.
3. Results and Discussion
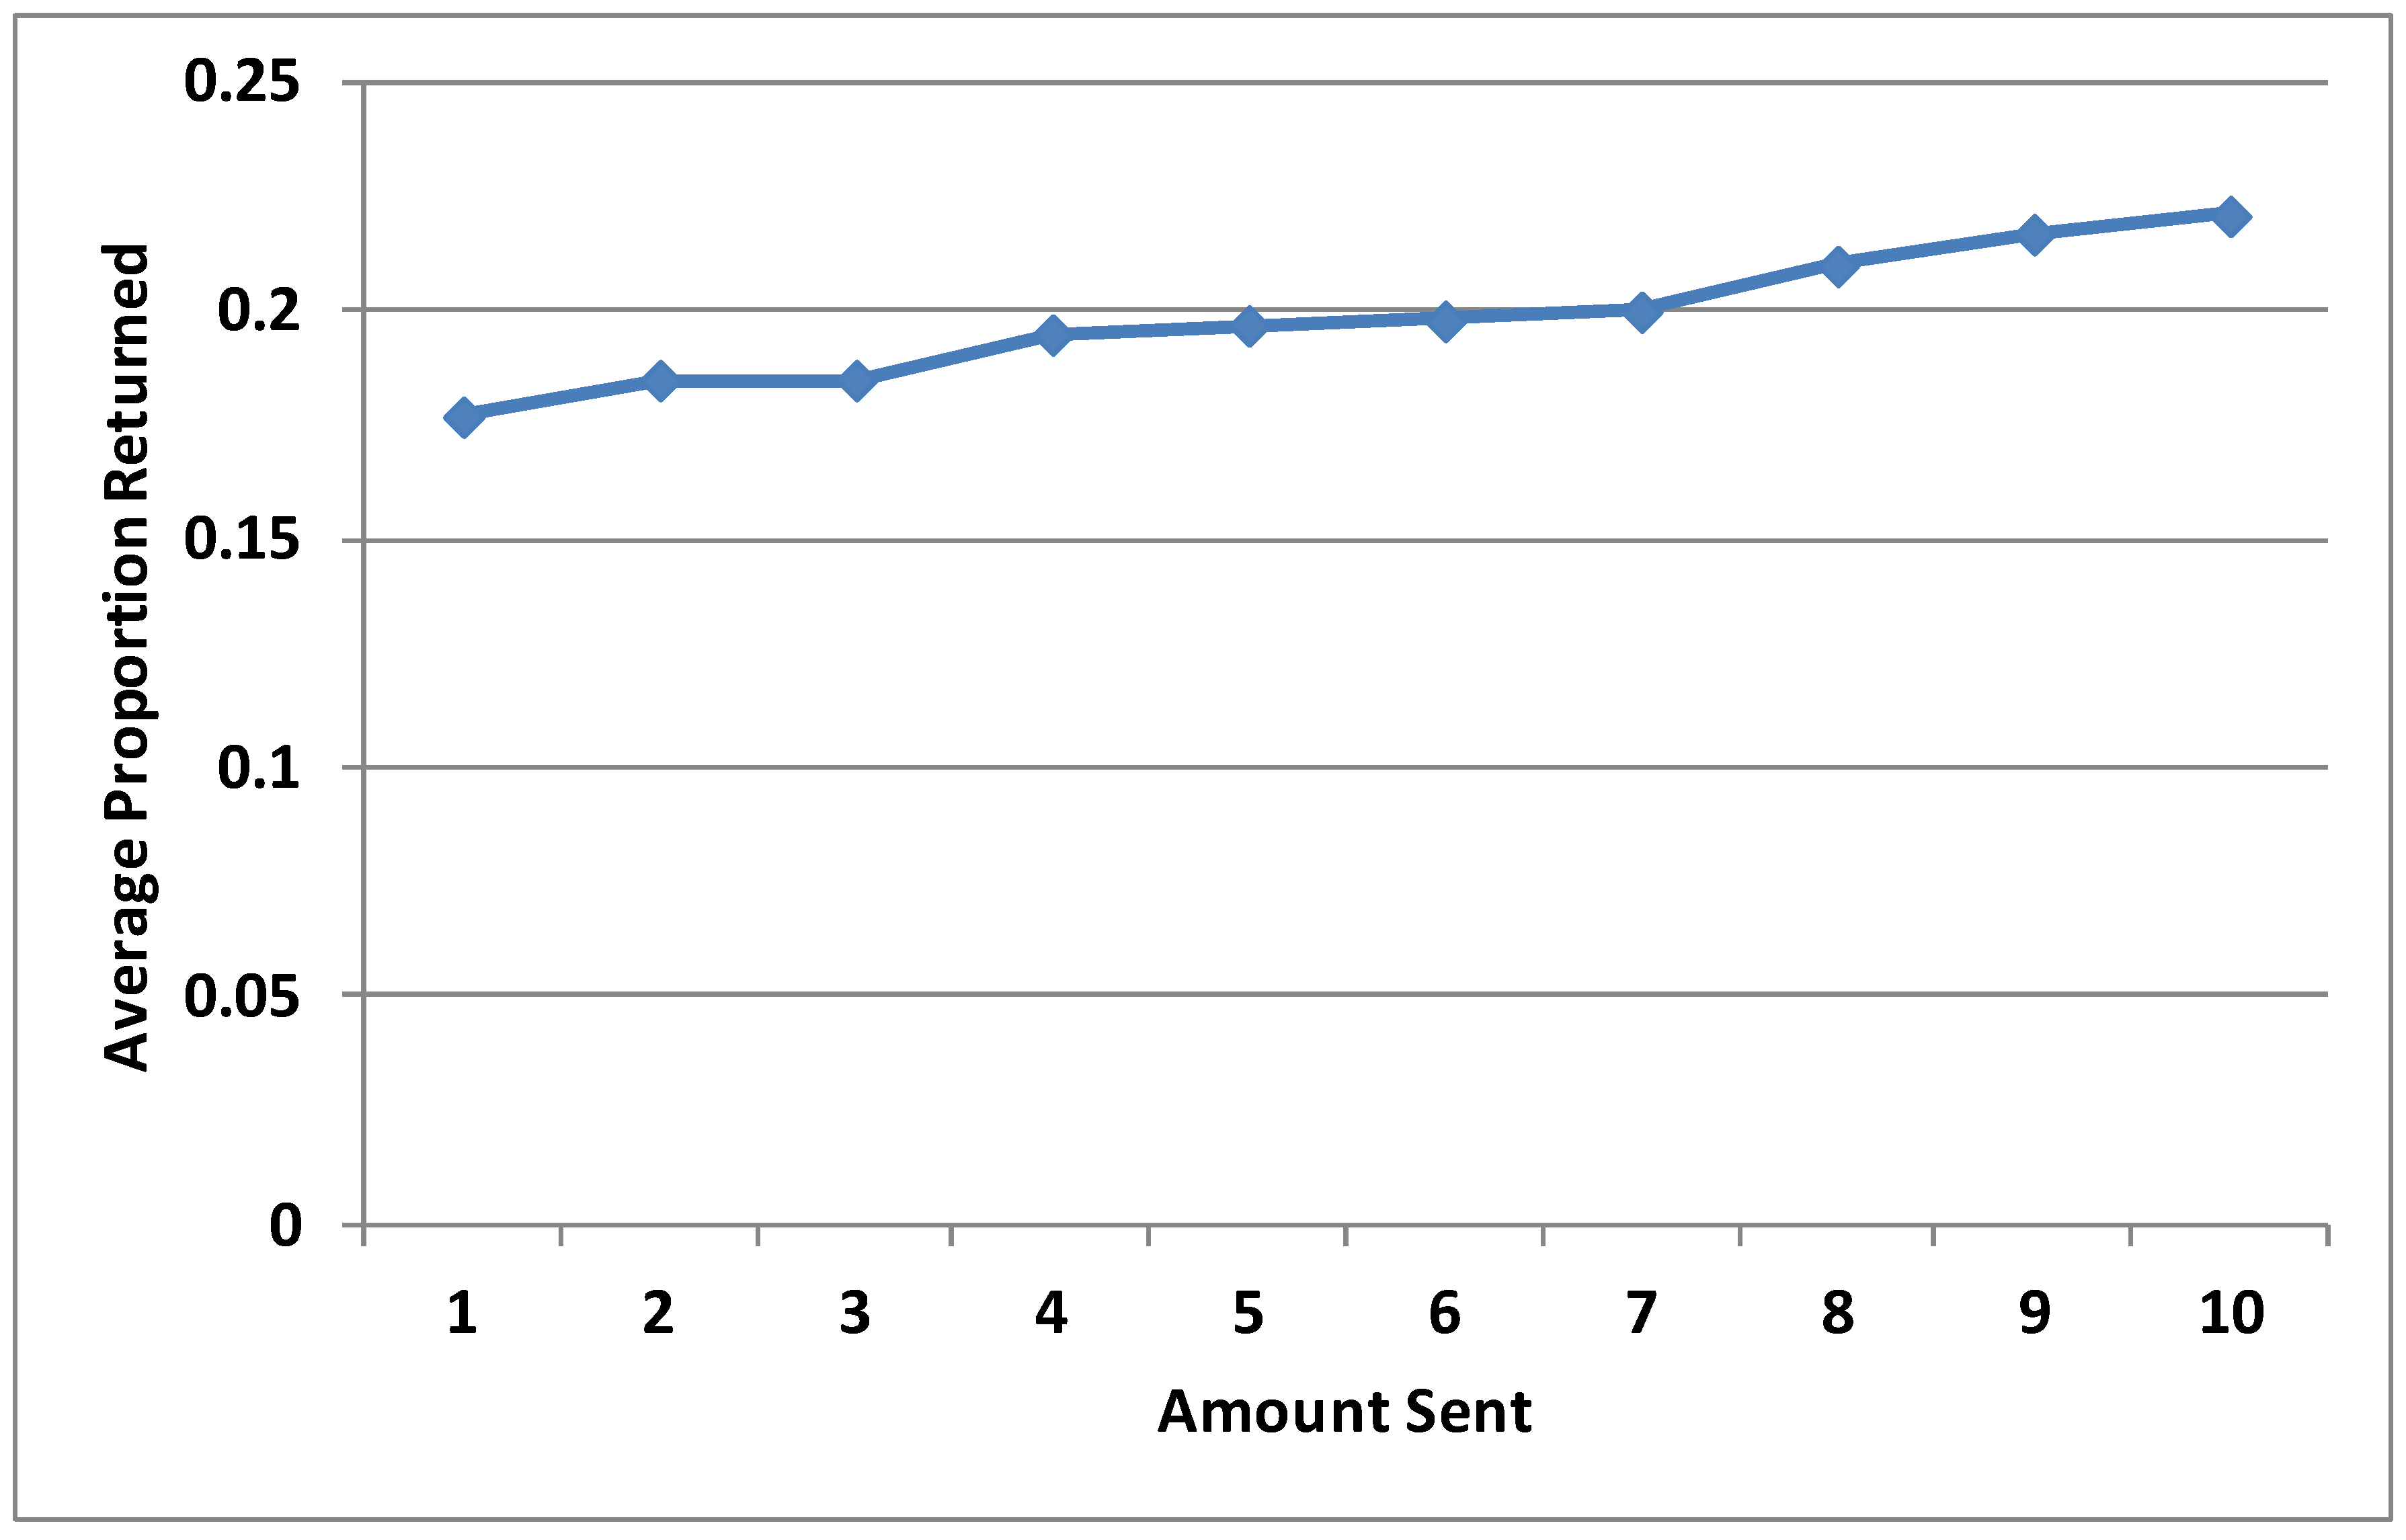
Sixty-four subjects participated in the control treatment. Thus, there is data from 32 Second Movers for each of six games. Figure 1 illustrates the average proportion returned for each amount sent. Following Fischbacher et al. [7], I use Spearman’s ρ for characterizing behavior. My aim was to identify correlation between the average proportion returned and the amount sent. Spearman’s ρ is preferable over Pearson’s ρ because it is less sensitive to outliers. The correlation between the average proportions returned and the amounts sent is highly significant (Spearman’s, ρ = 0.9879, p = 0.0000, n = 10); the finding is consistent with the results of Cochard et al. [6]. (I report the correlation between the average proportions returned and the amounts sent to avoid overstating the number of independent observations. However, the approach neglects that the averages are statistics, calculated with sampling error. If I instead calculate the correlation using every combination of proportion returned and amount sent, the correlation is lower, but the statistical significance is similar (Spearman’s, ρ = 0.0944, p = 0.0000, n = 1920; 32 subjects × 6 games × 10 decisions). The same occurs for of all the correlations that I report.)
Figure 1.
Average proportion returned for each amount sent.

Table 1 classifies subjects as Reciprocators, Neutral, Anti-Reciprocators and Free-Riders. Subjects are classified according to their average behavior in the six games so that none of them have ambiguous classifications. An alternative classification strategy would have been to characterize behavior in each game and then each subject according to the behavior that they exhibited most often, but this would have led to ambiguous classifications for multiple subjects who exhibited their most common types of behavior equally often.

| Classification | Number | Percentage |
|---|---|---|
| Reciprocator | 10 | 31% |
| neutral | 10 | 31% |
| Anti-Reciprocator | 4 | 13% |
| Free Rider | 8 | 25% |
| Total | 32 | 100% |
Subjects are classified as Reciprocators if, based on the average of their six response functions, the proportions that they chose to return for each amount sent are increasing in the amounts sent. Ten subjects (31%) fall into this category (Spearman’s ρ > 0; p < 0.01 for seven subjects, p = 0.01, p = 0.04 and p = 0.04 for the remaining three; n = 10 for each subject). Ten subjects are classified as Neutral because their Spearman’s ρ has p > 0.10 (based on n = 10). Four subjects (13%) are Anti-Reciprocators because they returned proportions decreasing in the amounts sent (Spearman’s ρ < 0, with p < 0.01, n = 10). Finally, eight subjects (25%) are Free-riders because they returned nothing for all amounts sent in a majority of the six games.
An alternative way of approaching the data is to characterize behavior at the level of strategies, by focusing on the response functions for each game. Table 2 provides such a classification. Compared to the classification of subjects, “Reciprocator” and “Anti-Reciprocator” occur less frequently and “Neutral” occurs more often. Basically, when response functions for each game are categorized, there is more noise in the data and it is less likely that the Spearman’s ρ is statistically significant, increasing the proportion of Neutral classifications. The prevalence of free-riding is about the same.
| Classification | Number | Percentage |
|---|---|---|
| Reciprocator | 42 | 22% |
| neutral | 87 | 45% |
| Anti-Reciprocator | 13 | 7% |
| Free Rider | 50 | 26% |
| Total | 192 | 100% |
Appendix Table A1 summarizes the 192 (32 subjects × 6 games) response functions and 32 average response functions. For all 10 subjects classified as Reciprocators, Spearman’s ρ is positive for at least four of the six response functions. However, nearly all of them had different response functions for the different games: only one subject had identical response functions for the six games, eight subjects had a different response function for each game and the final subject was a free-rider twice and had different response functions in each of the other four games.
Among the 10 subjects classified as Neutral, three have Spearman’s ρ > 0 in all six games, but fail to be classified as Reciprocators due to large flat or negatively-sloped regions in their average response functions. Among the other seven subjects, one had a flat response function in all six games and the remaining six had some combination of positively-, flatly- and negatively-sloped response functions. As far as the similarity of the response functions across games, three subjects had the same response function for all six games, two subjects had two of six response functions that were the same, and for the remaining 5 subjects, all six response functions were different.
For all four Anti-Reciprocators, a majority of the six response functions are negatively-sloped. Three of the four subjects had six different response functions, and for the fourth subject, five of the six response functions are identical.
Among the eight Free-riders, six were free-riders in all six games, and the other two, in four of the six games. Thus, it is only among Free-riders that most subjects had the same response function for most of their games.
The strategy method involves making multiple contingent choices that may or may not be implemented. A concern with the method is that it might generate different behavior from the more traditional “direct-response” method, in which subjects know their decisions will be relevant for determining outcomes. Brandts and Charness [9] survey the literature on experiments comparing direct-response and strategy methods and find that, for the most part, decisions are invariant to the method. Amdur and Schmick [10] present similar results specifically for trust games.
Of course, the papers comparing the strategy and direct-response methods do not shed light on why the subjects in this sample frequently played different strategies in different plays of the game despite not receiving any feedback until after all decisions had been made. One possibility is that the strategy method promotes decision-making noise and/or instability. Unfortunately, it is not clear how one would test this theory because in an equivalent “direct-response” version of the experiment presented here, as soon as Second Movers began making (payoff relevant) decisions, they would acquire earnings that could potentially affect their subsequent decisions. This would confound any comparisons between methods.
While it seems, at first, that any changes in behavior could not have been due to learning, recent research [11] finds that learning can occur in the absence of feedback. Rick and Weber [11] argue that withholding feedback encourages deeper thinking and introspection, promoting a better understanding of the game and its incentives. Thus, learning is also a potential explanation for why behavior varied in the different plays of the game.
4. Conclusions
I showed that there is heterogeneity among subjects with respect to demonstrating reciprocity effects and that the reciprocity effects observed in aggregate data are attributable to a minority of subjects. These findings raise important questions for future research. First, how does pairing subjects according to their types affect trust (in one-shot and repeated environments)? Second, in light of evidence that some people show reciprocity effects in trust games and some are conditional cooperators in public good games [7], to what extent do the same people behave reciprocally in different games?
Acknowledgments
I want to thank Catherine Eckel and Ragan Petrie for conducting an excellent experiment. I also want to thank the two anonymous referees for excellent comments and suggestions which greatly improved the paper.
Conflict of Interest
The author declares no conflict of interest.
References
- Berg, J.; Dickhaut, J.; McCabe, K. Trust, reciprocity, and social history. Games Econ. Behav. 1995, 10, 122–142. [Google Scholar] [CrossRef]
- Fehr, E.; Schmidt, K.M. A theory of fairness, competition, and cooperation. Q. J. Econ. 1999, 114, 817–868. [Google Scholar] [CrossRef]
- Rabin, M. Incorporating fairness into game theory and economics. Am. Econ. Rev. 1993, 83, 1281–1302. [Google Scholar]
- Dufwenberg, M.; Kirchsteiger, G. A theory of sequential reciprocity. Games Econ. Behav. 2004, 47, 268–298. [Google Scholar] [CrossRef]
- Cox, J.C. How to identify trust and reciprocity. Games Econ. Behav. 2004, 46, 260–281. [Google Scholar] [CrossRef]
- Cochard, F.; Nguyen-Van, P.; Willinger, M. Trusting behavior in a repeated investment game. J. Econ. Behav. Organ. 2004, 55, 31–44. [Google Scholar] [CrossRef]
- Fischbacher, U.; Gaechter, S.; Fehr, E. Are people conditionally cooperative? Econ. Lett. 2001, 71, 397–404. [Google Scholar] [CrossRef]
- Eckel, C.C.; Petrie, R. Face value. Am. Econ. Rev. 2011, 101, 1497–1513. [Google Scholar] [CrossRef]
- Brandts, J.; Charness, G. The strategy versus the direct-response method: A first survey of experimental comparisons. Exp. Econ. 2011, 14, 375–398. [Google Scholar] [CrossRef] [Green Version]
- Amdur, D.; Schmick, E. Does the direct-response method induce guilt aversion in a trust game? Econ. Bull. 2013, 33, 687–693. [Google Scholar]
- Rick, S.; Weber, R.A. Meaningful learning and transfer of learning in repeated games played repeatedly without feedback. Games Econ. Behav. 2010, 68, 716–730. [Google Scholar] [CrossRef]
Appendix
| Subject | Response Function | Average Response Function | |||||||||||||||||||
|---|---|---|---|---|---|---|---|---|---|---|---|---|---|---|---|---|---|---|---|---|---|
| 1 | 2 | 3 | 4 | 5 | 6 | ||||||||||||||||
| ρ | p | type | ρ | p | type | ρ | p | type | ρ | p | type | ρ | p | type | ρ | p | type | ρ | p | type | |
| 1 | 0.89 | 0.00 | R | 0.87 | 0.00 | R | 0.86 | 0.00 | R | 0.80 | 0.01 | R | 0.83 | 0.00 | R | 0.89 | 0.00 | R | 0.94 | 0.00 | R |
| 2 | 0.15 | 0.69 | N | 0.23 | 0.52 | N | 0.16 | 0.66 | N | 0.16 | 0.66 | N | 0.12 | 0.74 | N | 0.13 | 0.72 | N | 0.12 | 0.74 | N |
| 3 | 0.23 | 0.52 | N | 0.64 | 0.04 | R | 0.78 | 0.01 | R | 0.05 | 0.90 | N | 0.87 | 0.00 | R | 0.23 | 0.53 | N | 0.94 | 0.00 | R |
| 4 | 0.78 | 0.01 | R | 0.17 | 0.65 | N | 0.98 | 0.00 | R | 0.87 | 0.00 | R | 0.98 | 0.00 | R | 0.98 | 0.00 | R | 0.96 | 0.00 | R |
| 5 | 0.52 | 0.12 | N | 0.52 | 0.12 | N | 0.52 | 0.12 | N | 0.52 | 0.12 | N | 0.52 | 0.12 | N | 0.52 | 0.12 | N | 0.52 | 0.12 | N |
| 6 | 0.00 | 1.00 | N | −0.52 | 0.12 | N | 0.10 | 0.79 | N | 1.00 | 0.00 | R | 0.00 | 1.00 | N | 0.19 | 0.60 | N | 0.31 | 0.38 | N |
| 7 | 0.52 | 0.12 | N | 0.00 | 1.00 | FR | 0.00 | 1.00 | N | 0.00 | 1.00 | FR | 0.00 | 1.00 | FR | 0.00 | 1.00 | FR | 0.52 | 0.12 | FR |
| 8 | −0.80 | 0.01 | AR | −0.48 | 0.16 | N | 0.00 | 1.00 | N | 0.00 | 1.00 | N | −1.00 | 0.00 | AR | 0.20 | 0.57 | N | −0.90 | 0.00 | AR |
| 9 | 0.00 | 1.00 | FR | 0.00 | 1.00 | FR | 0.00 | 1.00 | FR | 0.00 | 1.00 | FR | 0.00 | 1.00 | FR | 0.00 | 1.00 | FR | 0.00 | 1.00 | FR |
| 10 | 0.64 | 0.04 | R | 0.64 | 0.04 | R | 0.64 | 0.04 | R | 0.64 | 0.04 | R | 0.64 | 0.04 | R | 0.64 | 0.04 | R | 0.64 | 0.04 | R |
| 11 | 0.63 | 0.05 | R | 0.63 | 0.05 | R | 0.00 | 1.00 | FR | 0.75 | 0.01 | R | 0.68 | 0.03 | R | 0.70 | 0.02 | R | 0.94 | 0.00 | R |
| 12 | −0.40 | 0.25 | N | 0.16 | 0.65 | N | −0.19 | 0.60 | N | −0.44 | 0.20 | N | 0.05 | 0.90 | N | −0.14 | 0.70 | N | −0.10 | 0.79 | N |
| 13 | 0.42 | 0.23 | N | 0.42 | 0.23 | N | 0.42 | 0.23 | N | 0.42 | 0.23 | N | 0.42 | 0.23 | N | 0.42 | 0.23 | N | 0.42 | 0.23 | N |
| 14 | −0.52 | 0.12 | N | 0.12 | 0.74 | N | −0.27 | 0.44 | N | 0.20 | 0.58 | N | 0.05 | 0.89 | N | −0.74 | 0.02 | AR | −0.43 | 0.22 | N |
| 15 | −0.90 | 0.00 | AR | −0.98 | 0.00 | AR | −0.66 | 0.04 | AR | −0.98 | 0.00 | AR | −0.99 | 0.00 | AR | 0.68 | 0.03 | R | −0.89 | 0.00 | AR |
| 16 | 0.66 | 0.04 | R | 1.00 | 0.00 | R | 0.00 | 1.00 | N | 0.03 | 0.93 | N | 0.94 | 0.00 | R | 0.00 | 1.00 | N | 0.87 | 0.00 | R |
| 17 | 0.40 | 0.26 | N | 0.45 | 0.19 | N | 1.00 | 0.00 | R | −0.49 | 0.15 | N | 0.46 | 0.18 | N | 0.58 | 0.08 | N | 0.65 | 0.04 | R |
| 18 | 0.00 | 1.00 | FR | 0.00 | 1.00 | FR | 0.00 | 1.00 | FR | 0.00 | 1.00 | FR | 0.00 | 1.00 | FR | 0.00 | 1.00 | FR | 0.00 | 1.00 | FR |
| 19 | 0.00 | 1.00 | N | 0.00 | 1.00 | N | 0.00 | 1.00 | N | 0.00 | 1.00 | N | 0.00 | 1.00 | N | 0.00 | 1.00 | N | 0.00 | 1.00 | N |
| 20 | −0.89 | 0.00 | AR | 0.01 | 0.99 | N | 0.00 | 1.00 | FR | 0.00 | 1.00 | FR | 0.00 | 1.00 | FR | 0.00 | 1.00 | FR | −0.83 | 0.00 | FR |
| 21 | 0.83 | 0.00 | R | 0.92 | 0.00 | R | 0.55 | 0.10 | N | 0.07 | 0.85 | N | 0.81 | 0.00 | R | 0.67 | 0.03 | R | 0.87 | 0.00 | R |
| 22 | 0.00 | 1.00 | FR | 0.00 | 1.00 | FR | 0.00 | 1.00 | FR | 0.00 | 1.00 | FR | 0.00 | 1.00 | FR | 0.00 | 1.00 | FR | 0.00 | 1.00 | FR |
| 23 | 0.81 | 0.00 | R | 0.80 | 0.01 | R | 0.35 | 0.32 | N | 0.30 | 0.40 | N | −1.00 | 0.00 | AR | 0.52 | 0.12 | N | 0.76 | 0.01 | R |
| 24 | −1.00 | 0.00 | AR | 0.53 | 0.11 | N | 0.66 | 0.04 | R | 0.20 | 0.57 | N | 0.24 | 0.50 | N | 0.53 | 0.12 | N | −0.06 | 0.87 | N |
| 25 | 0.00 | 1.00 | FR | 0.00 | 1.00 | FR | 0.00 | 1.00 | FR | 0.00 | 1.00 | FR | 0.00 | 1.00 | FR | 0.00 | 1.00 | FR | 0.00 | 1.00 | FR |
| 26 | −0.13 | 0.72 | N | −0.44 | 0.21 | N | −0.53 | 0.12 | N | 0.00 | 1.00 | FR | −0.51 | 0.13 | N | 0.00 | 1.00 | FR | −0.41 | 0.24 | N |
| 27 | −0.55 | 0.10 | N | −0.32 | 0.37 | N | 0.28 | 0.44 | N | 0.00 | 1.00 | N | 0.00 | 1.00 | N | −0.70 | 0.02 | AR | −0.54 | 0.11 | N |
| 28 | 0.00 | 1.00 | FR | 0.00 | 1.00 | FR | 0.00 | 1.00 | FR | 0.00 | 1.00 | FR | 0.00 | 1.00 | FR | 0.00 | 1.00 | FR | 0.00 | 1.00 | FR |
| 29 | −1.00 | 0.00 | AR | −0.45 | 0.19 | N | −0.45 | 0.19 | N | −0.45 | 0.19 | N | −0.45 | 0.19 | N | −0.45 | 0.19 | N | −0.85 | 0.00 | AR |
| 30 | −0.52 | 0.12 | N | −0.41 | 0.24 | N | −0.29 | 0.42 | N | −0.17 | 0.63 | N | −0.06 | 0.87 | N | 0.06 | 0.87 | N | −0.97 | 0.00 | AR |
| 31 | 0.00 | 1.00 | FR | 0.00 | 1.00 | FR | 0.00 | 1.00 | FR | 0.00 | 1.00 | FR | 0.00 | 1.00 | FR | 0.00 | 1.00 | FR | 0.00 | 1.00 | FR |
| 32 | 0.00 | 1.00 | FR | 0.75 | 0.01 | R | 0.68 | 0.03 | R | 0.00 | 1.00 | FR | 0.68 | 0.03 | R | 0.75 | 0.01 | R | 0.91 | 0.00 | R |
Notes: Spearman’s ρ and associated p-value is listed. R: Reciprocator; N: Neutral; AR: Anti-Reciprocator; FR: Free Rider.
© 2013 by the authors; licensee MDPI, Basel, Switzerland. This article is an open access article distributed under the terms and conditions of the Creative Commons Attribution license (http://creativecommons.org/licenses/by/3.0/).
Share and Cite
MDPI and ACS Style
Smith, A. Reciprocity Effects in the Trust Game. Games 2013, 4, 367-374. https://doi.org/10.3390/g4030367
AMA Style
Smith A. Reciprocity Effects in the Trust Game. Games. 2013; 4(3):367-374. https://doi.org/10.3390/g4030367
Chicago/Turabian StyleSmith, Alexander. 2013. "Reciprocity Effects in the Trust Game" Games 4, no. 3: 367-374. https://doi.org/10.3390/g4030367