
A Study of the Triggers of Conflict and Emotional Reactions

1
Amazon.com, Inc., 440 Terry Ave. N, Seattle, CA 98109, USA
2
Department of Economics, University of California, 3151 Social Science Plaza, Irvine, CA 92697, USA
3
Department of Management, University of Texas, One UTSA Circle, San Antonio, TX 78249, USA
4
Economic Science Institute, Chapman University, One University Drive, Orange, CA 92866, USA
5
Weatherhead School of Management, Case Western Reserve University, 11119 Bellflower Road, Cleveland, OH 44106, USA
*
Author to whom correspondence should be addressed.
Games 2017, 8(2), 21; https://doi.org/10.3390/g8020021
Submission received: 21 January 2017
/
Revised: 2 March 2017
/
Accepted: 30 March 2017
/
Published: 20 April 2017
(This article belongs to the Special Issue Behavior Regulation and Conflicted Emotions: Theory and Experimental Evidence)
Abstract
:We study three triggers of conflict and explore their resultant emotional reactions in a laboratory experiment. Economists suggest that the primary trigger of conflict is monetary incentives. Social psychologists suggest that conflicts are often triggered by fear. Finally, evolutionary biologists suggest that a third trigger is uncertainty about an opponent’s desire to cause harm. Consistent with the predictions from economics, social psychology, and evolutionary biology, we find that conflict originates from all three triggers. The three triggers differently impact the frequency of conflict, but not the intensity. Also, we find that the frequency and intensity of conflict decrease positive emotions and increase negative emotions and that conflict impacts negative emotions more than positive emotions.
1. Introduction
The study of human conflict is old. Hobbes wrote in the 17th Century that “the condition of Man … is a condition of Warre (sic) of everyone against everyone” [1]. The occurrence of human conflict is older. Fatal conflict between warring hunter-gatherers in West Turkana, Kenya occurred around 9700 BCE [2], but was likely a regular part of life thousands of years earlier [3]. Its ubiquity, coupled with the emotions experienced by those involved, makes human conflict a regular topic of discussion in the social and natural sciences—especially economics, social psychology, and evolutionary biology.
There is no dearth of empirical research on conflict and emotions in the aggregated body of economics, social psychology, and evolutionary biology research. However, little empirical work exists about the “triggers” of conflict and their accompanying emotions. Like focusing only on the second and third acts of a three-act play, most conflict management research focuses on conflict dynamics that are mature or already entrenched among warring parties. Studying the first act of conflict—i.e., what triggers it in the first place—may complement our understanding of conflict dynamics and provide practical insights into how to avoid a conflict from progressing to acts two and three.
Conflict may be defined as a situation in which agents choose adversarial costly inputs that (i) negatively impact the payoff of others and (ii) generate no positive externalities for third parties [4]. Economists, social psychologists, and evolutionary biologists emphasize different triggers of conflict. A triggered conflict subsequently produces an emotional reaction—a neurological response—which may result in physical and psychological changes aggravating individual behavior and leading to an even more severe conflict. The current study examines the interplay between the triggers of conflict and emotional reactions—a gap yet to be addressed across the economic, social psychology, and evolutionary biology literatures.
The purpose of our study is to systematically examine potential triggers of conflict and resultant emotional reactions in a controlled laboratory setting where individuals may engage in destructive activities. Our study makes a priori predictions about the triggers of conflict and explores the resultant emotions post hoc. Consistent with the predictions from economics, social psychology, and evolutionary biology, conflict emerges when there are economic incentives, fear of an opponent’s behavior, and uncertainty about an opponent’s desire to cause harm. Further, the three triggers differently impact the frequency of conflict, but not the intensity. Also, we find that the frequency and intensity of conflict decrease positive emotions and increase negative emotions. Finally, we find that conflict impacts negative emotions more than positive emotions.
2. Theoretical Background
2.1. The Economic Perspective on Conflict
The primary trigger of conflict studies by economists is monetary incentives. Economics research finds that economic agents engage in conflicts when such conflicts bring positive expected returns, often in the form of monetary rewards [5,6,7]. However, ultimately, conflict expenditures are wasteful and agents would be better off if they did not engage in such conflicts [8,9,10,11,12].
The economic perspective on conflict maintains that as individuals have greater incentive to incite conflict, conflict will emerge [13]. Francisco Pizarro’s conquest of the Incan Empire was primarily motivated by the incentives of gold and political power [14]. A more recent example of incentives inciting conflict is the Iraq–Kuwait War that emerged from a multi-billion dollar debt pressure on Iraq from a previous war coupled with Kuwait’s competitive petroleum prices against Iraq’s [15].
2.2. The Social Psychological Perspective on Conflict
The broad field of social psychology presents several triggers for conflict, including status seeking [16], greed [17], and fear. We focus on the trigger that has received considerable attention: fear in what others can and will do to cause harm [18]. A body of work that has examined the role of fear in conflict extensively is about social dilemmas. Social dilemmas are interdependent decisions where individual rationality aggregates to collective irrationality and ruin [19]. A social dilemma that captures the essence of conflict incited by fear is the Hardin’s “tragedy of the commons” [20]. On a commons meadow, shepherds may graze as many animals of their own herd as wanted for fattening and later sale. The benefits of a fatter animal are internalized to the focal shepherd, while the costs of fattening the animal are spread across the other shepherds. Because the benefits enjoyed by the shepherd is greater than his costs, it is rational for the shepherd to place as many animals on the commons as possible. The common risks collapse when all (or enough) shepherds add as many animals as they can. Hardin [21] went on to suggest that even those not opportunistic would oblige to place their entire herd on the commons today in fear that the grass will be gone tomorrow.
The fear that others will opportunistically incite conflict is a powerful motivator to defensively incite conflict [22,23]. Indeed, empirical work on social dilemmas finds that an individual’s fear of another’s exploitation motivates conflict defensively [24,25,26,27]. The Cold War is often considered a classic example of conflict incited by paranoia between political leaders and among neighbors [28].
2.3. The Evolutionary Biology Perspective on Conflict
Evolutionary biologists suggest that the third trigger of conflicts is uncertainty about an opponent’s ability and desire to cause harm [29]. Thus, whereas social psychologists are interested in the uncertainty (or fear) of another party’s intentions, evolutionary biologists are interested in the uncertainty of an opponent’s ability and desire to win a conflict. When there is perfect information and the costs of conflict are relatively high, settlements are likely to occur according to certain asymmetries between the contestants [30,31]. However, when there is uncertainty and differences are hard to detect, conflicts are more likely to ensue as the contestants uncover who is stronger (or more aggressive) and who is weaker [32,33].
It is well-documented that animals use different signals, evolutionarily designed to reduce uncertainty about an opponent’s strength, to demonstrate their strength as well as their desire to engage in contests. For example, crickets use songs to signal their ability to win an aggressive contest [34]. Wood warblers use low-amplitude songs to signal their desire to attack their opponents [35]. Moreover, such signaling actions are more likely to take place when contests can be avoided [36], suggesting that concealing actions (thus increasing uncertainty about an opponent’s desire to cause harm) could lead to higher frequency of conflict. A historical example of humans using signals of their desire and capability to fight is the Māori’s use of the Haka dance—the peruperu—when they encountered hostile tribes and unwelcome European explorers [37]. A modern example is warring street gangs who brandishing their weapons to signal their desire and capability to defend their turf [38].
3. Methods
3.1. Experimental Design
To test how monetary incentives, fear, and uncertainty trigger conflict, we conduct a simple laboratory experiment. The experimental sessions were conducted in the Experimental Social Science Laboratory (ESSL) at the University of California, Irvine. Participants were seated at one of forty networked computer terminals and separated by privacy screens. All interactions were anonymous and took place through the computer terminals using the software package z-Tree [39]. Participants were recruited via email announcement. Each subject participated in only one session, and had not previously participated in a similar experiment. In addition to the earnings from the experiment, each participant received a US$7 payment for showing up on time. There were 310 participants in total. A participant’s total earnings was the sum of the two payments. On average, the participants received $14.90 for approximately 40 min of participation. Earnings were paid in cash, privately, at the end of the session.
The experiment consisted of three parts (for detail instructions see the Appendix A). Participants were told that there will be three parts to the experiment and that they would receive a payoff from each part, but they only received instructions for each part one at a time (after completing a preceding part). In the first part, participants had the opportunity to earn a lump-sum payment by correctly solving math problems. The task entailed repeatedly adding sequences of five randomly generated two-digit numbers over the course of 10 min [40]. This is an appealing real-effort task because it does not require previous experience and high performance is not associated with a particular gender, socioeconomic background, or physical conditioning [41]. Any participant that correctly answered at least X = 3 such sequences, where X was unknown to the participants but known to be achievable, received the payment. The purpose of the task was to create a sense of ownership over the lump-sum payment, while making sure that all participants worked as hard as possible (since X was unknown to them) and could successfully complete the task (since X = 3 was a very low threshold). The task has been previously used by Price and Sheremeta [42]. They showed that using an uncertain threshold elicits similar effort from participants as a piece-rate (ensuring that all participants work as hard as possible), yet it results in equal payments to all participants.
Second, participants stated their preferences over five pairs of paintings and were divided into two equal groups based upon these stated preferences [43]. Each pair consisted of one painting by Wassily Kandinsky and one painting by Paul Klee. To make the division, we rank-ordered the participants based on the number of Kandinsky paintings they prefer (ties broken randomly), assigning those participants above the median to the Kandinsky group, and those participants below the median to the Klee group. The grouping created a sense, albeit weak, of group identity, which is the natural case in conflict situations. Lastly, each participant from the Kandinsky group was randomly matched with a participant from the Klee group for a one-shot game.
Third, participants participated in one of the four treatments, see Table 1. Our treatments were based on the modified “Joy of Destruction” game [44,45] and a “Reverse Dictator” game [46,47].
In the Baseline treatment, after earning $10 in the effort task, one participant in each pair was assigned the Sender role and the other participant was assigned the Receiver role. The Sender had an option to pay $1 to reduce the Receiver’s earnings (i.e., “destroy” the Receiver’s money). If the Sender opted to pay the $1 fee, the Sender then decided how much of the Receiver’s earnings to destroy. Any whole dollar amount between $1 and $10 could be selected. The Receiver then learned the Sender’s decisions.
In the Uncertainty treatment, procedures were similar to the Baseline treatment; however, there was a one-third chance that “nature” would destroy some money (any amount between $1 and $10 was equally likely to be destroyed). Realized destruction was the maximum of the Sender’s selection and nature’s selection. The Receiver learned the amount destroyed, but not the cause of the damage.
In the Fear treatment, procedures were similar to the Baseline treatment. However, both participants in each pair were simultaneously Sender and Receiver: both participants simultaneously made their decisions to destroy after paying a fee, and each faced the threat of destruction.
In the Incentive treatment, Senders kept whatever they choose to destroy but still had to pay the $1 fee. Receivers were aware that the Sender kept whatever they destroyed.
There are several differences between our experiment and previous ones [44,45,46,47]. First, we incorporate group identity via the preference elicitation procedure, which allows us to create a natural conflict environment. Second, we consider different possible triggers of conflict, thereby identifying whether each does indeed trigger conflict. Finally, all our treatments include a destruction fee, allowing us to provide a systematic comparison between treatments.
3.2. Assessment of Emotions
To understand how conflict decisions trigger emotional reactions, we issued Watson et al.’s [48] well-established and validated PANAS (positive and negative affect scales) survey to uncover twenty emotional states of the participants post their resource allocation decision. The survey was conducted right after participants received feedback about the outcome from part three of the experiment. Of the twenty emotional states, nine are classified as positive (appreciative, happy, content, cheerful, triumphant, inspired, secure, proud, and believable) and ten are classified as negative (disgusted, jealous, aggravated, frustrated, angry, depressed, sad, embarrassed, ashamed, and guilty). The emotional state, surprise, could be either positive or negative, so we exclude it from our analysis.
Following Schniter et al. [49], we create two categorical variables corresponding to a valence positive–negative perspective of emotional reactions. Of course, more sophisticated categorization of emotions could be used, such as the one following the recalibration perspective [50,51]; for applications, see Schniter and Shields [52] and Schniter and Sheremeta [53]. However, for our purpose, the positive–negative categorization is sufficient.
3.3. Control Variables
Lastly, at the end of the experiment, we elicited various demographic information to assess their impact on conflict frequency and amount destroyed. The control variables included race, religion, level of religious activity, gender, age, level in higher education, degree major, and the number of courses taken in business and economics.
4. Results
4.1. Frequency and Intensity of Conflict
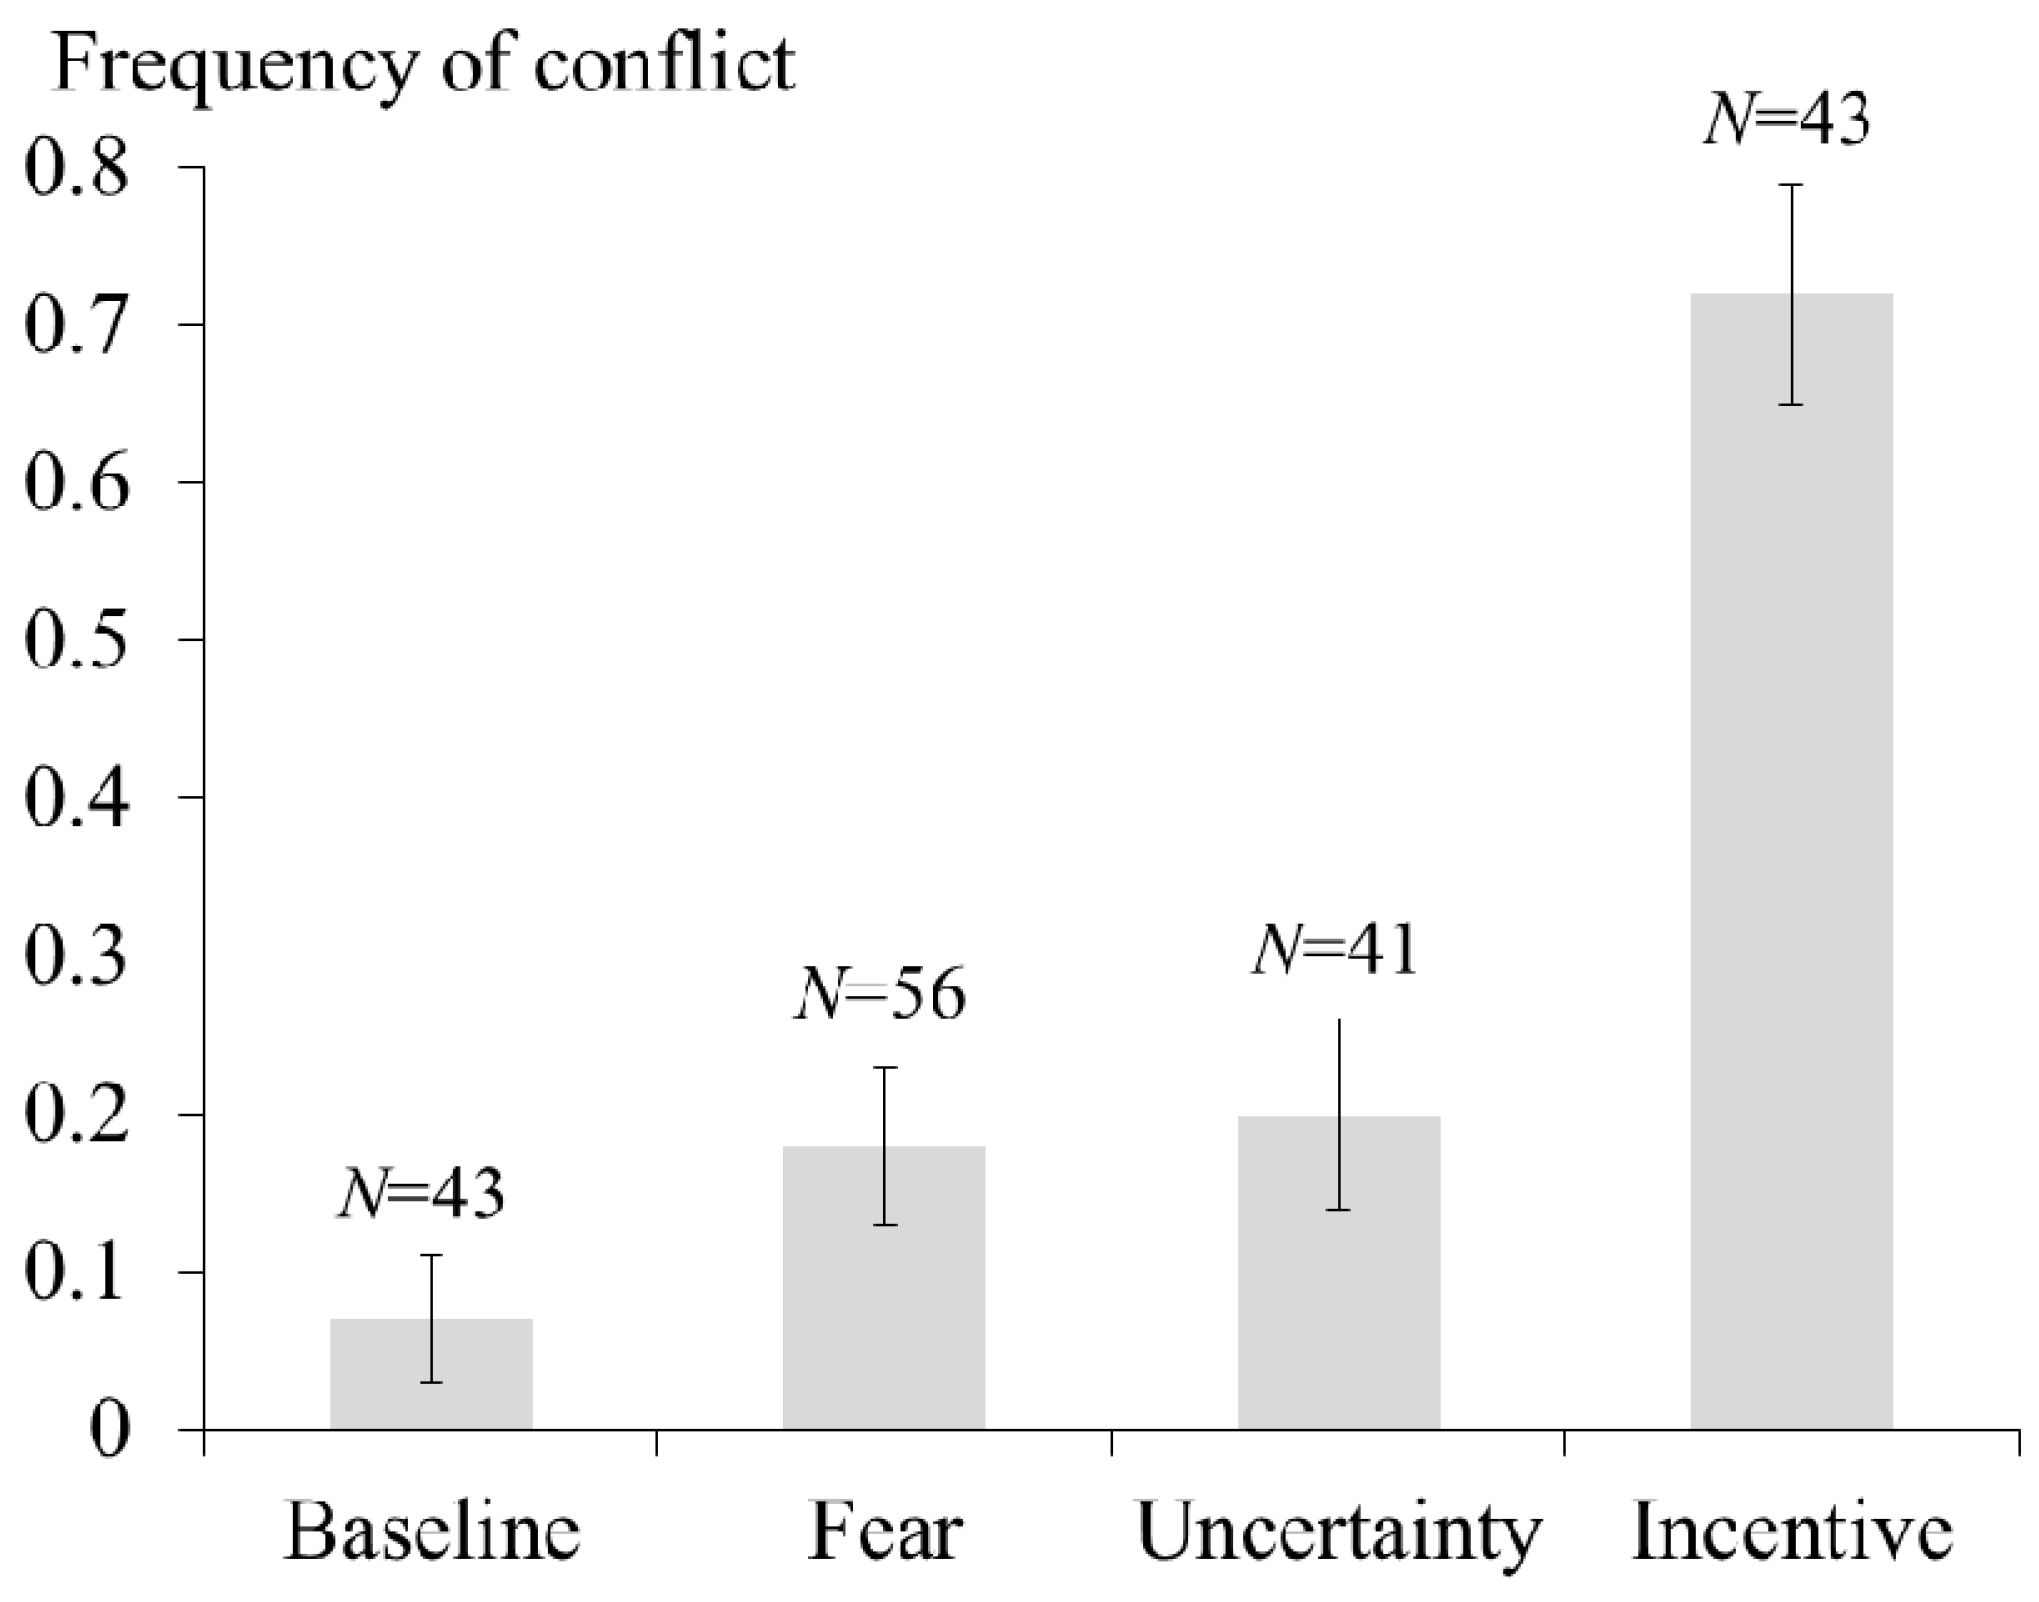
Figure 1 and the first column in Table 2 show the average frequency of conflict, measured as the frequency of destruction amount being positive, by treatment. In the Baseline treatment, the frequency of conflict is 7%, with only three out of 43 participants choosing to destroy any amount. The frequency of conflict in the Fear treatment is 18% (10/56) or 11% higher than in the Baseline treatment (z-test of proportions, p = 0.056, n1 = 43, n2 = 56). The frequency of conflict in the Uncertainty treatment is 20% (8/41), also higher (by 13%) than in the Baseline treatment (z-test of proportions, p = 0.044, n1 = 43, n2 = 41). Finally, the frequency of conflict in the Incentive treatment is 72% (31/43) and is 63% higher than in the Baseline treatment (z-test of proportions, p < 0.001, n1 = 43, n2 = 43). It is likely that the frequency of conflict is the highest in the Incentive treatment because senders get to keep whatever they choose to destroy (in other words, senders steal the spoils of conflict instead of just destroying resources).
Next, we examine the intensity of conflict. The middle column in Table 2 shows the average amount destroyed by treatment. In the Baseline treatment, the average amount destroyed is $0.44, in the Fear treatment it is $1.04, in the Uncertainty treatment it is $1.20, and in the Incentive treatment it is $4.28. When comparing against the Baseline treatment, we find that the amount destroyed is not statistically different in either the Fear treatment (Wilcoxon rank-sum test, p = 0.121, n1 = 43, n2 = 56) or the Uncertainty treatment (Wilcoxon rank-sum test, p = 0.092, n1 = 43, n2 = 41), but it is significantly higher in the Incentive treatment (Wilcoxon rank-sum test, p-value < 0.001, n1 = 43, n2 = 43). It is possible, however, that the differences in the Incentive treatment are mainly due to the differences in the frequency of conflict. Indeed, when examining the amount destroyed conditional on the destruction amount being positive (see the last column in Table 2), we find no significant difference in the average amount destroyed among the four treatments: $6.33 in the Baseline treatment, $5.80 in the Fear treatment, $6.13 in the Uncertainty treatment, and $5.94 in the Incentive treatment. Based on the Wilcoxon rank-sum test, all p-values are greater than 0.500.
In summary, consistent with the predictions from economics, social psychology, and evolutionary biology, conflicts originate when there are economic incentives (the Incentive treatment), fear (the Fear treatment) or uncertainty (the Uncertainty treatment). Also, all three triggers differently impact the frequency of conflict, but not the intensity. It is important to emphasize that direct comparison among our treatments should be done with caution, since our results could be sensitive to the specific parameters that were selected for each treatment. For example, it could be the case that the Uncertainty treatment would result in more conflict if the chance of “nature” destroying money was one-half instead of one-third. Similarly, the Incentive treatment could have resulted in less conflict if, instead of keeping all that Senders chose to destroy, they could keep only part of it.
4.2. Emotions Resulting from Conflict Decisions
Recall that right after participants engaged in a conflict and received feedback about the outcome of the conflict, we elicited their emotional responses using the PANAS (positive and negative affect scales) survey to uncover twenty emotional states of the participants. Based on these responses, we create two variables: the Positive Emotion (the average of all positive emotions, Cronbach’s α = 0.905) and Negative Emotion (the average of all negative emotions, Cronbach’s α = 0.887). Next, we examine how different triggers of conflict impact emotional reactions of participants.
Table 3 reports the estimation results of regressions by treatment in which the dependent variable is either Conflict (i.e., whether a participant chose to destroy any amount or not) or Amount Destroyed (i.e., the amount that a participant chose to destroy), and the independent variables are both Positive Emotion and Negative Emotion. When Conflict is a dependent variable, we use Probit regressions, and when Amount Destroyed is a dependent variable we use ordinary least squares (OLS) regressions.
The estimation results in Table 3 show that the frequency of conflict is negatively correlated with positive emotions and positively correlated with negative ones. Specifically, when the dependent variable is Conflict, the coefficient on Positive Emotion in all four treatments is negative and jointly significant (Wald test, p = 0.005) and the coefficient on Negative Emotion in all four treatments is positive and jointly significant (Wald test, p = 0.001). Although the relative magnitude of coefficients is different across treatments, we are hesitant to make between-treatments comparisons. The hesitancy is because our results could be sensitive to the specific parameters that were selected for each treatment. Therefore, we focus on a “general trend” of emotional reactions across treatments rather than a specific one.
Another general observation from Table 3 is that the frequency of conflict has a greater impact on negative emotions than on positive ones. When the dependent variable is Conflict, the absolute value of the coefficient on Negative Emotion is greater than on Positive Emotion in all four treatments. Moreover, jointly across treatments, this difference is significant (Wald test, p = 0.007).
Next, we examine how the intensity of conflict impacted emotional reactions. Table 3 reports that when the dependent variable is Amount Destroyed, the coefficient on Positive Emotion is negative in three treatments but it is not significant (Wald test, p = 0.910). The coefficient on Negative Emotion is negative in all four treatments and jointly significant (Wald test, p = 0.001). As with the frequency of conflict, the intensity of conflict has a greater impact on negative emotions than on positive ones. When the dependent variable is Amount Destroyed, the absolute value of the coefficient on Negative Emotion is greater than on Positive Emotion in all four treatments. Moreover, jointly across treatments, this difference is significant (Wald test, p = 0.004).
In summary, the frequency and intensity of conflict decreases positive emotions and increases negative emotions. Also, the regression estimation results point out that conflict impacts negative emotions more than positive emotions.
4.3. Effect of Demographics on Conflict Decisions
The regression analysis including our control variables is reported in Table 4. The first regression is a Probit regression in which the dependent variable is Conflict and the independent variables are treatment dummies as well as demographics. The second regression is an OLS regression in which the dependent variable is Amount Destroyed.
Controlling for demographic differences, we find that the Incentive treatment is the strongest practical predictor of destruction decisions, yielding a 54.3% increase in the likelihood of destruction (based on the estimated marginal effects) and a $4.01 increase in the average (unconditional) level of destruction. Also, we find that the Fear treatment increases the likelihood of destruction by 12.3% and the Uncertainty treatment increases it by 17.1%. The only demographic characteristic that is statistically significant at the 5% level is Age, with older participants exerting lower frequency and magnitude of conflict. However, it is important to emphasize that almost 90% of our participants are between the age of 18 and 22, making it difficult to make general conclusions about how age impacts the frequency and magnitude of conflict.
5. Conclusions
The current paper studies the three triggers of conflict from economics, social psychology, and evolutionary biology, as well as the emotional reactions people experience from those triggers. Consistent with the predictions, we find that conflict originates from all three triggers: economic incentives, fear, and uncertainty. The most frequent conflicts occur when incentives are strong; however, this is likely due to the fact that participants get to keep whatever they choose to destroy. Perhaps a more surprising finding is that the three triggers differently impact the frequency of conflict, but not the intensity. Also, we find that the frequency and intensity of conflict decrease positive emotions and increase negative emotions, and that conflict impacts negative emotions more than positive emotions.
Our findings have several implications for the disparate academic conversations about conflict. To begin, our experiments suggest that different triggers of conflict may have different kick. In our experiment, incentives mattered more than the other triggers—at least when it came to how often conflict arose and how much resources in total were destroyed. Assuming that most conflicts involve multiple triggers, the reduction of conflict in communities, organizations, governments, and nations might not be accomplished without fundamental change in the incentives faced by potential enemies.
Our second contribution is to conflict process. While our focus was on the triggers of human conflict, many other scholars are interested in its outcomes (e.g., [54]), generated emotions (e.g., [55]) and physiological effects (e.g., [56]). Our finding that incentives generate the highest frequency of conflict in a reserve dictator game gives scholars, whose research is not trigger dependent, a fertile paradigm for studying social phenomenon. Based on our results, it would seem if a scholar wants to study natural conflict in controlled setting, manipulating incentives is the way to go.
Finally, we contribute to a long-standing question of why some conflicts get out of control [57]. A potential answer is that intense conflicts decrease positive emotions and increase negative emotions. Such emotional reactions may result in physical and psychological changes aggravating individual behavior and leading to an even more severe conflict. We leave this question for future research.
An assumption of the current paper is that conflict and its elicited emotions are burdensome. Should we relax the second assumption of our earlier definition of conflict, conflict and the emotions that follow may have benefits. For example, work in economics and political science find that conflicting parties can use costly threats to eventually stabilize relationships [58,59]. Therefore, a question for future scholarship to address is what triggers are easier to recover from once conflict begins?
In scholarship on affect, emotions can be used strategically [60]. For instance, expressing anger can encourage concessions from opponents in a negotiation; but when given opportunity, those who gave the concession will look for ways to get even [61]. Thus, future scholarship may benefit from looking at how the emotions from triggered conflict change over time.
Future research may also consider the interplay among incentives, fear, and uncertainty as possible triggers of conflict (i.e., what if both incentives and fear are present or fear and uncertainty). Research should also focus on measuring sensitivity of conflict to the magnitude of incentives, fear and uncertainty (i.e., what if incentives are higher or level of fear is lower).
Lastly, the three triggers of conflict studied here are not the only ones to consider. The want for power is just one trigger that may warrant study. Agents can want power because of the monetary incentives they may provide, but some agents can want power to achieve status. Power may be particularly intriguing for future scholarship because while the want for power can trigger conflict, the chance of losing it can also motivate individuals to go to great lengths to preserve their position. Furthermore, considering that potential losses often loom larger than potential gains [62], future research may ask whether wanting power generates the same amount and type of conflict compared to wanting to preserve power.
Acknowledgments
The material herein is based upon work supported by the Army Research Office Award No. #W911NF-11-1-0332 and the Air Force Office of Scientific Research Award No. FA9550-10-1-0569 provided to McBride. We thank the Experimental Social Science Laboratory at UC Irvine for use of its facilities. Portions of the research was completed while McCarter was a John Angus Erskine Fellow at University of Canterbury. We thank the action editor and two anonymous reviewers for their comments and suggestions.
Author Contributions
M.C., M.T.C., M.W.M. and R.M.S. run the experiments, did the data analysis, wrote and revised the manuscript. All authors contributed equally to this paper.
Conflicts of Interest
The authors declare no conflict of interest.
Appendix A
Instructions
Page 1
Welcome to this experiment at UC Irvine. Thank you for participating.
You are about to participate in a study of decision-making, and you will be paid for your participation in cash, privately at the end of this session. What you earn depends on your decisions and on the decisions of others.
Please turn off your cell phone.
The entire session consists of three parts. You will receive further instructions at the beginning of each part.
All three parts will take place through the computer terminals. It is important that you do not talk with any other participants during the session.
When you are ready, please click “Continue” to go to the instructions for part 1.
Page 2
For this part of the experiment you will be asked to calculate the sum of five randomly generated two-digit numbers. You will be given 10 min to calculate the correct sum for a series of these problems. You cannot use a calculator to determine this sum; however, you are welcome to use the supplied scratch paper. You submit an answer by clicking the submit button with your mouse. When you enter an answer, the computer will immediately tell you whether your answer is correct or not and supply another summation problem. I will give notice when 30 s remain.
If you correctly solve X problems within the 10 min, you will receive $10. To guarantee that you receive $10 you have to try to solve as many problems as possible. Although you do not know the exact required number X, we can tell you that it is a very reasonable number which you can achieve.
Please press “Continue” to begin part 1.
Page 3
In Part 2, everyone will be shown 5 pairs of paintings by two artists. You will be asked to choose which painting in each pair you prefer. You will then be classified into one of two groups, based on your choices.
The participants you are grouped with will be the same for the rest of the experiment.
After Part 2 has finished, we will give you instructions for the next part of the experiment.
Please press “Continue” to begin part 2.
Page 4
In Part 3, a participant from the KLEE group will be matched with a participant from the KANDINSKY group.
One participant will be the SENDER and the other participant will be the RECEIVER.
First, the SENDER must decide whether or not to reduce the RECEIVER’s account total. Taking this action costs the SENDER $1, and allows the SENDER to choose a reduction amount between $1 and $10. If the SENDER does not take this action, there is no cost and there is no reduction in the RECEIVER’s account total.
Then, the RECEIVER leaves feedback for a future group member who will be a SENDER in the next session of this experiment.
There is no interaction between the SENDER and the RECEIVER beyond these two choices and the choices are only made once.
Please press “Continue” to begin part 3.
References
- Hobbes, T. Leviathan; Xist Publishing: Irvine, CA, USA, 2015. [Google Scholar]
- Lahr, M.M.; Rivera, F.; Power, R.K.; Mounier, A.; Copsey, B.; Crivellaro, F.; Edung, J.E.; Fernandez, J.M.M.; Kiarie, C.; Lawrence, J.; et al. Inter-group violence among early Holocene hunter-gatherers of West Turkana, Kenya. Nature 2016, 529, 394–398. [Google Scholar] [CrossRef] [PubMed]
- Harari, Y. Sapiens: A Brief History of Humankind; Vintage Press: London, UK, 2011. [Google Scholar]
- Garfinkel, M.R.; Skaperdas, S. Economics of conflict: An overview. In Handbook of Defense Economics; Garfinkel, M.R., Skaperdas, S., Eds.; Oxford University Press: New York, NY, USA, 2007; pp. 649–709. [Google Scholar]
- Tullock, G. Efficient rent seeking. In Toward a Theory of Rent-Seeking Society; Buchanan, J.M., Tollison, R.D., Tullock, G., Eds.; Texas A & M Press: College Station, TX, USA, 1980; pp. 97–112. [Google Scholar]
- Abbink, K. Laboratory experiments on conflict. In Oxford Handbook of the Economics of Peace and Conflict; Garfinkel, M.R., Skaperdas, S., Eds.; Oxford University Press: New York, NY, USA, 2012; pp. 532–556. [Google Scholar]
- Dechenaux, E.; Kovenock, D.; Sheremeta, R.M. A survey of experimental research on contests, all-pay auctions and tournaments. Exp. Econ. 2015, 18, 609–669. [Google Scholar] [CrossRef]
- Kimbrough, E.O.; Sheremeta, R.M. Side-payments and the costs of conflict. Int. J. Ind. Organ. 2013, 31, 278–286. [Google Scholar] [CrossRef]
- Kimbrough, E.O.; Sheremeta, R.M. Why can’t we be friends? Entitlements and the costs of conflict. J. Peace Res. 2014, 51, 487–500. [Google Scholar] [CrossRef]
- Sheremeta, R.M. Overbidding and heterogeneous behavior in contest experiments. J. Econ. Surv. 2013, 27, 491–514. [Google Scholar] [CrossRef]
- Sheremeta, R.M. Behavioral dimensions of contests. In Companion to Political Economy of Rent Seeking; Congleton, R.D., Hillman, A.L., Eds.; Edward Elgar: London, UK, 2015; pp. 150–164. [Google Scholar]
- Sheremeta, R.M. Impulsive Behavior in Competition: Testing Theories of Overbidding in Rent-Seeking Contests; Working Paper; Social Science Research Network (SSRN): Rochester, NY, USA, 2016. [Google Scholar]
- Collier, P.; Hoeffler, A. On economic causes of civil war. Oxf. Econ. Pap. 1998, 50, 563–573. [Google Scholar] [CrossRef]
- Prescott, W.H. History of the Conquest of Peru; Cosimo Books: New York, NY, USA, 2007. [Google Scholar]
- Khadduri, M.; Ghareeb, E. War in the Gulf, 1990–91: The Iraq-Kuwait Conflict and Its Implications; Oxford University Press: Oxford, UK, 2001. [Google Scholar]
- Brewer, M.B. The social self: On being the same and different at the same time. Personal. Soc. Psychol. Bull. 1991, 17, 475–482. [Google Scholar] [CrossRef]
- Wang, L.; Murnighan, J.K. On greed. Acad. Manag. Ann. 2011, 5, 279–316. [Google Scholar] [CrossRef]
- Deutsch, M. Trust and suspicion. J. Confl. Resolut. 1958, 2, 265–279. [Google Scholar] [CrossRef]
- Dawes, R.M. Social dilemmas. Ann. Rev. Psychol. 1980, 31, 169–193. [Google Scholar] [CrossRef]
- Hardin, G. The tragedy of the commons. Science 1968, 162, 1243–1248. [Google Scholar] [CrossRef] [PubMed]
- Hardin, G. Living on a lifeboat. BioScience 1974, 24, 561–568. [Google Scholar] [CrossRef] [PubMed]
- McCarter, M.W.; Northcraft, G.B. Happy together? Insights and implications of viewing managed supply chains as a social dilemma. J. Oper. Manag. 2007, 25, 498–511. [Google Scholar] [CrossRef]
- McCarter, M.W.; Mahoney, J.T.; Northcraft, G.B. Testing the waters: Using collective real options to manage the social dilemma of strategic alliances. Acad. Manag. Rev. 2011, 36, 621–640. [Google Scholar]
- Rapoport, A.; Eshed-Levy, D. Provision of step-level public goods: Effects of greed and fear of being gypped. Organ. Behav. Hum. Decis. Process. 1989, 44, 325–344. [Google Scholar] [CrossRef]
- De Cremer, D. Trust and fear of exploitation in a public goods dilemma. Curr. Psychol. 1999, 18, 153–164. [Google Scholar] [CrossRef]
- McCarter, M.W.; Rockmann, K.W.; Northcraft, G.B. Is it even worth it? The effect of loss prospects in the outcome distribution of a public goods dilemma. Organ. Behav. Hum. Decis. Process. 2010, 111, 1–11. [Google Scholar] [CrossRef]
- McCarter, M.W.; Samek, A.; Sheremeta, R.M. Divided loyalists or conditional cooperators? Creating consensus about cooperation in multiple simultaneous social dilemmas. Group Organ. Manag. 2014, 39, 744–771. [Google Scholar] [CrossRef]
- Schlesinger, A. Origins of the Cold War. Foreign Aff. 1967, 46, 22–52. [Google Scholar] [CrossRef]
- Smith, J.M.; Price, G.R. The logic of animal conflict. Nature 1973, 246, 15–19. [Google Scholar] [CrossRef]
- Parker, G.A. Assessment strategy and the evolution of fighting behaviour. J. Theor. Biol. 1974, 47, 223–243. [Google Scholar] [CrossRef]
- Smith, J.M.; Parker, G.A. The logic of asymmetric contests. Anim. Behav. 1976, 24, 159–175. [Google Scholar] [CrossRef]
- DeScioli, P.; Wilson, B.J. The territorial foundations of human property. Evolut. Hum. Behav. 2011, 32, 297–304. [Google Scholar] [CrossRef]
- Kimbrough, E.O.; Sheremeta, R.M.; Shields, T. When parity promotes peace: Resolving conflict between asymmetric agents. J. Econ. Behav. Organ. 2014, 99, 96–108. [Google Scholar] [CrossRef]
- Brown, W.D.; Smith, A.T.; Moskalik, B.; Gabriel, J. Aggressive contests in house crickets: Size, motivation and the information content of aggressive songs. Anim. Behav. 2006, 72, 225–233. [Google Scholar] [CrossRef]
- Hof, D.; Hazlett, N. Low-amplitude song predicts attack in a North American wood warbler. Anim. Behav. 2010, 80, 821–828. [Google Scholar] [CrossRef]
- Laidre, M.E. How often do animals lie about their intentions? An experimental test. Am. Nat. 2009, 173, 337–346. [Google Scholar] [CrossRef] [PubMed]
- Wade, J. Going berserk: Battle trance and ecstatic holy warriors in the European war magic tradition. Int. J. Transpersonal Stud. 2016, 35, 21–38. [Google Scholar]
- Gordon, R.A.; Rowe, H.L.; Pardini, D.; Loeber, R.; White, H.R.; Farrington, D.P. Serious delinquency and gang participation: Combining and specializing in drug selling, theft and violence. J. Res. Adolescence. 2014, 24, 235–251. [Google Scholar] [CrossRef] [PubMed]
- Fischbacher, U. z-Tree: Zurich toolbox for ready-made economic experiments. Exp. Econ. 2007, 10, 171–178. [Google Scholar] [CrossRef]
- Niederle, M.; Vesterlund, L. Do women shy away from competition? Do men compete too much? Q. J. Econ. 2007, 122, 1067–1101. [Google Scholar] [CrossRef]
- Cason, T.N.; Masters, W.A.; Sheremeta, R.M. Entry into winner-take-all and proportional-prize contests: An experimental study. J. Public Econ. 2010, 94, 604–611. [Google Scholar] [CrossRef]
- Price, C.R.; Sheremeta, R.M. Endowment origin, demographic effects, and individual preferences in contests. J. Econ. Manag. Strategy 2015, 24, 597–619. [Google Scholar] [CrossRef]
- Chen, Y.; Li, S.X. Group identity and social preferences. Am. Econ. Rev. 2009, 99, 431–457. [Google Scholar] [CrossRef]
- Abbink, K.; Sadrieh, A. The pleasure of being nasty. Econ. Lett. 2009, 105, 306–308. [Google Scholar] [CrossRef]
- Abbink, K.; Herrmann, B. The moral costs of nastiness. Econ. Inq. 2011, 49, 631–633. [Google Scholar] [CrossRef]
- List, J.A. On the interpretation of giving in dictator games. J. Political Econ. 2007, 115, 482–493. [Google Scholar] [CrossRef]
- Bardsley, N. Dictator game giving: Altruism or artifact? Exp. Econ. 2008, 11, 122–133. [Google Scholar] [CrossRef]
- Watson, D.; Clark, L.A.; Tellegen, A. Development and validation of brief measures of positive and negative affect: The PANAS scales. J. Personal. Soc. Psychol. 1988, 54, 1063–1070. [Google Scholar] [CrossRef]
- Schniter, E.; Sheremeta, R.M.; Shields, T.W. Conflicted emotions following trust-based interaction. J. Econ. Psychol. 2015, 51, 48–65. [Google Scholar] [CrossRef]
- Nesse, R.M. Evolutionary explanations of emotions. Hum. Nat. 1990, 1, 261–289. [Google Scholar] [CrossRef] [PubMed]
- Tooby, J.; Cosmides, L. The past explains the present: Emotional adaptations and the structure of ancestral environments. Ethol. Sociobiol. 1990, 11, 375–424. [Google Scholar] [CrossRef]
- Schniter, E.; Shields, T.W. Recalibrational emotions and the regulation of trust-based behaviors. In Psychology of Trust: New Research; Gefen, D., Ed.; Nova Science Publishers: New York, NY, USA, 2013. [Google Scholar]
- Schniter, E.; Sheremeta, R.M. Predictable and predictive emotions: Explaining cheap signals and trust re-extension. Front. Behav. Neurosci. 2014, 8, 1–18. [Google Scholar] [CrossRef] [PubMed]
- Porter, T.W.; Lilly, B.S. The effects of conflict, trust, and task commitment on project team performance. Int. J. Confl. Manag. 1996, 7, 361–376. [Google Scholar] [CrossRef]
- Lindner, E.G. Emotion and conflict: Why it is important to understand how emotions affect conflict and how conflict affects emotions. In Handbook of Conflict Resolution; Deutch, M., Coleman, P.T., Marcus, E.C., Eds.; Jossey-Bass: San Francisco, CA, USA, 2006; pp. 268–293. [Google Scholar]
- Hardy, J.D.; Smith, T.W. Cynical hostility and vulnerability to disease: Social support, life stress, and physiological response to conflict. Health Psychol. 1988, 7, 447–459. [Google Scholar] [CrossRef] [PubMed]
- Jervis, R. Perception and Misperception in International Politics; Princeton University Press: Princeton, NJ, USA, 1976. [Google Scholar]
- Schelling, T.C. The Strategy of Conflict; Harvard University Press: Cambridge, MA, USA, 1980. [Google Scholar]
- Axelrod, R.M. The Evolution of Cooperation; Basic Books: New York, NY, USA, 1981. [Google Scholar]
- Frank, R.H. Passions within Reason: The Strategic Role of Emotions; Norton: New York, NY, USA, 1988. [Google Scholar]
- Wang, L.; Northcraft, G.B.; Van Kleef, G.A. Beyond negotiated outcomes: The hidden costs of anger expression in dyadic negotiation. Organ. Behav. Hum. Decis. Process. 2012, 119, 54–63. [Google Scholar] [CrossRef]
- Kahneman, D.; Tversky, A. Prospect theory: An analysis of decision under risk. Econometrica 1979, 47, 263–291. [Google Scholar] [CrossRef]
Figure 1.
Frequency of conflict.

Table 1.
Summary of treatments.
| Treatment | Description of Treatment | Number of Participants | Number of Independent Observations |
|---|---|---|---|
| Baseline | Sender can pay $1 to destroy between $1 and $10 | 86 | 43 |
| Fear | Both Sender and Receiver can destroy money | 56 | 56 |
| Information | There is a chance that Nature destroys some money | 82 | 41 |
| Incentive | Sender gets to keep whatever he/she chooses to destroy | 86 | 43 |
Table 2.
The average frequency of conflict and amount of destruction by treatment.
| Treatment | Frequency of Conflict | Amount Destroyed | Amount Destroyed Under Conflict | |||
|---|---|---|---|---|---|---|
| Mean | N | Mean | N | Mean | N | |
| Baseline | 0.07 (0.04) | 43 | $0.44 (0.27) | 43 | $6.33 (1.86) | 3 |
| Fear | 0.18 (0.05) | 56 | $1.04 (0.36) | 56 | $5.80 (1.14) | 10 |
| Uncertainty | 0.20 (0.06) | 41 | $1.20 (0.45) | 41 | $6.13 (1.23) | 8 |
| Incentive | 0.72 (0.07) | 43 | $4.28 (0.58) | 43 | $5.94 (0.57) | 31 |
Note: Standard error of the mean is in the parenthesis. Amount destroyed under conflict is calculated by using only those observations that resulted in a positive amount of destruction.
Table 3.
Conflict decisions and emotional reactions.
| Treatment | Baseline | Fear | Uncertainty | Incentive |
|---|---|---|---|---|
| Conflict | ||||
| Positive Emotion | −1.07 *** | −0.09 | −0.17 | −0.10 |
| (the average of all positive emotions) | (0.35) | (0.21) | (0.22) | (0.24) |
| Negative Emotion | 1.73 *** | 0.57 ** | 0.12 | 5.81 ** |
| (the average of all negative emotions) | (0.56) | (0.29) | (0.37) | (2.43) |
| Constant | −1.42 | −1.62 * | −0.64 | −5.88 ** |
| (constant term) | (0.94) | (0.96) | (0.83) | (2.66) |
| Amount Destroyed | ||||
| Positive Emotion | −0.40 | 0.36 | −0.03 | −0.02 |
| (the average of all positive emotions) | (0.32) | (0.27) | (0.38) | (0.56) |
| Negative Emotion | 1.18 | 1.48 ** | 0.73 | 3.41 *** |
| (the average of all negative emotions) | (0.86) | (0.71) | (1.07) | (1.11) |
| Constant | 0.19 | −2.21 | 0.33 | −0.33 |
| (constant term) | (1.63) | (1.41) | (1.90) | (2.30) |
Note: * significant at 10%, ** significant at 5%, *** significant at 1%. Robust standard error of the mean is in the parenthesis. When Conflict is a dependent variable, we use Probit regressions, and when Amount Destroyed is a dependent variable we use ordinary least squares (OLS) regressions.
Table 4.
Conflict decisions and demographics.
| Conflict | Amount Destroyed | |
|---|---|---|
| Fear | 0.52 | 0.57 |
| (1 if Fear treatment) | (0.36) | (0.44) |
| Uncertainty | 0.73 ** | 0.81 |
| (1 if Uncertainty treatment) | (0.38) | (0.59) |
| Incentive | 2.31 *** | 4.01 *** |
| (1 if Incentive treatment) | (0.37) | (0.62) |
| Male | −0.34 | −0.50 |
| (1 if participant is male) | (0.26) | (0.47) |
| Age | −0.13 * | −0.19 ** |
| (age of participant) | (0.07) | (0.09) |
| School Years | 0.03 | 0.12 |
| (years in college) | (0.14) | (0.21) |
| Business Econ | −0.12 | 0.19 |
| (1 if business or econ major) | (0.41) | (0.76) |
| Business Econ Classes | 0.01 | 0.00 |
| (number of business or econ classes) | (0.03) | (0.04) |
| Caucasian | −0.40 | −0.99 * |
| (1 if participant is Caucasian) | (0.42) | (0.59) |
| Religion | −0.06 | −0.27 |
| (how religious is participant) | (0.11) | (0.22) |
| Christian | −0.37 | −0.05 |
| (1 if participant is Christian) | (0.28) | (0.55) |
| Muslim | 0.38 | 1.46 |
| (1 if participant is Muslim) | (0.52) | (0.98) |
| Constant | 1.49 | 4.83 ** |
| (constant term) | (1.39) | (1.91) |
Note: * significant at 10%, ** significant at 5%, *** significant at 1%. Robust standard error of the mean is in the parenthesis. When Conflict is a dependent variable, we use Probit regressions, and when Amount Destroyed is a dependent variable, we use OLS regressions.
© 2017 by the authors. Licensee MDPI, Basel, Switzerland. This article is an open access article distributed under the terms and conditions of the Creative Commons Attribution (CC BY) license (http://creativecommons.org/licenses/by/4.0/).
Share and Cite
MDPI and ACS Style
Caldara, M.; McBride, M.T.; McCarter, M.W.; Sheremeta, R.M. A Study of the Triggers of Conflict and Emotional Reactions. Games 2017, 8, 21. https://doi.org/10.3390/g8020021
AMA Style
Caldara M, McBride MT, McCarter MW, Sheremeta RM. A Study of the Triggers of Conflict and Emotional Reactions. Games. 2017; 8(2):21. https://doi.org/10.3390/g8020021
Chicago/Turabian StyleCaldara, Michael, Michael T. McBride, Matthew W. McCarter, and Roman M. Sheremeta. 2017. "A Study of the Triggers of Conflict and Emotional Reactions" Games 8, no. 2: 21. https://doi.org/10.3390/g8020021
Note that from the first issue of 2016, this journal uses article numbers instead of page numbers. See further details here.