Conditional Cooperation and Framing Effects

Division of Social Science, New York University Abu Dhabi, P.O. Box 129188 Abu Dhabi, United Arab Emirates
Games 2018, 9(2), 37; https://doi.org/10.3390/g9020037
Submission received: 23 April 2018
/
Revised: 6 June 2018
/
Accepted: 7 June 2018
/
Published: 11 June 2018
(This article belongs to the Special Issue Public Good Games)
Abstract
:This paper presents evidence from a lab experiment investigating whether the preeminence of conditional cooperators in studies using the method of Fischbacher, Gächter and Fehr (2001, Economics Letters) is sensitive to changes in the experimental frame. The treatments vary the framing such that the salience of conditionality to subjects is reduced. The results show that these manipulations affect the distribution of elicited types. However, there is no evidence that the framing of Fischbacher et al. overestimates the fraction of conditional cooperators compared to the other frames considered in the experiment. Furthermore, this research finds that conditional contributions elicited using the Fischbacher et al. (2001) frame are the most consistent with contributions in a one-shot public good game.
1. Introduction
Motivated by the observation that “people cooperate much more than predicted by standard economic theory assuming rational and selfish individuals”, Fischbacher, Gächter and Fehr (2001, p. 397, henceforth FGF) [1], in a seminal paper, posed the following question: Are people conditionally cooperative? That is, are they willing to cooperate with others if others cooperate? To answer it, they introduced a method for eliciting participants’ strategy profiles in an incentive-compatible way, using a variant of the linear public good game. As part of this method, subjects were presented with a “contribution table” and were asked to complete it by stating how much they would contribute towards the public good as the average contribution of others in their group increased. The results obtained indicate that only a third of their subjects could be classified as “selfish”. Most subjects (50%) had contribution profiles that were (weakly) monotonic and increasing in the contribution of others and were thus best described as “conditional cooperators”. The predominance of conditional cooperators using the FGF method has been documented in several studies, in different countries and cultures, since then (e.g., Cherry, McEvoy and Sælen, 2017 [2]; Kocher et al. 2008 [3]; and Fischbacher, Gächter and Quercia, 2012 [4], for a review).1
This paper presents the results from a lab experiment exploring whether the extent of conditional cooperation in the existing studies is sensitive to changes in the experimental frame. A notable feature of the FGF method is that the possible contributions of others are presented in a table: (i) simultaneously; and (ii) in an ascending order (see Appendix A). This (double) ordering arguably increases the salience of conditionality. In his essay on experimenter demand effects, Zizzo (2010, p. 85) [8] argued that the FGF method could overestimate the fraction of conditional cooperators in their sample by making subjects “think that conditionality was important”. Although Zizzo (2010) [8] focused primarily on the possibility that the strategy method “may have clued in subjects that the experiment was about conditionality”, a similar argument could be made about the ordering of others’ contributions. That is, the “ordered” frame could suggest to subjects that they are expected to increase their contribution in proportion to others.2 Knowing whether framing can affect the estimated fraction of conditional cooperators is potentially important as it could imply that previous studies may have overestimated the extent to which conditional cooperation can account for contributions in finitely repeated (e.g., Fischbacher and Gächter, 2010 [10]; Gächter, Kölle and Quercia 2017) [11] and one-shot public good games (e.g., Fischbacher, Gächter and Quercia, 2012 [4]).3
The experimental treatments differ in the way the contribution table is presented with the intention of manipulating the salience of conditionality.4 Since changes in the presentation of the contribution table do not affect material incentives in the game, the experiment constitutes a test of framing effects.5 The three treatments, in particular, evaluate the impact of simultaneity and ordering of the average contributions of others using a between-subject design. The ORDERED treatment uses the same frame as FGF. Behavior in this treatment is compared to that in the CONTROL treatment where all possible contributions of others are presented simultaneously in a table, but in a random order. Finally, in the SEQUENTIAL treatment, the possible contributions of the other group members are presented in the same random order as in the CONTROL treatment, but sequentially, i.e., one by one.6
The random and sequential orderings of others’ contributions are expected to reduce the salience of conditionality and, if anything, reduce the fraction of conditional cooperators. At the same time, they could increase the level of noise in the elicited contribution profiles (e.g., Lévy-Garboua et al., 2012 [20]). Previous studies have shown that the elicited conditional contributions can help explain contributions in finitely repeated (e.g., Fischbacher and Gächter, 2010 [10]; Gächter, Kölle and Quercia 2017 [11]) and one-shot public good games (e.g., Fischbacher, Gächter and Quercia, 2012 [4]). An increase in the level of noise could therefore reduce the consistency between conditional contributions and contributions in the one-shot public good game, i.e., the correlation between them and contributions in the one-shot game after controlling for beliefs.
2. The Experiment
The experiment consisted of two parts. The existence of the two parts was common knowledge, as was the fact that participants would not be informed about the content of the second part before the first part has been completed, and that feedback about outcomes would be provided only at the end of the experiment to avoid spillover effects across parts. Incentives were the same in the two parts. In the first part, participants’ contribution schedules were elicited using variants of the FGF strategy method. In the second part, participants played a one-shot public good game using the direct-response method. The experiment consisted of three treatments. The treatment manipulation occured only in the first part of the experiment. The second part was identical across treatments.
This section begins by presenting the basic public-good game. This is followed by a detailed presentation of the two parts and the experimental treatments. The section concludes with a discussion of the experimental procedures.
2.1. The Public Good Game
Participants were randomly divided into groups of three players. Each group member was given an endowment of 20 tokens and had to decide how to divide them between a private and a public account. The payoff function for each group member i is:
where is the contribution of individual i to the public account. The marginal per-capita return of the public account is 0.5, i.e., contributing 1 token to the public account yields a private return of 0.5, but a group return of 1.5. This creates a tension between private and group interest.7 In addition, participants were asked to state their beliefs about the average contribution of the other two group members. To incentivize participants to truthfully reveal their beliefs, they were told that they would receive 3 tokens for stating a belief that exactly matches the average contribution of the other two group members, . If their belief was within of , they would receive 2 tokens. If their estimate was within of , they would receive 1 token. Otherwise, they would not receive any additional tokens.
2.2. The FGF Method and the Experimental Treatments
In the first part of the experiment, my research employed the method of Fischbacher, Gächter and Fehr (2001) [1] for eliciting contribution schedules in the public-good game. Participants were randomly matched to form an anonymous group of three players and told that they would have to make three kinds of decisions. First, they had to decide on an unconditional contribution to the public account. Second, they had to decide how much they would contribute for each possible average (rounded) contribution of the other two members in their group . I refer to this set of 21 decisions as the contribution profiles or contribution schedules. Third, they had to estimate the (rounded) average unconditional contribution of the other two group members.
All decisions were incentive compatible. After all participants made their decisions, two subjects in each group were randomly selected and their unconditional contribution was the one relevant for determining their contribution to the public account. For the third subject, the contribution profile determined their contribution to the public account. In particular, their contribution was chosen based on their contribution profile and the average unconditional contribution of the other two group members. Beliefs for this part were incentivized in the same way described in the previous subsection.
As mentioned, the three treatments differed only with regards to the way in which the contribution table was presented. In the CONTROL treatment, the possible contributions of the other group members were presented simultaneously in a contribution table, but in a random order. In the ORDERED treatment, all possible contributions by the other group members were presented simultaneously in a table, in an ascending order. That is, the ORDERED treatment used the same frame as FGF. In the SEQUENTIAL treatment, the ordering of others’ contributions was the same as in the CONTROL treatment, but others’ contributions were presented sequentially, in 21 successive screens. Importantly, in all treatments, subjects knew in advance all the choices they would be asked to make in this part of the experiment.
2.3. The One-Shot Public-Good Game
In the second part of the experiment, participants were informed that they would be placed in a new group and that they would play a one-shot public-good game. The one-shot game allowed for the analysis of players’ responses in an environment where, as in Part 1, subjects had no strategic incentives to contribute, as the game is played only once. To avoid choices in the first part from affecting decisions in the second part, participants did not receive feedback about the outcomes of the first part until the end of the experiment.
Although the two games Were strategically different, as the FGF method removes the uncertainty about others’ contributions, transforming essentially the game from a simultaneous to a sequential one (e.g., Cartwright and Patel, 2010 [23]), if conditional cooperation is the result of social preferences, one would expect a correlation of choices across a range of social dilemmas (e.g., Dariel and Nikiforakis, 2014 [24]). That is, one would expect conditional cooperators to (weakly) contribute more in both the “contribution table” and in the one-shot game than subjects classified as selfish after controlling for beliefs.8 For this reason, this research also elicited individuals’ beliefs about the average contribution of the other group members in the second part. Of course, it is possible that the strategy method of FGF may induce different behaviors than in the one-shot game by placing subjects in a “cold” state, but the evidence in support of such an effect is mixed (Brandts and Charness, 2011 [26]).
2.4. Procedures
The experiment was conducted at the University of Zurich using Z-tree (Fischbacher, 2007, [27]). Three sessions were run for each treatment with a total of 96 participants (30 in CONTROL, 33 in ORDERED, and 33 in SEQUENTIAL). Each subject participated only in one experimental treatment. At the beginning of each session, participants were randomly allocated to a closed cubicle, where they could make their decisions in complete anonymity from the other participants. Sessions lasted on average 60 min and participants earned 30 CHF on average.
The experimental instructions were adopted from FGF and given to subjects on paper. Instructions for Part 1 were handed out first. Participants were informed that there would be a second part to the experiment, but they had no prior knowledge of what the content of these part would be. Instructions for the second part were not handed out until the end of the first part. In the instructions, the contribution table was presented and explained in the CONTROL and ORDERED treatments. In the SEQUENTIAL treatment, participants were informed about all the choices they would have to make and shown two screens as examples. After participants had read the instructions, they had to answer control questions which tested their understanding of the experiment. It was common knowledge that the experiment would not start until all participants had answered correctly these questions. At the end of the experiment, the total amount of tokens earned by participants was converted to Swiss francs at the rate of 1 token = 0.6 CHF for both parts.
3. Results
The discussion of the data is divided into three sections, one for each of the hypotheses regarding the impact of framing: (i) on the preeminence of conditional cooperators (Section 3.1); () on the levels of noise in the contributions schedules (Section 3.2); and () on the consistency between contribution schedules and one-shot contributions. Additional statistics from the experiment can be found in Appendix B.
3.1. Distribution of Types
I used the contribution profiles of participants to classify them into behavioral types, following the same criteria as FGF. In particular, “conditional cooperators” are subjects who either have a weakly monotonic contribution profile with at least one increase or have a positive Spearman rank correlation that is significant at the 1%-level. “Free-riders” are subjects who always contribute 0, irrespective of the contribution of others. “Triangle contributors” are subjects who have a significantly increasing scheme up to some maximum and a significant decreasing scheme thereafter. Finally, subjects who do not fit in one of the categories above are classified as “others”.
Result 1:
The distribution of types is significantly different between the SEQUENTIAL frame and the CONTROL treatment. There is no difference between the ORDERED and CONTROL treatments.
SUPPORT: Table 1 presents the results of the classification by treatment. While the distribution of types appears to be similar in CONTROL and ORDERED, it is noticeably different in SEQUENTIAL. Only 3% of the sample (one subject) can be classified as selfish in SEQUENTIAL, compared to 36.4% in ORDERED, and 30% in CONTROL. Similarly, 43% of individuals are classified as conditional cooperators in the CONTROL, 39.4% in ORDERED, and 78.8% in SEQUENTIAL. A Chi-square test rejects the hypothesis that the distribution of types is the same in the CONTROL and SEQUENTIAL treatments (p-value = 0.005). The difference between ORDERED and CONTROL is not statistically significant (p-value = 0.895).
Result 1 shows that there is no evidence from the experiment supporting the hypothesis that the FGF frame overestimates the fraction of conditional cooperators relative to the frames considered. If anything, in the SEQUENTIAL treatment, there is evidence that the FGF method may be underestimating the extent of free riders.9 Overall, it appears that the simultaneous presentation of others’ choices has a pronounced effect on the distribution of types, while the ascending ordering does not. This is also reflected in the results of linear regressions with individual random effects. Regressing the conditional contribution on the average contribution of others, I find that the slope of the conditional contribution is 0.209 higher in SEQUENTIAL than in CONTROL (p-value < 0.001). The difference in slopes between CONTROL and ORDERED is smaller (0.052) and not significant at the conventional statistical levels (p-value = 0.101). See Appendix C for a figure showing the average conditional contribution by treatment.
3.2. Non-Monotonic Contribution Profiles
All studies using the FGF method for eliciting contribution profiles find a non-trivial fraction of individuals with non-monotonic contribution schedules. FGF, for instance, found 13 of the 44 subjects (29.5%) had such contribution profiles. As mentioned, there are reasons to expect that there may be more (less) non-monotonic contribution schedules in the SEQUENTIAL (ORDERED) treatment compared to the CONTROL treatment.
Let denote the average contribution of one’s group members, and the contribution of individual i given the average contribution of his peers. A contribution schedule is weakly monotonic if for all , or . A contribution profile that does not satisfy either of these conditions is non-monotonic.10 The individual contribution profiles can be seen in Appendix D.
Result 2:
Relative to the CONTROL, the fraction of individuals with non-monotonic contribution profiles is substantially higher in SEQUENTIAL, and lower in ORDERED.
SUPPORT: The fraction of participants with a non-monotonic contribution schedule is 50.0% in CONTROL, 30.3% in ORDERED, and 87.9% in SEQUENTIAL. A Fisher’s-exact test using each individual as an independent observation indicates that the rate of non-monotonic contribution schedules is significantly higher in SEQUENTIAL than in CONTROL (p-value < 0.001) and ORDERED (p-value < 0.001). While the rate is higher in CONTROL than in ORDERED, the overall difference fails to be significant at a conventional level (p-value = 0.129). Besides, the proportion of conditional cooperators with non-monotonic schedules is significantly lower in ORDERED (23%) than in CONTROL (61.5%, p-value = 0.018, Fisher’s-exact), and also higher in SEQUENTIAL (92%, p-value = 0.03).11
3.3. Comparing Contribution Schedules and One-Shot Contributions
Recall that participants were asked to state how much they believed their peers would contribute on average in the one-shot game. Following Fischbacher, Gächter and Quercia (2012) [4], I used this belief and the contribution schedule to obtain a prediction about how much an individual would contribute in the one-shot game. I then compared this prediction to the actual contribution. My aim was to explore which frames elicit conditional contributions in the first part that are more consistent with behavior in the second part on aggregate. As some categories (e.g., selfish in SEQUENTIAL) have too few observations for a meaningful analysis, I did not compare the consistency of individual types across the two experimental parts.
Result 3:
On average, contribution schedules are accurate predictors of contributions in the one-shot game only in the ORDERED treatment.
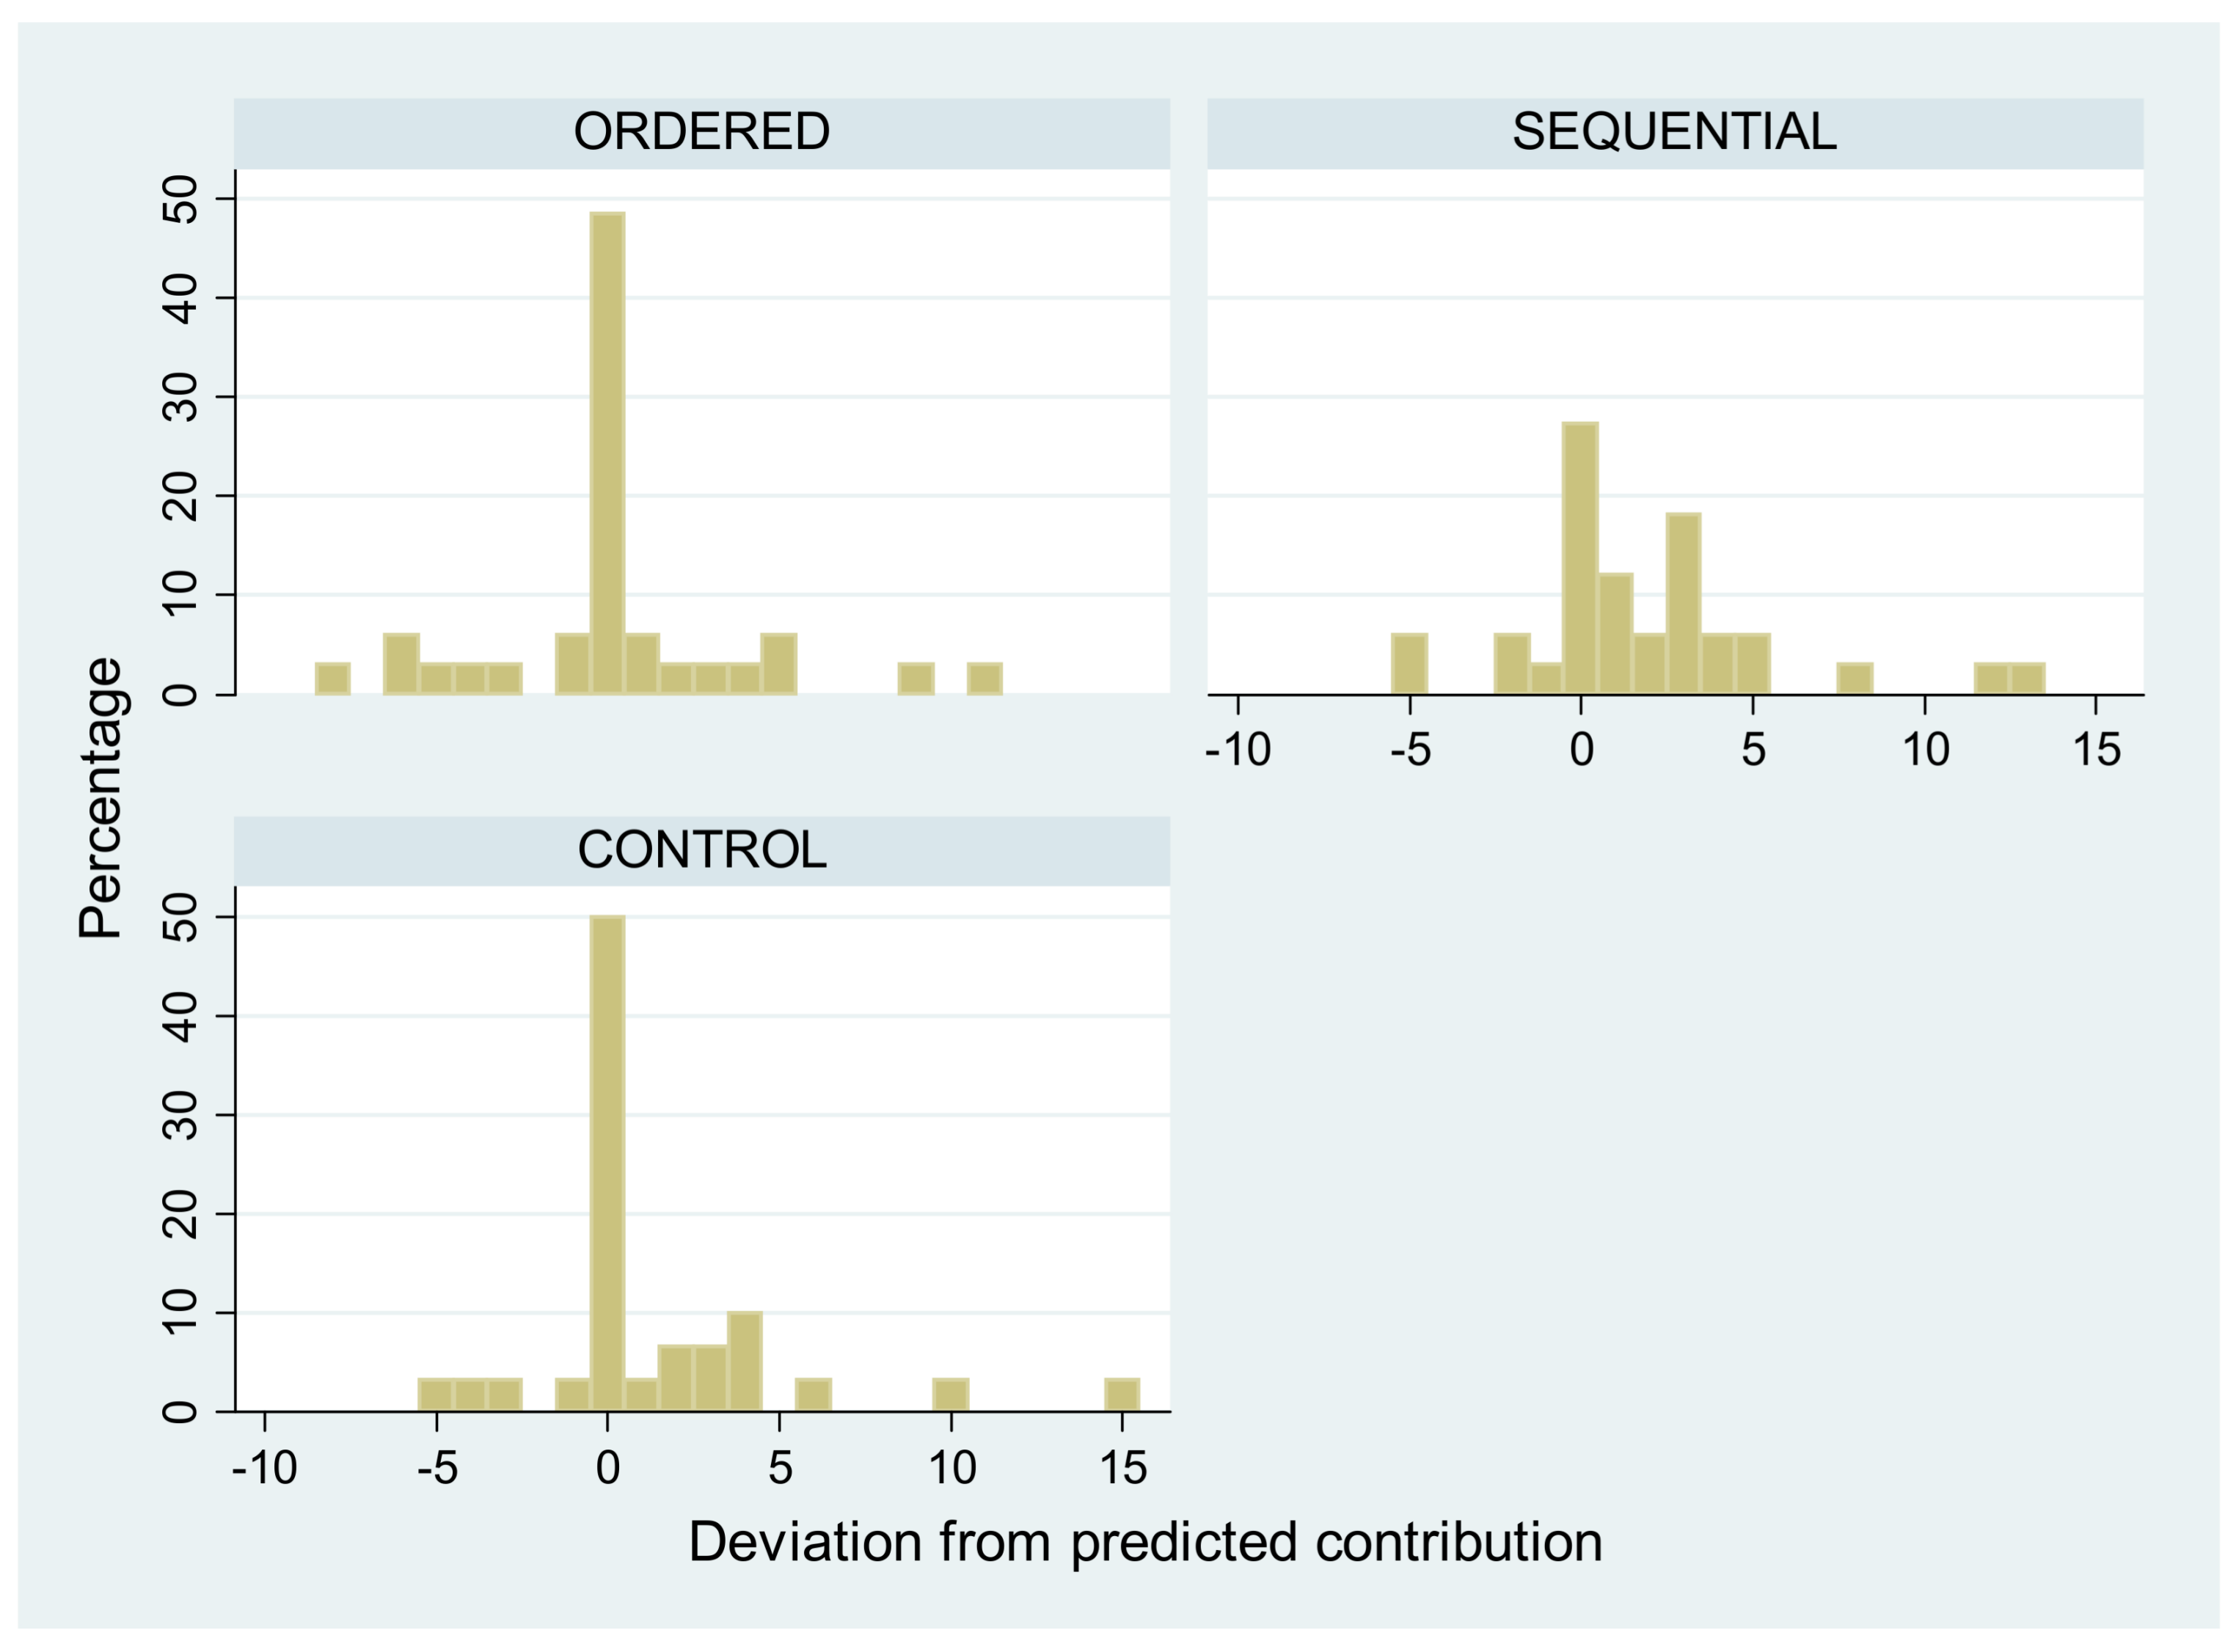
SUPPORT: Let Deviation be the difference between a subject’s actual and predicted contribution. Figure 1 presents the distribution of Deviation in each treatment. As can be easily seen, relative to the CONTROL treatment, more subjects deviate from the predicted contribution in the SEQUENTIAL treatment, and fewer in the ORDERED treatment. The average deviation is 1.4 tokens in CONTROL, 1.8 tokens in SEQUENTIAL and 0.2 in the ORDERED. A two-tailed Wilcoxon signed-rank test using each individual as an independent observation indicates that the deviation is not significantly different from 0 in the ORDERED condition (p-value = 0.827), but it is in the CONTROL (p-value = 0.065) and in the SEQUENTIAL treatment (p-value = 0.005).12
While the average deviation from the predicted contribution is an obvious way to evaluate the predictive power of the contribution schedules, it masks the fact that the schedules predict perfectly the contribution of nearly 50 percent of subjects in the CONTROL and ORDERED treatments. The data in Figure 1 suggest that the relative efficacy of the schedules in ORDERED is due to the roughly equal number of positive and negative deviations from the predicted contribution. In line with this are the results from a simple Probit regression, in which the dependent variable takes the value of 1 if Deviation and 0 if Deviation and the regressors are treatment dummies for SEQUENTIAL and ORDERED. The probability of deviating from the predicted contribution is estimated to be 22.6% higher in SEQUENTIAL than in CONTROL (p-value = 0.050). The difference between CONTROL and ORDERED is small (1.5%) and statistically insignificant (p-value = 0.904).
4. Discussion
The experiment in this paper was designed to investigate whether the high fraction of conditional cooperators in Fischbacher, Gächter and Fehr (2001 [1]; FGF) was partly due to the particular framing employed by the authors making conditionality salient to subjects. The treatments varied two factors that one might expect to make conditionality salient. The results show that these manipulations in the framing affect both the distribution of elicited types and the predictive power of the contribution schedules. However, the results do not show any evidence that the FGF frame overestimates the fraction of conditional cooperators relative to the other frames in the experiment. Furthermore, contribution profiles elicited using the FGF frame were more accurate at predicting behavior in a subsequent one-shot public good game partly due to the low level of noise in them.
While the data patterns in ORDERED and CONTROL are similar to those in FGF suggesting that the ordering of others’ contributions is not affecting choices (though it does affect noise in the contribution schedules), this is not the case under the SEQUENTIAL frame. Even though the subjects knew in advance the decisions they would be called to make (which implies that they could devise strategies ex ante), there was a substantially higher fraction of conditional cooperators and a much smaller fraction of free riders in this treatment. A possible explanation for the lower fraction of selfish subjects in SEQUENTIAL is that submitting 21 consecutive decisions with a zero contribution to the public account may be more damaging for one’s self image, than submitting once a decision to contribute zero irrespective of what the others do. Such concerns would be consistent with “conscience accounting” (Gneezy et al., 2014, [28]). This explanation can be tested in future research.
Funding
The APC was funded by institutions through the Knowledge Unlatched initiative.
Acknowledgments
I am grateful to Nikos Nikiforakis, Arno Riedl, and Urs Fischbacher for comments and the participants of the NYU Global Network Experimental Social Sciences Workshop. The research in this paper was supported by the Swiss National Fund (SNF) under grant 100014-126954.
Conflicts of Interest
The author declares no conflict of interest.
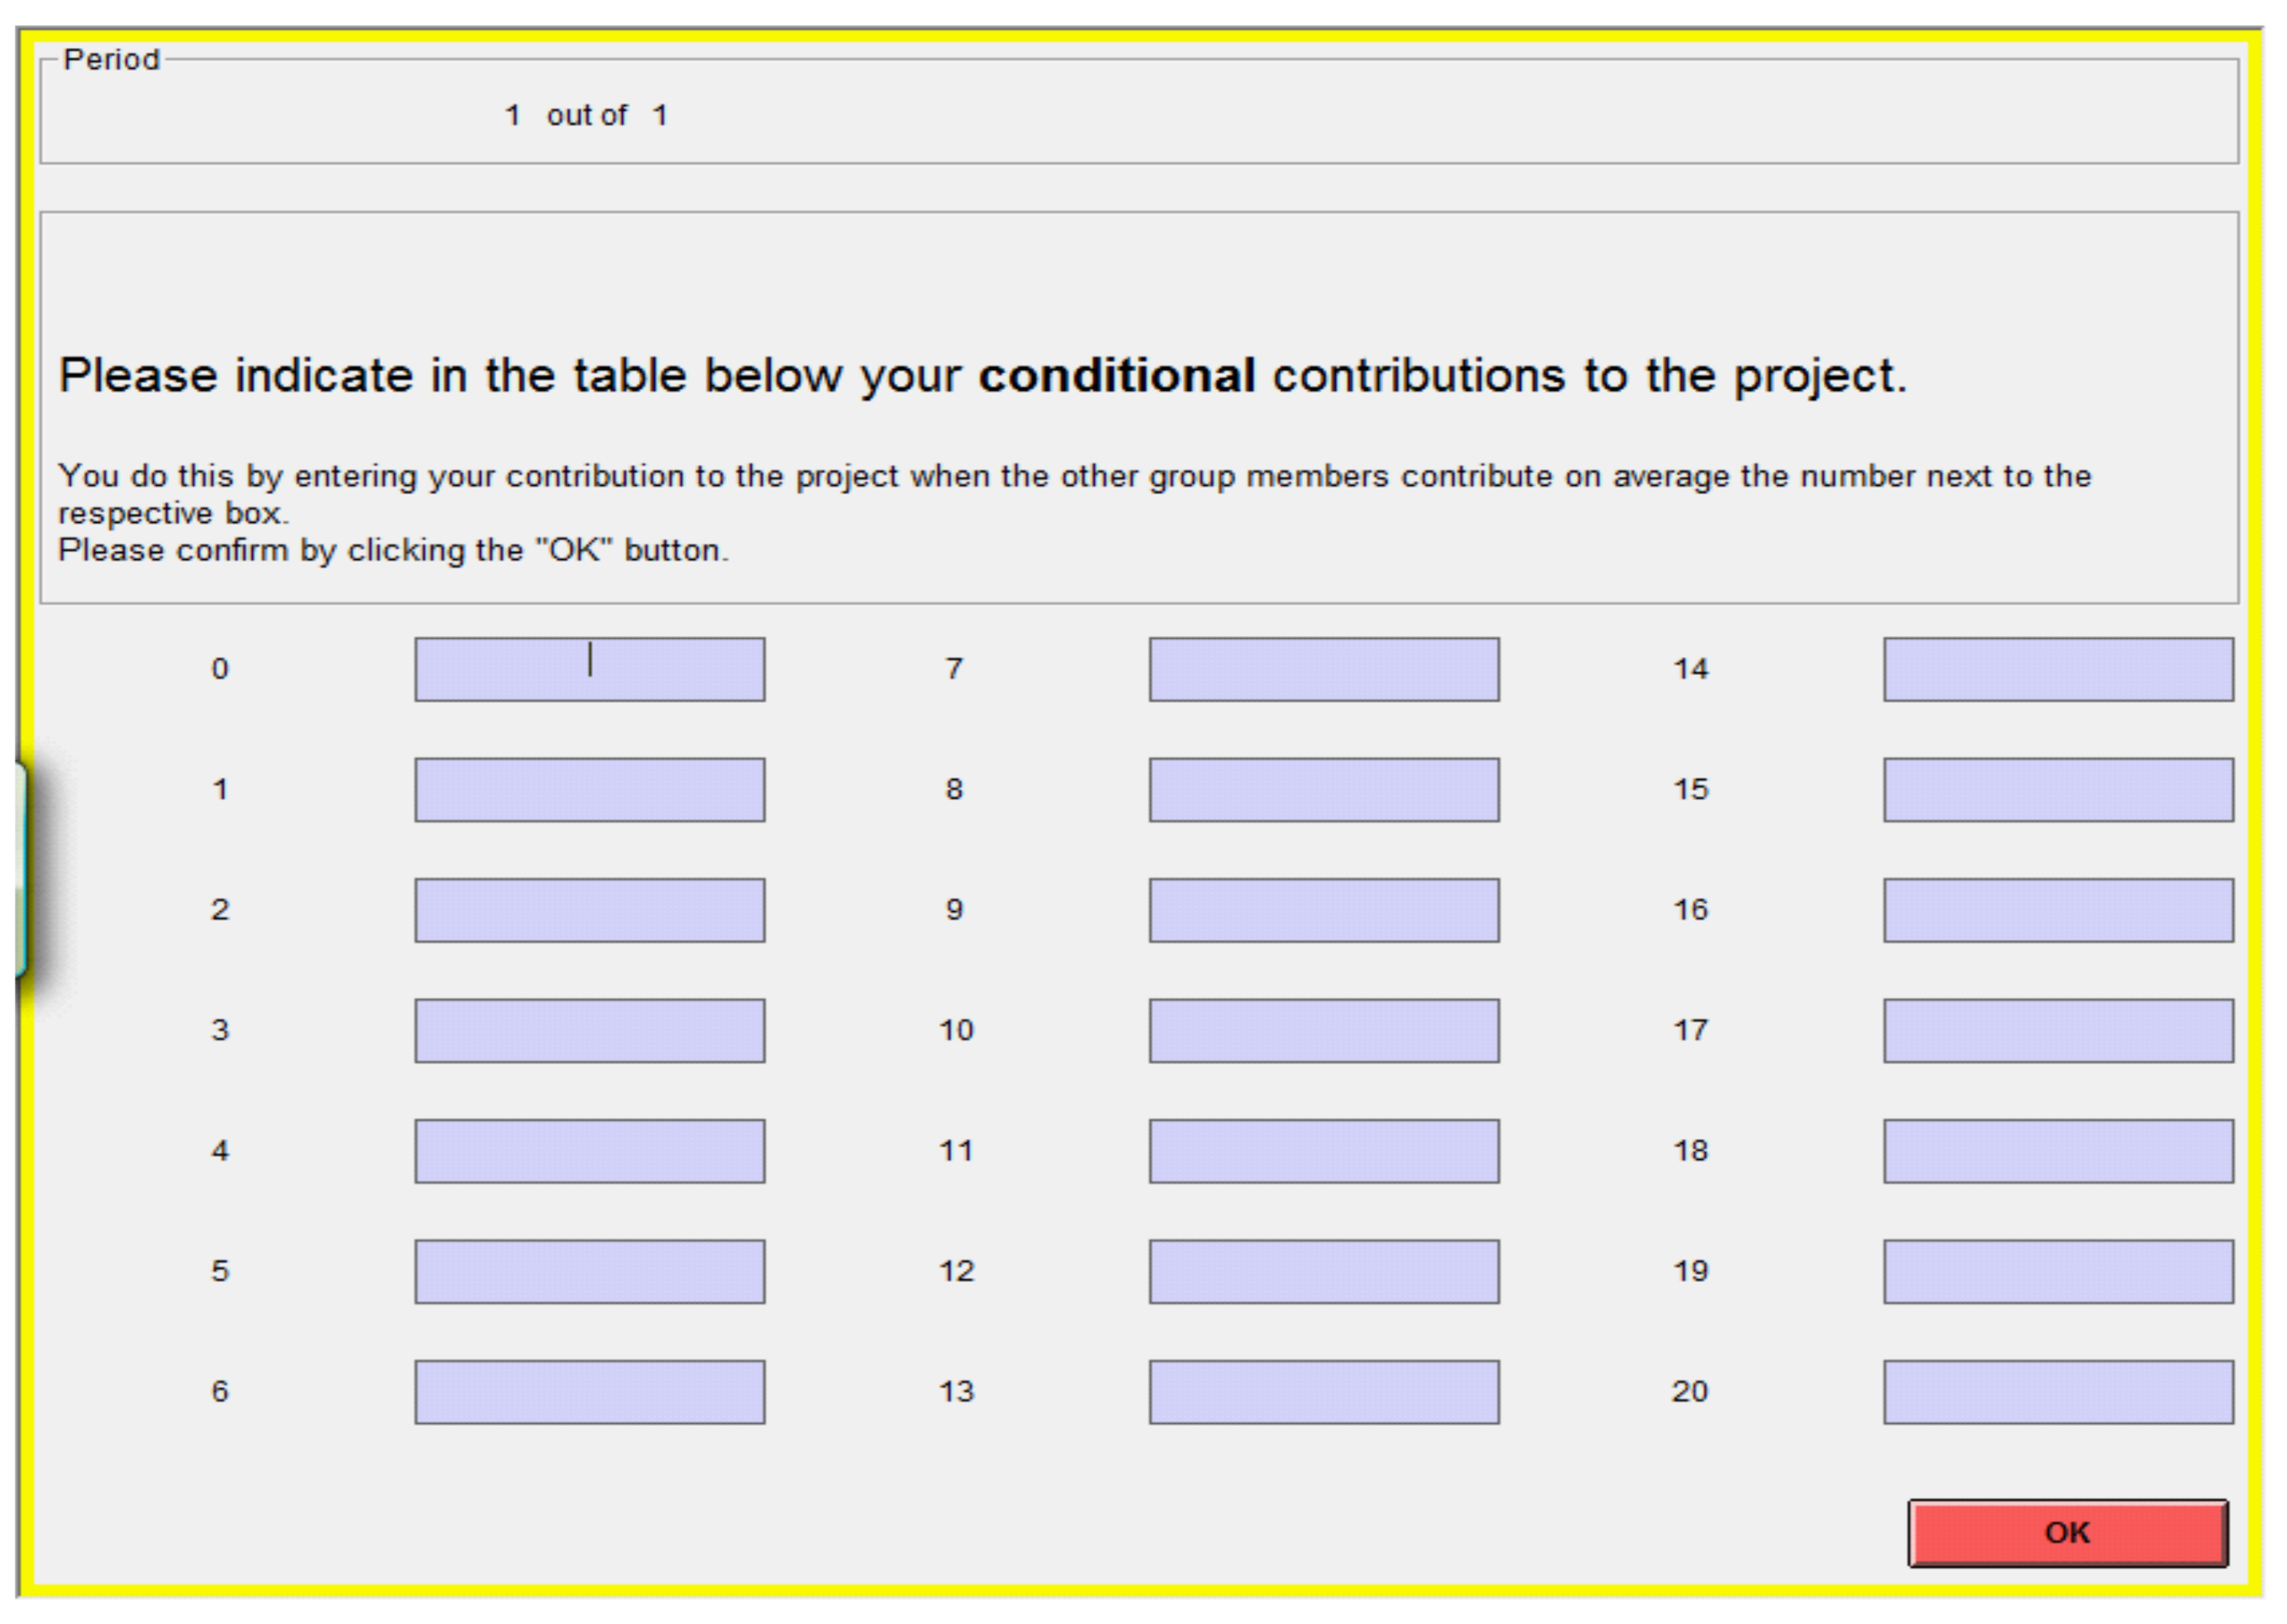
Appendix A Screenshot of the Contribution Table
Figure A1.
Contribution table in the ORDERED treatment (same as in FGF).

Appendix B Additional Statistics
This section reports additional statistics from the experiment. Table A1 presents the mean beliefs and contributions in the two parts of the experiment separately for each treatment. In the first part of the experiment, the average unconditional contribution is 6.2 (CONTROL), 4.4 (ORDERED), and 6.6 (SEQUENTIAL). A Kruskal–Wallis test fails to reject the hypothesis that subjects’ unconditional contributions are the same across treatments in the first part of the experiment (p-value = 0.141). The average belief regarding others’ average (unconditional) contribution in the same part is 7.2 (CONTROL), 5.0 (ORDERED), and 8.0 (SEQUENTIAL). A Kruskal–Wallis test rejects the hypothesis that beliefs are the same across treatments (p-value = 0.041). Using a two-tailed Mann–Whitney test with each individual as an independent observation, the difference between CONTROL and ORDERED is marginally statistically significant (p-value = 0.10), while that between CONTROL and SEQUENTIAL is not (p-value = 0.6265). In the second part of the experiment, a Kruskal–Wallis test fails to reject the hypothesis that subjects’ beliefs (6.03, 5.81, and 6.72 in CONTROL, ORDERED and SEQUENTIAL, respectively) are the same across treatments (p-value = 0.60). Although the same test (weakly) rejects the null hypothesis of no difference in contributions (4.93, 3.85, and 5.82 in CONTROL, ORDERED and SEQUENTIAL, respectively; p-value = 0.07), a two-tailed Mann–Whitney test with each individual as an independent observation indicates that neither the difference between CONTROL and ORDERED (p-value = 0.3170) nor between CONTROL and SEQUENTIAL (p-value = 0.2714) is statistically significant.

Table A1.
Mean beliefs and contributions across parts and treatments (standard deviations in parentheses).
Table A1.
Mean beliefs and contributions across parts and treatments (standard deviations in parentheses).
| Unc. cont. (Part 1) | Beliefs (Part 1) | Cont. (Part 2) | Beliefs (Part 2) | |
|---|---|---|---|---|
| CONTROL | 6.2 (6.5) | 7.2 (5.2) | 4.9 (5.7) | 6.0 (5.0) |
| ORDERED | 4.4 (6.0) | 5.0 (4.6) | 3.9 (5.7) | 5.8 (5.2) |
| SEQUENTIAL | 6.6 (5.8) | 8.0 (4.4) | 5.8 (4.8) | 6.7 (4.5) |
Unc. cont. (Part 1) refers to the unconditional contribution in the strategy method, Cont. (Part 2) refers to contributions in the one-shot game.
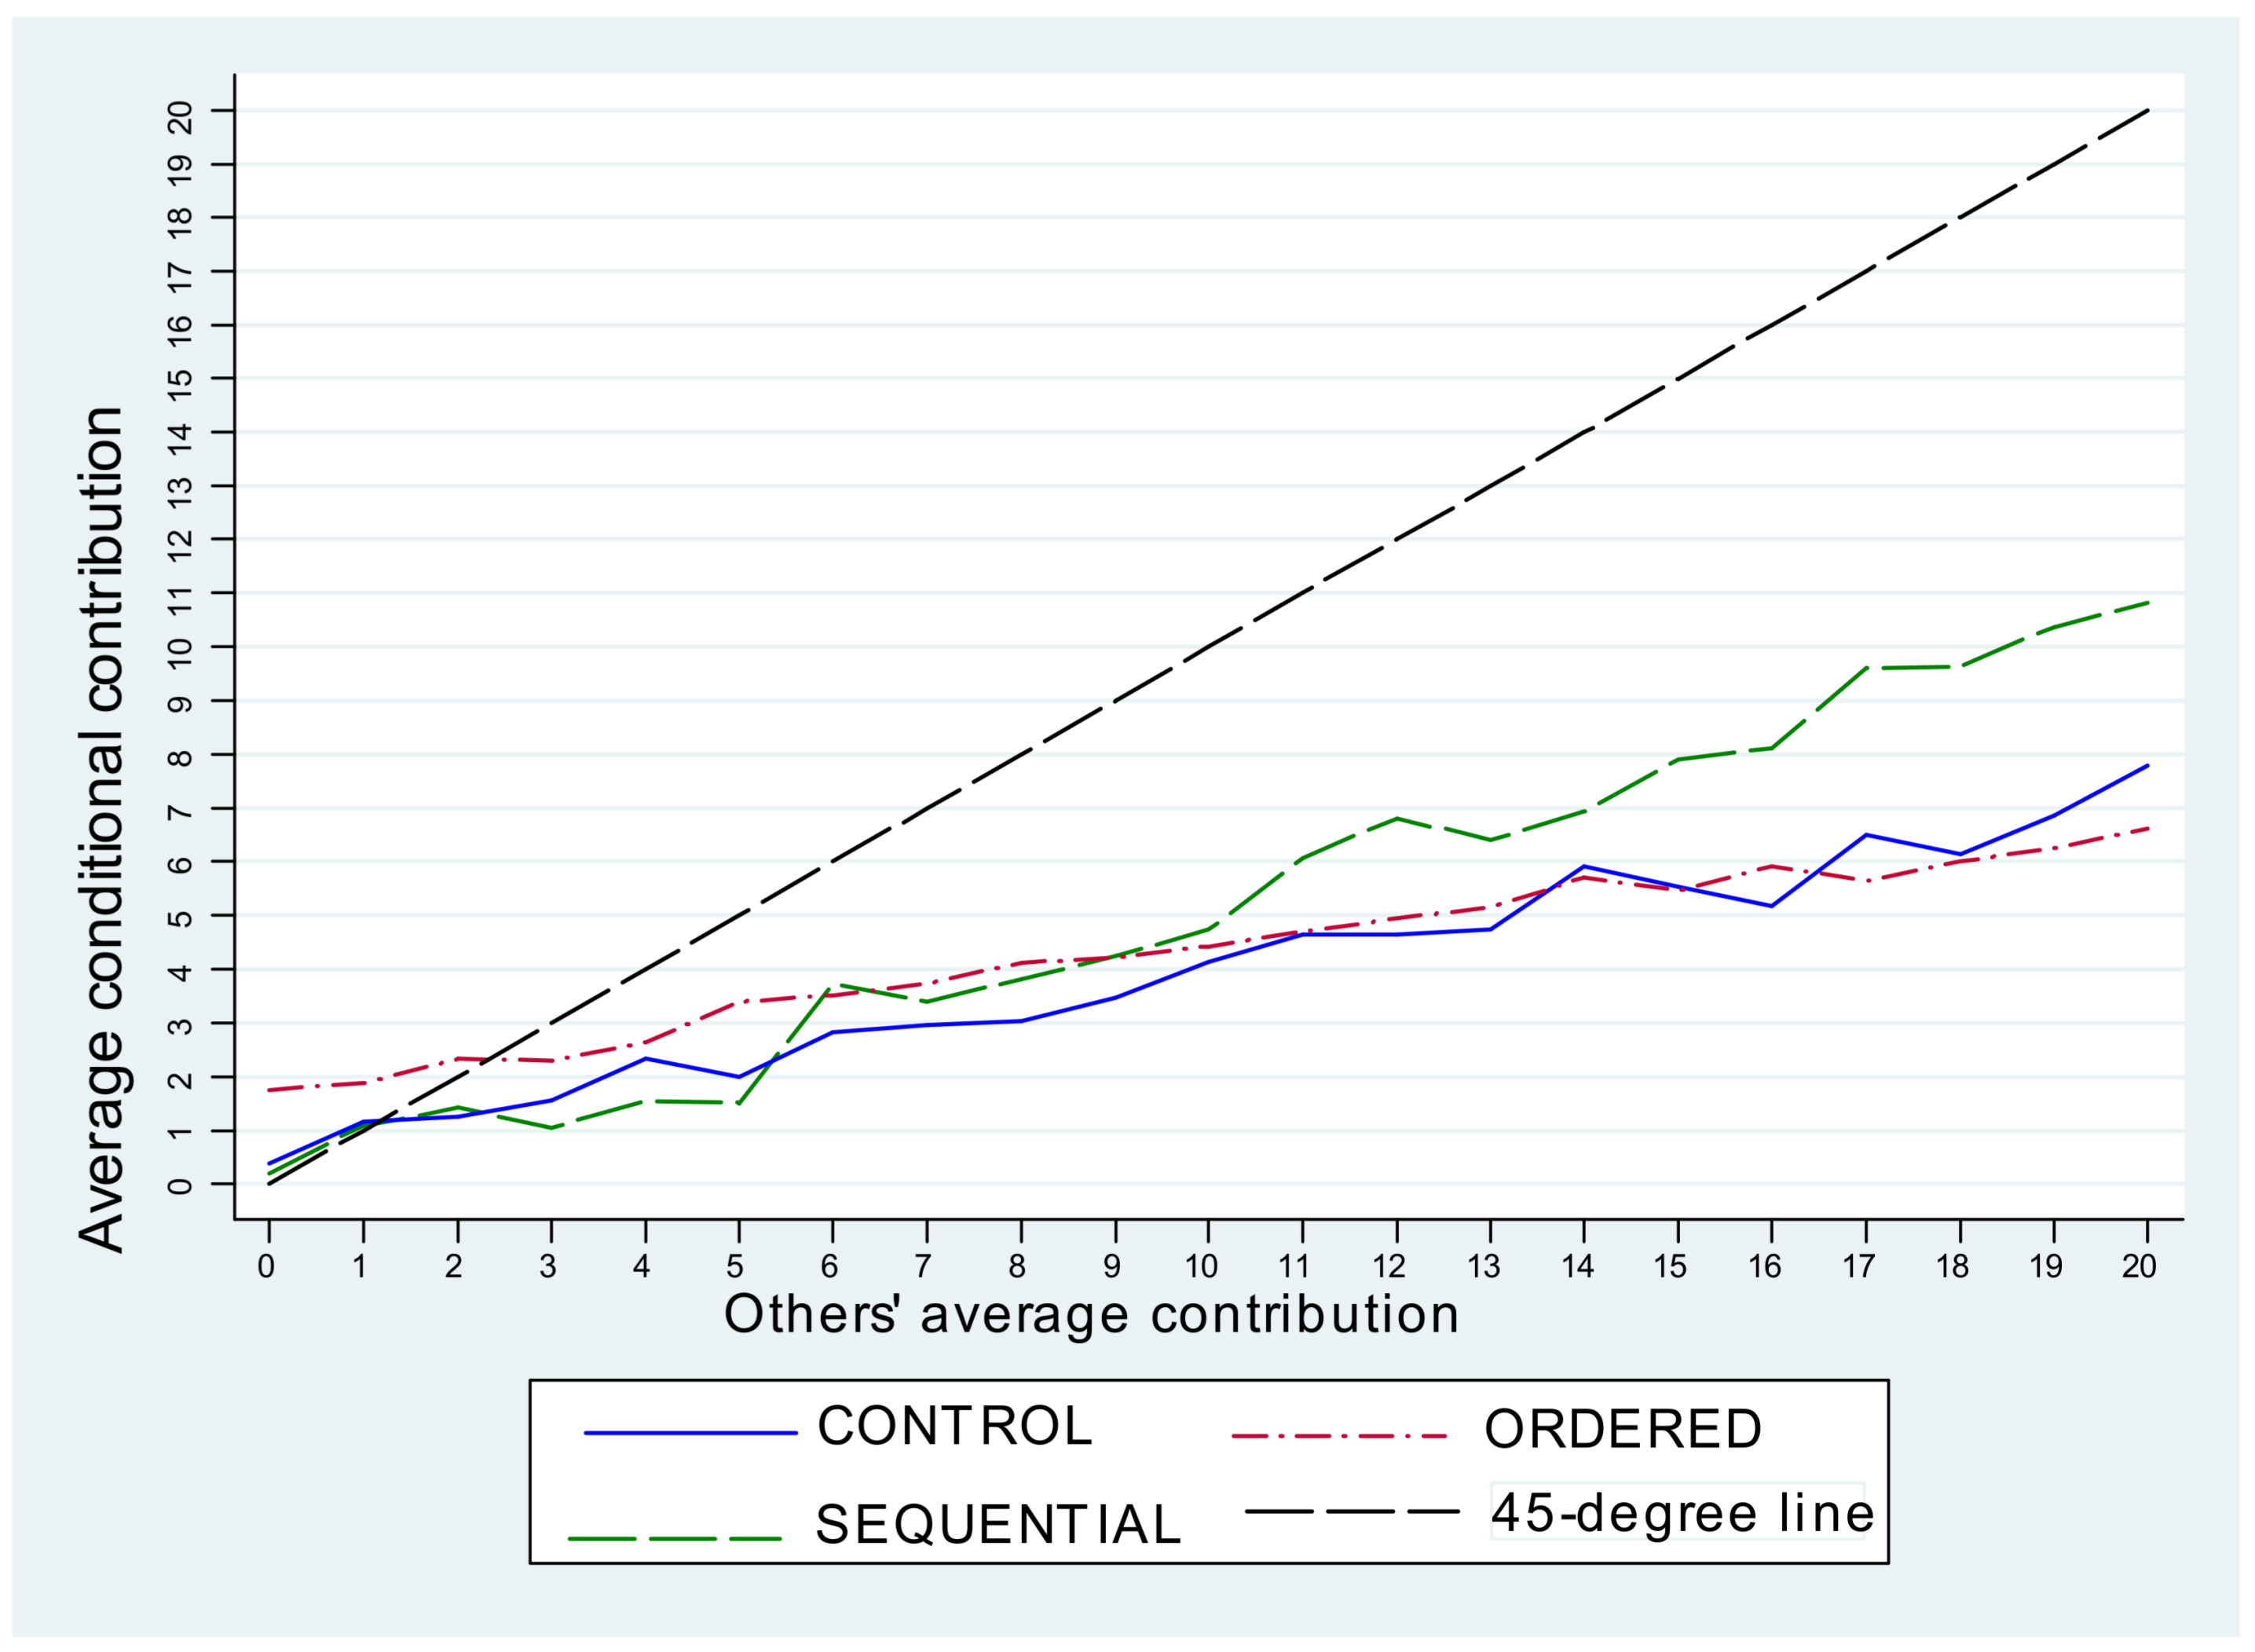
Appendix C Average Conditional Contribution by Treatment
Figure A2 presents the average conditional contribution in the first part of the experiment. Similar to previous experiments, the average conditional contribution is monotonically increasing and lies below the 45-degree line in all treatments. However, as can be seen, conditional contributions tend to be higher in SEQUENTIAL than in the other two treatments. The results of a linear regression with individual random effects reported in the table below confirm that the average conditional contribution differs significantly in SEQUENTIAL. In particular, the slope of the conditional contribution is higher by 20.9 degrees in SEQUENTIAL than in CONTROL. This difference is non-trivial and statistically significant (p-value<0.001). It implies that for every additional token contributed to the public account by one’s peers, the contribution will be 0.209 higher than in the CONTROL. The difference in slopes between CONTROL and ORDERED is smaller (5.2 degrees) and narrowly misses the 10-percent level of significance (p-value = 0.101).
Figure A2.
Average conditional contribution by treatment.
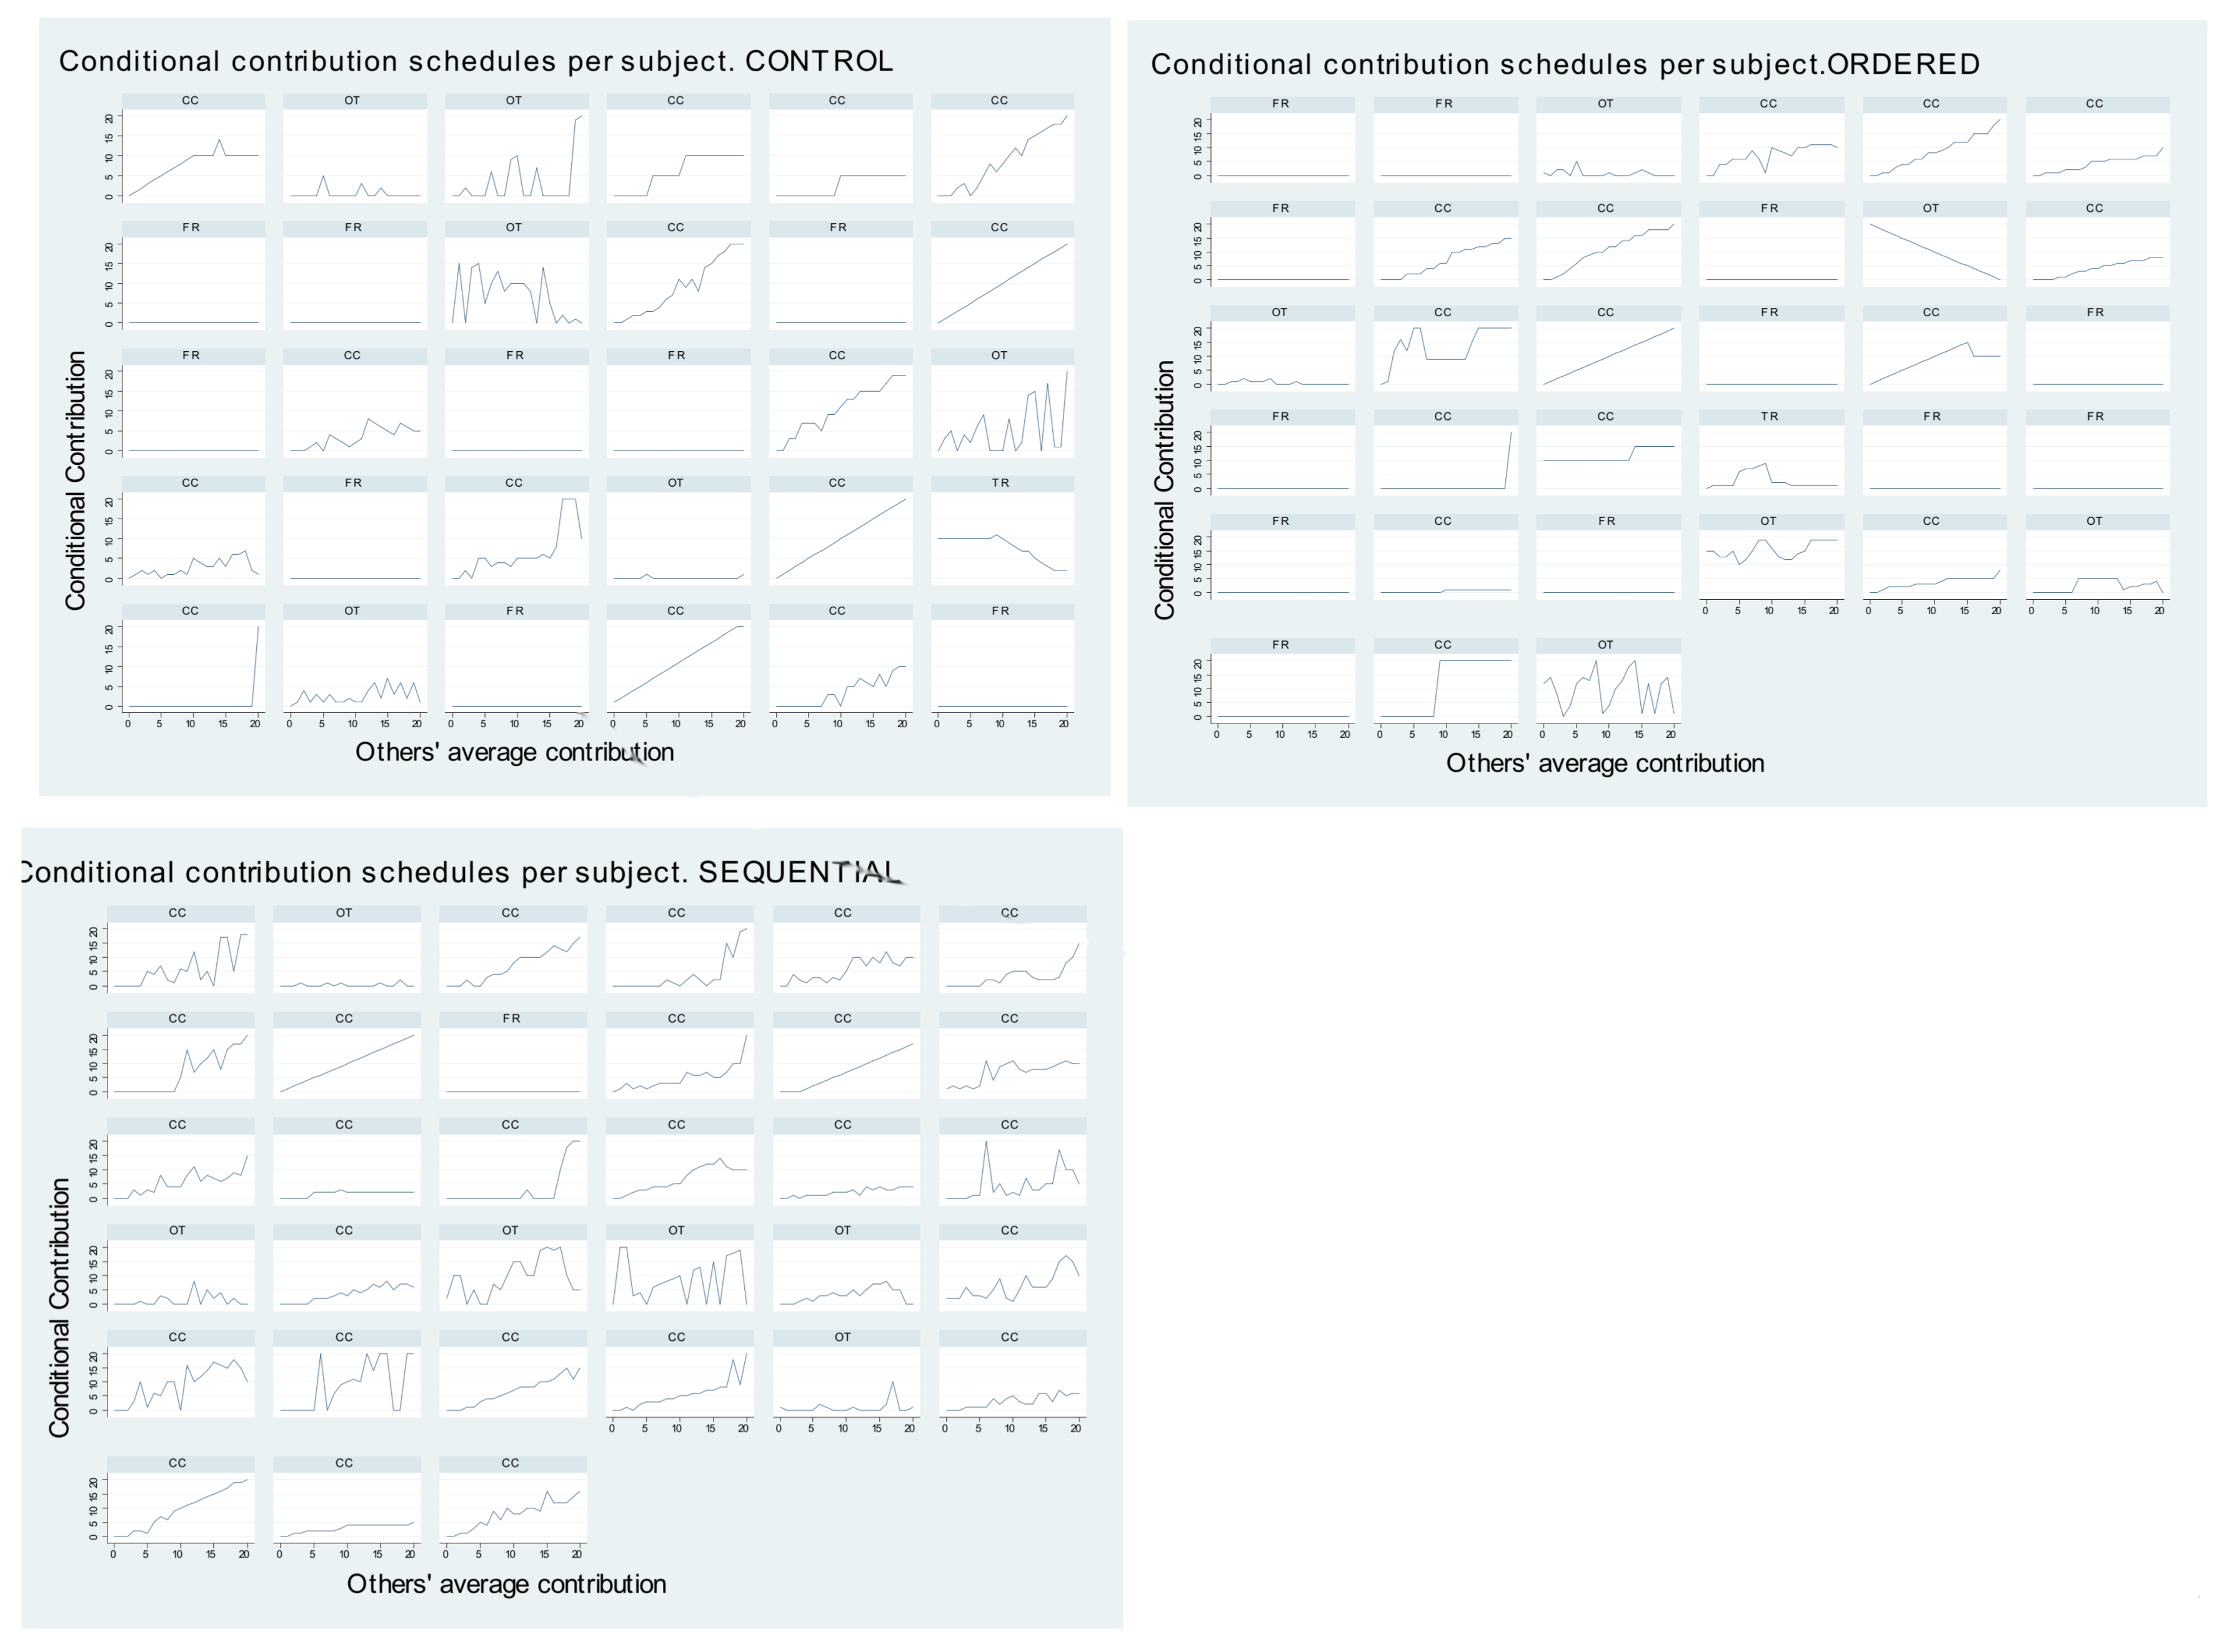
Appendix D Individual Contribution Schedules
Figure A3.
Individual contribution schedules. The letters on top of each subgraph indicate how that particular individual was classified (CC: conditional cooperator; FR: free rider; TR: triangle; OT: other).
Figure A3.
Individual contribution schedules. The letters on top of each subgraph indicate how that particular individual was classified (CC: conditional cooperator; FR: free rider; TR: triangle; OT: other).
References
- Fischbacher, U.; Gächter, S.; Fehr, E. Are people Conditionally Cooperative? Evidence from a Public Goods Experiment. Econ. Lett. 2001, 71, 397–404. [Google Scholar] [CrossRef]
- Cherry, T.L.; McEvoy, D.M.; Sælen, H. Conditional cooperation and cultural worldviews. Econ. Lett. 2017, 158, 51–53. [Google Scholar] [CrossRef] [Green Version]
- Kocher, M.G.; Cherry, T.; Kroll, S.; Netzer, R.J.; Sutter, M. Conditional cooperation on three continents. Econ. Lett. 2008, 101, 175–178. [Google Scholar] [CrossRef] [Green Version]
- Fischbacher, U.; Gächter, S.; Quercia, S. The behavioral validity of the strategy method in public good experiments. J. Econ. Psychol. 2012, 33, 897–913. [Google Scholar] [CrossRef] [Green Version]
- Szolnoki, A.; Perc, M. Conditional strategies and the evolution of cooperation in spatial public goods games. Phys. Rev. E 2012, 85, 026104. [Google Scholar] [CrossRef] [PubMed]
- Szolnoki, A.; Perc, M. Effectiveness of conditional punishment for the evolution of public cooperation. J. Theor. Biol. 2013, 325, 34–41. [Google Scholar] [CrossRef] [PubMed] [Green Version]
- Zhang, H.; Perc, M. Evolution of conditional cooperation under multilevel selection. Sci. Rep. 2016, 6, 23006. [Google Scholar] [CrossRef] [PubMed] [Green Version]
- Zizzo, D.J. Experimenter demand effects in economic experiments. Exp. Econ. 2010, 13, 75–98. [Google Scholar] [CrossRef]
- Fosgaard, T.; Gårn Hansen, L.; Wengström, E. Framing and Misperceptions in a Public Good Experiments. Scand. J. Econ. 2017, 119, 435–456. [Google Scholar] [CrossRef]
- Fischbacher, U.; Gächter, S. Social Preferences, Beliefs and the Dynamics of Free Riding in Public Good experiments. Am. Econ. Rev. 2010, 100, 541–556. [Google Scholar] [CrossRef]
- Gächter, S.; Kölle, F.; Quercia, S. Reciprocity and the Tragedies of Maintaining and Providing the Commons. Nat. Hum. Behav. 2017, 1, 650–656. [Google Scholar] [CrossRef] [PubMed]
- Wolff, I. What are the equilibria in public-good experiments? Econ. Lett. 2017, 150, 83–85. [Google Scholar] [CrossRef]
- Cheung, S.L. New insights into conditional cooperation and punishment from a strategy method experiment. Exp. Econ. 2014, 17, 129–153. [Google Scholar] [CrossRef]
- Andreoni, J. Warm-Glow Versus Cold-Prickle: The Effects of Positive and Negative Framing on Cooperation in Experiments. Q. J. Econ. 1995, 110, 1–21. [Google Scholar] [CrossRef]
- Ellingsen, T.; Johannesson, M.; Mollerstrom, J.; Munkhammar, S. Social Framing Effects: Preferences or Beliefs? Games Econ. Behav. 2012, 76, 117–130. [Google Scholar] [CrossRef]
- Dufwenberg, M.; Gächter, S.; Hennig-Schmidt, H. The Framing of Games and the Psychology of Play. Games Econ. Behav. 2011, 73, 459–478. [Google Scholar] [CrossRef]
- Fosgaard, T.; Gårn Hansen, L.; Wengström, E. Understanding the nature of cooperation variability. J. Public Econ. 2014, 120, 134–143. [Google Scholar] [CrossRef] [Green Version]
- Nikiforakis, N. Feedback, Punishment and Cooperation in Public Good Experiments. Games Econ. Behav. 2010, 68, 689–702. [Google Scholar] [CrossRef]
- Cartwright, E. A comment on framing effects in linear public good games. J. Econ. Sci. Assoc. 2016, 2, 73–84. [Google Scholar] [CrossRef]
- Lévy-Garboua, L.; Maafi, H.; Masclet, D.; Terracol, A. Risk aversion and framing effects. Exp. Econ. 2012, 15, 128–144. [Google Scholar] [CrossRef]
- Holt, C.A.; Laury, S.K. Risk aversion and incentive effects. Am. Econ. Rev. 2002, 92, 1644–1655. [Google Scholar] [CrossRef]
- Cartwright, E.J.; Lovett, D. Conditional cooperation and the marginal per capita return in public good games. Games 2014, 5, 234–256. [Google Scholar] [CrossRef]
- Cartwright, E.; Patel, A. Imitation and the incentive to contribute early in a sequential public good game. J. Public Econ. Theory 2010, 12, 691–708. [Google Scholar] [CrossRef]
- Dariel, A.; Nikiforakis, N. Cooperators and reciprocators: A within-subject analysis of pro-social behavior. Econ. Lett. 2014, 122, 163–166. [Google Scholar] [CrossRef]
- Fehr, E.; Schmidt, K.M. A Theory of Fairness, Competition, and Cooperation. Q. J. Econ. B 1999, 114, 817–868. [Google Scholar] [CrossRef] [Green Version]
- Brandts, J.; Charness, G. The strategy versus the direct-response method: A first survey of experimental comparisons. Exp. Econ. 2011, 14, 375–398. [Google Scholar] [CrossRef] [Green Version]
- Fischbacher, U. z-Tree: Zurich toolbox for ready-made economic experiments. Experimental economics 2007, 10, 171–178. [Google Scholar] [CrossRef] [Green Version]
- Gneezy, U.; Imas, A.; Madarasz, K. Conscience Accounting: Emotion Dynamics and Social Behavior. Manag. Sci. 2014, 60, 2645–2658. [Google Scholar] [CrossRef]
| 1 | |
| 2 | As the reviewer of this paper points out, the impact of a demand effect can be more severe in the FGF method where previous studies have documented considerable levels of confusion among subjects (e.g., Fosgaard, Hansen, and Wengström, 2017) [9]. |
| 3 | Similarly, Wolff (2017) [12] used the FGF method to estimate the fraction of conditional cooperators and determined the “revealed preference” Nash equilibria of the public good game. He concluded: “The data show that multiple equilibria are relatively frequent even in a standard three-player setting. In this perspective, the common finding of close-to omnilateral defection at the end of repeated public-good games is surprising” (p. 83). |
| 4 | Cheung (2014) [13] used a variant of the FGF method where instead of the others’ average contribution, subjects are shown the others’ individual contributions. He found that about a third of his sample can be classified as conditional cooperators and half as selfish. He attributed this primarily to his Australian subject pool, but another explanation is that, in his experiment, conditionality was far less salient than in FGF. In addition, Fosgaard, Hansen, and Wengström (2017) [9] employed the FGF method using a positive–negative frame inspired by Andreoni (1995) [14], and found that this manipulation affects subjects’ contribution schedules, although this is partly due to misperception of the incentives of the game. Similarly, Gächter, Kölle, and Quercia (2017) [11] found that framing the public good game as a Maintenance or a Provision problem affects the elicited contribution profiles. |
| 5 | Different kinds of framing effects have been shown to affect contributions in public good games (e.g., Andreoni 1995 [14]; Ellingsen et al., 2012 [15]; Dufwenberg et al. 2011 [16]; Fosgaard, Hansen, Wengström, 2014 [17]; Nikiforakis, 2010 [18]). For an extensive list of references, see Cartwright (2016) [19]. |
| 6 | |
| 7 | The parameters in the present study were different from those of FGF, who used groups of four players and a marginal per-capita return of 0.4. See the studies of Cartwright and Lovett (2014), [22] and Wolff (2017), [12] for evidence on how changes in the marginal per-capita return affect contribution profiles elicited with the FGF method. |
| 8 | For instance, consider the model by Fehr and Schmidt (1999) [25]. A dislike for disadvantageous inequality (i.e., a sufficiently high ) could rationalize conditional cooperation in the public-good game. An individual with sufficiently high is predicted to contribute more in the contribution table for a given level of others’ contributions than someone with as well as in the one-shot game, controlling for beliefs, to avoid suffering disutility from earning more than his group members. |
| 9 | Since the FGF classification procedure for selfish subjects is very strict, requiring that subjects always contribute zero, I ran individual level regressions to explore the relationship between others’ and own contribution. If the fraction of subjects with insignificant slopes (selfish people would be among them) is compared using a Fisher’s-exact test, it is find that there are significantly fewer in SEQUENTIAL than in CONTROL (p-value = 0.081) or ORDERED (p-value = 0.015). |
| 10 | For example, an individual who always contributes has a weakly monotonic schedule. A perfect conditional cooperator contributes and has a strictly monotonic schedule. An individual who contributes and has a non-monotonic schedule. |
| 11 | The large fraction of non-monotonic schedules in SEQUENTIAL may be partly attributed to the fact that individuals could not revise their choices once made. However, it should be noted that: (i) subjects knew in advance all the choices they would be asked to make; and (ii) that half of the participants also failed to report a weakly monotonic schedule even in the CONTROL where revisions were possible. |
| 12 | This difference between SEQUENTIAL and CONTROL is not statistically significant (p-value = 0.330). |
Figure 1.
Percentage of choices that deviate from the predicted contribution in the one-shot game.

Table 1.
Type classification by treatment using FGF rule. Entries are percentages of each type for each treatment.
Table 1.
Type classification by treatment using FGF rule. Entries are percentages of each type for each treatment.
| CONTROL | ORDERED | SEQUENTIAL | |
|---|---|---|---|
| Free riders | 30.00 | 36.36 | 3.03 |
| Conditional cooperators | 46.66 | 42.42 | 78.79 |
| Triangle contributors | 3.33 | 3.03 | 0.00 |
| Others | 20.00 | 18.18 | 18.18 |
| # of groups | 10 | 11 | 11 |
| # of subjects | 30 | 33 | 33 |
© 2018 by the author. Licensee MDPI, Basel, Switzerland. This article is an open access article distributed under the terms and conditions of the Creative Commons Attribution (CC BY) license (http://creativecommons.org/licenses/by/4.0/).
Share and Cite
MDPI and ACS Style
Dariel, A. Conditional Cooperation and Framing Effects. Games 2018, 9, 37. https://doi.org/10.3390/g9020037
AMA Style
Dariel A. Conditional Cooperation and Framing Effects. Games. 2018; 9(2):37. https://doi.org/10.3390/g9020037
Chicago/Turabian StyleDariel, Aurélie. 2018. "Conditional Cooperation and Framing Effects" Games 9, no. 2: 37. https://doi.org/10.3390/g9020037
Note that from the first issue of 2016, this journal uses article numbers instead of page numbers. See further details here.