Article

Yield Response of Native Warm-Season Forage Grasses to Harvest Intervals and Durations in Mixed Stands

1
Agricultural Research Station, Virginia State University, Petersburg, VA 23806, USA
2
Plant and Soil Sciences Department & Animal and Dairy Science Department, Mississippi State University, Mississippi State, MS 39762, USA
*
Author to whom correspondence should be addressed.
Agronomy 2014, 4(1), 90-107; https://doi.org/10.3390/agronomy4010090
Submission received: 20 December 2013 / Revised: 25 January 2014 / Accepted: 4 February 2014 / Published: 17 February 2014

Abstract

:
Tolerance to frequent defoliations is critical for native warm-season grasses managed for forage and wildlife habitat. Yield response of big bluestem (Andropogon gerardii), indiangrass (Sorghastrum nutans), and little bluestem (Schizachyrium scoparium) to treatments (30-, 40-, 60-, 90- or 120-d harvest intervals) and durations were assessed on early-succession mixed stands. Over three years, phased harvestings were initiated in May, on sets of randomized plots, in five replications to produce one-, two-, and three-year old stands, by the third year. Each plot had marked indiangrass and big bluestem plants which were hand-clipped on harvest-days before whole-plot harvesting. Species yields were greater in first- than second-year plots but not affected by treatments. June–September yields in 2008 were greatest for the 30-d, and more in the first- (8472 kg ha−1) than second-year (7627 kg ha−1) plots. In 2009, yields were also greater in first- than second-year plots but without treatment effects. Recovery yields showed no treatment effect, but were about 67% less for second- compared to first-year plots and much less than plots never harvested before. Data suggest that harvesting similar mixed native warm-season grass stands at 30- to 40-d intervals may provide good hay yields without compromising post-season stand recovery for multiple uses.

1. Introduction

States in the southern and southeastern USA experience severe drought conditions during July–August dry spells which hinder growth of the dominant warm-season forage grasses, most of which are exotic. This causes severe summer forage shortages (summer slump) during which animals have to be sustained on hay thus increasing costs of production. The southeastern USA has also experienced rapid declines in ground-nesting grassland birds associated with disappearance of tall-growing native warm-season grasses (NWSG) in agricultural landscapes. The need to prolong active summer grazing period and improve wildlife habitat in the region has attracted a growing interest in the potential of NWSGs to improve summer forage production in the region [1]. Favored NWSG species include indiangrass [IG, Sorghastrum nutans (L.). Nash], big bluestem (BB, Andropogon gerardii Vitman), little bluestem [LB, Schizachyrium scoparium (Michx). Nash], switchgrass (SG, Panicum virgatum L.) and eastern gamagrass (Tripsacum dactyloides L.) [2].
During summer, unfertilized stands of these grasses often produce more forage over a longer period than most introduced warm-season species such as; bermudagrass [Cynodon dactylon (L.) Pers] bahiagrass (Paspalum notatum Flueggé) and dallisgrass (Paspalum dilatatum Poir.) [3,4]. In North Dakota, for example, yields of 2637 kg ha−1 year−1 from unfertilized mixed stands of BB, IG, and SG starting from mid-May through mid-September have been recorded [4]. In Pennsylvania, annual dry matter (DM) yield of 8000 kg ha−1 year−1 has also been reported from SG and BB dominated pastures, of which 15% was in May, 55% in July and August, and 30% in October [5]. In a similar study comparing yields of warm-season grasses in Missouri, SG, LB, and IG had their 3-year averages slightly above 4000 kg ha−1 while that of bermudagrass was 3810 kg ha−1 [6]. With 112 kg N ha−1, yields of BB, LB, IG, and SG increased to between 5000 and 6650 kg ha−1, about 10 times greater than the matching increase of 160 kg ha−1 for bermudagrass. The superiority of NWSGs compared to their non-natives C4 counterparts, like bermudagrass, is attributed to a combination of morphological adaptations such as deep and extensive root systems, which enable them to sustain growth under drought conditions [7]. However, unlike their exotic counterparts, NWSGs are intolerant to continuous intensive defoliation, partly because their growing points are elevated higher off the ground, making them relatively more susceptible to removal or physical damages during harvesting [8]. It is worth noting, that environmental stresses associated with defoliation and drought present an interactive complex phenomenon that invokes diverse plant responses rooted in polygenic traits [9,10,11,12]. This may explain notable discrepancies between reported experimental findings, and hence the need to base management recommendations on studies conducted in comparable ecological settings.
When defoliation is done appropriately, with minimal losses of or damages to growing points and at intervals that allow sufficient time for regrowth, timely harvesting may increase total forage yield and quality by recovering nutrients in mature leaves before their translocation to reproductive and/or storage tissues [13]. It may also optimize post-defoliation shoot growth, which enables plants to repair and compensate for damaged tissues [14]. In this case, compensation here refers to vigorous regrowth exhibited by damaged plants usually associated with resulting favorable environmental conditions (improved access to solar radiation and reduced competition from other plant species, more negatively affected by defoliation) [14,15] and removal of apical meristems in favor of secondary tiller growth Noy-Meir 1993 [14]. Thus, proper defoliation improves yield by increasing light penetration to the crown, where it stimulates bud break [16] and promote the growth of vegetative tillers; usually more leafy [13]. However, defoliation may damage plants excessively to result in poor growth [17], and reduced subsequent yields. In fact, yield reductions of over 60% due to multiple defoliations have been observed on LB [18] and BB [19].
Because of differences in species morphological adaptations, plant growth responses to defoliation vary [20] and are reportedly influenced by their retained proportions of photosynthetic tissues [17,21,22]. Recovery also depends on the time interval between successive defoliations [17], precipitation, and duration of repeat defoliations [18,23]. With mixed stands, such species differences often complicate decisions on appropriate harvest intervals, which should be based on expected response by the dominant species and prevailing weather conditions. Although use of NWSGs, such as BB, IG, and LB, could improve summer forage production in the southeastern USA, there is paucity of information on their appropriate harvest management in mixed stands to sustain high yields and stand recovery. It is also not well understood how yields of these NWSG species may be differently affected by common defoliation events in mixed stands. Therefore, this study assessed effects of harvest intervals and harvest durations on early-succession mixed stands of BB, IG, and LB on: (1) species yield performance in mixed stands; (2) cumulative in-season forage yield and post-season recovery. It was assumed that harvest intervals would have no significant effect on cumulative yield per area, but could influence species yield per plant−1.

2. Results and Discussion

2.1. Forage Yield per Plant

2.1.1. Species Cumulative In-Season Yield

In this section, years of production refers to number of continuous harvest years (harvest duration). For the same harvest interval, yield differences between plants in first and second year of production have been expressed as a percent of the respective first year yield as ([Y108 − Y207]/Y108) × 100 and ([Y109 − Y208]/Y109) × 100. Information on growth response of IG and LB plants in mixed stands to repeat defoliation and years of production is helpful in developing sustainable haying strategies. In this study, significant year × harvest interval × harvest duration interactions occurred for species yield. Yield response was, therefore, compared separately for each year and harvest durations within year. In 2008, IG June-September yield plant−1 showed no effect of harvest intervals or harvest duration and averaged 114 g (Y108) and 74 g (Y207) (Table 1). In 2009, average IG yield plant−1 was 95 g in Y109 and 46 g in Y208 plots, but differences occurred within the 30- and 120-d harvest intervals (Table 1). The yields were greater in the first- than second-year plots by 54% and 65% for the 30- and 120-d harvest intervals, respectively.
For LB in 2008, cumulative yield plant−1 in first- (Y108) and second-year (Y207) plots (Table 1) showed no effect of harvest intervals or years of production. Harvest interval did not also affect yield plant−1 in 2009. However, in this year, LB yield for the 60- and 120-d harvest intervals, was greater by 76% (P < 0.05) for plants in the first year of production (Y109) compared to those in the second year (Y208). The noted average yield reduction for plants in the second year of production compared to those in first year was about 50% for both LB and IG, suggesting that two consecutive years of haying may not alter species proportional contributions to total yield. Lack of harvest interval effect on cumulative yield plant−1, for both IG and LB, suggests that these species have effective mechanisms for compensatory growth response to defoliation. In fact, relative growth rates of IG and LB were greater for the shorter than longer harvest intervals (data not included). Such mechanisms as enhanced photosynthetic rates of damaged leaves, delayed leaf senescence, and faster new leaf expansion, often lead to fast vegetative biomass accumulation [13,24]. However, while defoliating tallgrass prairie vegetation has been found to result with increased biomass production [23], for LB, negative responses to defoliation have also been reported [4,25].
Table 1. Effects of harvest interval and harvest-duration on cumulative (June–Sep.) yield by indiangrass (Sorghastrum nutans) and little bluestem (Schizachyrium scoparium) in mixed native grass stands at their first and second harvest-year in two consecutive years.
Harvest interval (days)Yield June–September 2008Yield June–September 2009
Y108Y207P > Fα§Y109Y208p > Fα
g plant−1 g plant−1
Indiangrass
120 (2)105620.29111 A#39 B0.01
90 (2)87690.57105500.26
60 (3)167730.0599580.16
40 (4)108760.2370470.25
30 (5)105880.5578 A36 B0.04
CV4865 5954
p > Fα0.230.94 0.730.63
Little bluestem
120 (2)16370.2725 A6 B0.03
90 (2)21100.281170.33
60 (3)17230.3021 A5 B0.05
40 (4)28330.371890.40
30 (5)44380.641290.48
CV6166 7982
p > Fα0.060.14 0.450.68
Stands of indiangrass, big bluestem (Andropogon gerardii) and little bluestem (Schizachyrium scoparium). Y108, Y109, Y207 and Y208 are plots in their first and second harvesting year, established in 2008, 2009 and 2007, respectively. §Probability that Y1 and Y2 plot yields in the same harvest year are significantly different, α=0.05. Days between successive harvests with number of harvests per season in brackets. #Under 2008 or 2009, means within row, followed by different uppercase letters differ significantly, α=0.05. CV = coefficient of variation.

2.1.2. Species Post-Season Recovery Yield

In the mixed stands, effects of harvest interval on stand health were also assessed based on post-season regrowth of the key species in spring. As a measure of effects of harvest duration on stand recovery, first mid-May yields of IG and LB plants in first and second year of production, were compared (Table 2). Yields in plots coming into production for the first time (Y108 in 2008 and Y109 in 2009) were taken as control since the plants had not received any of the harvest intervals yet.
Table 2. Effects of harvest interval and harvest-duration on recovery of indiangrass (Sorghastrum nutans) and little bluestem (Schizachyrium scoparium) plants in mixed native grass stands in mid-May of succeeding two consecutive years.
Harvest interval (days)May 2008May 2009
Y108Y207p > Fα§Y109Y208p > Fα
g plant−1 g plant−1
Indiangrass
120 (2)2351170.0592 A#9 B0.01
90 (2)209930.0879 A16 B<0.01
60 (3)212 A111 B0.04108 A22 B<0.01
40 (4)2501150.0770 A12 B0.01
30 (5)185 A94 B0.01115 A10 B<0.01
CV4743 4164
p > Fα0.8740.862 0.32120.17
Little bluestem
120 (2) 961180.4052 A2 B0.02
90 (2)137 A68 B<0.0152 A4 B0.02
60 (3)123 A78 B0.0162 A2 B0.02
40 (4)123890.0863 A3 B0.01
30 (5)149 A87 B0.0466 A4 B0.02
CV2336 72106
p > Fα0.090.18 0.970.75
Stands of indiangrass, big bluestem (Andropogon gerardii) and little bluestem (Schizachyrium scoparium). Y108, Y109, Y207 and Y208 are plots in their first and second harvesting year, established in 2008, 2009 and 2007, respectively. §Probability that Y1 and Y2 plot yields in the same harvest year are significantly different, α=0.05. Days between successive harvests with number of harvests per season in brackets. #Under 2008 or 2009, means within row, followed by different uppercase letters differ significantly, α=0.05. CV = coefficient of variation.
Suitability of these Y108 and Y109 plants as control to which previously harvested plants could be compared was confirmed by the observed lack of differences between their first mid-May yields. Both IG and LB, showed no effect of harvest interval on recovery yield plant−1 (Table 2) in any year. Mean IG yield plant−1 was 218 g in Y108 and 106 g in Y207 while, for LB, it was 126 (Y108) and 89 g (Y207). In 2008, IG plants in first year (Y108) of production had greater (P < 0.04) yields for 30- and 60-d harvest intervals (P < 0.01) compared to plants in the second year of production (Y207). Similarly, yields of LB plants (P < 0.01) were greater in first- than second-year plots for the 30-, 60-, and 90-d harvest intervals (Table 2). In 2009, however, yields for both species, were greater (P < 0.01) by 76% for plants in first- (Y109) than second-year (Y208) plots.
Across harvest intervals, IG mean yield plant−1 was 93 and 14 g in first- (Y109) and second-year (Y208) plots (Table 2). Correspondingly, LB yield plant−1 for Y109 and Y208 was 59 and 3 g, respectively. These yield differences between plants in their first- and second-year of production demonstrated negative effects of previous defoliation on early-season plant vigor. As earlier reported [26], previously grazed BB shows reduced growth rate, tiller biomass and survival. Others [20] have also noted that yield reduction following defoliation of mixed stands that include IG and LB, may lead to replacement of LB by other species.
Usually, new tiller growth, prior to root establishment, is mostly influenced by available nutrient reserves in the crown, a source normally affected by previous defoliation intensity [13]. However, despite the effects of defoliation, climatic factors especially rainfall (Figure 1a) and temperature (Figure 1b), and duration of the recovery period may also influence subsequent yields. In the current study, no differences due to harvest intervals were observed in post-season yields at first harvest (mid-May). This suggests that the recovery period in the spring (45 days) was long enough for plants to overcome differences due to previous unequal repeat defoliation. In fact, beyond 42 days of recovery growth, perennial grasses may show no difference in basic allometric relations (root-to-shoot and leaf area-to-weight ratios) attributable to previous defoliation intensity [27]. Also because spring-growth of most perennial bunch grasses starts with emergence of new tillers [13], differences associated with intensity of previous defoliation usually disappear once these tillers establish their root systems.
Figure 1. Temporal trends in (a) monthly rainfall totals (mm) and (b) monthly mean temperature (°C) during the study period, 2007 to 2009, Aberdeen, MS, USA.
Agronomy 04 00090 g001
Although differences in harvest intervals were not reflected in post-season recovery, the noted yield depression due to previous defoliation requires attention to species dynamics in mixed NWSG hay fields. If ignored, yield depression from defoliation may lead to changes in species composition which may also leave the stand more susceptible to weed invasion. Rotational two harvest- and one rest-year cycles may be a workable alternative to reduce management costs that could arise from weed invasion.
Table 3. Effects of harvest interval and duration on recovery from last harvest event of indiangrass (Sorghastrum nutans) and little bluestem (Schizachyrium scoparium) plants in mixed native grass stands based on yield per plant in mid-May of two consecutive years.
Interval harvests (days)First, second and third year plots in 2009Second vs. third year plots in 2010
Y109§Y208Y307CVp > FαY209Y308CVp > Fα
g plant−1 g plant−1
Indiangrass
120 (2)#92 A††9 B23 B78<0.012118400.64
90 (2)79 A16 B15 B47<0.011619610.45
60 (3)108 A22 B28 B32<0.012319390.44
40 (4)70 A12 B20 B64<0.011321310.05
30 (5)115 A10 B18 B54<0.011313360.88
CV416453 4442
p > Fα0.320.170.41 0.170.62
Little bluestem
120 (2)52 A2 B4 B1160.0134830.82
90 (2)52 A4 B4 B1110.01421280.59
60 (3)62 A2 B3 B1240.0123950.56
40 (4)63 A3 B4 B100<0.0124690.14
30 (5)66 A4 B2 B1140.0123530.25
CV7210669 12977
p > Fα0.970.750.67 0.810.80
Number of consecutive years a plot had been harvested; Stands of indiangrass, big bluestem (Andropogon gerardii) and little bluestem (Schizachyrium scoparium); §For each plot, the first digit indicates first, second or third harvest year and the last two digits indicate the year establishe; Probability that, in the respective row or column, mean plot yields in the same harvest year are significantly different, α = 0.05; #Days between successive harvests with number of harvests per season in brackets. ††In a year, means followed by different uppercase letters, within row, differ significantly, α = 0.05. CV = coefficient of variation.

2.1.3. Implied Species Yield Sustainability

As an indicator of IG and LB yield sustainability in mixed stands harvested at variable intervals, a “three-year” comparison of May yields in 2009 was made between plants in their first (Y109), second (Y208), and third (Y307) years of production. In 2010, no new plots were added and comparison was only between plants in second (Y209) and third (Y308) year of production (Table 3). The yield plant−1 was greater (p < 0.001) for IG and LB plants in their first (Y109) compared to those in second (Y208) and third (Y307) year of production. In 2009, average mean yield plant−1 in the first-year (Y109) stands was greater by over 75% and 90% for IG (93 g) and LB (59 g), respectively, than in the second-year (Y208) stands. For plants that had been in production for two or more years, yield plant−1 averaged 18 g (IG) and 3 g (LB), but was not affected by harvest intervals or number of years in production (Table 3). This agrees with earlier reports [23] regarding effects of history of defoliation on compensatory growth. This noted yield difference is consistent with reported negative effects of defoliation on subsequent plant vigor and herbage yield [26].
In 2010, however, harvest intervals did not affect yield plant−1 for Y209 or Y308 plots which, for both grass species, was also not affected by years in production (Table 3). Yield plant−1 averaged 18 and 3 g for IG and LB, respectively. The lack of effects of harvest interval or harvest duration on yield in Y208 and Y307 plots suggests that the plants employed compensatory mechanisms, effectively, to adjust post-defoliation growth rates, which also prevented further declines in plant vigor with subsequent defoliations. Based on measured tiller weights and plant heights (data not included), regrowth of IG and LB was relatively faster for the shorter harvest intervals. This often results from exponential increase in relative growth rate that is proportional to the biomass removed [27]. Still, the noted decline in yield by both LB and IG after the first harvest year, suggested that continuous harvesting might reduce their proportions in the mixed stands. To sustain forage production, therefore, producers may need to establish a rotational harvest system that will allow for at least a one-year rest period following every two successive harvest-years.

2.2. Forage Yield per Area

2.2.1. Cumulative Whole-Plot Yield

In a year, effects of harvest regimes can be assessed by comparing yields across harvest intervals or between years of production (harvest duration). In this study, yields for each harvest interval were compared between first- and second-year plots, in both 2008 and 2009 harvest years (Table 4). This comparison was necessary as an indicator of likely yield sustainability under continuous harvesting. Significant year × harvest interval × harvest duration interactions also occurred for whole-plot yields. Yield responses were, again, compared separately for each year and harvest durations within year. In 2008, cumulative forage yields in plots harvested for the first time (Y108) were similar to those of plots in second year of production (Y207), and were not affected by harvest intervals (Table 4). However, in 2009, plots harvested for the first time (Y109) had greater yields (p < 0.04) for the 40-, 60-, and 90-d harvest intervals than plots in the second year of production (Y208). The lowest yield (2395 kg ha−1) was for the 30-d harvest interval in Y208 plots and the highest (4813 kg ha−1) was for the 90-d in Y109 plots. Generally, forage yield for the second year of production (Y208) was less by 27%–43% than that of plots in the first year of production (Y109).
Yield reduction for continuously harvested plants often partly results from cessation of root growth due to preferential allocation of resources to shoot growth [28,29]. This is so because defoliation forces plants to rely on limited leaf area for photosynthesis and, therefore, making them incapable of supporting simultaneous rapid root and shoot growth [29]. This suggests that greater yields, during the 2009 season, in first- (Y109) than second-year plots (Y208), partly resulted from differences in root growth. It also implies that plants in Y108 plots exploited relatively smaller soil volumes for nutrients and water. Similar yield reductions due to prior defoliation regimes have also been reported [18,22]. Above ground biomass differences between previously harvested areas and those being harvested for the first time may also vary [29] due to other factors like species composition, weather, and soil fertility [30]. The fact that yield differences due to harvest duration were not observed in 2008 (with better rainfall distribution) like in 2009 (with poor rainfall distribution) suggests that, growth was probably limited more by weather factors rather than soil fertility. Between the two years, differences in rainfall (Figure 1a) and duration of the hot June–August dry spell (Figure 1b) may partly explain the variation in effects of harvest duration on yield. With sufficient rainfall, water and mobile nutrients become available to plants by mass flow [31] thus masking effective differences in root mass associated with harvest duration. It is, therefore, advisable to adjust harvest rotation cycles accordingly, to take advantage of, or minimize negative effects of prevailing weather conditions.
Table 4. Effects of harvest interval on cumulative June-September forage per area, after May harvest, of first and second year plots of mixed native grass stands harvested in two consecutive years.
Harvest interval (days)Yield June–September 2008Yield June–September 2009
Y108Y207p > Fα§Y109Y208p > Fα
kg ha−1 kg ha−1
120 (2)4094 b #3433 b0.83427028340.14
90 (2)3760 b3111 b0.484813 A3495 B0.02
60 (3)5115 b4161 b0.524030 A2759 B0.03
40 (4)6325 ab5053 ab0.26341128230.44
30 (5)8472 a7627 a0.674219 A2395 B0.02
CV4247 2536
p > Fα0.030.03 0.340.57
Stands of indiangrass (Sorghastrum nutans), big bluestem (Andropogon gerardii) and little bluestem (Schizachyrium scoparium); Y108, Y109, Y207 and Y208 are plots in their first and second harvesting year, established in 2008, 2009 and 2007, respectively; §Probability that mean yields of Y1 and Y2 plots within treatment in the same harvesting year, differ significantly, α = 0.05. Days between successive harvests with number of harvests per season in brackets; #In a year, means followed by different letters; lowercase within a column or uppercase within a row, differ significantly, α = 0.05; CV = coefficient of variation.

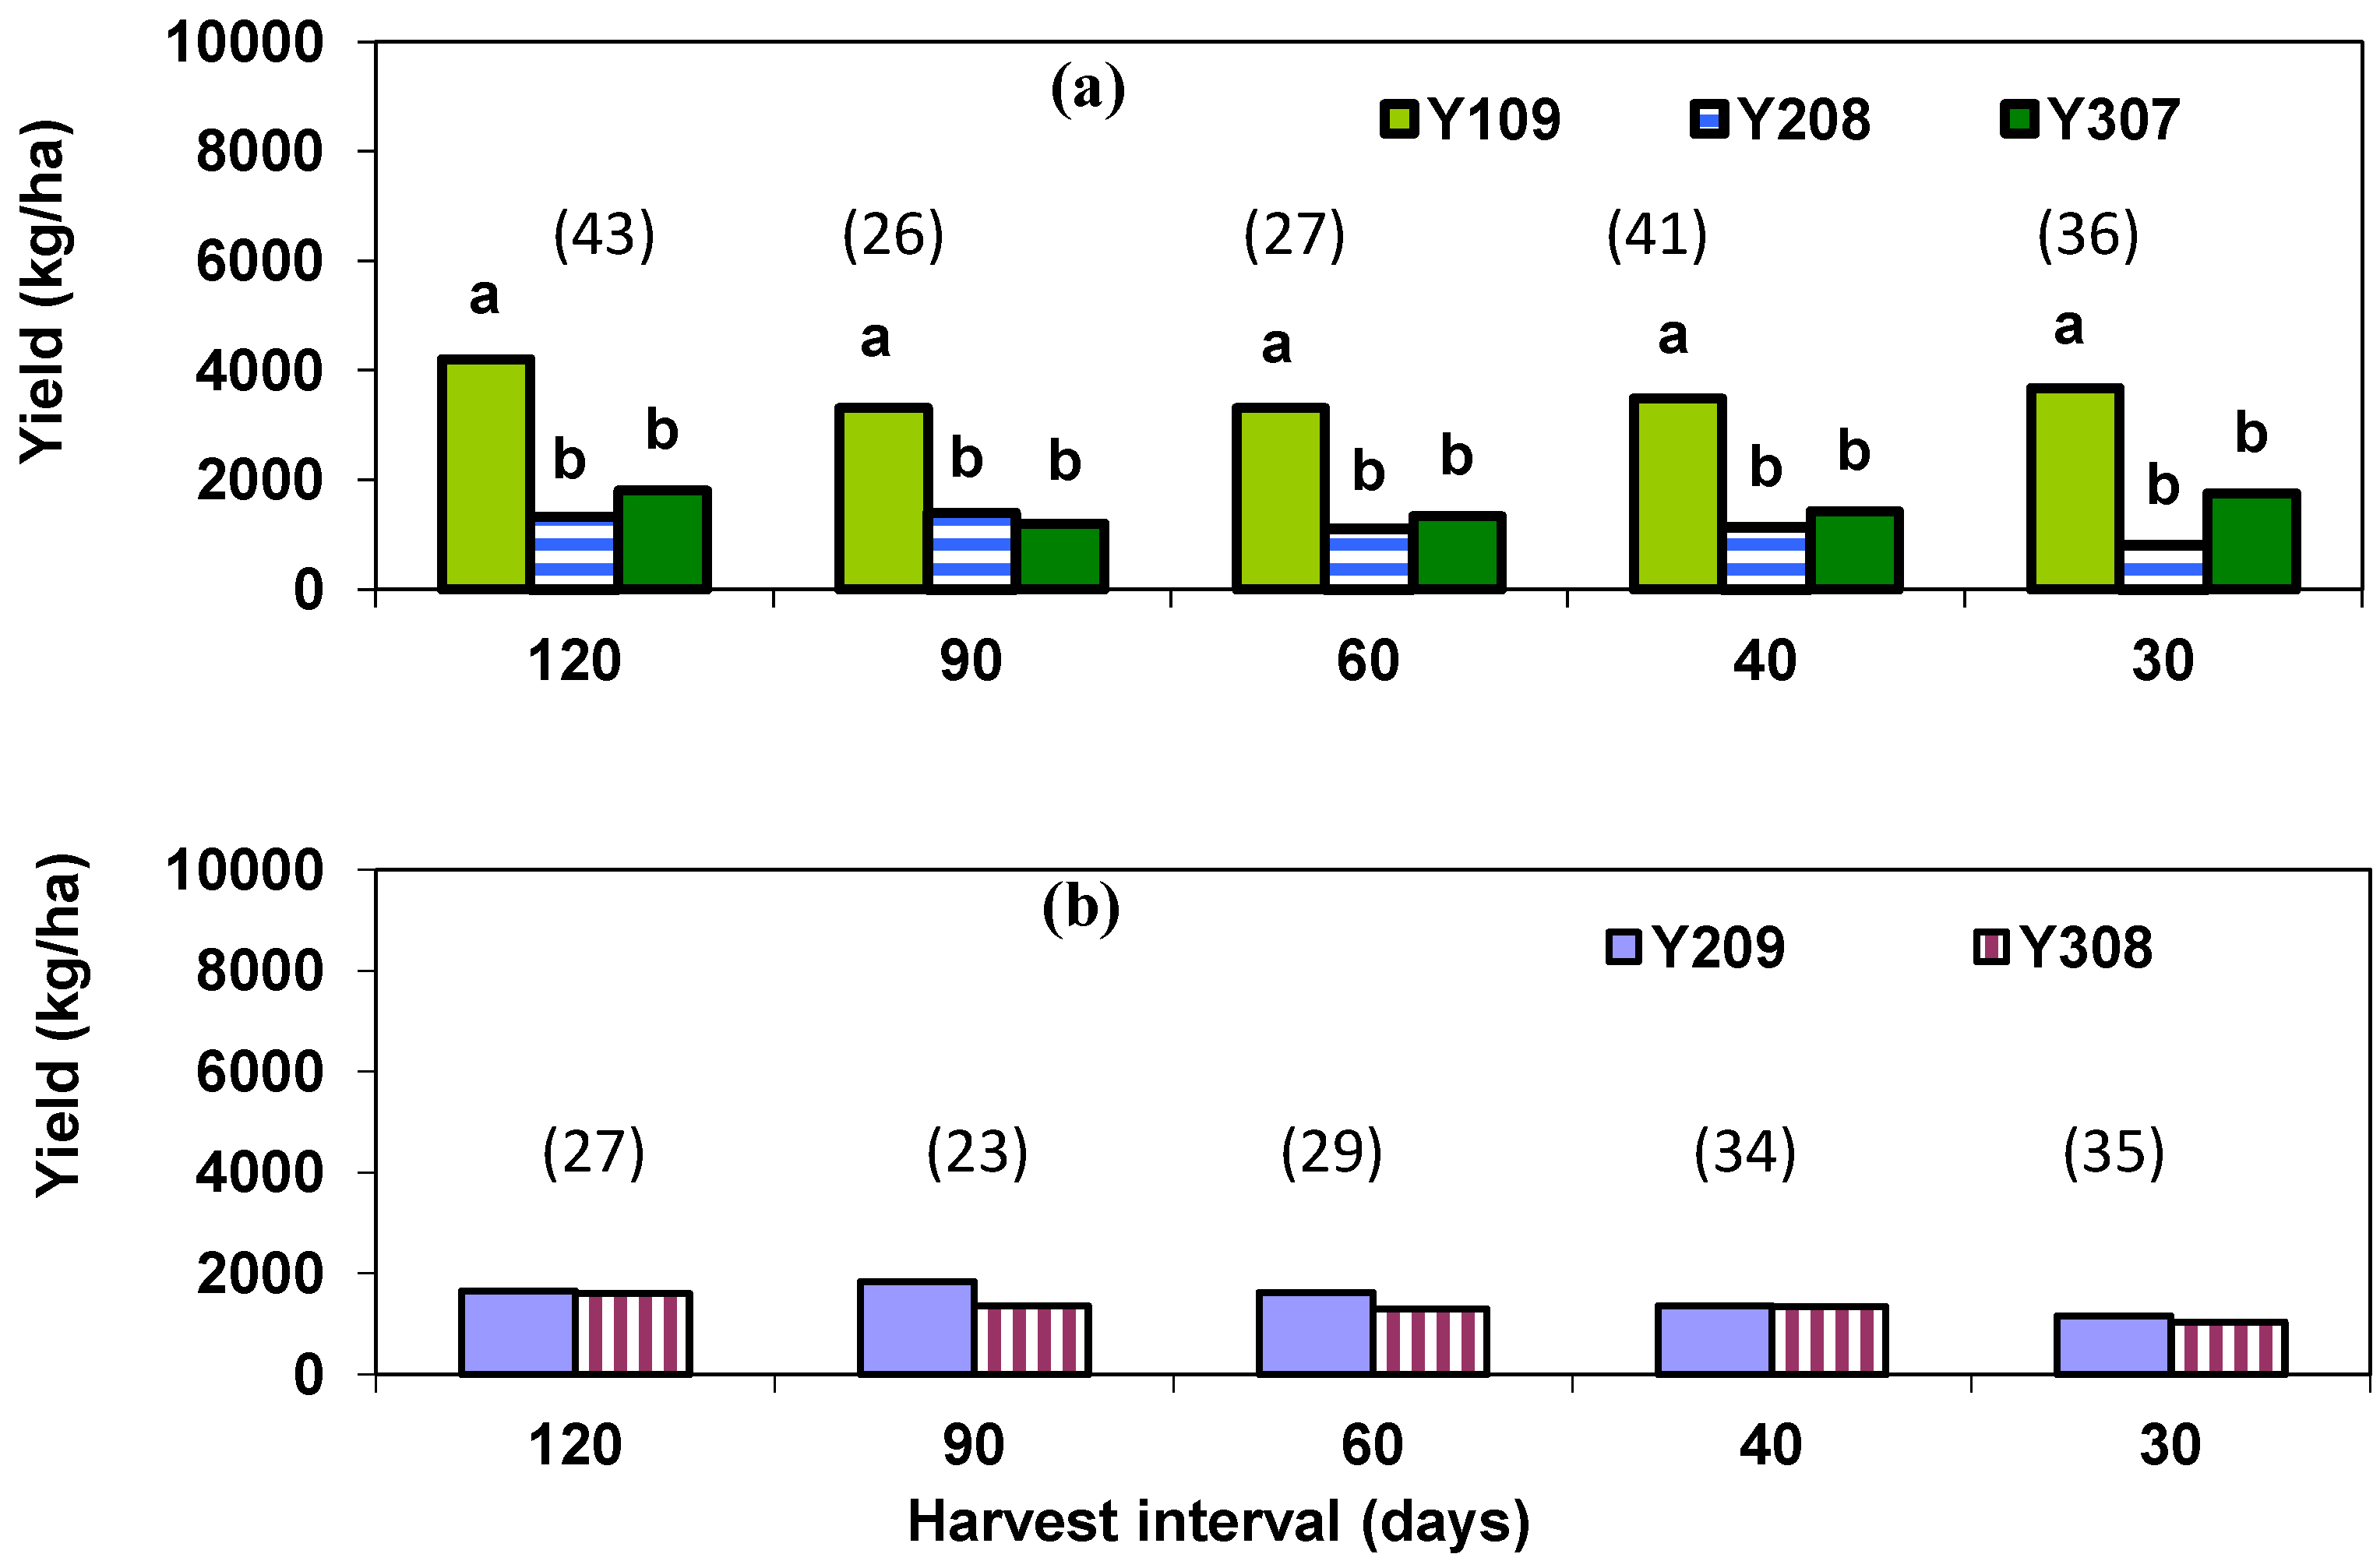
2.2.2. Post-Season Whole-Plot Recovery

Effects of harvest interval on stand health were assessed based on measured post-season recovery yields. Data on mid-May post-season yields in 2008 and 2009 were analyzed for effects of harvest interval and years in production. Advantage of this assessment was that even first-year plots had already experienced a full season of harvesting. Assessing cumulative yield on combined mid-May and June–September harvests would inflate tonnage because first-year plants had never been harvested.
Mid-May yield data from Y108 and Y207 harvested in 2008 and from Y109 and Y208 harvested in 2009 (Table 5) were compared. These post-season yields indicated no year or harvest interval effect, within harvest duration for both 2008 and 2009 seasons. This was probably attributable to sufficient early season rainfall amounts around the study area, which supported faster spring growth. In 2008, slightly more than 15 cm of rainfall were recorded in April and 10 cm in May while in 2009, the corresponding amounts were 11 and about 24 cm (Figure 1a).
Considering that harvesting was ended by 15–30 September and resumed in the next year from 13–21 May, the observed lack of harvest interval effects, for same years of production, could also result from: (1) Long recovery period in fall and following spring, that may have eliminated differences due to depletion of carbohydrate reserves. Usually, beyond 42 days of recovery, the negative effects of defoliation on basic allometric relations; root-to-shoot ratio and leaf area-to-weight ratio are offset [27]. In the study area, growth of the warm-season grasses started in late March to early April while harvesting started in mid-May; (2) Growth of opportunistic annual grasses and forbs in empty spaces may have compensated for the loss of yield due to previous defoliation intensity as reported for severely defoliated perennials [32]; (3) Crown expansion may also have increased for moderately defoliated perennial grasses as earlier workers have also reported [33]. In the current study, basal cover in May by perennial grasses was greater for 30- and 40-d than the 60-, 90-, and 120-d harvest intervals (data not shown).
Although harvest internals did not affect post-season recovery yields, in 2008 and 2009, differences due to number of years in production were observed (Table 5). In 2008, except for the 120-d harvest internal, yields in first-year plots (Y108) were greater (p < 0.01) by 52% (60-d,) to 65% (40-d) than in the corresponding second-year plots (Y207). Similarly, in 2009, mid-May yields in first-year plots (Y109, control) were greater (p < 0.01) than the second-year ones (Y208) by 58% or more (Table 5). These yield reductions were indicative of sustained negative effects of previous defoliation that may cause slower growth rates. Similar defoliation-related yield reductions have also been reported for SG [3], Caucasian bluestem [34], and LB [18].
Table 5. Effects of harvest interval and harvest-duration on post-season recovery yield per area of mixed native grass stands in mid-May of two consecutive years.
Harvest interval (days)Mid-May 2008Mid-May 2009
Y108§Y207p > FαY109Y208p > Fα
kg ha−1 kg ha−1
120 (2)#459628130.06094198 A1330 B0.0062
90 (2)5184 A††2049 B0.00503315 A1401 B0.0005
60 (3)5342 A2541 B0.00013309 A1107 B0.0002
40 (4)5284 A1849 B0.00233481 A1136 B0.0046
30 (5)4364 A1800 B0.00153675 A809 B0.0001
CV2639 3130
p > Fα0.6610.295 0.7070.106
Number of consecutive years a plot had been harvested; Stands of indiangrass (Sorghastrum nutans), big bluestem (Andropogon gerardii) and little bluestem (Schizachyrium scoparium); §Y108, Y109, Y207 and Y208 are plots in their first and second harvest year, established in 2008, 2009 and 2007, respectively; Probability that yields from Y108 and Y109 plots during the year differ significantly, α = 0.05; #Days between successive harvests with number of harvests per season in brackets; ††In a year, means followed by different uppercase letters within a row, differ significantly, α = 0.05; CV = coefficient of variation.
These reductions in post-season recovery yields, which reflect growth limitations associated with years of production, have practical implications with respect to changes in species composition of mixed native grass stands. Slow recovery by the perennial native grasses would likely leave room for establishment of forbs [2] and opportunistic annual grasses which would normally suffer competition for light in a healthy tallgrass stand. However, slow recovery may also favor legumes in the stand which usually improve soil fertility [30] and forage quality.

2.2.3. Implications on Yield Sustainability

Plot yield in mid-May of 2009 was used to investigate effects of harvest intervals on yield sustainability. Yields for plots in the first year of production (Y109, control) were compared to yields from plots that came into production in 2007 (Y307) and 2008 (Y208) (Figure 2). In mid-May of 2009, yields in plots on first year of production (Y109) were greater (p < 0.01) than those in second- (Y208) and third-year (Y307) plots. First year of production (Y109) yields averaged 3596 kg ha−1 while the second- (Y208) and third-year (Y307) averaged 1156 and 1506 kg ha−1, respectively, (Figure 2a). Usually, effects of defoliation on stand performance, regardless of the harvest interval, do impact the succeeding post-season growth [22]. Regrowth of defoliated grasses usually has smaller tiller size and less tiller dry weight than undefoliated ones [17,22,26]. This likelihood of lesser yield of previously defoliated plants, relative to their undefoliated counterparts, could explain the observed yield differences due to harvest duration in this study. However, after the first-year yield depression, no further yield difference in the third year was observed from second-year defoliation. In fact, during mid-May harvest of 2010, lack of effect of second-year defoliation on third-year yield was observed (Figure 2b).
Figure 2. Post-season recovery yield of (a) first-, second- and third-year plots on 21 May 2009 and (b) second- and third-year plots on 25 May 2010. Above each group of bars, numbers in brackets are the coefficients of variation due to harvest duration within respective harvest intervals. Bars bearing different uppercase letters indicate significant yield differences at α = 0.05.
Agronomy 04 00090 g002
This lack of yield difference after the second-year of defoliation may imply that: (1) Continuous defoliation resulted in greater grass coverage (increased tiller density) and reduced proportion of forbs; (2) While proportions of the dominant tall-growing forbs; goldenrod (Solidago canadensis L.), ragweed (Ambrosia trifida L.), annual marsh elder (Iva annua L.), and maximilian sunflower (Helianthus maximiliani Schrad.), in Y208 were kept small by harvesting, their growth in the Y307 plots was likely reduced by both depletion of top soil seed bank and competition from increased grass tiller density; and (3) After two consecutive harvest years, tiller coverage of perennial grasses increased and resulted in more grass yield per unit area, which partly compensated for reduced yield plant−1.
It seems that during the two years of complete harvest cycles, the mixed stands attained a stable performance level, substantially less than that of stands not previously harvested. This suggested that recovery of the perennial grass stands, from previous defoliation, needed more than just a longer growing period in spring. The observed yield depression of about 50%, due to previous defoliation, necessitates strategic management to boost growth of desirable species in previously defoliated stands if two-year continuous forage harvesting is preferred. Similar observations were made for the May harvest of 2010, for Y209 and Y308, and the data substantiated the above assertion.
Spring burning effect, a practice that may influence recovery growth of mixed NWSG stands, was noted during the spring of 2010. An unplanned fire engulfed most experimental plots, damaged the early growing warm-season forbs and cleared standing dead biomass in both Y209 and Y308 plots. In the absence of opportunistic forbs and standing dead biomass following a spring-fire, one would expect less mid-May yield from Y308, than Y209 in 2010, but there was no difference. Usually, more forbs would grow where previously defoliated perennials exhibit slower growth rates. In the previous year, with no accidental spring-fire, yields of Y208 and Y307 were also not different. This suggested that, in 2010, spring growth was faster following the improved light access in the absence of negative effect of the standing dead biomass. It is also likely that spring-burning released mineral nutrients to support the new growth, similar to comparable findings in literature [35,36]. Additionally, post-burning dark coloration of the soil surface usually causes earlier warming of soils [37] to induce early spring growth. A controlled study on combined effects of spring-burning and harvest duration on recovery of mixed NWSG stands in the study area may add valuable information on their management.

3. Experimental Section

3.1. Study Location and Field Layout

This study was conducted at Bryan Farms, Clay County, (N33°39; W88°34) Mississippi, USA, in unfertilized conservation field buffers planted with mixed NWSGs, at their early-succession stages. Dominant soils in the study area are Griffith silty clay, classified as Fine, smectitic, thermic Aquic Hapludert with pH ranging from 5.0 to 5.6 and Okolona silty clay, classified as Fine, smectitic, thermic Oxyaquic Hapludert with pH range of 6.0 to 7.8. A seed mixture of 1.12 kg BB, 2.24 kg LB, and 1.12 kg IG per hectare of prepared seedbed was sown in 2005, and allowed to grow undisturbed for two years. Extended post-emergence herbicide (imazapic at 0.28 kg a.i ha−1) {(±)-2-[4,5-dihydro-4-methyl-4-(1-methylethyl)-5-oxo-1H-imidazol-2-yl]-5-methyl-3-pyridinecarboxylic acid} was applied to control competitive weeds. In late spring of 2007, five 7.5 × 1-m parallel strips, at least 3 m apart were randomly assigned to five, four, and three harvests, including the equalizing mid-May harvest, at 30-, 40-, and 60-d intervals, respectively, or only two harvests at 90- or 120-d interval (Figure 3), giving five harvest intervals per block. The 90-d interval mimicked a standard practice of harvesting a hay crop early in the growing season, and then stockpiling the regrowth for late-season grazing or conservation uses. In a randomized complete block design, these five harvest intervals were replicated in five blocks, three in two buffers of one crop field and two in another field, about 5 km away, on similar soils.
Figure 3. Plot arrangements in one of five replications, showing the establishment sequence. Five first-year plots (Y1) established in mid-May from 2007 to 2009, each 7.5 m long and 1 m wide, separated by 90-cm alleys were assigned to 30-, 40-, 60-, 90-, and 120-d harvest intervals. In each year, plots were labeled Y1, Y2, or Y3 indicating plots beginning their first, second and third harvest year, respectively. In each plot one indiangrass (IG) and one little bluestem (LB) plant was marked for monitoring yield per plant by species.
Agronomy 04 00090 g003
During the spring of 2008, other 7.5 × 1-m plots were marked next to each previous-year plot with 90-cm alleys between the first- and second-year plots for each harvest interval. Plots harvested first in 2007 were designated Y207, indicating they were in their second harvest year (Y2), but started in 2007 (07). Plots harvested first in 2008 adjacent to Y207 plots were designated Y108, indicating they were in their first harvest year (Y1), and started in 2008 (08). In 2009, a third set of five 7.5 × 1-m, plots separated by 90-cm alleys were marked on one end of each block; a total of three plots per harvest interval per block. Plots started in 2009, were designated Y109 while the Y108 ones were re-designated Y208 and the Y207 became Y307 (Figure 3). In spring of 2009, the Y307 plots were harvested only once, in May, to assess post-season recovery and then removed from the harvest regime. To avoid shedding, plants in the separating alleys next to harvested plots were also trimmed to the same height, using a hand-held weed eater on each harvested day.

3.2. Measurements of Forage Yield

In mid-May of each year, all plots received a common/equalizing harvest, after which regrowth was harvested on assigned dates throughout the summer (Figure 4). Occasionally, harvesting was hastened by one to two, or delayed for up to six days to avoid major rainfall events (Figure 4), thus allowing optimum machine operation. Whole-plot forage (7.5 × 1-m) was harvested by a 1.0 m wide Carter Flail Forage Harvester (Carter Manufacturing Company, Inc.; Brookston, IN, USA). Prior to harvesting each whole-plot, one previously marked IG (tall-growing) and LB (short-growing) plant, randomly selected along the plot mid-line, was hand-clipped at 10 cm stubble height for determination of species yield.
Figure 4. Actual harvest dates by treatment and year. Weeks in a month. Days between successive harvests with total harvests per year, including the equalizing May-harvest, in brackets. §Actual harvest date for the indicated treatment (TRT) in the respective year.
Agronomy 04 00090 g004
The same marked plants were used on subsequent harvest days. In the interest of time, BB was excluded in species yield assessment. At harvest, fresh whole-plot forage weight was recorded and a representative sample collected from each plot. For each species and plot, hand-clipped materials and whole-plot samples were weighed in the field and later dried in a forced-air oven at 65 °C to constant weight for moisture content determination and further lab analyses. Based on the determined moisture contents, respective dry weights of hand-clipped plant material were obtained and that of whole-plot estimated. For each plot, clipped dry-weights of IG and LB were added to that harvested by carter to obtain whole-plot weight, expressed in terms of kg DM ha−1. Plot yields, after the equalizing May harvest, were combined to produce cumulative (June–September) season yield. Mid-May harvests were only used to assess treatment effects on stand recovery.

3.3. Data Analyses

Data were organized and analyzed for effects of harvest interval, harvest year, and number of years in production, on yield. The latter compared yields of first- and second-year plots assigned to a harvest interval, within a harvest year. Data were subjected to analysis of variance (ANOVA) in a randomized complete block design with harvest intervals, species, year, and harvest duration as fixed effects in five replications, using the general linear model of SAS Institute [38]. Due to harvest interval × harvest duration × year interaction, ANOVA for the 2008 and 2009 data sets were run separately. Analyses for the June–September (cumulative) and succeeding mid-May (recovery) harvests were also done separately. Means separation was by Fisher’s protected least significant difference (LSD) and were declared different at α = 0.05.

4. Conclusions

These results show that mixed NWSG stands dominated by BB, IG, and LB have the potential to improve summer forage production under similar growing conditions, if rotational harvest systems (defined below) are employed. However, since the study did not compare these native grasses with their conventional warm-season counterparts in the area, the data only shows how similar mixed stands may respond to comparable harvest regimes. Although the current results indicate that the studied harvest intervals may not influence cumulative yield plant−1 for IG and LB in unfertilized mixed stands, harvesting for two consecutive years may cause notable yield reductions especially in years with uneven rainfall distribution. Data shows that the first mid-May harvest yield plant−1 for IG and LB in previously harvested mixed stands may decline by over 70%, when compared to never harvested plants, but may not differ due to harvest intervals. In comparable growing conditions, and without fertilizers, harvesting similar mixed NWSG stands at 30- to 40-d intervals may maximize first year cumulative yields, but differences in weather may lead to about 40% yield decrease for stands in their second harvest-year. Stand recovery as indicated by yield at first harvest in mid-May was not affected by harvest intervals imposed in the preceding year but yields were lesser in previously harvested stands by over 50%. To maintain desirable species composition and sustain forage production, producers will need to establish a rotational harvest system allowing for at least one-year recovery period following every two complete harvest years. More studies on effects of different patterns of haying and fallow within the same harvest season as well as effects of other management practices, including spring-burning and fertilizer application, are also needed.

Acknowledgments

We are grateful to USDA NRCS Agriculture Wildlife Conservation Center for funding the research, B. Bryan Farms for allowing us to do the research on their property, the Department of Plant and Soil Sciences, Mississippi State University, and the Agricultural Research Station, Virginia State University, for various logistic, technical and moral supports provided during the research and while writing the manuscript.

Conflicts of Interest

The authors declare no conflict of interest.

References

  1. Shea, A.B. The Return of Native Grasses to Tennessee. 1999. Available online: http://www.tn.gov/environment/conservationist/archive/grass.htm (accessed on 12 August 2009).
  2. Jones, J.; Coggin, D.S.; Cummins, J.L.; Hill, J. Restoring and Managing Native Prairies; A Handbook for Mississippi Landowners; Wildlife Mississippi: Starkville, MS, USA, 2007. [Google Scholar]
  3. Kiss, Z.; Fieldsend, A.F.; Wolf, D.D. Yield of switchgrass (Panicum virgatum L.) as influenced by cutting management. Acta Agron. Hung. 2007, 55, 227–233. [Google Scholar] [CrossRef]
  4. Mulkey, V.R.; Owens, V.N.; Lee, D.K. Management of warm-season grass mixtures for biomass production in South Dakota USA. Bioresour. Technol. 2008, 99, 609–617. [Google Scholar] [CrossRef]
  5. Jung, G.A.; Griffin, J.L.; Kocher, R.E.; Shaffer, J.A.; Gross, C.F. Performance of switchgrass and bluestem cultivars mixed with cool-season species. Agron. J. 1985, 77, 846–850. [Google Scholar] [CrossRef]
  6. Angima, S.D.; Kallenbach, R.L.; Riggs, W.W. Optimizing hay yield under lower nitrogen rates for selected warm-season forages. J. Integr. Biosci. 2009, 7, pp. 1–6. Available online: http://altweb.astate.edu/electronicjournal/Articles/Angima.pdf (accessed on 20 July 2010).
  7. Huang, B. Roots and drought resistance. Golf Course Manag. 1997, 65, 55–59. [Google Scholar]
  8. Dahl, B.E. Developmental Morphology of Plants. In Wildland Plants: Physiological Ecology and Developmental Morphology; Bedunan, D., Sosobee, R., Eds.; Soc. Range Manage: Denver, CO, USA, 1995; pp. 22–58. [Google Scholar]
  9. Coughenour, M.B. Graminoid responses to grazing by large herbivores: Adaptations, exaptations, and interacting processes. Ann. Mo. Bot. Gard. 1985, 72, pp. 852–863. Available online: http://www.jstor.org/stable/2399227 (accesses on 8 January 2014).
  10. Boschma, S.P.; Hill, M.J.; Scott, J.M.; Rapp, G.G. The response to moisture and defoliation stresses, and traits for resilience of perennial grasses on the Northern Tablelands of New South Wales, Australia. Aust. J. Agric. Res. 2003, 54, 903–916. [Google Scholar] [CrossRef]
  11. Chaves, M.M.; Maroco, J.P.; Pereira, J.S. Understanding plant responses to drought—From genes to the whole plant. Funct. Plant Biol. 2003, 30, 239–264. [Google Scholar] [CrossRef]
  12. Craine, J.M.; Ocheltree, T.W.; Nippert, J.B.; Towne, E.G.; Skibbe, A.M.; Kembel, S.W.; Fargione, J.E. Global diversity of drought tolerance and grassland climate-change resilience. Nat. Clim. Chang. 2012, 3, pp. 63–67. Available online: http://www.readcube.com/articles/10.1038/NCLIMATE1634 (accessed on 8 January 2014).
  13. Manske, L.L. General Description of Grass Growth and Development and Defoliation Resistance Mechanisms; Range Management Report DREC 98-1022; North Dakota State University, Dickinson Research Extension Center: Dickinson, ND, USA, 1998. [Google Scholar]
  14. Noy-Meir, I. Compensating growth of grazed plants and its relevance to the use of rangelands. Ecol. Appl. 1993, 3, 32–34. [Google Scholar] [CrossRef]
  15. Belsky, A.J.; Carson, W.P.; Jensen, C.L.; Fox, G.A. Overcompensation by plants: Herbivore optimization or red herring? Evol. Ecol. 1993, 7, 109–121. [Google Scholar] [CrossRef]
  16. Garay, A.H.; Matthew, C.; Hodgson, J. Tiller size/density compensation in perennial ryegrass miniature swards subject to differing defoliation heights and a proposed productivity index. Grass Forage Sci. 1999, 54, 347–356. [Google Scholar] [CrossRef]
  17. Ferraro, D.O.; Oesterheld, M. Effect of defoliation on grass growth. A quantitative review. Oikos 2002, 98, 125–133. [Google Scholar] [CrossRef]
  18. Mullahey, J.J.; Waller, S.S.; Moser, L.E. Defoliation effects on production and morphological development of little bluestem. J. Range Manag. 1990, 43, 497–500. [Google Scholar] [CrossRef]
  19. Forwood, J.R.; Magai, M.M. Clipping frequency and intensity effects on big bluestem yield, quality, and persistence. J. Range Manag. 1992, 45, 554–559. [Google Scholar] [CrossRef]
  20. Anderson, V.J.; Briske, D.D. Herbivore-induced species replacement in grasslands: Is it driven by herbivory tolerance or avoidance? Ecol. Appl. 1995, 5, 1014–1024. [Google Scholar] [CrossRef]
  21. Oesterheld, M.; McNaughton, S.J. Effect of stress and time for recovery on the amount of compensatory growth after grazing. Oecologia (Berlin) 1991, 85, 305–313. [Google Scholar] [CrossRef]
  22. Lee, W.G.; Fenner, M.; Loughnan, A.; Lloyd, K.M. Long-term effects of defoliation: Incomplete recovery of a New Zealand alpine tussock grass, Chionochloa pallens, after 20 years. J. Appl. Ecol. 2000, 37, 348–355. [Google Scholar] [CrossRef]
  23. Turner, C.L.; Seastedt, T.R.; Dyer, M.I. Maximization of aboveground grassland production: The role of defoliation frequency, intensity, and history. Ecol. Appl. 1993, 3, 175–186. [Google Scholar] [CrossRef]
  24. Meyer, G.A. Mechanisms promoting recovery from defoliation in goldenrod (Solidago altissima). Botany 1998, 76, 450–459. [Google Scholar] [CrossRef]
  25. N’Guessan, M.; Hartnett, D.C. Differential responses to defoliation frequency in little bluestem (Schizachyrium scoparium) in tallgrass prairie: Implications for herbivory tolerance and avoidance. Plant Ecol. 2011, 212, 1275–1285. [Google Scholar] [CrossRef]
  26. Vinton, M.A.; Hartnett, D.C. Effects of bison grazing on Andropogon gerardii and Panicum virgatum in burned and unburned tallgrass paririe. Oecologia (Berlin) 1992, 90, 374–382. [Google Scholar] [CrossRef]
  27. Oesterheld, M. Effect of defoliation intensity on aboveground and belowground relative growth rates. Oecologia (Berlin) 1992, 92, 313–316. [Google Scholar] [CrossRef]
  28. Donaghy, D.J.; Fulkerson, W.J. Priority for allocation of water-soluble carbohydrate reserves during regrowth of Lolium perenne. Grass Forage Sci. 1998, 53, 211–218. [Google Scholar]
  29. Hannaway, D.B.; Hannaway, K.J.; Sohn, P.; Griffith, S.; Wycoff, H. Grass Growth and Regrowth for Improved Management. 2000. Available online: http://www.fsl.orst.edu/forages/projects/regrowth/main.cfm?PageID=7 (accessed on 30 August 2008).
  30. Havlin, J.L.; Beaton, J.D.; Tisdale, S.L. Soil Fertility and Fertilizers: An Introduction to Nutrient Management, 7th ed.; Pearson Education, Inc.: Upper Saddle River, NJ, USA, 2005. [Google Scholar]
  31. Brady, N.C.; Weil, R.R. The Nature and Properties of Soils, 14th ed.; Pearson Education, Inc.: Upper Saddle River, NJ, USA, 2008; pp. 1–31. [Google Scholar]
  32. Scheneiter, O.; Matthew, C.; Rimieri, P. The effect of defoliation management on tiller dynamics of prairie grass. Rev. Argent. Prod. Anim. 2008, 28, 7–20. [Google Scholar]
  33. Archer, S. The effects of defoliation and competition on regrowth of tillers of two North American mixed-grass prairie graminoids. Oikos 1984, 43, 351–357. [Google Scholar] [CrossRef]
  34. Anderson, B.; Matches, A.G. Forage yield, quality, and persistence of switchgrass and caucasian bluestem. Agron. J. 1983, 75, 119. [Google Scholar] [CrossRef]
  35. Christensen, N.L. Fire and soil-plant nutrient relations in a pine-wiregrass savanna on the coastal plain of North Carolina. Oecologia (Berlin) 1977, 31, 27–44. [Google Scholar] [CrossRef]
  36. Davies, K.W.; Bates, J.D.; Miller, R.F. Short-term effects of burning Wyoming big sagebrush steppe in southeast Oregon. Rangel. Ecol. Manag. 2007, 60, 515–522. [Google Scholar] [CrossRef]
  37. Bremer, D.J.; Ham, J.M. Effect of spring burning on the surface energy balance in a tallgrass prairie. Agric. For. Meteorol. 1999, 97, 43–54. [Google Scholar] [CrossRef]
  38. SAS Institute. SAS Version 9.2, SAS Institute: Cary, NC, USA, 2007.

