Genome-Wide Linkage Mapping of Quantitative Trait Loci for Late-Season Physiological and Agronomic Traits in Spring Wheat under Irrigated Conditions


Abstract
:1. Introduction
2. Materials and Methods
2.1. Plant Materials and Field Experiments
2.2. Phenotypic Evaluation
2.3. Phenotypic Data Analysis
2.4. SNP Genotyping and Molecular Marker Analysis
2.5. Linkage Map Construction and QTL Analysis
3. Results
3.1. Phenotypic Evaluation
3.2. Correlation between Traits
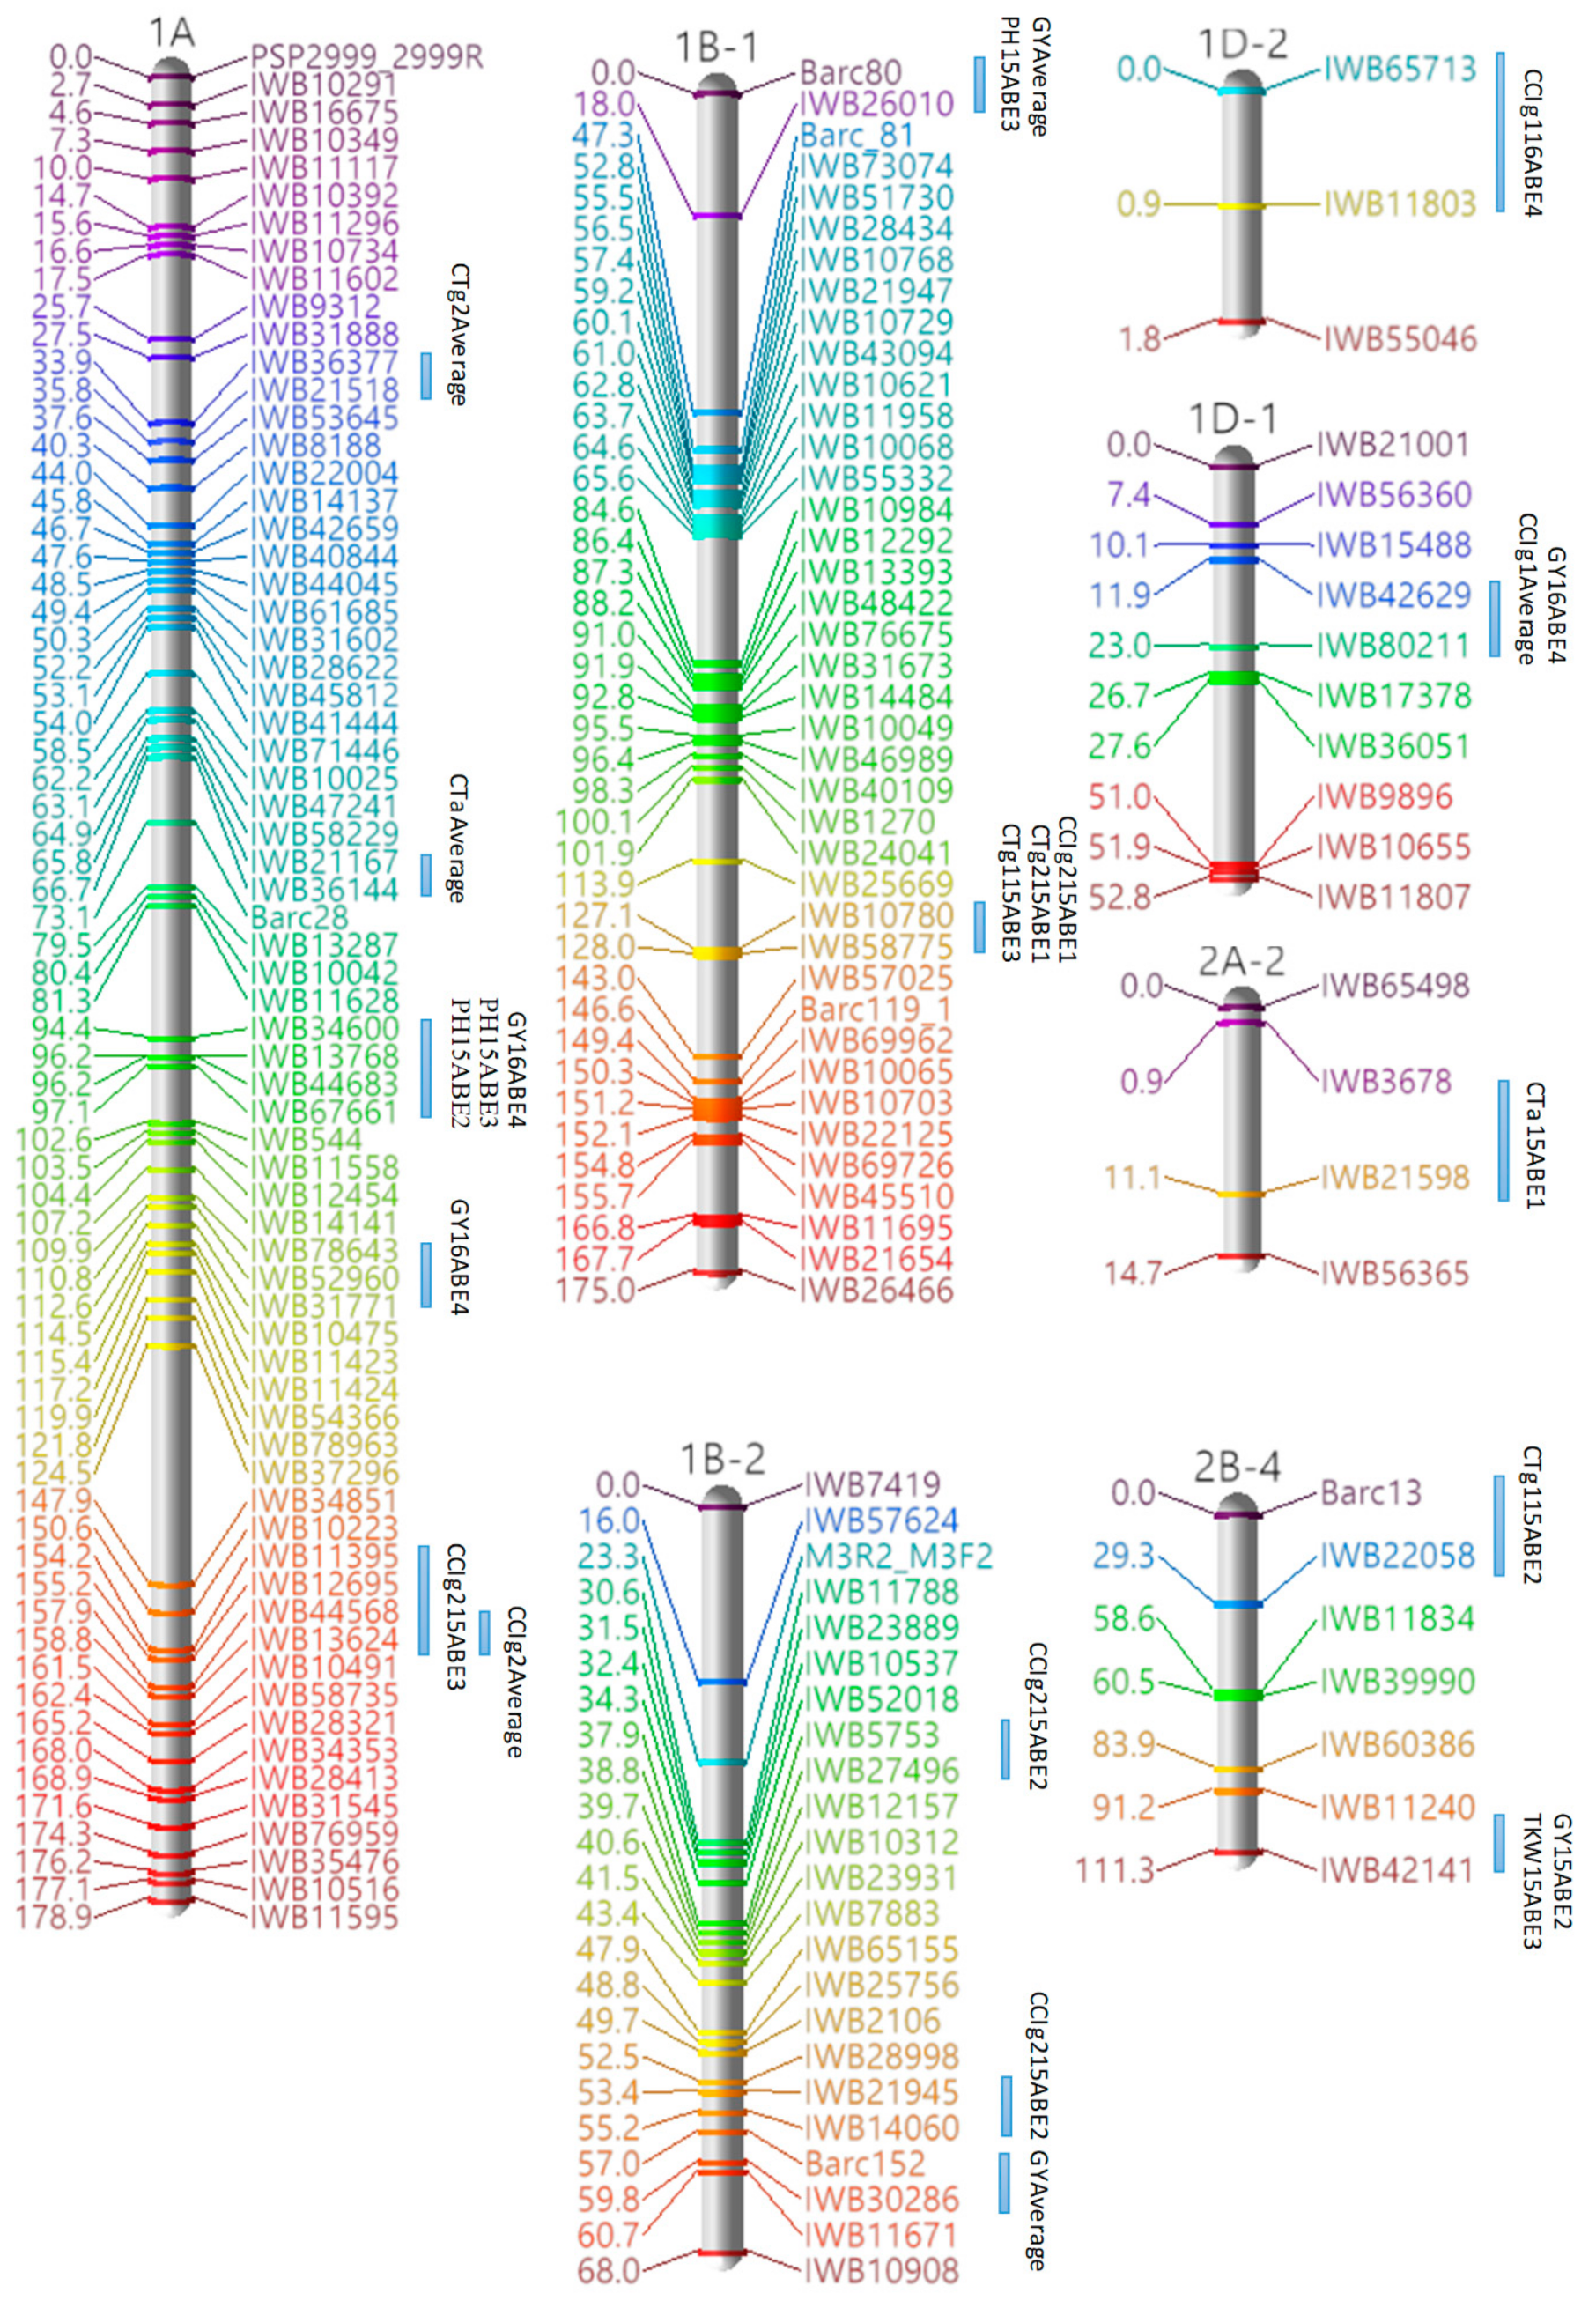
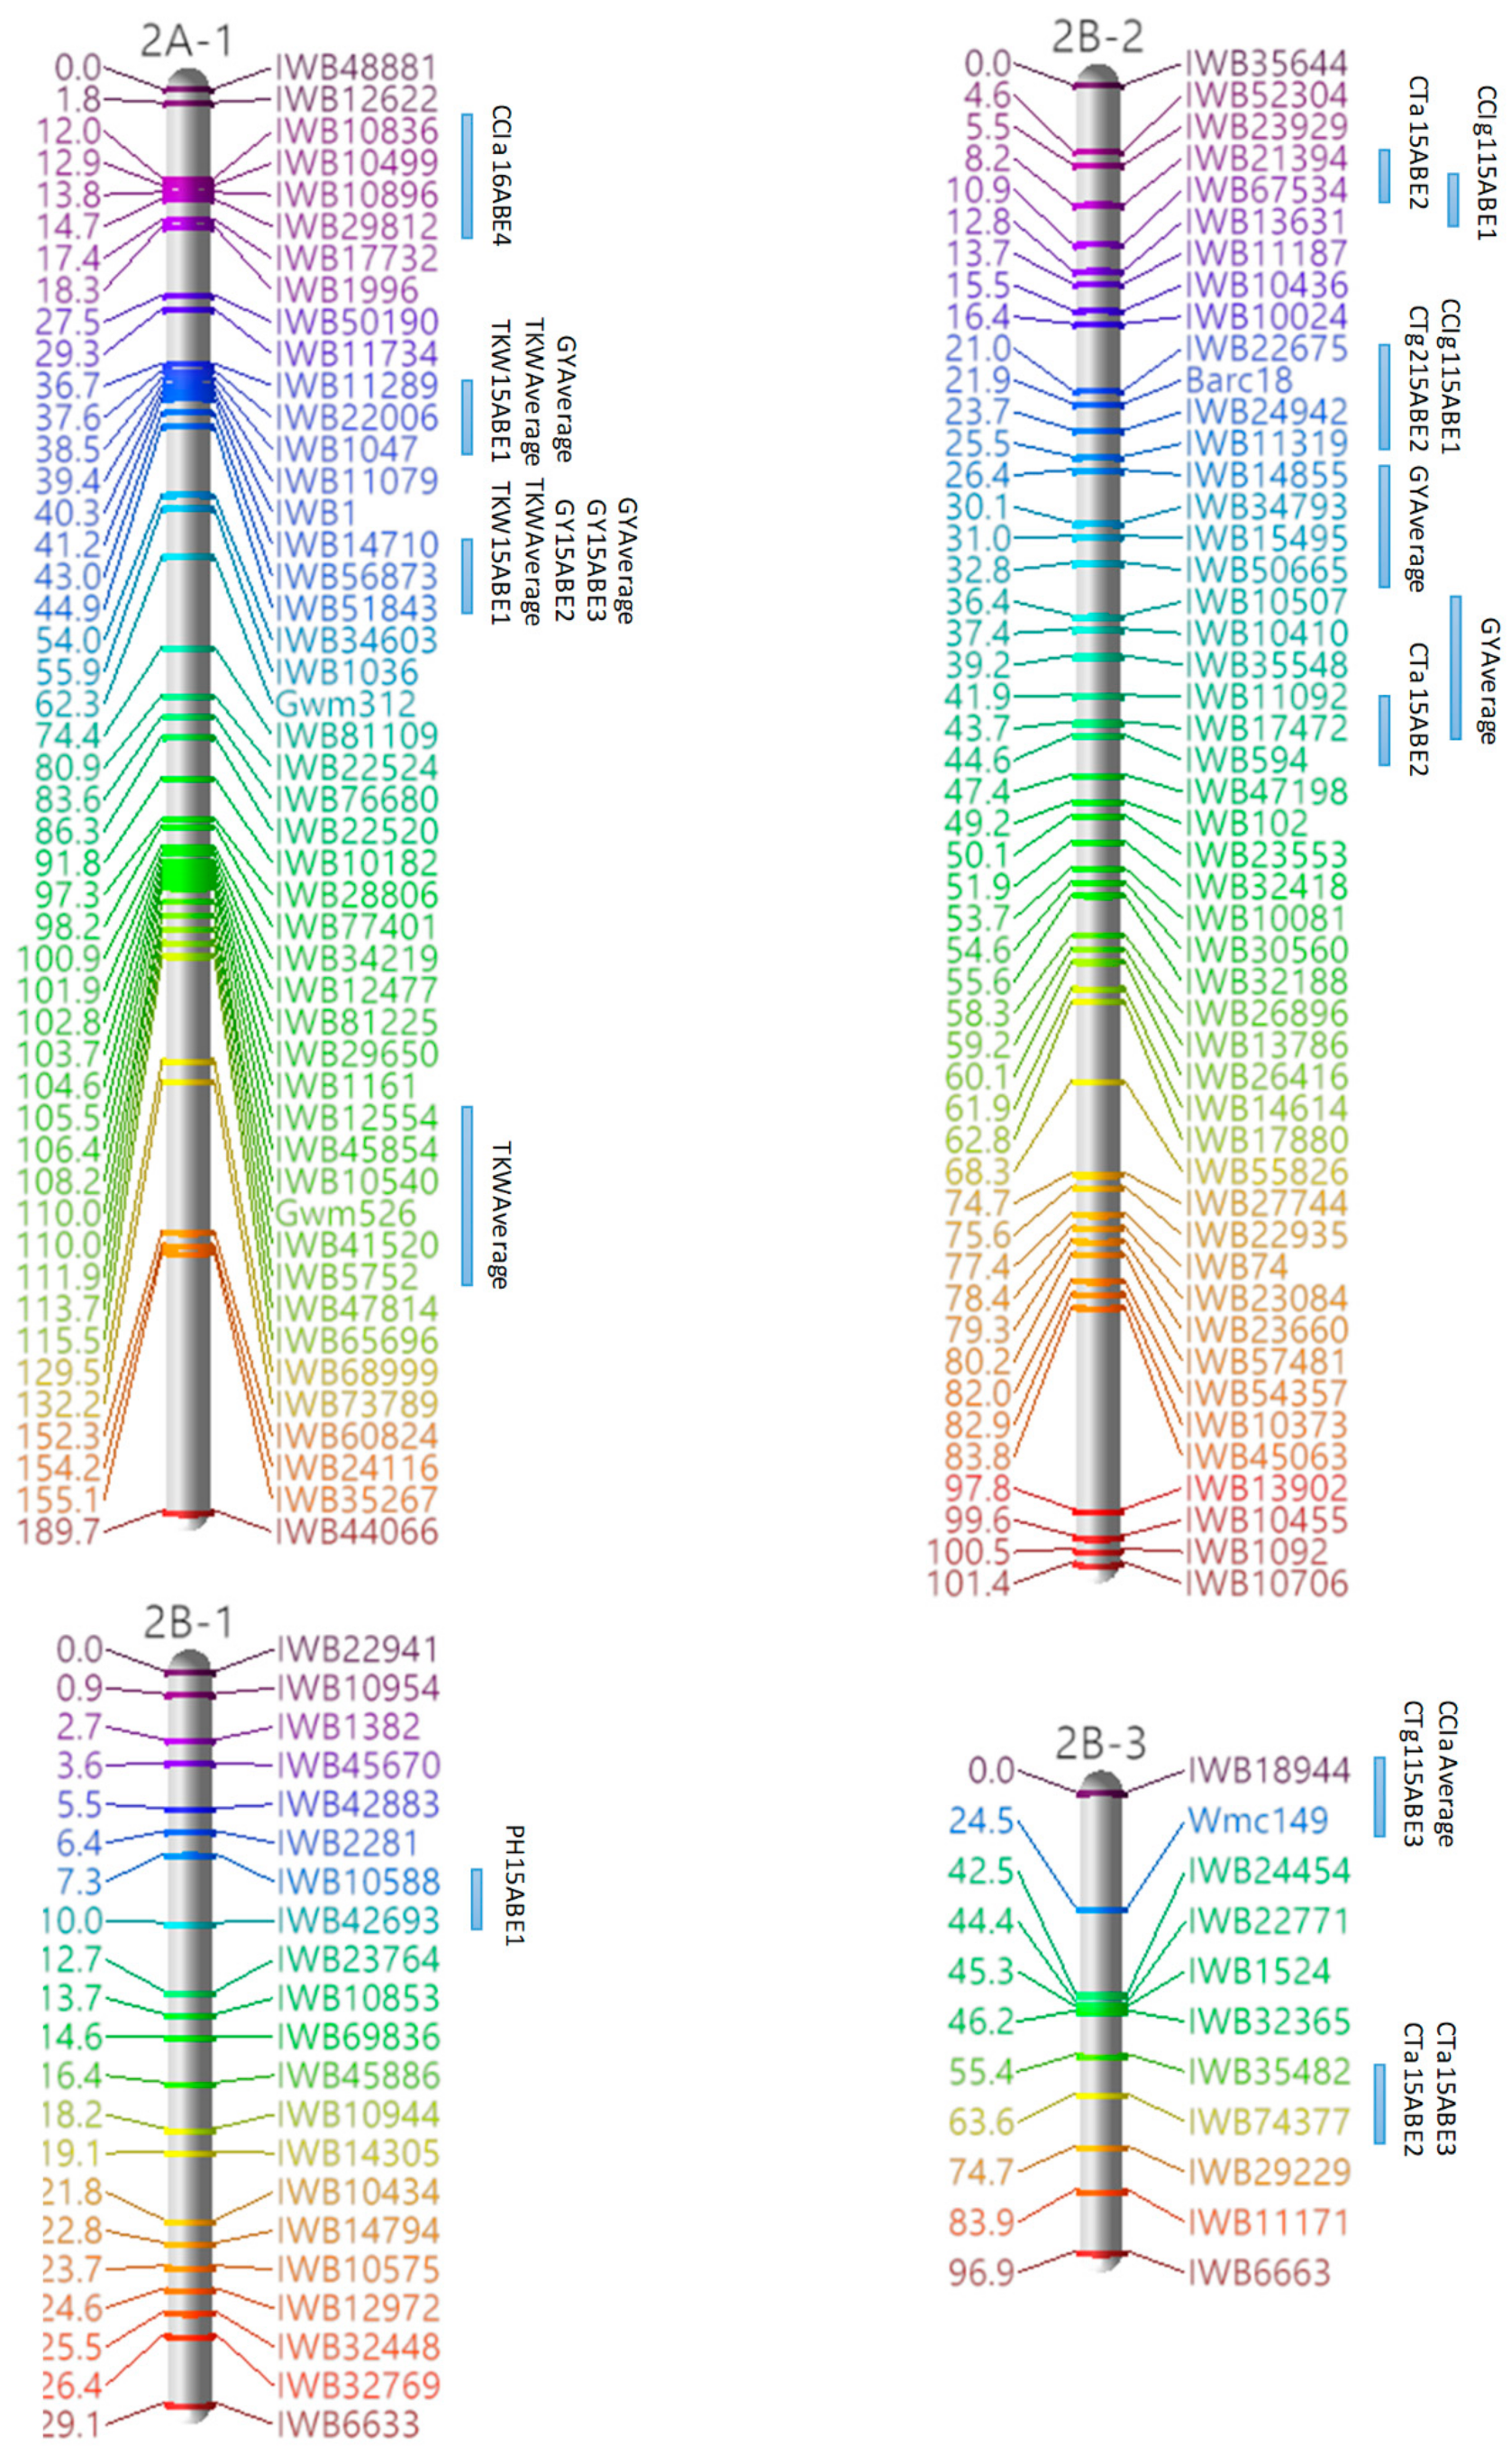
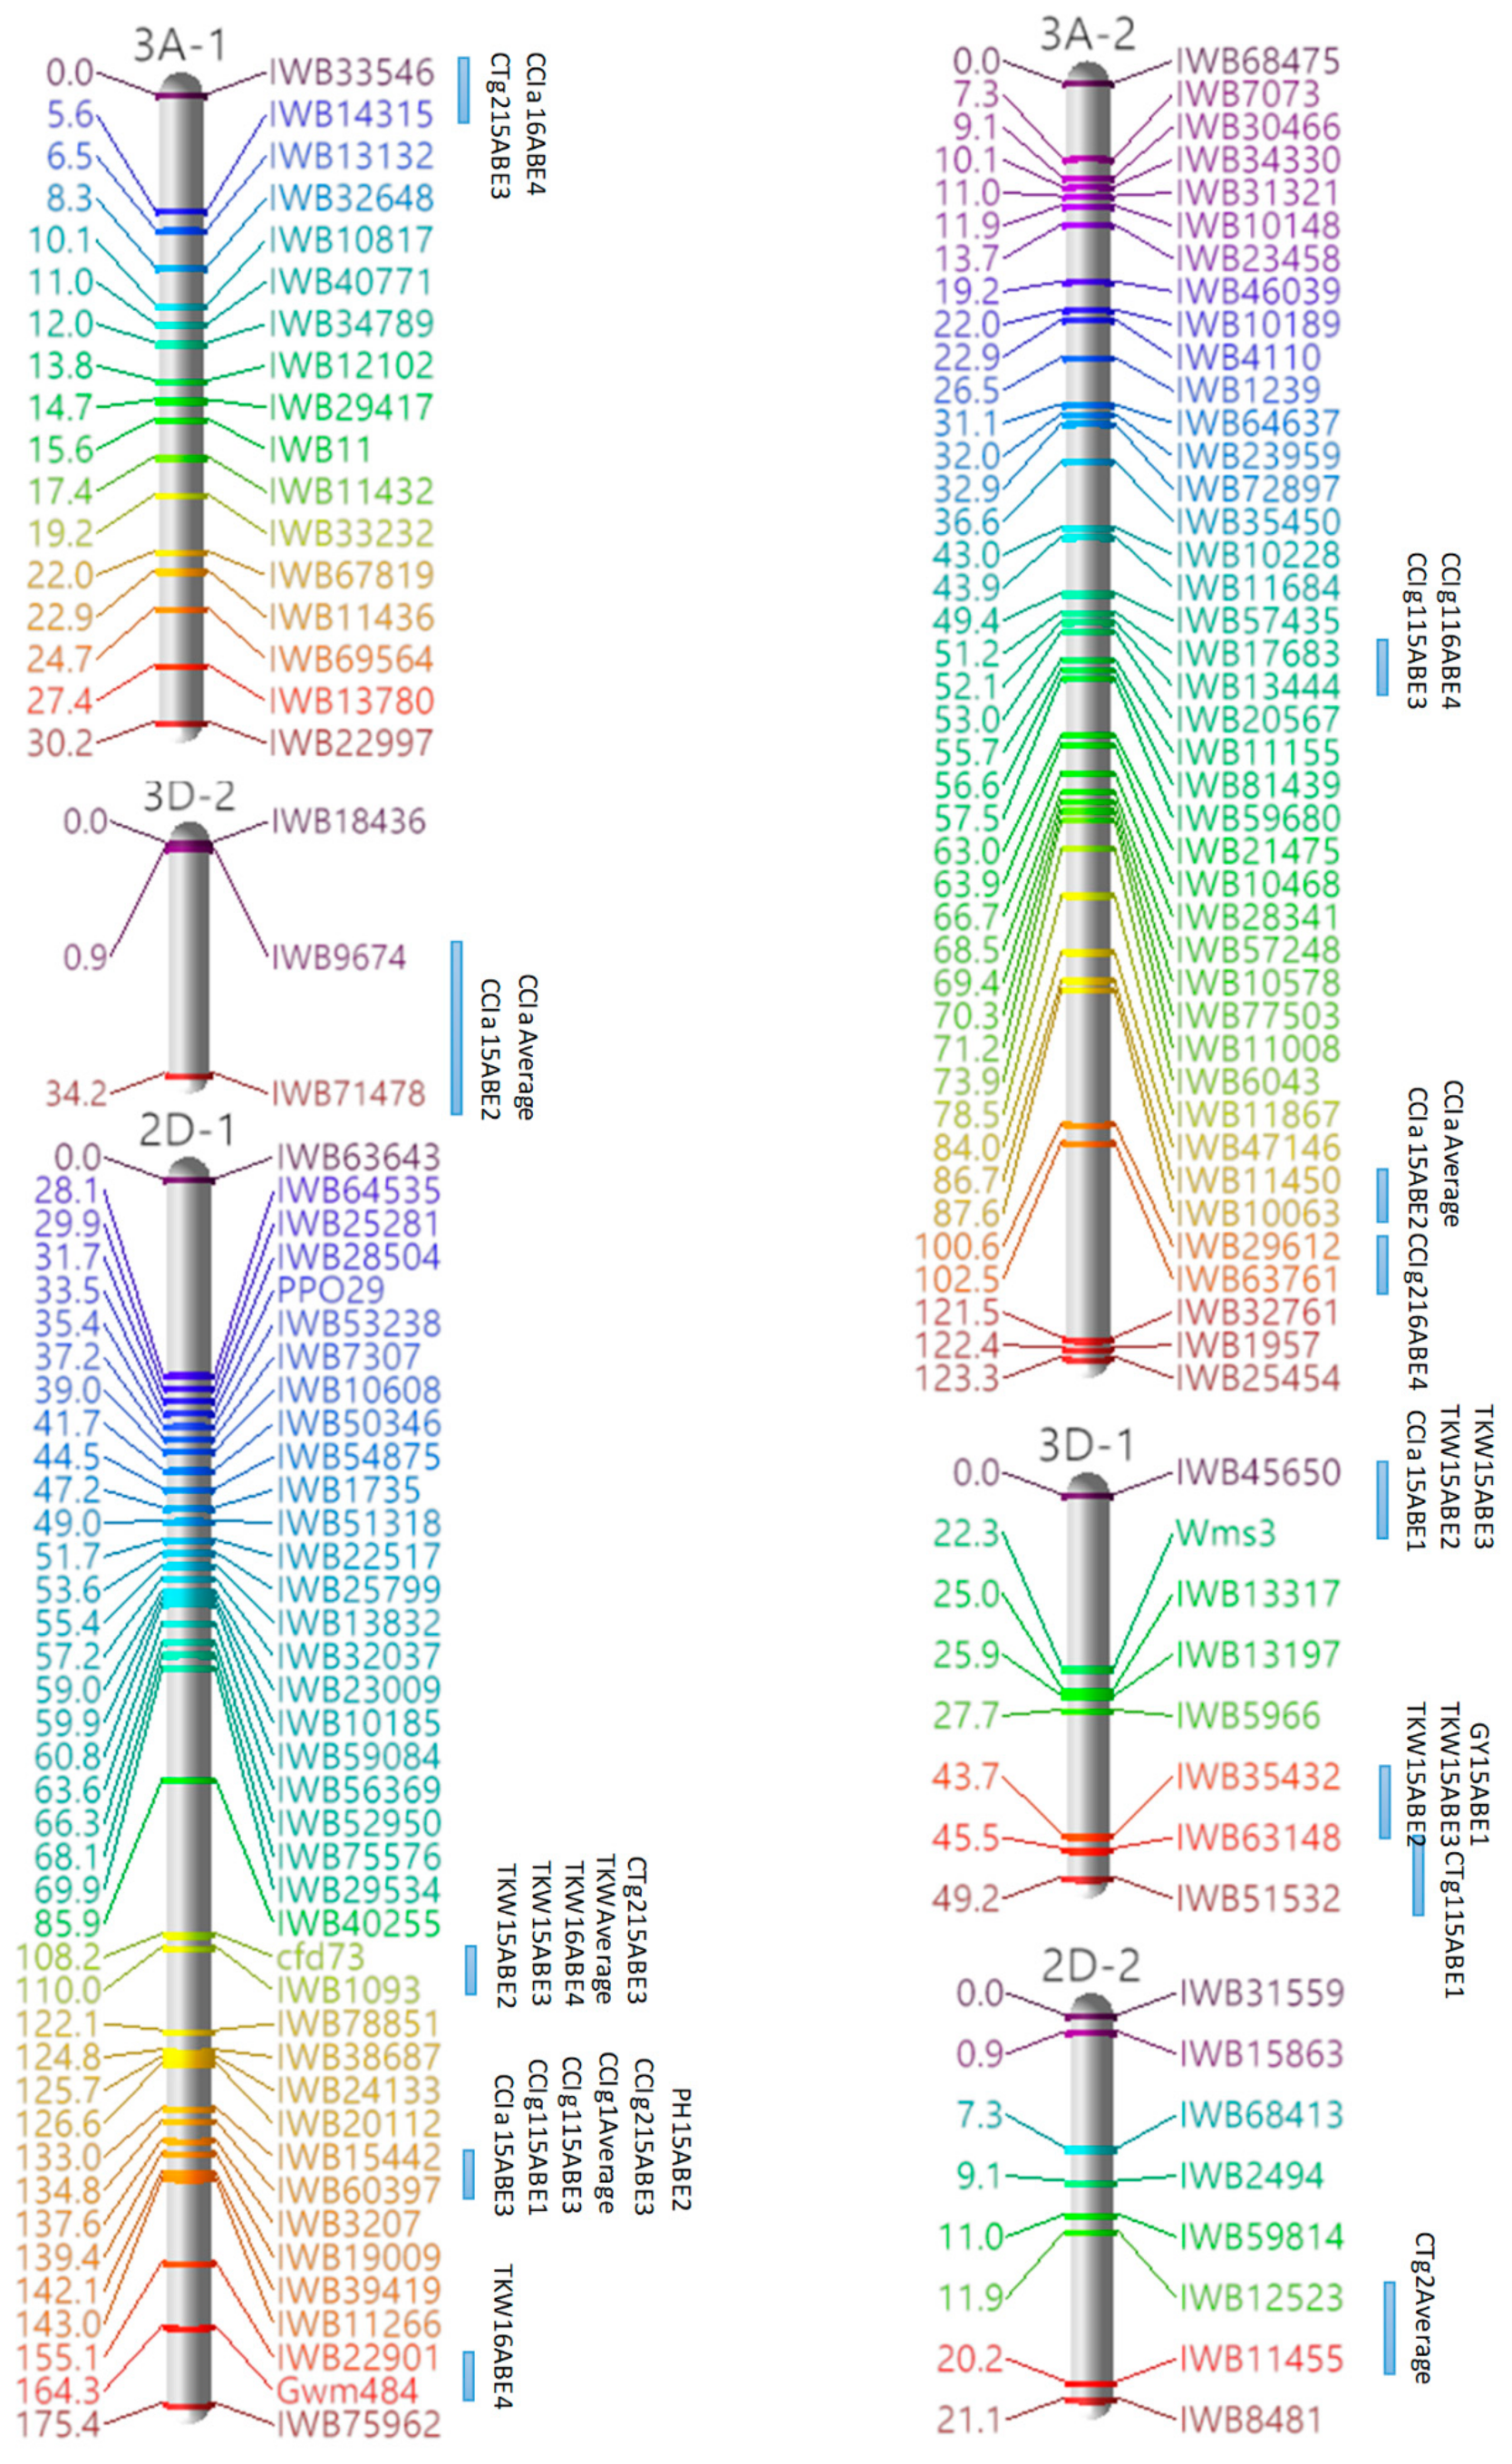
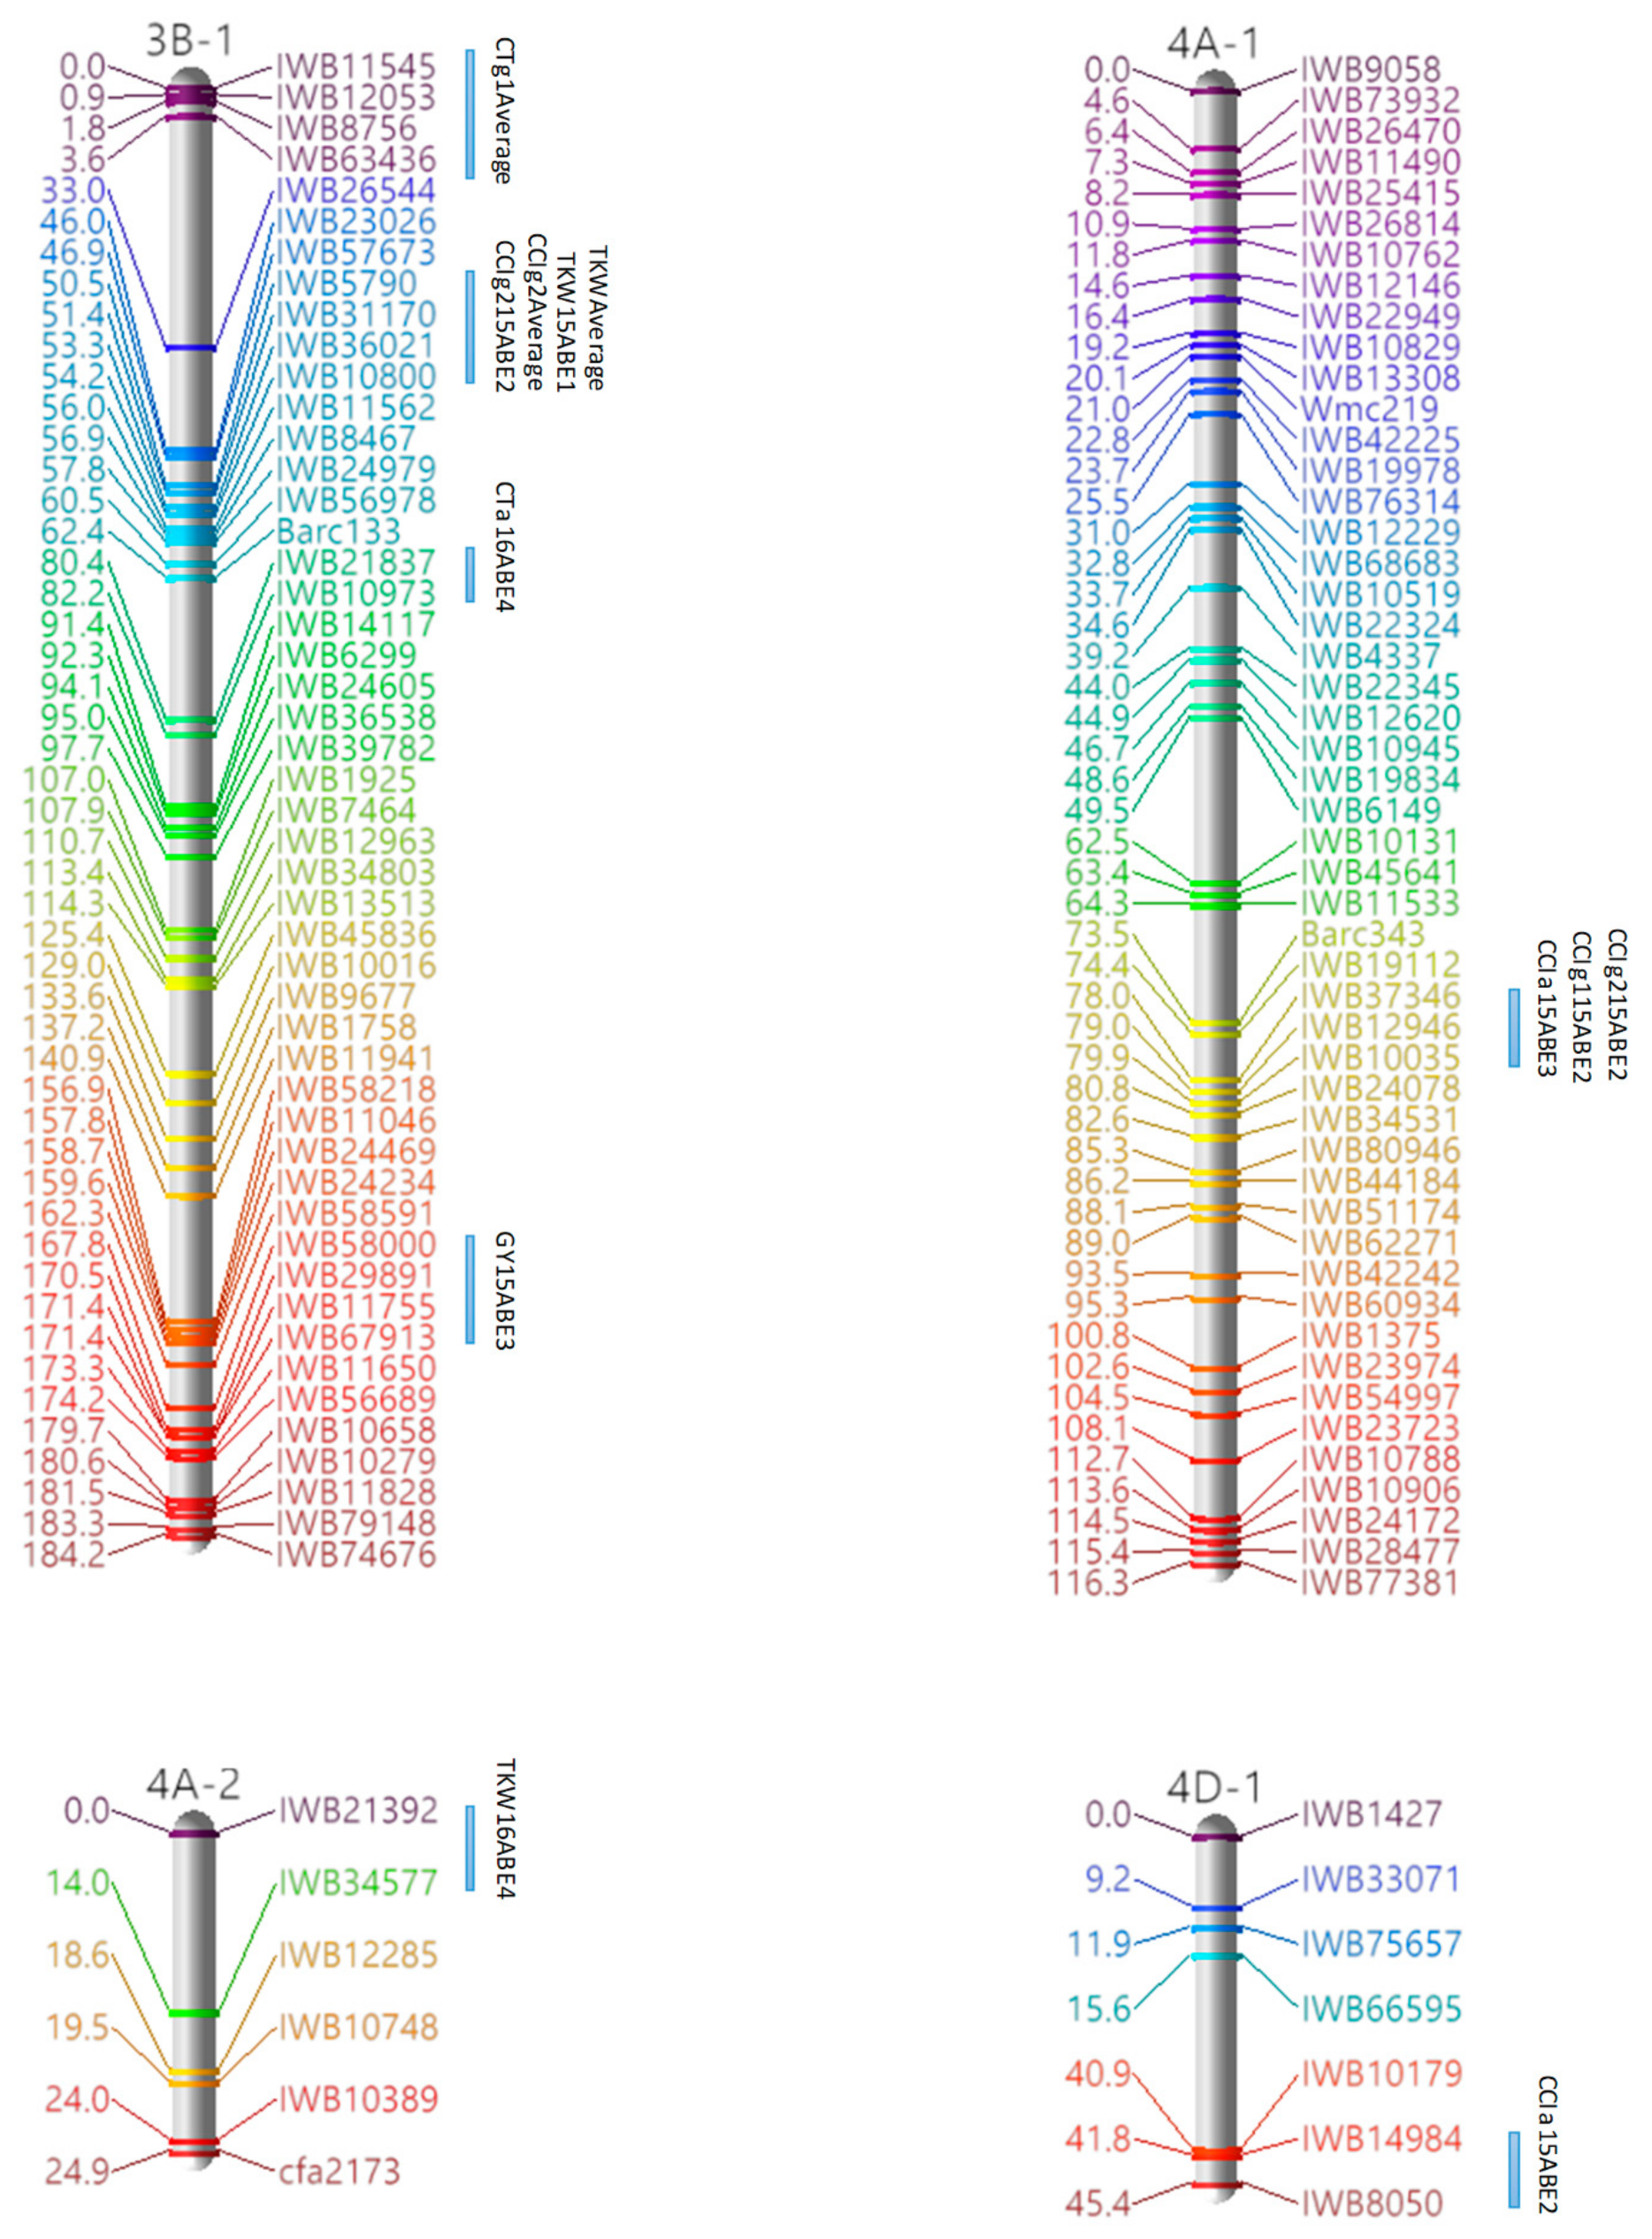
3.3. Marker Analysis and Construction of LGs
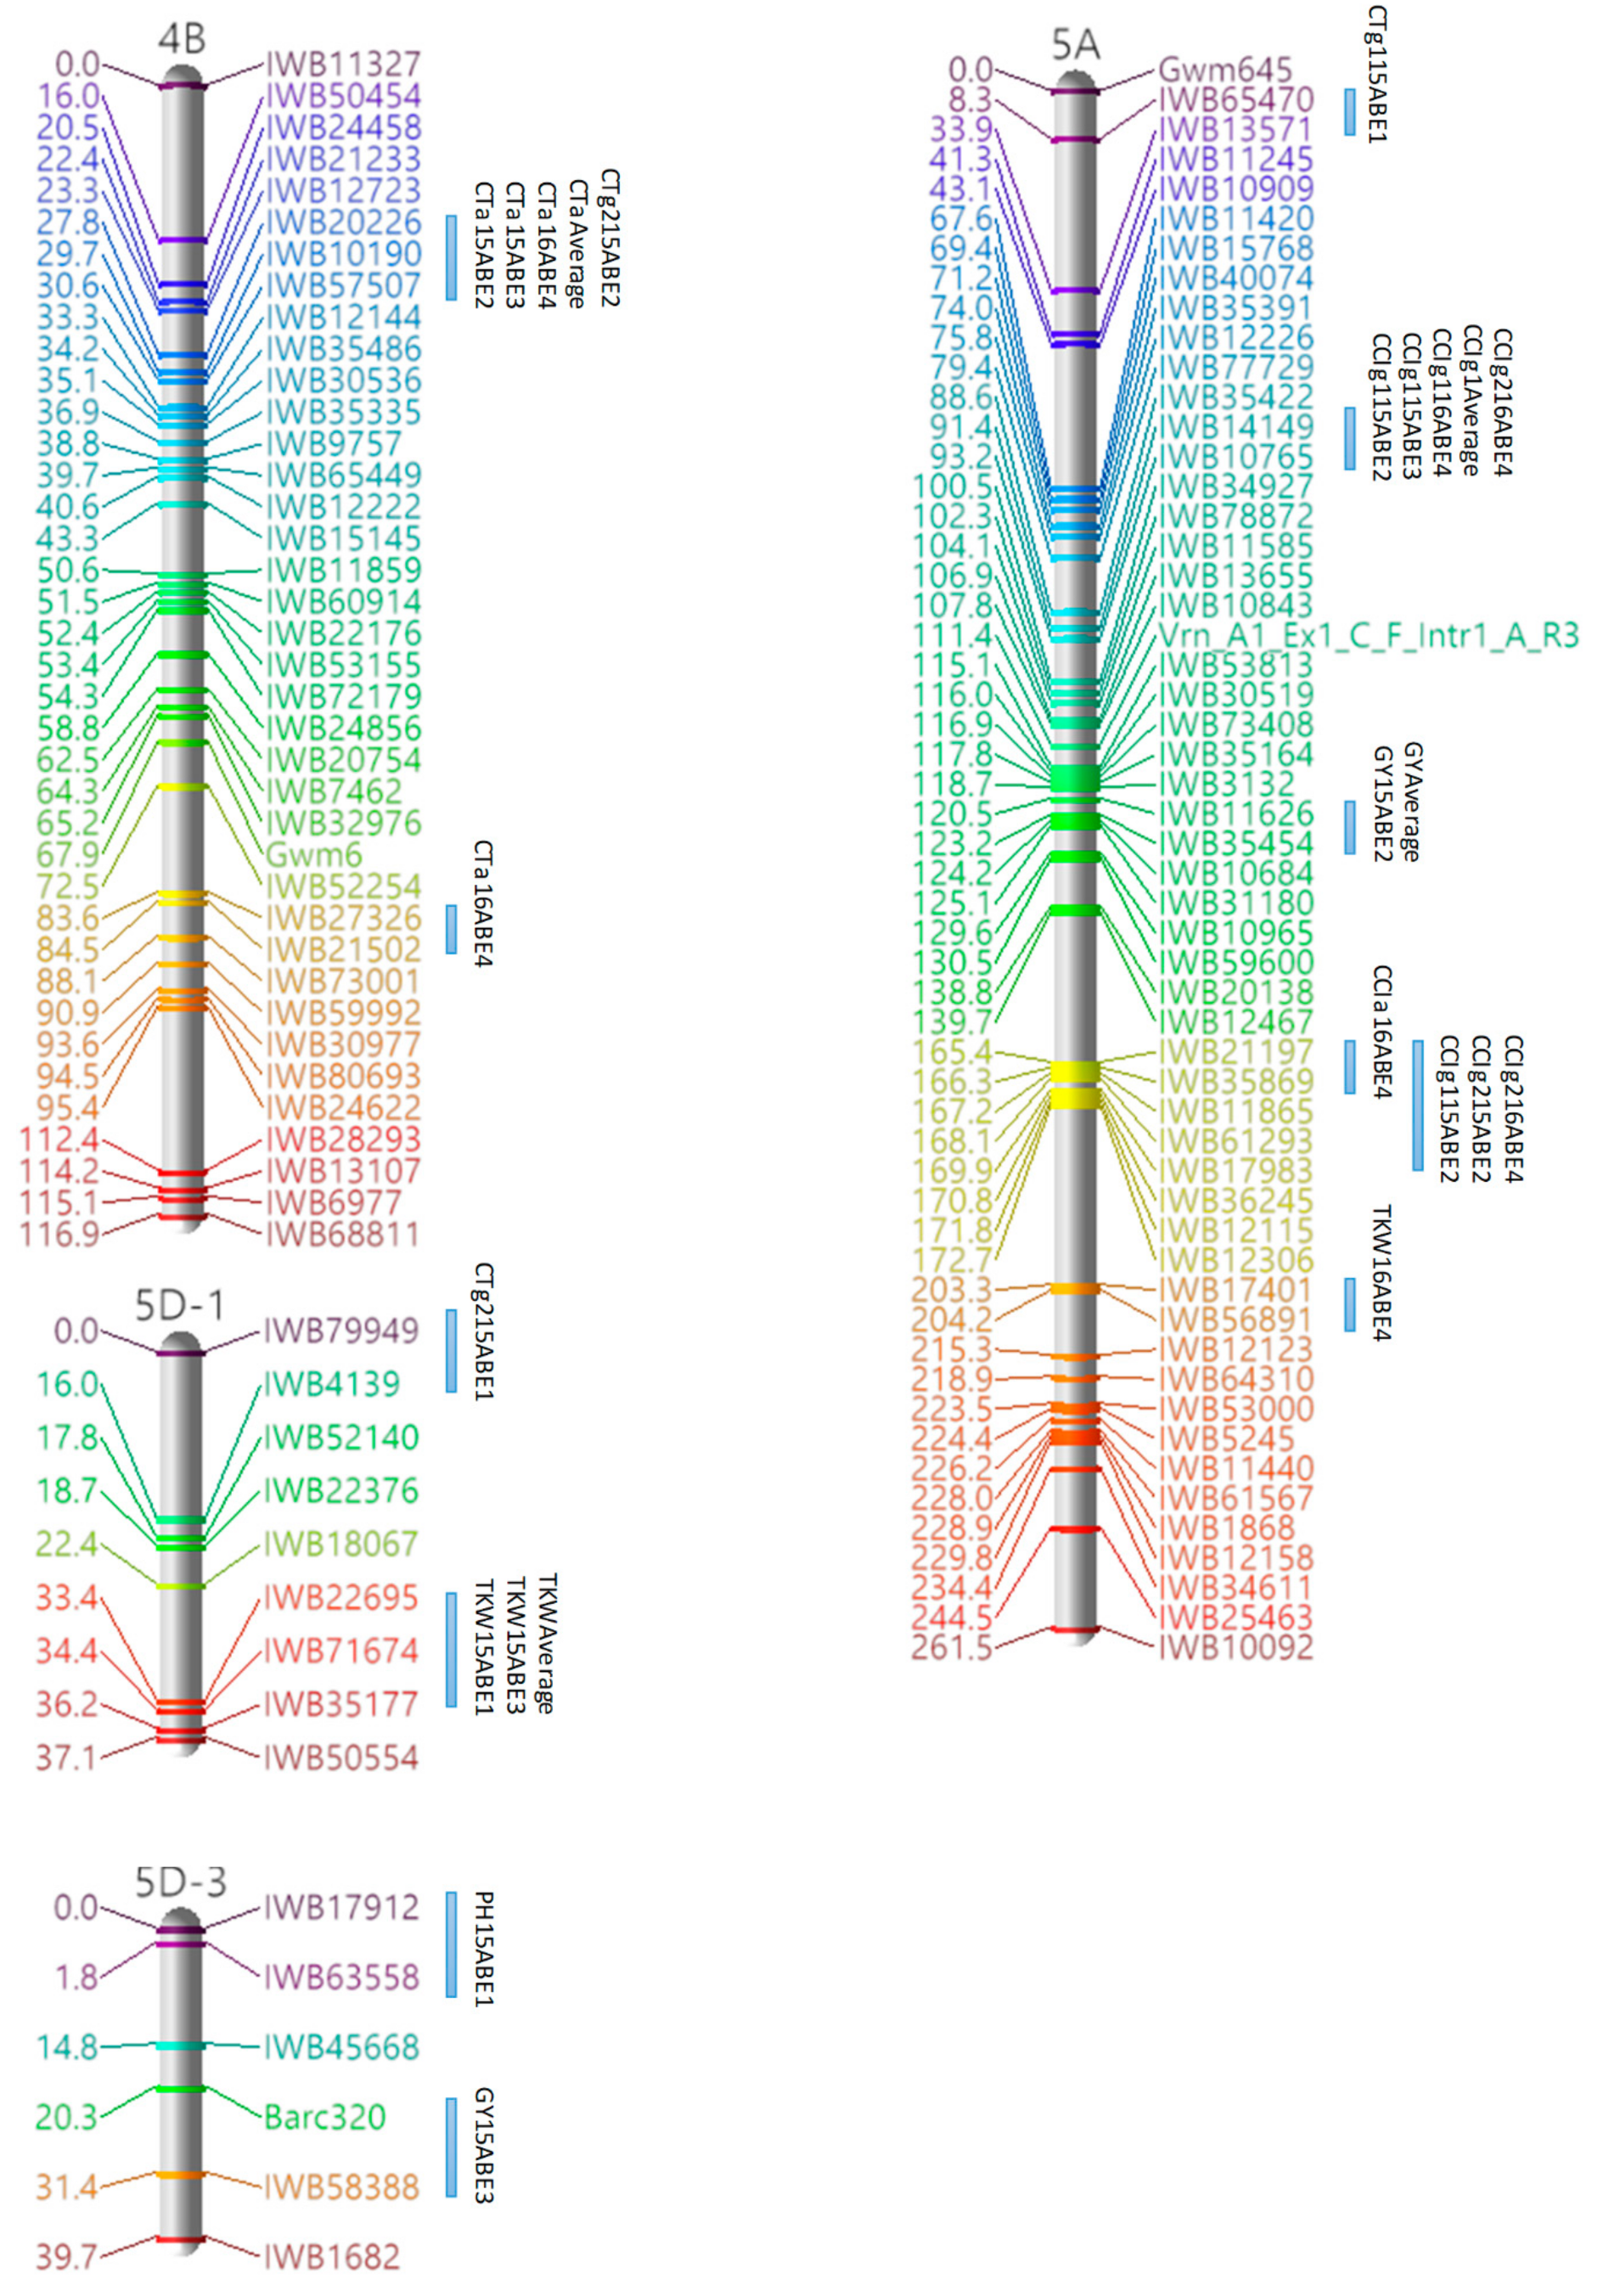
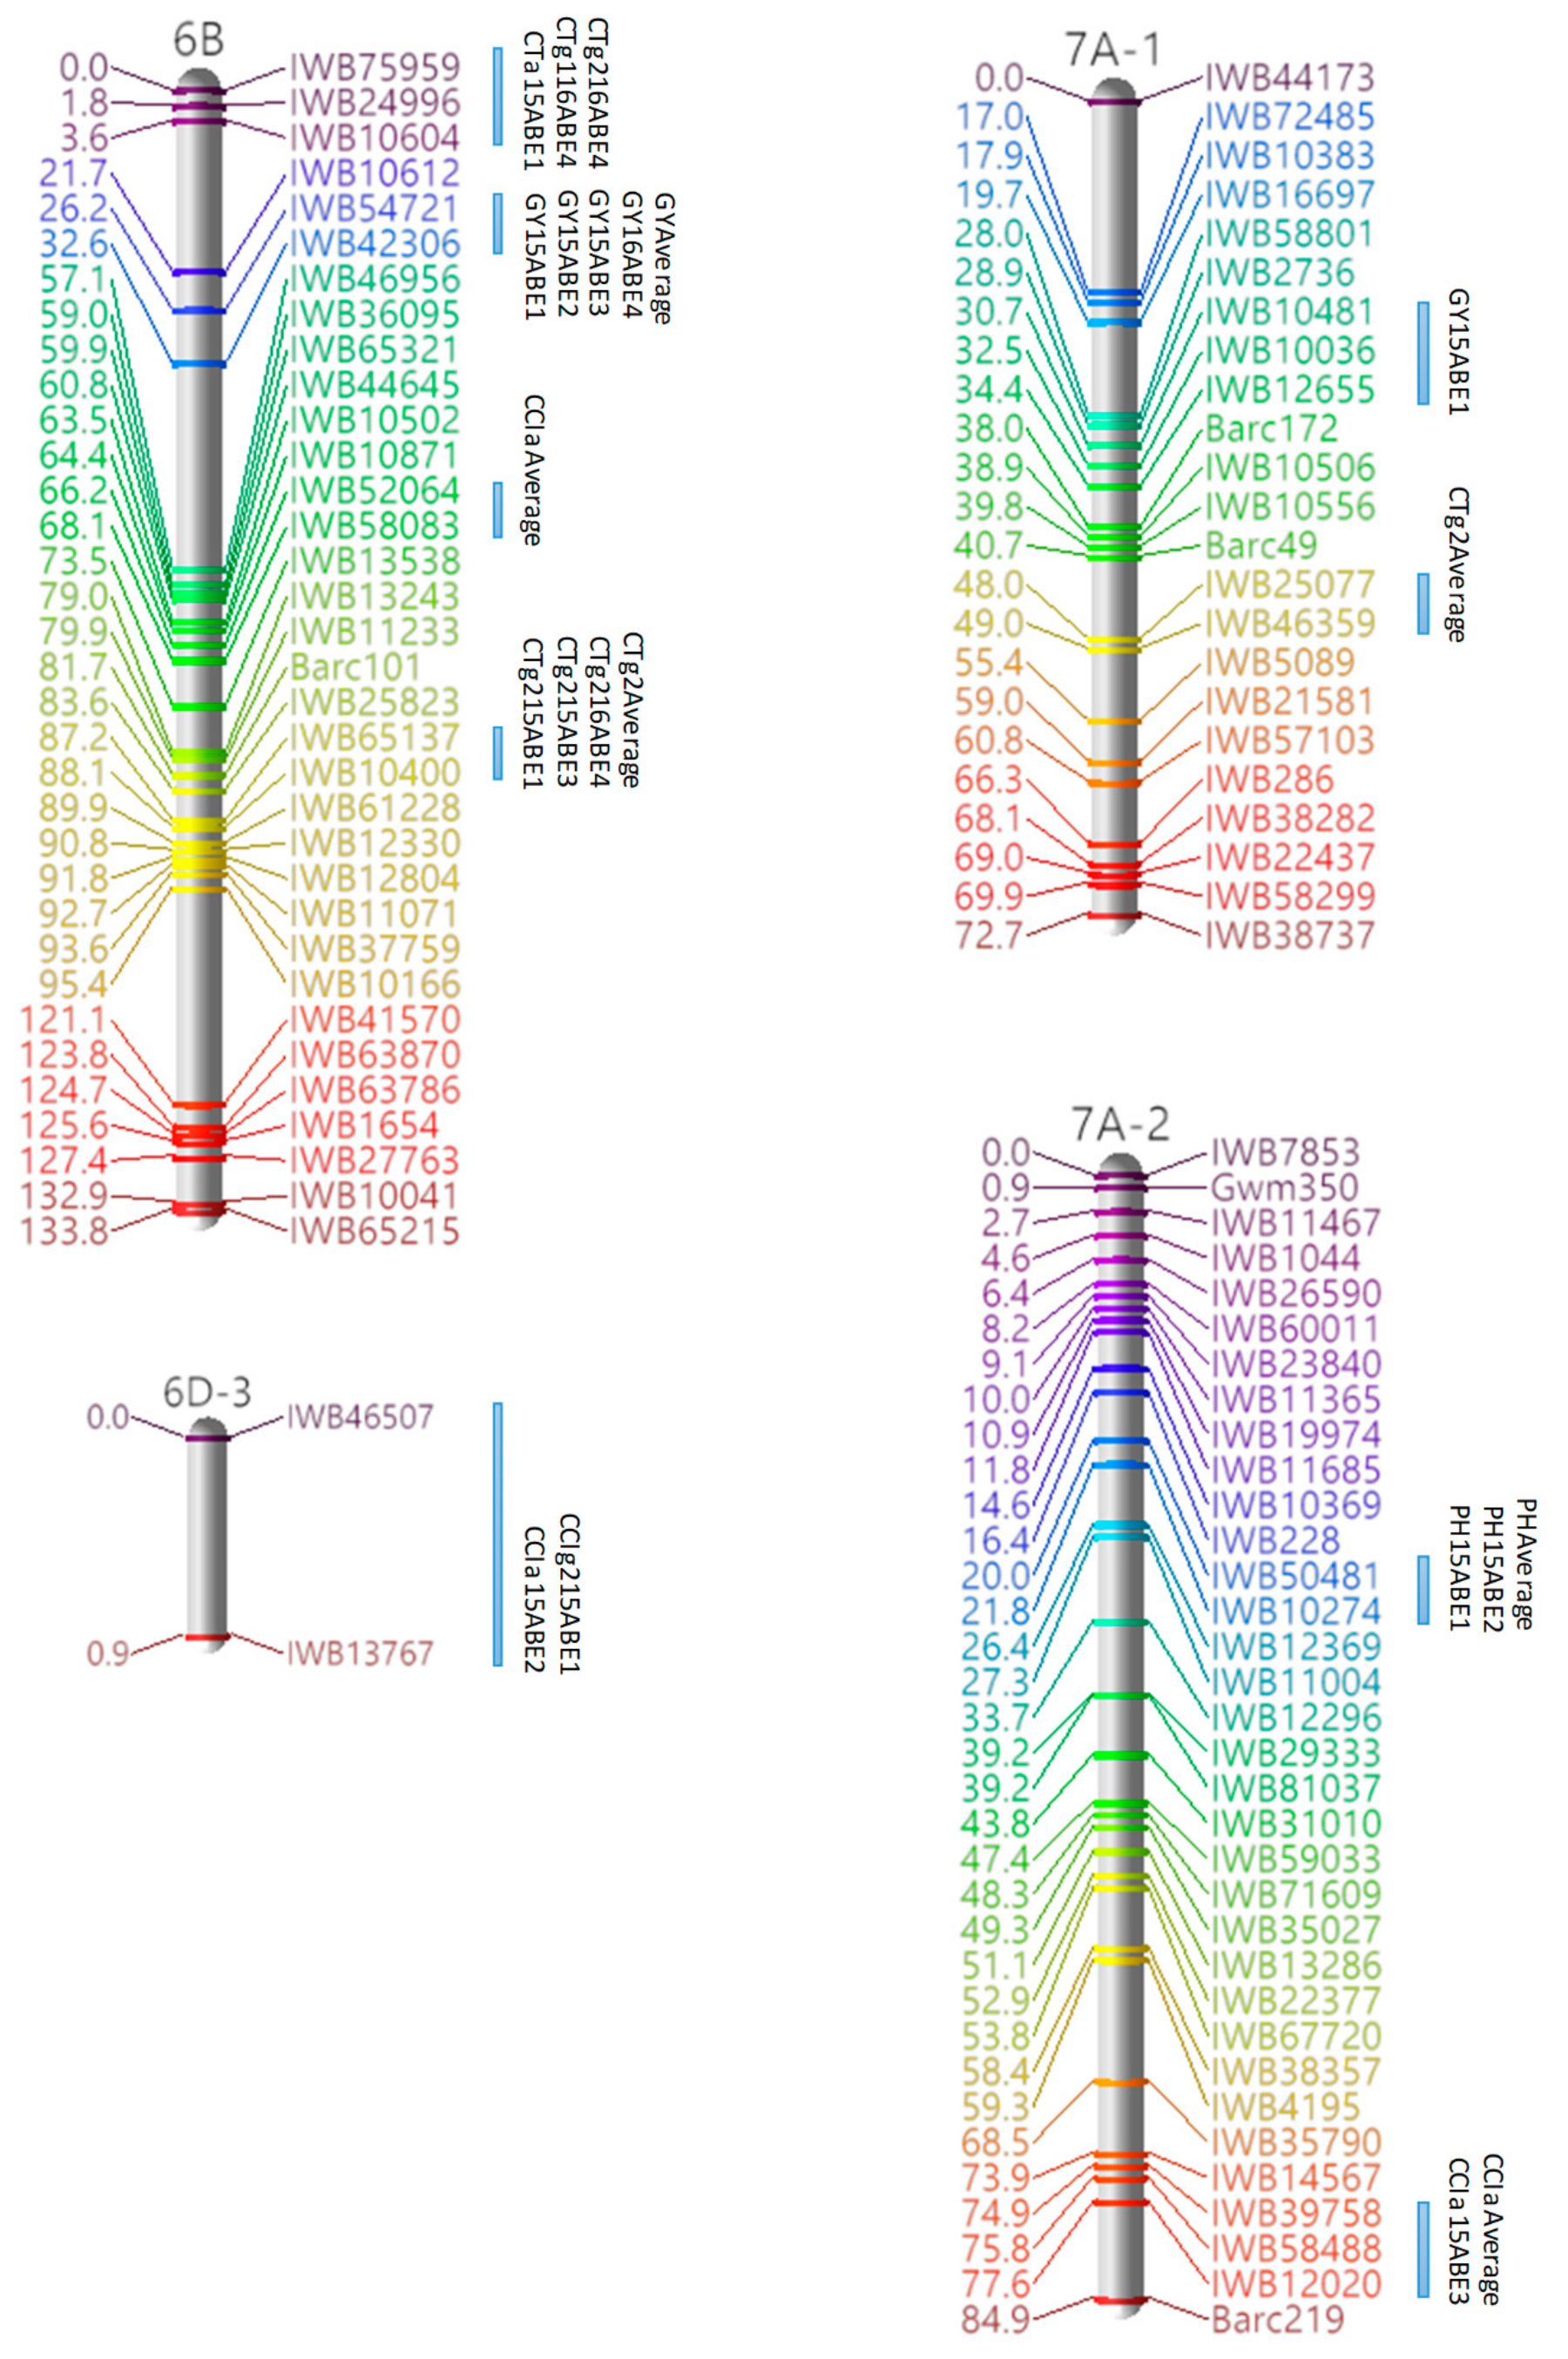
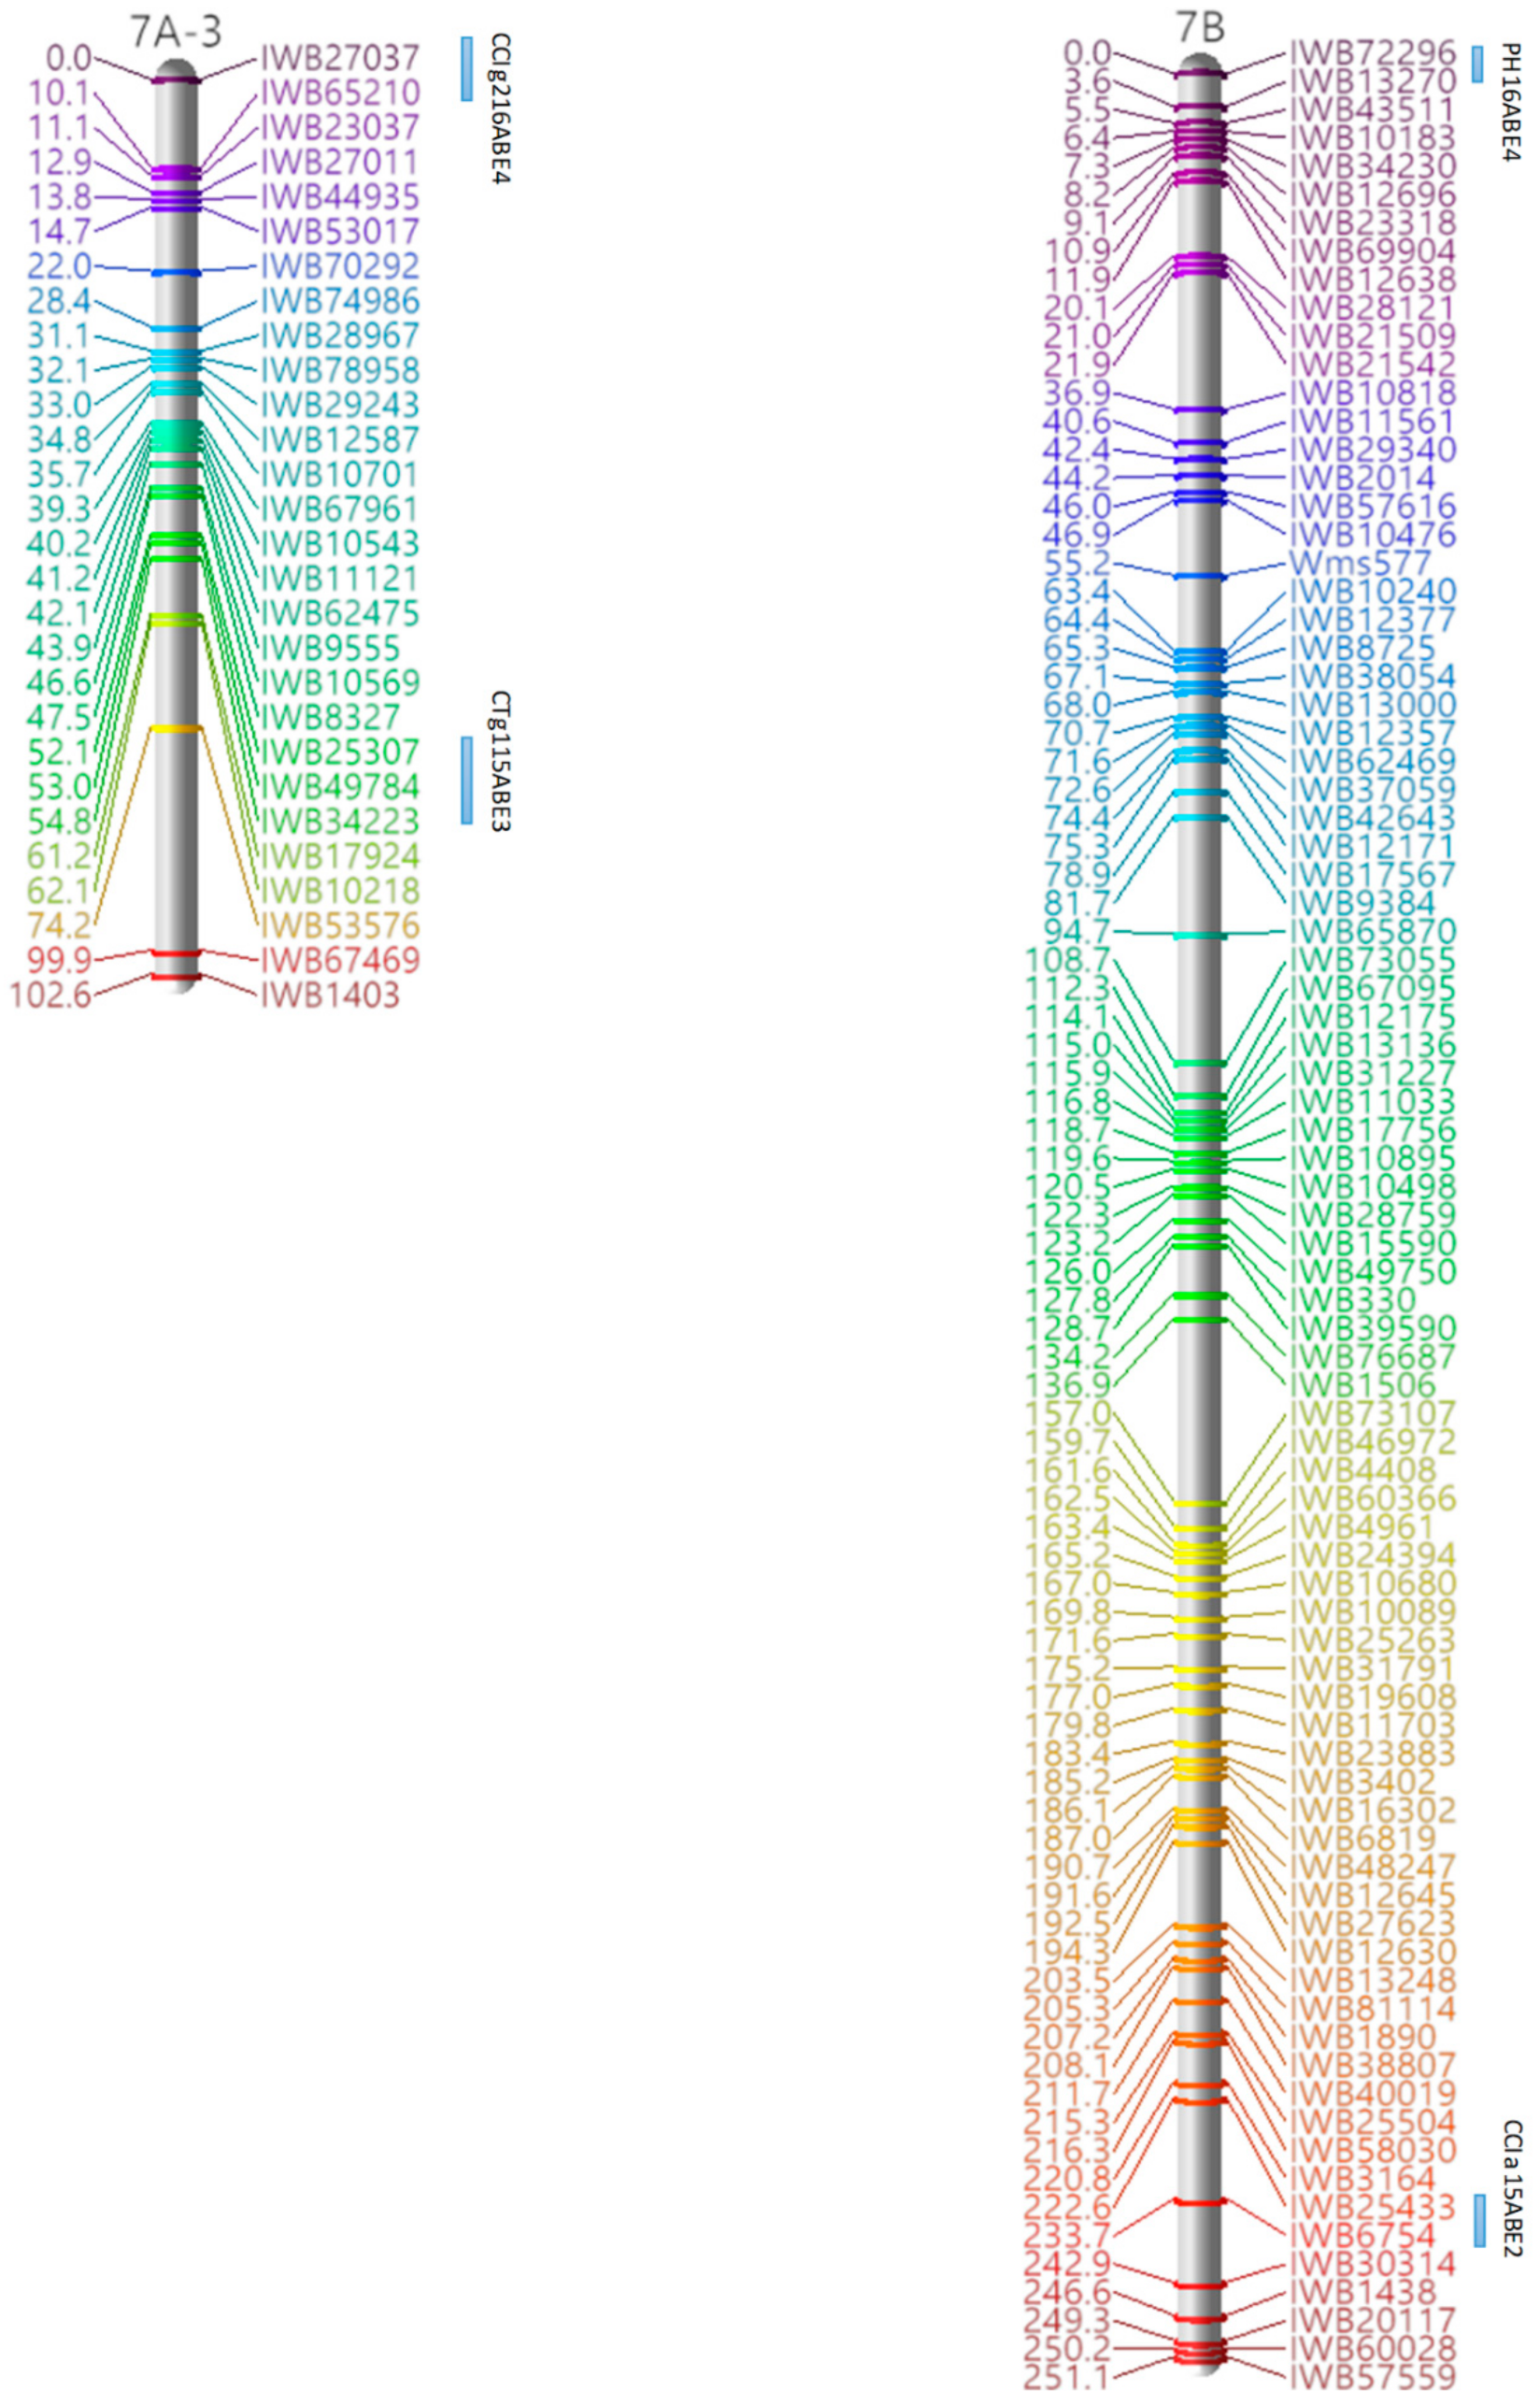
3.4. QTL Detection for Physiological and Agronomic Traits
4. Discussion
4.1. Phenotypic Evaluation
4.2. Linkage Map Construction
4.3. QTL Mapping
4.4. Practical Applications in Wheat Breeding
5. Conclusions
Supplementary Materials
Author Contributions
Acknowledgments
Conflicts of Interest
References
- Edae, E.A.; Byrne, P.F.; Haley, S.D.; Lopes, M.S.; Reynolds, M.P. Genome-wide association mapping of yield and yield components of spring wheat under contrasting moisture regimes. Theor. Appl. Genet. 2014, 127, 791–807. [Google Scholar] [CrossRef] [PubMed]
- Reynolds, M.; Foulkes, J.; Furbank, R.; Griffiths, S.; King, J.; Murchie, E.; Parry, M.; Slafer, G. Achieving yield gains in wheat. Plant Cell Environ. 2012, 35, 1799–1823. [Google Scholar] [CrossRef] [PubMed]
- Fedoroff, N.V.; Battisti, D.S.; Beachy, R.N.; Cooper, P.J.M.; Fischhoff, D.A.; Hodges, C.N.; Knauf, V.C.; Lobell, D.; Mazur, B.J.; Molden, D. Radically rethinking agriculture for the 21st century. Science 2010, 327, 833–834. [Google Scholar] [CrossRef] [PubMed]
- Stamp, P.; Visser, R. The twenty-first century, the century of plant breeding. Euphytica 2012, 186, 585–591. [Google Scholar] [CrossRef]
- Yang, Z.; Bai, Z.; Li, X.; Wang, P.; Wu, Q.; Yang, L.; Li, L.; Li, X. Snp identification and allelic-specific pcr markers development for tagw2, a gene linked to wheat kernel weight. Theor. Appl. Genet. 2012, 125, 1057–1068. [Google Scholar] [CrossRef] [PubMed]
- Arbuckle, J.G.; Prokopy, L.S.; Haigh, T.; Hobbs, J.; Knoot, T.; Knutson, C.; Loy, A.; Mase, A.S.; McGuire, J.; Morton, L.W.; et al. Climate change beliefs, concerns, and attitudes toward adaptation and mitigation among farmers in the midwestern united states. Clim. Chang. 2013, 117, 943–950. [Google Scholar] [CrossRef]
- Li, H.W.; Tong, Y.P.; Li, B.; Jing, R.L.; Lu, C.M.; Li, Z.S. Genetic analysis of tolerance to photo-oxidative stress induced by high light in winter wheat (Triticum aestivum L.). J. Genet. Genom. 2010, 37, 399–412. [Google Scholar] [CrossRef]
- Li, P.; Chen, J.L.; Wu, P.T. Evaluation of grain yield and three physiological traits in 30 spring wheat genotypes across three irrigation regimes. Crop Sci. 2012, 52, 110–121. [Google Scholar] [CrossRef]
- Lopes, M.S.; Reynolds, M.P.; McIntyre, C.L.; Mathews, K.L.; Kamali, M.R.J.; Mossad, M.; Feltaous, Y.; Tahir, I.S.A.; Chatrath, R.; Ogbonnaya, F.; et al. QTL for yield and associated traits in the seri/babax population grown across several environments in Mexico, in the West Asia, North Africa, and South Asia regions. Theor. Appl. Genet. 2013, 126, 971–984. [Google Scholar] [CrossRef] [PubMed]
- Gao, F.M.; Liu, J.D.; Yang, L.; Wu, X.X.; Xiao, Y.G.; Xia, X.C.; He, Z.H. Genome-wide linkage mapping of QTL for physiological traits in a chinese wheat population using the 90k snp array. Euphytica 2016, 209, 789–804. [Google Scholar] [CrossRef]
- Gao, F.M.; Wen, W.E.; Liu, J.D.; Rasheed, A.; Yin, G.H.; Xia, X.C.; Wu, X.X.; He, Z.H. Genome-wide linkage mapping of QTL for yield components, plant height and yield-related physiological traits in the Chinese wheat cross Zhou 8425b/Chinese Spring. Front. Plant Sci. 2015, 6, 1099. [Google Scholar] [CrossRef] [PubMed]
- Reynolds, M.P.; Nagarajan, S.; Razzaque, M.A.; Ageeb, O.A.A. Heat tolerance. In Application of Physiology in Wheat Breeding; Reynolds, M.P., Ortiz-Monasterio, J.I., McNab, A., Eds.; CIMMYT: Texcoco, Mexico, 2001; pp. 124–135. [Google Scholar]
- Johnw, S.; Mjohn, F.; James, S.; Michelle, L.; Lesleyj, F.; Wang, Y.; Matteo, C. Dissecting gene x environmental effects on wheat yields via QTL and physiological analysis. Euphytica 2007, 154, 401–408. [Google Scholar]
- Zhu, C.; Gore, M.; Buckler, E.S.; Yu, J. Status and prospects of association mapping in plants. Plant Genome 2008, 1, 5–20. [Google Scholar] [CrossRef]
- Collard, B.C.; Mackill, D.J. Marker-assisted selection: An approach for precision plant breeding in the twenty-first century. Philos. Trans. R. Soc. Lond. 2008, 363, 557–572. [Google Scholar] [CrossRef] [PubMed]
- Holland, J.B. Genetic architecture of complex traits in plants. Curr. Opin. Plant Biol. 2007, 10, 156–161. [Google Scholar] [CrossRef] [PubMed]
- Mcintyre, C.L.; Mathews, K.L.; Rattey, A.; Chapman, S.C.; Drenth, J.; Ghaderi, M.; Reynolds, M.; Shorter, R. Molecular detection of genomic regions associated with grain yield and yield-related components in an elite bread wheat cross evaluated under irrigated and rainfed conditions. Theor. Appl. Genet. 2010, 120, 527–541. [Google Scholar] [CrossRef] [PubMed]
- Bogard, M.; Jourdan, M.; Allard, V.; Martre, P.; Perretant, M.R.; Ravel, C.; Heumez, E.; Orford, S.; Snape, J.; Griffiths, S. Anthesis date mainly explained correlations between post-anthesis leaf senescence, grain yield, and grain protein concentration in a winter wheat population segregating for flowering time QTLs. J. Exp. Bot. 2011, 62, 3621. [Google Scholar] [CrossRef] [PubMed]
- Bogard, M.; Ravel, C.; Paux, E.; Bordes, J.; Balfourier, F.; Chapman, S.C.; Le, G.J.; Allard, V. Predictions of heading date in bread wheat (Triticum aestivum L.) using QTL-based parameters of an ecophysiological model. J. Exp. Bot. 2014, 65, 5849–5865. [Google Scholar] [CrossRef] [PubMed]
- Bennett, D.; Izanloo, A.; Reynolds, M.; Kuchel, H.; Langridge, P.; Schnurbusch, T. Genetic dissection of grain yield and physical grain quality in bread wheat (Triticum aestivum L.) under water-limited environments. Theor. Appl. Genet. 2012, 125, 255–271. [Google Scholar] [CrossRef] [PubMed]
- Bennett, D.; Reynolds, M.; Mullan, D.; Izanloo, A.; Kuchel, H.; Langridge, P.; Schnurbusch, T. Detection of two major grain yield QTL in bread wheat (Triticum aestivum L.) under heat, drought and high yield potential environments. Theor. Appl. Genet. 2012, 125, 1473–1485. [Google Scholar] [CrossRef] [PubMed]
- Wu, X.; Chang, X.; Jing, R. Genetic insight into yield-associated traits of wheat grown in multiple rain-fed environments. PLoS ONE 2012, 7, e31249. [Google Scholar] [CrossRef] [PubMed]
- Zhang, J.; Chen, J.; Chu, C.; Zhao, W.; Wheeler, J.; Souza, E.J.; Zemetra, R.S. Genetic dissection of QTL associated with grain yield in diverse environments. Agronomy 2014, 4, 556–578. [Google Scholar] [CrossRef]
- Sukumaran, S.; Dreisigacker, S.; Lopes, M.; Chavez, P.; Reynolds, M.P. Genome-wide association study for grain yield and related traits in an elite spring wheat population grown in temperate irrigated environments. Theor. Appl. Genet. 2015, 128, 353–363. [Google Scholar] [CrossRef] [PubMed]
- Quarrie, S.; Pekic, Q.S.; Radosevic, R.; Rancic, D.; Kaminska, A.; Barnes, J.D.; Leverington, M.; Ceoloni, C.; Dodig, D. Dissecting a wheat QTL for yield present in a range of environments: From the QTL to candidate genes. J. Exp. Bot. 2006, 57, 2627–2637. [Google Scholar] [CrossRef] [PubMed]
- Ma, L.; Zhou, E.; Huo, N.; Zhou, R.; Wang, G.; Jia, J. Genetic analysis of salt tolerance in a recombinant inbred population of wheat (Triticum aestivum L.). Euphytica 2007, 153, 109–117. [Google Scholar] [CrossRef]
- Rebetzke, G.J.; Rattey, A.R.; Farquhar, G.D.; Richards, R.A.; Condon, A.G. Genomic regions for canopy temperature and their genetic association with stomatal conductance and grain yield in wheat. Funct. Plant Biol. 2013, 40, 14–33. [Google Scholar] [CrossRef]
- Pinto, R.S.; Reynolds, M.P.; Mathews, K.L.; Mcintyre, C.L.; Olivaresvillegas, J.J.; Chapman, S.C. Heat and drought adaptive QTL in a wheat population designed to minimize confounding agronomic effects. Theor. Appl. Genet. 2010, 121, 1001–1021. [Google Scholar] [CrossRef] [PubMed]
- Vijayalakshmi, K.; Fritz, A.K.; Paulsen, G.M.; Bai, G.; Pandravada, S.; Gill, B.S. Modeling and mapping QTL for senescence-related traits in winter wheat under high temperature. Mol. Breed. 2010, 26, 163–175. [Google Scholar] [CrossRef]
- Akhunov, E.; Nicolet, C.; Dvorak, J. Single nucleotide polymorphism genotyping in polyploid wheat with the illumina goldengate assay. Theor. Appl. Genet. 2009, 119, 507–517. [Google Scholar] [CrossRef] [PubMed]
- Wang, S.; Wong, D.; Forrest, K.; Allen, A.; Chao, S.; Huang, B.E.; Maccaferri, M.; Salvi, S.; Milner, S.G.; Cattivelli, L. Characterization of polyploid wheat genomic diversity using a high-density 90,000 single nucleotide polymorphism array. Plant Biotechnol. J. 2014, 12, 787–796. [Google Scholar] [CrossRef] [PubMed] [Green Version]
- Gupta, P.K.; Rustgi, S.; Mir, R.R. Array-based high-throughput DNA markers for crop improvement. Heredity 2008, 101, 5–18. [Google Scholar] [CrossRef] [PubMed]
- Zhai, S.; He, Z.; Wen, W.; Jin, H.; Liu, J.; Zhang, Y.; Liu, Z.; Xia, X. Genome-wide linkage mapping of flour color-related traits and polyphenol oxidase activity in common wheat. Theor. Appl. Genet. 2015, 129, 377–394. [Google Scholar] [CrossRef] [PubMed]
- Cabral, A.L.; Jordan, M.C.; Mccartney, C.A.; You, F.M.; Humphreys, D.G.; Maclachlan, R.; Pozniak, C.J. Identification of candidate genes, regions and markers for pre-harvest sprouting resistance in wheat (Triticum aestivum L.). BMC Plant Biol. 2014, 14, 340. [Google Scholar] [CrossRef] [PubMed]
- Su, Z.; Jin, S.; Lu, Y.; Zhang, G.; Chao, S.; Bai, G. Single nucleotide polymorphism tightly linked to a major QTL on chromosome 7a for both kernel length and kernel weight in wheat. Mol. Breed. 2016, 36, 1–11. [Google Scholar] [CrossRef]
- Chen, J.; Wheeler, J.; O’Brien, K.; Zhao, W.; Klassen, N.; Zhang, J.; Bowman, B.; Wang, Y.; Jackson, C.; Marshall, J.M. Registration of ‘ui platinum’ hard white spring wheat. J. Plant Regist. 2015, 10, 36–40. [Google Scholar] [CrossRef]
- Marshall, J.; Jackson, C.; Shelman, T.; Jones, L.; O’Brien, K. Small Grains Report South Central and South Eastern Idaho Cereal Research and Extension Program. 2011. Available online: https://www.cals.uidaho.edu/edcomm/pdf/RES/RES180.pdf (accessed on 31 January 2012).
- Laurie, D.A.; Bennett, M.D. Wheat x maize hybridization. Can. J. Genet. Cytol. 1986, 28, 313–316. [Google Scholar] [CrossRef]
- Miller, T.D. Growth Stages of Wheat: Identification and Understanding Improve Crop Management; SCS-1999-16; Texas Agricultural Extension Service, the Texas A&M University System: College Station, TX, USA, 1996. [Google Scholar]
- Liu, Y.; Bowman, B.; Hu, Y.G.; Liang, X.; Zhao, W.; Wheeler, J.; Klassen, N.; Bockelman, H.; Bonman, J.; Chen, J. Evaluation of agronomic traits and drought tolerance of winter wheat accessions from the USDA-ARS national small grains collection. Agronomy 2017, 7, 51. [Google Scholar] [CrossRef]
- Aldrich, J.; Cullis, C.A. Rapd analysis in flax: Optimization of yield and reproducibility using klen taq 1 DNA polymerase, chelex 100, and gel purification of genomic DNA. Plant Mol. Biol. Rep. 1993, 11, 128–141. [Google Scholar] [CrossRef]
- Chen, J.; Chu, C.; Souza, E.J.; Guttieri, M.J.; Chen, X.; Xu, S.; Hole, D.; Zemetra, R. Genome-wide identification of QTL conferring high-temperature adult-plant (HTAP) resistance to stripe rust (Puccinia striiformis f. Sp. Tritici) in wheat. Mol. Breed. 2012, 29, 791–800. [Google Scholar] [CrossRef]
- Ellis, M.H.; Rebetzke, G.J.; Azanza, F.; Richards, R.A.; Spielmeyer, W. Molecular mapping of gibberellin-responsive dwarfing genes in bread wheat. Theor. Appl. Genet. 2005, 111, 423–430. [Google Scholar] [CrossRef] [PubMed]
- Ellis, H.; Spielmeyer, W.; Gale, R.; Rebetzke, J.; Richards, A. “Perfect” markers for the rht-b1b and rht-d1b dwarfing genes in wheat. Theor. Appl. Genet. 2002, 105, 1038–1042. [Google Scholar] [PubMed]
- Islamovic, E.; Obert, D.E.; Oliver, R.E.; Marshall, J.M.; Miclaus, K.J.; Hang, A.; Chao, S.; Lazo, G.R.; Harrison, S.A.; Ibrahim, A. A new genetic linkage map of barley (hordeum vulgare L.) facilitates genetic dissection of height and spike length and angle. Field Crops Res. 2013, 154, 91–99. [Google Scholar] [CrossRef]
- Harrisshultz, K.R.; Davis, R.F.; Knoll, J.E.; Anderson, W.; Wang, H. Inheritance and identification of a major quantitative trait locus (QTL) that confers resistance to meloidogyne incognita and a novel QTL for plant height in sweet sorghum. Phytopathology 2015, 105, 1522–1528. [Google Scholar] [CrossRef] [PubMed]
- Reynolds, M.P.; Pierre, C.S.; Saad, A.S.I.; Vargas, M.; Condon, A.G. Evaluating potential genetic gains in wheat associated with stress-adaptive trait expression in elite genetic resources under drought and heat stress. Crop Sci. 2007, 47, S172. [Google Scholar] [CrossRef]
- Jackson, P.; Robertson, M.; Cooper, M.; Hammer, G. The role of physiological understanding in plant breeding: From a breeding perspective. Field Crops Res. 1996, 49, 11–37. [Google Scholar] [CrossRef]
- Zhang, J. Quantitative Trait Locus Mapping of Agronomic, Physiological, and End-Use Quality Traits of Common Wheat (T. aestivum). Ph.D. Thesis, University of Idaho, Moscow, ID, USA, September 2013. [Google Scholar]
- Marone, D.; Laidò, G.; Gadaleta, A.; Colasuonno, P.; Ficco, D.B.M.; Giancaspro, A.; Giove, S.; Panio, G.; Russo, M.A.; Vita, P.D. A high-density consensus map of a and b wheat genomes. Theor. Appl. Genet. 2012, 125, 1619–1638. [Google Scholar] [CrossRef] [PubMed]
- Azadi, A.; Mardi, M.; Hervan, E.M.; Mohammadi, S.A.; Moradi, F.; Tabatabaee, M.T.; Pirseyedi, S.M.; Ebrahimi, M.; Fayaz, F.; Kazemi, M. QTL mapping of yield and yield components under normal and salt-stress conditions in bread wheat (Triticum aestivum L.). Plant Mol. Biol. Rep. 2015, 33, 102–120. [Google Scholar] [CrossRef]
- Wen, W.; He, Z.; Gao, F.; Liu, J.; Jin, H.; Zhai, S.; Qu, Y.; Xia, X. A high-density consensus map of common wheat integrating four mapping populations scanned by the 90k SNP array. Front. Plant Sci. 2017, 8, 1389. [Google Scholar] [CrossRef] [PubMed]
- Zhang, P.; Yin, G.; Zhou, Y.; Qi, A.; Gao, F.; Xia, X.; He, Z.; Li, Z.; Liu, D. QTL mapping of adult-plant resistance to leaf rust in the wheat cross Zhou 8425b/Chinese spring using high-density SNP markers. Front. Plant Sci. 2017, 8, 793. [Google Scholar] [CrossRef] [PubMed]
- Zhang, C.L.; Jian, J.T.; Feng, J.; Cui, Z.X.; Xu, X.; Sun, D.J. QTL identification for awn length based on 90k array mapping in wheat. Sci. Agric. Sin. 2018, 1, 17–25. [Google Scholar]
- Zhao, M.; Wang, G.; Leng, Y.; Wanjugi, H.; Xi, P.; Grosz, M.; Mergoum, M.; Zhong, S. Molecular mapping of fusarium head blight resistance in the spring wheat line ND2710. Phytopathology 2018, in press. [Google Scholar] [CrossRef] [PubMed]
- Chao, S.; Zhang, W.; Akhunov, E.; Sherman, J.; Ma, Y.; Luo, M.C.; Dubcovsky, J. Analysis of gene-derived SNP marker polymorphism in us wheat (Triticum aestivum L.) cultivars. Mol. Breed. 2009, 23, 23–33. [Google Scholar] [CrossRef]
- Colasuonno, P.; Gadaleta, A.; Giancaspro, A.; Nigro, D.; Giove, S.; Incerti, O.; Mangini, G.; Signorile, A.; Simeone, R.; Blanco, A. Development of a high-density SNP-based linkage map and detection of yellow pigment content QTLs in durum wheat. Mol. Breed. 2014, 34, 1563–1578. [Google Scholar] [CrossRef]
- Cui, F.; Li, J.; Ding, A.; Zhao, C.; Wang, L.; Wang, X.; Li, S.; Bao, Y.; Li, X.; Feng, D. Conditional QTL mapping for plant height with respect to the length of the spike and internode in two mapping populations of wheat. Theor. Appl. Genet. 2011, 122, 1517–1536. [Google Scholar] [CrossRef] [PubMed]
- Kato, K.; Miura, H.; Sawada, S. Mapping QTLs controlling grain yield and its components on chromosome 5a of wheat. Theor. Appl. Genet. 2000, 101, 1114–1121. [Google Scholar] [CrossRef]
- Huang, X.Q.; Kempf, H.; Ganal, M.W.; Röder, M.S. Advanced backcross QTL analysis in progenies derived from a cross between a german elite winter wheat variety and a synthetic wheat (Triticum aestivum L.). Theor. Appl. Genet. 2004, 109, 933–943. [Google Scholar] [CrossRef] [PubMed]
- Quarrie, S.A.; Steed, A.; Calestani, C.; Semikhodskii, A.; Lebreton, C.; Chinoy, C.; Steele, N.; Pljevljakusić, D.; Waterman, E.; Weyen, J. A high-density genetic map of hexaploid wheat (Triticum aestivum L.) from the cross Chinese spring × SQ1 and its use to compare QTLs for grain yield across a range of environments. Theor. Appl. Genet. 2005, 110, 865–880. [Google Scholar] [CrossRef] [PubMed]
- Wang, J.; Liu, W.; Wang, H.; Li, L.; Wu, J.; Yang, X.; Li, X.; Gao, A. QTL mapping of yield-related traits in the wheat germplasm 3228. Euphytica 2011, 177, 277–292. [Google Scholar] [CrossRef]
- Kirigwi, F.M.; Van, G.M.; Brownguedira, G.; Gill, B.S.; Paulsen, G.M.; Fritz, A.K. Markers associated with a QTL for grain yield in wheat under drought. Mol. Breed. 2007, 20, 401–413. [Google Scholar] [CrossRef]
- Liu, L.H.; Wang, L.X.; Ji, Y.; Zheng, Y.L.; Zhao, C.P. Association mapping of six agronomic traits on chromosome 4A of wheat (Triticum aestivum L.). Mol. Plant Breed. 2010, 1, 5. [Google Scholar] [CrossRef]
- Groos, C.; Robert, N.; Bervas, E.; Charmet, G. Genetic analysis of grain protein-content, grain yield and thousand-kernel weight in bread wheat. Theor. Appl. Genet. 2003, 106, 1032–1040. [Google Scholar] [CrossRef] [PubMed]


| Trials | Sowing Date | September–March | April | May | June | July | August | Total | |||||
|---|---|---|---|---|---|---|---|---|---|---|---|---|---|
| R | R | IRR | R | IRR | R | IRR | R | IRR | R | IRR | |||
| 15ABE1 | 20 March 2015 | 92.4 | 2.5 | 42.7 | 83.6 | 53.3 | 19.8 | 181.4 | 19.1 | 85.3 | - | / | 580.1 |
| 15ABE2 | 26 March 2015 | 92.4 | 2.5 | 42.7 | 83.6 | 53.3 | 19.8 | 181.4 | 19.1 | 96.0 | - | / | 590.8 |
| 15ABE3 | 1 April 2015 | 92.4 | 2.5 | 42.7 | 83.6 | 53.3 | 19.8 | 192.0 | 19.1 | 96.0 | - | / | 601.4 |
| 16ABE4 | 8 April 2016 | 165.4 | 43.2 | / | 36.8 | 74.7 | 0.8 | 218.7 | 2.8 | 160.0 | 0 | / | 702.4 |
| SV | DF | MS | Across 15ABE1 and 15ABE2 | DF | MS | Across 15ABE3 and 16ABE4 | ||||
|---|---|---|---|---|---|---|---|---|---|---|
| 15ABE1 | 15ABE2 | DF | MS | 15ABE3 | 16ABE4 | DF | MS | |||
| CTa | ||||||||||
| Block/Replication | 3 | 0.08 | 0.36 | 0.79 | 163.57 **** | |||||
| Genotype (G) | 111 | 2.07 * | 0.52 | 111 | 1.54 *** | 0.46 | 1.12 | 109 | 0.91 | |
| Environment (E) | 1 | 4.46 ** | 1 | 4531.88 **** | ||||||
| G × E | 111 | 1.31 ** | 109 | 0.67 | ||||||
| Error | 3 | 0.09 | 0.51 | 12 | 0.26 | 0.56 | 1.27 | 220 | 1.65 | |
| HB2 | 0.52 | 0.38 | ||||||||
| CTg1 | ||||||||||
| Block/Replication | 3 | 1.98 * | 0.20 | 6.56 **** | 79.32 **** | |||||
| Genotype (G) | 111 | 1.89 * | 0.15 | 111 | 1.84 * | 0.60 | 2.51 | 109 | 1.70 | |
| Environment (E) | 1 | 1.16 | 1 | 0.57 | ||||||
| G × E | 111 | 1.98 * | 109 | 1.41 | ||||||
| Error | 3 | 0.15 | 0.06 | 12 | 0.60 | 0.50 | 2.38 | 220 | 1.81 | |
| HB2 | 0.45 | 0.42 | ||||||||
| CTg2 | ||||||||||
| Block/Replication | 3 | 4.58 | 0.01 | 0.08 | 57.53 **** | |||||
| Genotype (G) | 111 | 7.13 | 0.21 | 111 | 6.56 ** | 0.44 | 1.76 * | 109 | 1.32 * | |
| Environment (E) | 1 | 967.59 **** | 1 | 23.60 **** | ||||||
| G × E | 111 | 6.14 ** | 109 | 0.89 | ||||||
| Error | 3 | 1.21 | 0.09 | 12 | 1.47 | 0.36 | 1.16 | 220 | 1.01 | |
| HB2 | 0.49 | 0.49 | ||||||||
| CCIa | ||||||||||
| Block/Replication | 3 | 5.31 * | 1.92 | 6.19 | 78.00 * | |||||
| Genotype (G) | 111 | 30.45 ** | 19.18 * | 111 | 27.36 **** | 18.16 ** | 28.15 *** | 109 | 32.93 **** | |
| Environment (E) | 1 | 340.08 **** | 1 | 2.11 | ||||||
| G × E | 111 | 23.74 **** | 109 | 13.38 | ||||||
| Error | 3 | 0.43 | 1.05 | 12 | 2.18 | 11.52 | 14.89 | 220 | 13.47 | |
| HB2 | 0.52 | 0.62 | ||||||||
| CCIg1 | ||||||||||
| Block/Replication | 3 | 8.44 | 2.81 | 2.86 | 61.16 | |||||
| Genotype (G) | 111 | 36.31 | 26.20 | 111 | 38.21 *** | 37.24 * | 41.32 **** | 109 | 56.37 **** | |
| Environment (E) | 1 | 16.47 | 1 | 1600.20 **** | ||||||
| G × E | 111 | 25.31 ** | 109 | 22.19 | ||||||
| Error | 3 | 10.34 | 4.40 | 12 | 6.50 | 24.65 | 17.07 | 220 | 20.96 | |
| HB2 | 0.57 | 0.63 | ||||||||
| CCIg2 | ||||||||||
| Block/Replication | 3 | 3.79 | 6.41 | 22.66 | 54.80 | |||||
| Genotype (G) | 111 | 27.06 | 23.56 | 111 | 31.39 ** | 25.43 *** | 39.86 **** | 109 | 45.84 **** | |
| Environment (E) | 1 | 127.22 *** | 1 | 453.71 **** | ||||||
| G × E | 111 | 20.42 * | 109 | 19.46 * | ||||||
| Error | 3 | 12.25 | 4.69 | 12 | 6.79 | 13.72 | 16.05 | 220 | 15.10 | |
| HB2 | 0.57 | 0.63 | ||||||||
| PH | ||||||||||
| Block/Replication | 3 | 1.38 | 2.61 | 708.13 **** | 3.07 | |||||
| Genotype (G) | 111 | 22.31 | 27.57 | 111 | 43.20 *** | 42.56 **** | 55.95 **** | 109 | 81.12 **** | |
| Environment (E) | 1 | 0.02 | 1 | 6763.57 **** | ||||||
| G × E | 111 | 9.51 | 109 | 17.39 | ||||||
| Error | 3 | 18.38 | 4.65 | 12 | 6.75 | 16.30 | 14.94 | 220 | 18.71 | |
| HB2 | 0.77 | 0.75 | ||||||||
| TKW | ||||||||||
| Block/Replication | 3 | 4.07 | 2.11 | 47.48 ** | 38.89 * | |||||
| Genotype (G) | 111 | 13.74 | 9.87 | 111 | 21.21 *** | 18.79 **** | 19.60 **** | 109 | 29.85 **** | |
| Environment (E) | 1 | 7.44 | 1 | 2480.45 **** | ||||||
| G × E | 111 | 3.05 | 109 | 8.53 * | ||||||
| Error | 3 | 5.64 | 3.28 | 12 | 3.78 | 4.97 | 6.23 | 220 | 5.95 | |
| HB2 | 0.81 | 0.72 | ||||||||
| GY | ||||||||||
| Block/Replication | 3 | 0.20 | 0.13 | 5.06 **** | 1.80 | |||||
| Genotype (G) | 111 | 0.40 | 0.53 | 111 | 0.71 ** | 0.72 **** | 1.59 **** | 109 | 1.67 **** | |
| Environment (E) | 1 | 66.28 **** | 1 | 6.16 *** | ||||||
| G × E | 111 | 0.32 * | 109 | 0.64 ** | ||||||
| Error | 3 | 0.11 | 0.08 | 12 | 0.13 | 0.26 | 0.55 | 220 | 0.43 | |
| HB2 | 0.65 | 0.66 | ||||||||
| CTa | CTg1 | CTg2 | CCIa | CCIg1 | CCIg2 | PH | TKW | |
|---|---|---|---|---|---|---|---|---|
| CTg1 | 0.50 **** | |||||||
| CTg2 | 0.61 **** | 0.83 **** | ||||||
| CCIa | −0.30 ** | −0.34 ** | −0.44 **** | |||||
| CCIg1 | 0.24 * | 0.11 | 0.08 | 0.33 **** | ||||
| CCIg2 | 0.02 | −0.05 | −0.13 | 0.60 **** | 0.65 **** | |||
| PH | −0.77 **** | −0.60 **** | −0.71 **** | 0.37 **** | −0.11 * | 0.09 | ||
| TKW | −0.71 **** | −0.55 **** | −0.62 **** | 0.33 **** | −0.12 * | 0.05 | 0.71 **** | |
| GY | −0.72 **** | −0.72 **** | −0.89 **** | 0.45 **** | −0.06 | 0.14 ** | 0.87 **** | 0.71 **** |
| Traits | Trial | QTL a | Peak Marker | LG | Position b | Marker Interval | LOD c | Add d | R2 e |
|---|---|---|---|---|---|---|---|---|---|
| CTa | 15ABE1 | Q.CTa.ui-2A-2 | IWB21598 | 2A-2 | 11.05 | IWB3678–IWB21598 | 2.5 | 0.30 | 9.8 |
| Q.CTa.ui-6B | IWB10604 | 6B | 3.64 | IWB75959–IWB10604 | 5.8 | −0.48 | 21.6 | ||
| 15ABE2 | Q.CTa.ui-2B-2.1 | IWB21394 | 2B-2 | 8.2 | IWB21394–IWB67534 | 5.5 | 0.77 | 20.4 | |
| Q.CTa.ui-2B-2.2 | IWB594 | 2B-2 | 44.63 | IWB11092–IWB594 | 2.5 | −0.51 | 10.0 | ||
| Q.CTa.ui-2B-3 | IWB35482 | 2B-3 | 63.36 | IWB35482–IWB74377 | 2.7 | 0.40 | 10.3 | ||
| Q.CTa.ui-4B.1 | IWB10190 | 4B | 29.65 | IWB20226–IWB57507 | 4.0 | −0.48 | 15.5 | ||
| Q.CTa.ui-5B-2 | IWB626 | 5B-2 | 42.9 | IWB36579–IWB18101 | 5.8 | −0.62 | 21.7 | ||
| 15ABE3 | Q.CTa.ui-2B-3 | IWB35482 | 2B-3 | 55.36 | IWB35482–IWB74377 | 3.0 | 0.29 | 11.6 | |
| Q.CTa.ui-4B.1 | IWB10190 | 4B | 29.65 | IWB20226–IWB57507 | 3.3 | −0.44 | 12.8 | ||
| 16ABE4 | Q.CTa.ui-3B-1 | IWB10973 | 3B-1 | 82.18 | IWB21837–IWB10973 | 2.6 | 0.62 | 10.4 | |
| Q.CTa.ui-4B.1 | IWB10190 | 4B | 29.65 | IWB20226–IWB57507 | 2.6 | −0.41 | 11.2 | ||
| Q.CTa.ui-4B.2 | IWB59992 | 4B | 84.48 | IWB27326–IWB21502 | 2.8 | −0.64 | 11.0 | ||
| Average f | Q.CTa.ui-1A | IWB36144 | 1A | 66.72 | IWB21167–IWB36144 | 2.5 | 0.23 | 10.1 | |
| Q.CTa.ui-4B.1 | IWB10190 | 4B | 29.65 | IWB20226–IWB57507 | 3.8 | −0.47 | 14.6 | ||
| CTg1 | 15ABE1 | Q.CTg1.ui-5A.2 | IWB65470 | 5A | 14.26 | IWB65470–IWB13571 | 3.4 | −1.47 | 13.3 |
| Q.CTg1.ui-3D-1 | IWB63148 | 3D-1 | 45.53 | IWB63148 -IWB51532 | 2.8 | 1.18 | 11.3 | ||
| 15ABE2 | Q.CTg1.ui-6A-2 | IWB12439 | 6A-2 | 88.2 | IWB12439–IWB13795 | 2.5 | 0.20 | 9.8 | |
| Q.CTg1.ui-2B-4 | Barc13 | 2B-4 | 26 | Barc13–IWB22058 | 2.8 | 0.26 | 11.1 | ||
| Q.CTg1.ui-5B-2.1 | IWB80334 | 5B-2 | 10.96 | IWB80334–IWB29709 | 3.1 | −0.24 | 12.3 | ||
| Q.CTg1.ui-5B-2.2 | IWB19921 | 5B-2 | 20.97 | IWB36033–IWB19921 | 3.3 | −0.24 | 12.8 | ||
| 15ABE3 | Q.CTg1.ui-7A-3 | IWB49784 | 7A-3 | 52.99 | IWB25307–IWB34223 | 4.7 | 0.41 | 17.8 | |
| Q.CTg1.ui-1B-1 | IWB58775 | 1B-1 | 128 | IWB10780–IWB58775 | 2.9 | −0.31 | 13.6 | ||
| Q.CTg1.ui-2B-3 | IWB18944 | 2B-3 | 22 | IWB18944–Wmc149 | 2.6 | −0.34 | 10.2 | ||
| Q.CTg1.ui-5B-2.1 | IWB80334 | 5B-2 | 10.96 | IWB80334–IWB29709 | 2.8 | −0.23 | 11.1 | ||
| 16ABE4 | Q.CTg1.ui-5B-2.1 | IWB80334 | 5B-2 | 10.96 | IWB80334–IWB29709 | 2.6 | −0.35 | 10.4 | |
| Q.CTg1.ui-6B | IWB10604 | 6B | 3.64 | IWB75959–IWB10604 | 2.9 | −0.67 | 11.5 | ||
| Average f | Q.CTg1.ui-3B-1 | IWB8756 | 3B-1 | 1.82 | IWB11545–IWB63436 | 3.8 | −0.37 | 14.8 | |
| Q.CTg1.ui-5B-2.1 | IWB80334 | 5B-2 | 10.96 | IWB80334–IWB29709 | 2.6 | −0.35 | 10.2 | ||
| Q.CTg1.ui-5B-2.3 | IWB36579 | 5B-2 | 41.08 | IWB36579–IWB18101 | 4.2 | 0.49 | 16.2 | ||
| CTg2 | 15ABE1 | Q.CTg2.ui-1B-1 | IWB58775 | 1B-1 | 128 | IWB10780–IWB58775 | 3.5 | 6.69 | 13.6 |
| Q.CTg2.ui-6B.1 | IWB10400 | 6B | 88.11 | IWB65137–IWB10400 | 3.8 | 2.32 | 14.5 | ||
| Q.CTg2.ui-5D-1 | IWB79949 | 5D-1 | 0 | IWB79949–IWB4139 | 3.7 | −2.28 | 14.5 | ||
| 15ABE2 | Q.CTg2.ui-2B-2 | Barc18 | 2B-2 | 21.88 | IWB22675–IWB11319 | 3.9 | 0.30 | 15.1 | |
| Q.CTg2.ui-4B.1 | IWB10190 | 4B | 29.65 | IWB20226–IWB57507 | 3.2 | −0.27 | 12.4 | ||
| Q.CTg2.ui-5B-2 | IWB29709 | 5B-2 | 13.69 | IWB80334–IWB29709 | 3.3 | −0.29 | 13.0 | ||
| 15ABE3 | Q.CTg2.ui-3A-1 | IWB33546 | 3A-1 | 2 | IWB33546–IWB14315 | 2.5 | 0.26 | 9.8 | |
| Q.CTg2.ui-6B.1 | IWB10400 | 6B | 88.11 | IWB65137–IWB10400 | 2.9 | 1.47 | 10.2 | ||
| Q.CTg2.ui-2D-1 | cfd73 | 2D-1 | 108.19 | cfd73–IWB1093 | 3.1 | 0.29 | 12.1 | ||
| 16ABE4 | Q.CTg2.ui-6B.1 | IWB10400 | 6B | 88.11 | IWB65137–IWB10400 | 2.6 | 1.08 | 10.4 | |
| Q.CTg2.ui-6B.2 | IWB75959 | 6B | 0 | IWB75959–IWB10604 | 5.2 | −0.76 | 19.7 | ||
| Average f | Q.CTg2.ui-1A | IWB36377 | 1A | 33.94 | IWB36377–IWB21518 | 4.0 | −0.61 | 15.3 | |
| Q.CTg2.ui-7A-1 | IWB46359 | 7A-1 | 48.95 | IWB25077–IWB46359 | 2.6 | −0.49 | 10.3 | ||
| Q.CTg2.ui-6B.1 | IWB10400 | 6B | 88.11 | IWB65137–IWB10400 | 2.6 | 0.47 | 10.3 | ||
| Q.CTg2.ui-2D-2 | IWB11455 | 2D-2 | 20.15 | IWB12523–IWB11455 | 2.8 | −0.52 | 11.1 |
| Traits | Trial | QTL a | Peak Marker | LG | Position b | Marker Interval | LOD c | Add d | R2 e |
|---|---|---|---|---|---|---|---|---|---|
| CCIa | 15ABE1 | Q.CCIa.ui-3D-1 | IWB45650 | 3D-1 | 18 | IWB45650–Wms3 | 2.6 | −3.44 | 10.3 |
| 15ABE2 | Q.CCIa.ui-3A-2 | IWB10063 | 3A-2 | 87.62 | IWB11450–IWB10063 | 3.9 | 2.99 | 15.1 | |
| Q.CCIa.ui-7B | IWB6754 | 7B | 233.72 | IWB25433–IWB6754 | 4.1 | −3.23 | 15.9 | ||
| Q.CCIa.ui-3D-2 | IWB9674 | 3D-2 | 16.91 | IWB9674–IWB71478 | 3.0 | 3.23 | 11.9 | ||
| Q.CCIa.ui-4D-1 | IWB8050 | 4D-1 | 45.41 | IWB14984–IWB8050 | 2.9 | −2.60 | 11.4 | ||
| Q.CCIa.ui-6D-3 | IWB13767 | 6D-3 | 0.91 | IWB13767–IWB46507 | 2.5 | 2.42 | 10.0 | ||
| 15ABE3 | Q.CCIa.ui-4A-1 | IWB12946 | 4A-1 | 78.95 | IWB37346–IWB10035 | 3.6 | 1.89 | 13.9 | |
| Q.CCIa.ui-7A-2 | IWB12020 | 7A-2 | 81.58 | IWB39758–IWB12020 | 4.1 | −1.45 | 15.9 | ||
| Q.CCIa.ui-2D-1 | IWB15442 | 2D-1 | 133.01 | IWB15442–IWB60397 | 3.4 | 1.86 | 13.4 | ||
| 16ABE4 | Q.CCIa.ui-2A-1 | IWB10499 | 2A-1 | 12.87 | IWB10836–IWB29812 | 3.2 | 3.26 | 12.5 | |
| Q.CCIa.ui-3A-1 | IWB33546 | 3A-1 | 2 | IWB33546–IWB14315 | 2.8 | −2.20 | 11.2 | ||
| Q.CCIa.ui-5A | IWB21197 | 5A | 165.38 | IWB21197–IWB35869 | 2.9 | 2.16 | 11.4 | ||
| Q.CCIa.ui-6A-2 | IWB19789 | 6A-2 | 70.82 | IWB22680–IWB19789 | 3.3 | −2.31 | 13.0 | ||
| Average f | Q.CCIa.ui-3A-2 | IWB10063 | 3A-2 | 87.62 | IWB11450–IWB10063 | 2.9 | 1.20 | 11.6 | |
| Q.CCIa.ui-7A-2 | IWB12020 | 7A-2 | 81.58 | IWB39758–IWB12020 | 5.1 | −1.71 | 19.1 | ||
| Q.CCIa.ui-2B-3 | IWB18944 | 2B-3 | 22 | IWB18944–Wmc149 | 2.5 | −1.28 | 9.9 | ||
| Q.CCIa.ui-6B | IWB58083 | 6B | 68.05 | IWB52064–IWB58083 | 5.1 | 1.66 | 19.2 | ||
| Q.CCIa.ui-3D-2 | IWB9674 | 3D-2 | 4.91 | IWB9674–IWB71478 | 3.9 | 1.54 | 15.1 | ||
| CCIg1 | 15ABE1 | Q.CCIg1.ui-2B-2.1 | IWB67534 | 2B-2 | 10.93 | IWB67534–IWB13631 | 4.2 | 9.26 | 16.3 |
| Q.CCIg1.ui-2B-2.2 | Barc18 | 2B-2 | 21.88 | IWB22675–IWB11319 | 3.2 | −6.80 | 12.5 | ||
| Q.CCIg1.ui-2D-1 | IWB15442 | 2D-1 | 133.01 | IWB15442–IWB60397 | 3.0 | 3.68 | 11.8 | ||
| 15ABE2 | Q.CCIg1.ui-4A-1 | IWB12946 | 4A-1 | 78.95 | IWB37346–IWB10035 | 2.8 | 2.73 | 11.1 | |
| Q.CCIg1.ui-5A.1 | IWB14149 | 5A | 91.35 | IWB14149–IWB10765 | 3.9 | 3.09 | 15.2 | ||
| Q.CCIg1.ui-5A.2 | IWB35869 | 5A | 166.29 | IWB21197–IWB17983 | 9.0 | −5.45 | 31.3 | ||
| 15ABE3 | Q.CCIg1.ui-3A-2 | IWB17683 | 3A-2 | 51.17 | IWB17683–IWB13444 | 3.1 | −2.70 | 12.2 | |
| Q.CCIg1.ui-5A.1 | IWB14149 | 5A | 91.35 | IWB14149–IWB10765 | 4.7 | 3.36 | 17.8 | ||
| Q.CCIg1.ui-2D-1 | IWB15442 | 2D-1 | 133.01 | IWB15442–IWB60397 | 4.7 | 3.02 | 18.0 | ||
| 16ABE4 | Q.CCIg1.ui-3A-2 | IWB17683 | 3A-2 | 51.17 | IWB17683–IWB13444 | 3.0 | −2.20 | 11.9 | |
| Q.CCIg1.ui-5A.1 | IWB14149 | 5A | 91.35 | IWB14149–IWB10765 | 8.7 | 5.21 | 30.6 | ||
| Q.CCIg1.ui-1D-2 | IWB65713 | 1D-2 | 0 | IWB65713–IWB55046 | 3.6 | 2.42 | 14.1 | ||
| Average f | Q.CCIg1.ui-5A.1 | IWB14149 | 5A | 91.35 | IWB14149–IWB10765 | 5.9 | 5.34 | 21.8 | |
| Q.CCIg1.ui-1D-1 | IWB42629 | 1D-1 | 19.94 | IWB42629–IWB80211 | 2.8 | −1.64 | 11.0 | ||
| Q.CCIg1.ui-2D-1 | IWB15442 | 2D-1 | 133.01 | IWB15442–IWB60397 | 5.5 | 2.22 | 20.6 | ||
| CCIg2 | 15ABE1 | Q.CCIg2.ui-1B-1 | IWB58775 | 1B-1 | 128 | IWB10780–IWB58775 | 3.0 | 3.08 | 11.7 |
| Q.CCIg2.ui-6D-3 | IWB46507 | 6D-3 | 0 | IWB46507–IWB13767 | 2.9 | −3.07 | 11.3 | ||
| 15ABE2 | Q.CCIg2.ui-4A-1 | IWB12946 | 4A-1 | 78.95 | IWB37346–IWB10035 | 3.0 | 2.74 | 11.7 | |
| Q.CCIg2.ui-5A.1 | IWB11865 | 5A | 167.2 | IWB21197–IWB17983 | 6.6 | −4.33 | 24.1 | ||
| Q.CCIg2.ui-1B-2.1 | IWB27496 | 1B-2 | 38.81 | IWB5753–IWB27496 | 3.1 | 4.99 | 12.2 | ||
| Q.CCIg2.ui-1B-2.2 | IWB21945 | 1B-2 | 53.38 | IWB21945–IWB14060 | 2.7 | −4.33 | 10.7 | ||
| Q.CCIg2.ui-3B-1 | IWB5790 | 3B-1 | 50.52 | IWB5790–IWB10800 | 3.5 | −3.12 | 13.7 | ||
| 15ABE3 | Q.CCIg2.ui-1A | IWB12695 | 1A | 157.15 | IWB11395–IWB13624 | 6.6 | 2.93 | 24.1 | |
| Q.CCIg2.ui-5B-2 | IWB5882 | 5B-2 | 43.81 | IWB36579–IWB18101 | 3.7 | 2.17 | 14.3 | ||
| Q.CCIg2.ui-2D-1 | IWB15442 | 2D-1 | 133.01 | IWB15442–IWB60397 | 6.9 | 2.98 | 25.2 | ||
| 16ABE4 | Q.CCIg2.ui-3A-2 | IWB29612 | 3A-2 | 100.63 | IWB29612–IWB63761 | 2.6 | −2.14 | 10.2 | |
| Q.CCIg2.ui-5A.1 | IWB11865 | 5A | 167.2 | IWB21197–IWB17983 | 3.9 | −3.73 | 14.9 | ||
| Q.CCIg2.ui-5A.2 | IWB14149 | 5A | 91.35 | IWB14149–IWB10765 | 6.2 | 4.58 | 22.7 | ||
| Q.CCIg2.ui-7A-3 | IWB27037 | 7A-3 | 0 | IWB27037–IWB65210 | 4.0 | −2.70 | 15.5 | ||
| Average f | Q.CCIg2.ui-1A | IWB13624 | 1A | 158.79 | IWB44568–IWB13624 | 2.7 | 1.38 | 10.6 | |
| Q.CCIg2.ui-3B-1 | IWB5790 | 3B-1 | 50.52 | IWB5790–IWB10800 | 3.8 | −1.59 | 14.6 |
| Trial | QTL a | Peak Marker | LG | Position b | Marker Interval | LOD c | Addd | R2 e | |
|---|---|---|---|---|---|---|---|---|---|
| PH | 15ABE1 | Q.PH.ui-6A-2.1 | IWB70003 | 6A-2 | 110.31 | IWB31050–IWB54778 | 5.2 | 3.36 | 19.6 |
| Q.PH.ui-7A-2 | IWB10274 | 7A-2 | 21.84 | IWB50481–IWB10274 | 2.7 | −2.37 | 10.9 | ||
| Q.PH.ui-2B-1 | IWB42693 | 2B-1 | 10.01 | IWB10588–IWB42693 | 4.2 | 3.24 | 16.1 | ||
| Q.PH.ui-5B-2.1 | IWB626 | 5B-2 | 42.9 | IWB36579–IWB18101 | 4.8 | −3.55 | 18.3 | ||
| Q.PH.ui-5B-2.2 | IWB2079 | 5B-2 | 94.84 | IWB19792–IWB1762 | 3.0 | 2.57 | 11.8 | ||
| Q.PH.ui-5D-3 | IWB17912 | 5D-3 | 0 | IWB17912–IWB63558 | 2.6 | 2.50 | 10.3 | ||
| 15ABE2 | Q.PH.ui-1A | IWB13768 | 1A | 96.17 | IWB34600–IWB67661 | 3.7 | 3.12 | 14.3 | |
| Q.PH.ui-6A-2.1 | IWB70003 | 6A-2 | 110.31 | IWB31050–IWB54778 | 3.4 | 3.06 | 13.3 | ||
| Q.PH.ui-6A-2.2 | IWB40830 | 6A-2 | 118.5 | IWB40830–IWB52007 | 4.0 | 3.32 | 15.6 | ||
| Q.PH.ui-7A-2 | IWB10274 | 7A-2 | 23.84 | IWB50481–IWB10274 | 2.5 | −2.60 | 9.9 | ||
| Q.PH.ui-2D-1 | IIWB15442 | 2D-1 | 133.01 | IWB15442–IWB60397 | 3.7 | 3.15 | 14.4 | ||
| 15ABE3 | Q.PH.ui-1A | IWB13768 | 1A | 96.17 | IWB34600–IWB67661 | 2.7 | 2.41 | 10.7 | |
| Q.PH.ui-6A-2.1 | IWB70003 | 6A-2 | 110.31 | IWB31050–IWB54778 | 3.3 | 2.76 | 12.8 | ||
| Q.PH.ui-1B-1 | Barc80 | 1B-1 | 14 | Barc80–IWB26010 | 4.8 | 3.75 | 18.1 | ||
| 16ABE4 | Q.PH.ui-5B-2.2 | IWB2079 | 5B-2 | 94.84 | IWB19792–IWB1762 | 3.2 | 2.68 | 12.7 | |
| Q.PH.ui-7B | IWB72296 | 7B | 0 | IWB72296–IWB13270 | 4.3 | 2.99 | 16.6 | ||
| Average f | Q.PH.ui-6A-2.1 | IWB70003 | 6A-2 | 110.31 | IWB31050–IWB54778 | 3.6 | 1.88 | 14.2 | |
| Q.PH.ui-6A-2.2 | IWB40830 | 6A-2 | 118.5 | IWB40830–IWB52007 | 3.5 | 1.88 | 13.7 | ||
| Q.PH.ui-7A-2 | IWB10274 | 7A-2 | 21.84 | IWB50481–IWB10274 | 2.7 | −1.52 | 10.8 | ||
| Q.PH.ui-5B-2.1 | IWB626 | 5B-2 | 42.9 | IWB36579–IWB18101 | 2.8 | −1.61 | 11.2 | ||
| TKW | 15ABE1 | Q.TKW.ui-2A-1.1 | IWB22006 | 2A-1 | 37.57 | IWB11289–IWB1047 | 4.1 | −2.45 | 15.7 |
| Q.TKW.ui-2A-1.2 | IWB51843 | 2A-1 | 44.85 | IWB14710–IWB51843 | 2.9 | −2.11 | 11.3 | ||
| Q.TKW.ui-3B-1 | IWB5790 | 3B-1 | 50.52 | IWB5790–IWB10800 | 5.3 | −2.83 | 20.0 | ||
| Q.TKW.ui-5D-1 | IWB71674 | 5D-1 | 34.35 | IWB22695–IWB35177 | 3.4 | 2.16 | 13.2 | ||
| 15ABE2 | Q.TKW.ui-2D-1 | cfd73 | 2D-1 | 108.19 | cfd73–IWB1093 | 3.7 | −2.07 | 14.3 | |
| Q.TKW.ui-3D-1.1 | IWB35432 | 3D-1 | 43.71 | IWB35432–IWB63148 | 2.6 | −1.70 | 10.2 | ||
| Q.TKW.ui-3D-1.2 | IWB45650 | 3D-1 | 12 | IWB45650–Wms3 | 5.3 | −2.13 | 19.5 | ||
| 15ABE3 | Q.TKW.ui-2B-4 | IWB11240 | 2B-4 | 101.17 | IWB11240–IWB42141 | 5.4 | −2.54 | 20.4 | |
| Q.TKW.ui-2D-1 | cfd73 | 2D-1 | 108.19 | cfd73–IWB1093 | 3.8 | −1.95 | 14.8 | ||
| Q.TKW.ui-3D-1.1 | IWB35432 | 3D-1 | 43.71 | IWB35432–IWB63148 | 3.7 | −1.88 | 14.2 | ||
| Q.TKW.ui-3D-1.2 | IWB45650 | 3D-1 | 12 | IWB45650–Wms3 | 4.8 | −2.40 | 18.2 | ||
| Q.TKW.ui-5D-1 | IWB71674 | 5D-1 | 34.35 | IWB22695–IWB35177 | 3.3 | 1.74 | 12.8 | ||
| 16ABE4 | Q.TKW.ui-4A-2 | IWB21392 | 4A-2 | 12 | IWB21392–IWB34577 | 3.9 | 1.79 | 15.2 | |
| Q.TKW.ui-5A | IWB17401 | 5A | 203.25 | IWB17401–IWB56891 | 5.4 | 2.08 | 20.2 | ||
| Q.TKW.ui-2D-1 | cfd73 | 2D-1 | 108.19 | cfd73–IWB1093 | 4.6 | −1.68 | 17.5 | ||
| Q.TKW.ui-2D-1.2 | IWB22901 | 2D-1 | 161.07 | IWB22901–Gwm484 | 5.1 | −2.10 | 19.1 | ||
| Average f | Q.TKW.ui-2A-1.1 | IWB22006 | 2A-1 | 37.57 | IWB11289–IWB1047 | 7.4 | −1.81 | 26.5 | |
| Q.TKW.ui-2A-1.2 | IWB51843 | 2A-1 | 44.85 | IWB14710–IWB51843 | 5.7 | −1.72 | 21.1 | ||
| Q.TKW.ui-2A-1.3 | IWB10540 | 2A-1 | 108.22 | IWB12554–IWB5752 | 5.4 | 1.48 | 20.1 | ||
| Q.TKW.ui-3B-1 | IWB5790 | 3B-1 | 50.52 | IWB5790–IWB10800 | 2.8 | −1.04 | 10.9 | ||
| Q.TKW.ui-2D-1 | cfd73 | 2D-1 | 108.19 | cfd73–IWB1093 | 5.7 | −1.52 | 21.1 | ||
| Q.TKW.ui-5D-1 | IWB71674 | 5D-1 | 34.35 | IWB22695–IWB35177 | 4.2 | 1.28 | 16.0 | ||
| GY | 15ABE1 | Q.GY.ui-7A-1 | IWB10036 | 7A-1 | 32.53 | IWB10481–IWB12655 | 4.8 | 0.48 | 18.2 |
| Q.GY.ui-5B-2 | IWB2079 | 5B-2 | 94.84 | IWB19792–IWB1762 | 3.8 | −0.46 | 14.6 | ||
| Q.GY.ui-6B | IWB42306 | 6B | 34.61 | IWB54721–IWB42306 | 4.4 | −0.57 | 16.7 | ||
| Q.GY.ui-3D-1 | IWB35432 | 3D-1 | 43.71 | IWB35432–IWB63148 | 3.2 | −0.39 | 12.7 | ||
| 15ABE2 | Q.GY.ui-2A-1.1 | IWB14710 | 2A-1 | 41.21 | IWB14710–IWB51843 | 2.5 | −0.37 | 9.9 | |
| Q.GY.ui-5A | IWB11626 | 5A | 120.51 | IWB11626–IWB35454 | 2.9 | −0.40 | 11.3 | ||
| Q.GY.ui-2B-4 | IWB11240 | 2B-4 | 111.17 | IWB11240–IWB42141 | 3.7 | −2.04 | 14.5 | ||
| Q.GY.ui-6B | IWB42306 | 6B | 34.61 | IWB54721–IWB42306 | 5.1 | −0.56 | 19.2 | ||
| 15ABE3 | Q.GY.ui-2A-1.1 | IWB14710 | 2A-1 | 41.21 | IWB14710–IWB51843 | 2.7 | −0.32 | 10.8 | |
| Q.GY.ui-3B-1 | IWB58000 | 3B-1 | 169.8 | IWB58000–IWB67913 | 4.0 | −0.87 | 15.4 | ||
| Q.GY.ui-5D-3 | Barc320 | 5D-3 | 30.31 | Barc320–IWB58388 | 4.8 | 0.45 | 18.4 | ||
| 16ABE4 | Q.GY.ui-1A.1 | IWB13768 | 1A | 96.17 | IWB34600–IWB67661 | 2.9 | −0.78 | 11.6 | |
| Q.GY.ui-1A.2 | IWB52960 | 1A | 110.81 | IWB78643–IWB31771 | 5.2 | 1.16 | 19.6 | ||
| Q.GY.ui-6A-2 | IWB34744 | 6A-2 | 155.47 | IWB34744–IWB199 | 2.7 | −0.39 | 10.6 | ||
| Q.GY.ui-6B | IWB42306 | 6B | 34.61 | IWB54721–IWB42306 | 4.3 | −0.60 | 16.6 | ||
| Q.GY.ui-1D-1 | IWB42629 | 1D-1 | 11.94 | IWB42629–IWB80211 | 5.5 | 0.59 | 20.4 | ||
| Average f | Q.GY.ui-2A-1.1 | IWB14710 | 2A-1 | 41.21 | IWB14710–IWB51843 | 3.6 | 0.20 | 13.8 | |
| Q.GY.ui-2A-1.2 | IWB22006 | 2A-1 | 37.57 | IWB11289–IWB1047 | 3.1 | −0.19 | 12.2 | ||
| Q.GY.ui-5A | IWB11626 | 5A | 120.51 | IWB11626–IWB35454 | 2.6 | −0.18 | 10.4 | ||
| Q.GY.ui-1B-1 | Barc80 | 1B-1 | 4 | Barc80–IWB26010 | 5.6 | 0.32 | 20.8 | ||
| Q.GY.ui-1B-2 | Barc152 | 1B-2 | 59.02 | Barc152–IWB30286 | 2.7 | 0.18 | 10.6 | ||
| Q.GY.ui-2B-2.1 | IWB15495 | 2B-2 | 30.98 | IWB14855–IWB50665 | 4.2 | −0.23 | 16.3 | ||
| Q.GY.ui-2B-2.2 | IWB10507 | 2B-2 | 36.44 | IWB10507–IWB17472 | 4.4 | −0.23 | 16.8 | ||
| Q.GY.ui-6B | IWB42306 | 6B | 34.61 | IWB54721–IWB42306 | 2.8 | −0.18 | 11.2 |
| Linkage Group | Cluster | Traits | Marker Interval | Position a |
|---|---|---|---|---|
| 1A | 1 | PH, GY | IWB34600–IWB67661 | 94.35–97.08 |
| 1B-1 | 1 | PH, GY | Barc80–IWB26010 | 0–18.01 |
| 2 | CTg1, CTg2, CCIg2 | IWB10780–IWB58775 | 127.09–128 | |
| 1D-1 | 1 | CCIg1, GY | IWB42629–IWB80211 | 11.94–23.0 |
| 2A-1 | 1 | TKW, GY | IWB11289–IWB1047 | 36.66–38.48 |
| 2 | TKW, GY | IWB56873–IWB51843 | 43.03–44.85 | |
| 2B-2 | 1 | CTg2, CCIg1 | IWB22675–IWB11319 | 20.97–25.52 |
| 2 | CTa, GY | IWB11092–IWB17472 | 41.9–43.72 | |
| 2B-3 | 1 | CTg1, CCIa | IWB18944–Wmc149 | 0–24.52 |
| 2B-4 | 1 | TKW, GY | IWB11240–IWB42141 | 91.17–111.28 |
| 2D-1 | 1 | CTg2, TKW | cfd73–IWB1093 | 108.19–110.01 |
| 2 | CCIa, CCIg1, CCIg2, PH | IWB15442–IWB60397 | 133.01–134.83 | |
| 3A-1 | 1 | CTg2, CCIa | IWB33546–IWB14315 | 0–5.58 |
| 3B-1 | 1 | CCIg2, TKW | IWB5790–IWB10800 | 50.52–54.16 |
| 3D-1 | 1 | TKW, GY | IWB35432–IWB63148 | 43.71–45.53 |
| 2 | CCIa, TKW | IWB45650–Wms3 | 0–22.27 | |
| 4A-1 | 1 | CCIa, CCIg1, CCIg2 | IWB37346–IWB10035 | 78.04–79.86 |
| 4B | 1 | CTa, CTg2 | IWB20226–IWB57507 | 27.83–30.56 |
| 2 | CTa, CTg2 | IWB12144–IWB35486 | 33.29–34.2 | |
| 5A | 1 | CCIg1, CCIg2 | IWB14149–IWB10765 | 91.35–93.17 |
| 2 | CCIg1, CCIg2 | IWB21197–IWB17983 | 165.38–169.93 | |
| 5B-2 | 1 | CTg1, CTg2 | IWB80334–IWB29709 | 10.96–13.69 |
| 2 | CTa, CCIg2 | IWB36033–IWB19921 | 18.24–20.97 | |
| 3 | CTa, PH | IWB36579–IWB18101 | 41.08–44.72 | |
| 4 | PH, GY | IWB19792–IWB1762 | 92.11–95.75 | |
| 6B | 1 | CTa, CTg1 | IWB75959–IWB10604 | 0–3.64 |
© 2018 by the authors. Licensee MDPI, Basel, Switzerland. This article is an open access article distributed under the terms and conditions of the Creative Commons Attribution (CC BY) license (http://creativecommons.org/licenses/by/4.0/).
Share and Cite
Liu, Y.; Wang, R.; Hu, Y.-g.; Chen, J. Genome-Wide Linkage Mapping of Quantitative Trait Loci for Late-Season Physiological and Agronomic Traits in Spring Wheat under Irrigated Conditions. Agronomy 2018, 8, 60. https://doi.org/10.3390/agronomy8050060
Liu Y, Wang R, Hu Y-g, Chen J. Genome-Wide Linkage Mapping of Quantitative Trait Loci for Late-Season Physiological and Agronomic Traits in Spring Wheat under Irrigated Conditions. Agronomy. 2018; 8(5):60. https://doi.org/10.3390/agronomy8050060
Chicago/Turabian StyleLiu, Yuxiu, Rui Wang, Yin-gang Hu, and Jianli Chen. 2018. "Genome-Wide Linkage Mapping of Quantitative Trait Loci for Late-Season Physiological and Agronomic Traits in Spring Wheat under Irrigated Conditions" Agronomy 8, no. 5: 60. https://doi.org/10.3390/agronomy8050060