Article

Simulating Volumetric Pricing for Irrigation Water Operational Cost Recovery under Complete and Perfect Information

Department of Agriculture, Forests, Nature and Energy (DAFNE), University of Tuscia, via S.Camillo de Lellis, Viterbo 01100, Italy
*
Author to whom correspondence should be addressed.
Water 2014, 6(5), 1204-1220; https://doi.org/10.3390/w6051204
Submission received: 30 January 2014 / Revised: 11 April 2014 / Accepted: 22 April 2014 / Published: 7 May 2014
(This article belongs to the Special Issue Water Policy, Productivity and Economic Efficiency)

Abstract

:
This study evaluated the implementation of a volumetric and cost-recovery pricing method for irrigation water under symmetric information conditions without the inclusion of implementation costs. The study was carried out in two steps. First, a cost function was estimated for irrigation water supplied by a water user association to a typical Mediterranean agricultural area, based on a translog function. Second, the economic impact of a pricing method designed according to this cost function was simulated using a mathematical programming territorial model for the same agricultural area. The outcomes were compared with those for the current pricing method. The impacts of this pricing method are discussed in terms of its neutral effects on total farm income and, conversely, the importance of the redistributive effects.

1. Introduction

In addition to the controversial interpretation of the European Water Framework Directive 60/2000 (WFD) [1], the European Union National Associations of Water Suppliers and Waste Water Services issued a position paper [2] for development of a guideline on water service costs that should be recovered from water service users, and the extent to which water users should contribute to recovery of the costs of water service operators. The WFD presented a number of cost recovery issues associated with water services, efficient water management, and water protection, in relation to its various forms and availability [3].
Economic analysis of irrigation water can: (i) inform sustainable water management; (ii) be used for implementing the WFD [4]; and (iii) identify possible problems in policy design. In particular, under the conditions of the irrigation-based agriculture practiced in arid areas of the European Mediterranean, complying with the general principles of the WFD could be inconsistent with meeting its individual objectives. For example, recovery of the complete cost of water services by increasing irrigation payments could lead to problems in protecting the resource, as it would encourage farmers to use alternative water sources [5], including groundwater or rivers [6]. Furthermore, in the case of under-utilization of facilities for irrigation water supply, attaining full cost recovery involves fees calculated on the basis of average costs; this could result in fees much higher than marginal costs [7]. The recovery of costs would then be in conflict with efficiency. Pursuing the recovery of costs by increasing irrigation payments could generate a vicious cycle if it produces a gradual reduction in the use of water supplied by water utilities, such as the Water User Associations (WUAs) [8].
As outlined by Tsur [9], implementation costs theoretically change the performance of pricing methods, and hence can change their order of efficiency. In the absence of implementation costs, volumetric pricing methods are capable of achieving a first-best allocation (i.e., an outcome that maximizes the net benefit that can be generated using the available water). The maximum benefit that can be attained using input or output pricing would, in general, be smaller than the benefit attainable using volumetric pricing (i.e., the first-best outcome). This is because the water charges imposed on other inputs or outputs can distort input/output decisions. However, these charges are still chosen to maximize a social benefit function, although a distorted one. Input/output pricing is generally referred to as second-best efficient (efficient, because it maximizes benefit; second-best, because the benefit capable of being achieved is less than that under volumetric pricing).
Another factor markedly affecting the performance of pricing schemes is asymmetric information, which contrasts with the assumption of perfect information required by neoclassical economics. It occurs where decisions are made, but some of those affected have more or less information than others. Within the scope of this study, this can take three basic forms: (i) private individual water use (unmetered water); (ii) water production technologies at the farm level that are unknown to the regulator [9]; and (iii) water service production function at the WUA level that is unknown to the farmers [7].
The objective of this study was to evaluate the implementation of a cost-recovery and volumetric pricing method under symmetric information conditions, without the inclusion of implementation costs. It was carried out in two steps. First, a cost function was estimated for the water distribution cost (WDC) in a typical Mediterranean agricultural area, considering the various outputs and inputs. Second, two pricing methods, the existing method and one designed according to the estimated cost function, were simulated using a mathematical programming territorial model that represented the area in which the cost function was estimated. The results obtained enabled assessment of the merits of implementing the hypothetical and theoretically flawless pricing method.

2. Materials and Methods
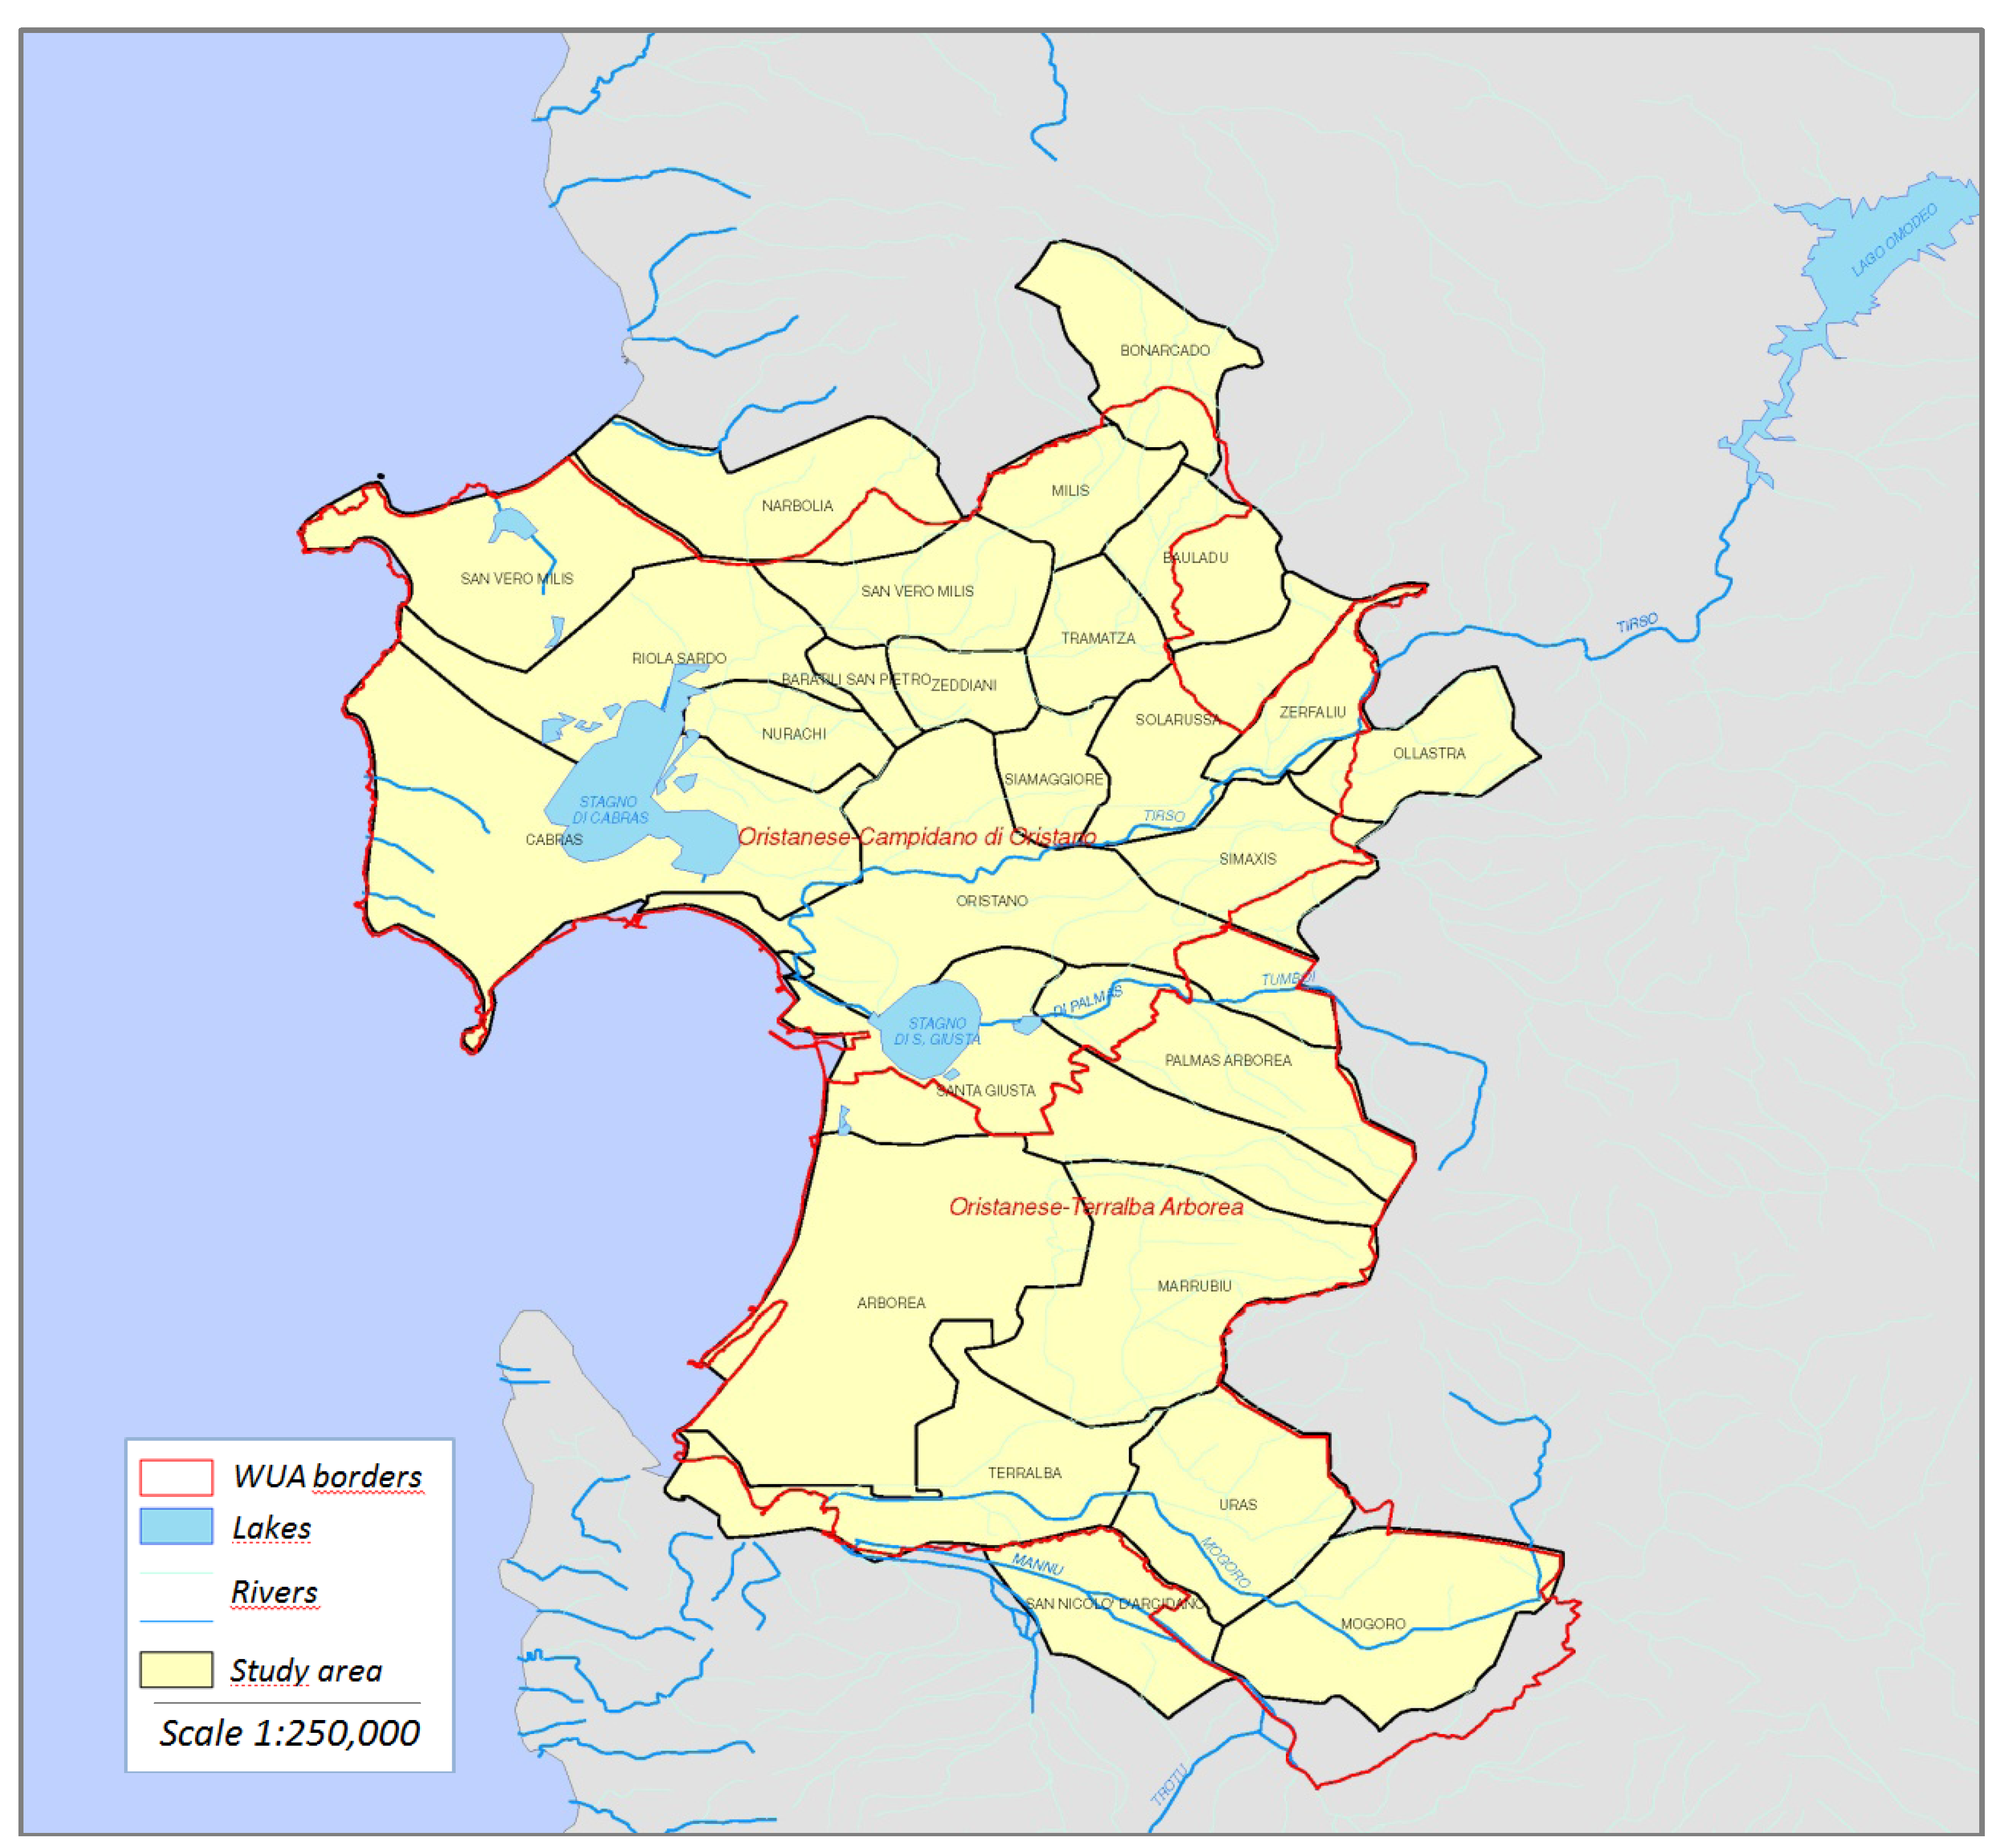
2.1. The Study Area

The study area is the land covered by the “Consorzio di Bonifica dell’Oristanese” (CBO-WUA) Water User Association in Sardinia, Italy. Irrigation networks were installed following drainage of the area in the early 1900, and since then has gradually been extended and modernized. The study area covers 85,363 ha, of which 36,000 ha are equipped with irrigation and drainage facilities provided by the CBO-WUA. The major crops are cereals (mainly corn and rice) and fodder crops (in particular alfalfa and ryegrass); large areas of land are also cropped using glasshouse vegetable production, with artichoke and tomato being the most important. The remaining production comes from orchards, with the northern area being famous for orange, vineyard, and olive production. The southern side of the CBO-WUA specializes in dairy production, for which it is recognized nationally. It has a plant for treating and packaging milk collected from the farms in the area. The most widely used irrigation techniques involve sprinklers for fodder crops, cereals, and some vegetables including potatoes, and micro-irrigation for most of the vegetables, orchards, vineyards, and greenhouses. Figure 1
Figure 1. The study area in western Sardinia (Italy), showing the borders of the irrigation districts. Source: [10].
Water 06 01204 g001
The area not served by the CBO-WUA irrigation facilities is mainly rain-fed, although some farms are irrigated with groundwater drawn from private wells. In addition to the importance of cereal and fodder crops, 55% of the area comprises pastures that are often not cropped or are woods, tare and set-aside. Sheep breeding is the major livestock activity in the area. It involves 372,000 head and the presence of several milk processing plants for sheep cheese production.
The water delivery system of the CBO-WUA involves irrigation water obtained from a reservoir on the Tirso River; the reservoir is located at a higher elevation than the irrigated area. The reservoir came into operation in 2003 and can store approximately 500 million cubic meters. Prior to 2003, irrigation water was obtained from a smaller reservoir with a capacity of 130 million cubic meters. The irrigation network of the CBO-WUA consists of pipelines for the supply of water under pressure to certain districts, and open channels for gravity distribution to other districts. The gravity system mainly supplies water to rice-growing and marginal areas, but is progressively being replaced with pipelines.

2.2. The Economic Territorial Model

The economic model used in the study is a supply territorial model comprising five categories of district (md) and 13 farm types (ty). The model is divided into 25 blocks, as not all farm types are present in all five districts. Each block can be considered to be a macro-farm representative of the area.
The objective function of the model, z, has the structure defined by Equation (1):
Water 06 01204 i001
where z is the expected gross margin; Pj,md,ty are the output prices for each of the j crops, for each district md and for each farm type ty; Yj,md,ty are the respective crop yields; xj,md,ty are the areas of each activity j (in hectares); Pmilkc is the price of dairy milk; Qmilkctyc is the milk production in the cattle farm types (tyc); Pmilks is the price of sheep milk; Qmilkstys is the milk production in the sheep farm types (tys); CAj are the coupled payments under the Common Agricultural Policy (CAP); sfpty, helegmd,ty and modmd,ty are (respectively) the Single Farm Payment (SFP), the eligible area, and the value of the SFP lost by the farm because of subsidies modulated according to the CAP; Pinp md,ty,inp and Qinpj,md,ty,inp are the prices and the quantities for the various inputs inp, respectively; Twathaj,md are the water tariffs currently imposed on the various crops and applied per hectare by the WUA; Cpumpmd and watpumpmd,ty,t are the costs to pump water from private wells on the farms and the quantity of water pumped in each period t (10-day periods), respectively; Plabext and labextmd,ty,t are the price and the availability of temporary wage labor, respectively; Palimcfeedc and alimcfeedc,md,tyc are the prices and quantities of feed (feedc), respectively, purchased by the cattle farms; and Palimsfeeds and alimsfeeds,md,tys are the prices and quantities of different feed (feeds), respectively, purchased by the sheep farms.
The model contains constraints on land, labor, animal feeding and water. The land constraints include total farm type availability, fixed crops, irrigable land and greenhouses. The labor constraints concern farm and external labor. As some farm types have animals requiring feeding, their requirements are satisfied using farm-produced fodder crops and feeds purchased on the market; the scheme has a dedicated constraint in the model. The water constraints are defined according to Equations (2)–(6), as follows:
Water 06 01204 i002
where Rwaterj,mdwua,ty,tirr are the water requirements for each of j crops in the irrigation period (tirr; 10-day periods from April to October); awatertirr is the availability of agricultural water in the reservoir during the irrigation period, according to the WUA plan. The water availability is a variable calculated according to Equation (3):
Water 06 01204 i003
where water availability in the next 10-day period depends on water availability minus the irrigation water consumed in the current 10-day period.
Water 06 01204 i004
The WUA distributes water from April to October, and in other months farms can irrigate by pumping water from wells: the variable indicates the extent of these uses.
Water 06 01204 i005
In the area not serviced by the CBO-WUA it is possible to pump water from wells.
watpumpmd,ty,t ≤ Awellmd,ty,t∀ md, ty, t
The potential to pump is constrained by the Awellmd,ty,t availability, which depends on the number and capacity of the wells.

Model Calibration: Risk Aversion and Positive Mathematical Programming

The calibration procedure was based on two steps [11] that are widely used for calibration in this type of mathematical programming model. The risk approach considers the market risk exposure of the farmer, and positive mathematical programming (PMP) enables representation of cost geometry that is more consistent with neoclassical economic theory. In the first step, a risk aversion coefficient was used to calibrate the model and to obtain the best fit between the observed crop pattern and the model’s predicted crop pattern. The goodness of this fit was assessed statistically using the Finger–Kreinin similarity index [12]. The aim of this step was to ensure that the model produced acceptable results before proceeding to the second step. The model is a risk programming model that takes the risk into account through the mean–standard deviation method, in which the expected utility is defined by two arguments: the expected income and its standard deviation [13].
In the second step the PMP methodology was used to calibrate the model to the observed situation. In developing the PMP methodology, a profit-maximizing equilibrium in the reference period was assumed in calibrating agricultural supply. This recovered additional information from the observed activity levels, enabling specification of a non-linear objective function such that the resulting non-linear model exactly reproduced the observed behavior of farmers [14,15,16,17]. In recent years, the PMP methodology has been applied in various research areas and has been improved to consider many relevant aspects [18,19,20,21,22,23,24,25,26]. Heckelei et al. [27] recently reviewed the more important PMP models that have been development and used.

2.3. Operational Cost for Water Distribution

Dono and Giraldo [7] estimated a flexible cost function for the operational costs incurred by the CBO-WUA in supplying irrigation water to farmers. They used a flexible functional form as it eliminates prior restrictions on its first and second derivatives (as preferred in empirical analyses), and chose the translog (TL) specification, as it is the most parsimonious for the parameters to be estimated [28]. The four estimated functions, one for each distribution technology adopted, were also explored in [7] and [29]: HP and LP refer to systems of pipelines delivering water at high (HP) and low pressure (LP), respectively; GR stands for gravity, and refers to the delivery of water in open channels by gravity; the fourth technology modeled was RG (referring to gravity channels that involve some pumping because of minor hilly sections). The latter technology was not considered in this study as it was very marginal.
Water 06 01204 i006
In the form represented in Equation (7), the TL is a quadratic function of the logarithm of z. However, for convenience of notation consider z = (z1, z2zn+3) = (y1, y2, w1wn, λ1), where the first elements of z are the quantity of outputs (y), the second group (w) is the price of inputs, and the third (λ) refers to environmental variables that represent structural or environmental features that affect the system performance. This model, together with n-1 equations of the cost share of each input derived from Shephard’s lemma, constituted the system estimated using the seemingly unrelated regression (SUR) method proposed by Zellner [30], which was improved based on the suggestions of Weninger [31] and Battese [32] for treating null values, and according to Dono and Giraldo [7] and Dono et al. [29].
The observations used in the study were derived from annual data for the 25 irrigation districts of the CBO-WUA over the 11 years from 1995 to 2005. This time scale was chosen because the current water price was based on annual costs, and more detailed and sub-yearly data were not available. The functions were structured as multi-output, as suggested in previous studies involving the water sector [33], and two variables were identified: the irrigated agricultural surface area and the watering intensity (the provision of a volume of water per irrigated hectare). The product of these two variables provided the volume of water delivered by the WUA, but splitting it into these two components permitted assessment of their individual contributions to the water service operational costs.
Table 1 shows the estimated elasticity for each of the two outputs, expressed as the percent variation of costs with respect to percent changes in each output.
Table 1. Elasticity of cost to outputs under the various Consorzio di Bonifica dell’Oristanese” Water User Association CBO-WUA distribution technologies.
OutputHP pipelinesLP pipelinesGR channels
Irrigated land0.7980.8240.897
Water/hectare0.378–0.084 **0.498
Note: ** this estimate is not significantly different from zero at p = 0.37.
The study of cost functions gives information on the elasticity of costs to outputs; in the TL case, the elasticities are given by the parameters α relative to the variables y. This analysis showed that the elasticities were always less than 1, indicating that the system was generally operating below its capabilities. It also showed that the marginal costs were lower than the average costs, indicating that the optimal price (efficiency price) would not cover the cost (it would be possible using average cost as price).

2.4. Simulation of Hypothetical Payment Scheme under Complete and Perfect Information

2.4.1. Baseline Scenario

The model run set comprised two simulations. The first was the Baseline scenario, in which the model was run as calibrated, and represented the actual behavior of the 2010 farmers with respect to the use of resources. In this scenario farmers paid the CBO-WUA for irrigation water based on the surface area supplied and the estimated irrigation requirements of the specific crop under cultivation.
Water 06 01204 i007
Equation (8) is the component of the objective function in Equation (1) accounting for CBO-WUA water payments, where Twathaj,md is the water tariff currently imposed by the CBO-WUA on various crops (j), differentiated by distribution technology (md) and applied per hectare (x).
Table 2 shows the price per hectare requested by the CBO-WUA and how it varied according to the crop and the technology used in the district. These prices complied with Regional Law N.6/2003, which sets the maximum price level [34]. The Arborea district, which consists almost entirely of dairy farms supplied with water at high pressure (HPa), is distinguished from the other high-pressure districts (HPb), where dairy farms are absent. That is because the Arborea district has soil characteristics and farmer behaviors that differ from those of the other districts, and the CBO-WUA chose to apply different prices.
Table 2. Water price, expressed in €/ha, currently required by the CBO-WUA under the irrigated hectare pricing scheme.
CropHPaHPbLPGR
Melons72584226
Ryegrass
Clementine73
Orange
Carrot103836037
Strawberry
Lettuce
Pepper
Potato
Artichoke
Tomato1341107848
Maize1651339659
Sorghum
Alfalfa141
Rice24820014488

2.4.2. Simulated Scenario

The Simulated scenario is hypothetical: it entails theoretical conditions that are quite extreme and largely implausible, but because of this can be helpful in understanding the possible consequences of their acceptance. The represented condition is one in which farmers share and compete for resources while aiming to achieve maximum income. In this kind of model it is assumed that every player (i.e., farmer) knows the rules and is aware of the pay-offs associated with every move. In simultaneous models with complete and perfect information, every player knows the pay-offs and the strategies available to other players; in addition, every player moves simultaneously with the others, and at the same time knows all moves being made [35,36].
In this scenario, every farmer has knowledge of the underlying CBO-WUA cost function for water distribution, and they know how their choices of irrigated land allocation and watering intensity affect the cost of water being supplied. In addition, every farmer knows how the cropping and watering decisions of other farmers contribute to his/her costs of supply with CBO-WUA irrigation water. This is defined as “perfect and complete information on cost recovery”. Assuming this condition helps in assessment of the advantages and disadvantages of the application of volumetric pricing, by perfectly reflecting the operational cost structure in Mediterranean areas.
Representing this condition is achieved by integrating the water distribution cost reported in Equation (7) into the territorial model of Equation (1), such that every farm type pays exactly for the water used and the surface irrigated, and the price paid covers the cost.
Water 06 01204 i008
Based on Equation (7), in Equation (9) the parameter y represents the irrigated land and the water per hectare applied within each irrigation district. The cost calculated according to Equation (9) is relative to the irrigation district and is shared proportionately among all farm types according to the volume of water used by each type; this achieves volumetric water pricing defined by the district and the farm type. It is derived by inserting Equation (10) into the objective function of Equation (1), replacing the Baseline scenario water payments as in Equation (8).
Water 06 01204 i009
In the Simulated scenario the only difference from the Baseline scenario concerns the water payment scheme.

3. Results and Discussion

3.1. Results

Table 3 summarizes the impact on aggregated economic variables for the entire area and shows their values in the Baseline and Simulated scenarios and their absolute and percentage variations. In the Baseline scenario, water pricing does not fully cover the total WDC (61%). As reported in Table 2, Regional Law N.6/2003 sets the maximum price imposed by the CBO-WUA on farmers for the irrigation service and establishes that the costs not covered are funded by regional support. Currently, these additional costs are completely recovered through public support [34]; in Table 3 this is referred to as “Rest-of-society coverage”. In the Simulated scenario, by definition the total WDC is fully covered (100%) by water pricing. The higher price of water for farmers reduces the CBO-WUA water demand and the use of its facilities, decreasing the total WDC (Table 4). Given the condition of elasticities less than 1 (Table 1), the sustainability of the CBO-WUA is at risk because of increasing underutilization of its facilities, which also results in higher average costs to farmers through their irrigation payments. Under the Simulated scenario the society is not responsible for any part of the WDC (society contribution = 0), saving €1,380,000. However, the increased cost to farmers through water payments offsets this social gain by approximately €1,055,000. The WDC changes from being partially to fully internalized in the CBO-WUA payment scheme, and represents a total gain of €325,000 (the difference between the €1,380,000 saved by the society and the increase farmer water payments of €1,055,000). The net income of farmers decreases more than the increase in sole water payments, which also has an amplifying effect on the production process. Farmers reduce the use of water as a reaction to the higher water price, resulting in a reduction of some irrigated crops, because the trade-off between the water price and the water benefit is no longer advantageous. Hence, the consequent drop of net income is €1,390,000, which balances the savings to the society and gives a negligible total net loss of €10,000.
Table 3. Economic variables for the total area under the Baseline and Simulated scenarios, and their absolute and percentage variations.
‘000 EURBaselineSimulatedAbsolute variationPercentage variation
Water Distribution Cost3,5243,199–325–9.2
Pricing Coverage2,144 (61%)3,199 (100%)1,05549.2
Rest-of-society coverage1,3800–1,380–100.0
Farmers’ Net Margin77,48876,097–1,390–1.8
Total social gain –10
A negative benefit, although small in magnitude, is evident for the entire system when the societal gain (no requirement to pay for costs not covered by the quota) and the loss of net farmer income are compared (Table 3). However, the negative total social gain is very close to zero only because of the basic assumption of zero implementation cost. In the Simulated scenario, while it is assumed that the hypothetical payment scheme is operating perfectly, no account is made for any cost in its implementation, maintenance and enforcement. Volumetric pricing requires metering of water use at the farm level, implying that every farm has to be equipped with water meters, and that the meters are maintained in perfect working condition. Including these costs could further reduce use of the CBO-WUA facilities, and so increase its average cost; such costs would certainly decrease farm income and make introduction of this system less favorable. Despite the decrease in social welfare, such costs have to be taken into account in considering the merits of switching to a volumetric and cost-recovery pricing method.
Table 4 shows the impact on the use of water and labor resources in the area, including total values for the two scenarios, and the absolute and percentage variations between them. Groundwater in this area is mainly used to complement surface CBO-WUA water; the use of groundwater declines with reduced CBO-WUA water demand. In the long term, a growing demand for cheaper water may result in increased exploitation of groundwater through an increase in the number of wells or they capacity. It could also reduce the employment of hired labor because of contraction of agricultural business, and employment of farm family labor could be similarly affected (Table 4).

3.2. Impact among Districts and Farm Types

It is interesting to compare the overall small economic impact with the redistributive effects within the CBO-WUA, particularly the effects on districts having different water supply technologies (and therefore costs), and on different types of farms. The CBO-WUA charges farmers by allocating the water distribution costs and also takes into account the supposed benefit farmers get from the irrigation. In the Simulated scenario farmers are charged according to their share of the water distribution cost, which differs depending on the water distribution technology used in the district and the level of use of the water resource. These data are shown in Table 5, which reports the price per irrigated hectare and per cubic meter of water in the irrigation districts under the two scenarios, (The price per cubic meter in the current payment system is implicit: it is obtained by dividing the fee for “hectare crop” by the cubic meters of water allocated to each crop) their percentage differences and the elasticity of response in switching to the Simulated model.
Table 4. Use of water and labor resources in the area under the Baseline and Simulated scenarios, and their absolute and percentage variations.
ResourceBaselineSimulatedAbsolute variationPercentage variation
Total Water (‘000 m3)122,145117,252−4,893−4
CBO-WUA water115,156110,497−4,659−4
Groundwater6,9896,756−233−3
Total Labour (hours)5,2235,148−75−1
Farm Labour4,3154,276−39−1
External Labour908872−36−4
Table 5. Water price and elasticity with respect to surface and volume water price for each distribution technology.
Water Price (€/ha)BaselineSimulatedPercentage variationElasticity
High Pressure a12719251.0−0.189
High Pressure b10019292.5−0.087
Low Pressure77197155.0−0.026
Gravity7818−77.0−0.001
Total10416659.9−0.112
Water Price (€/m3)
High Pressure a0.03590.051242.8−0.103
High Pressure b0.01970.036786.1−0.056
Low Pressure0.01440.0390170.9−0.056
Gravity0.00620.0014−77.0−0.001
Total0.01860.028955.5−0.073
In both cases there is a shift in cost recovery from gravity-channel districts towards pipe-supplied districts. As shown previously, the water distribution cost is strongly affected by the pressure required, which is related to the use of electric power. In the Simulated scenario, gravity-channel farmers would be charged a lower price than at present; this indicates that these farmers are currently paying more than the cost they generate in being supplied with water by the CBO-WUA.
In terms of understanding how implementing the Simulated scenario would affect the various farm types modeled, Table 6 and Table 7 report the return on equity (ROE) and the hourly remuneration for farm labor (RFL) for each farm type.
Table 6. Return on equity (ROE) for each farm type under the Baseline scenario, and its % variation under the Simulated scenario conditions.
Farm typeBaselineSimulated (%∆)
WUA facilitiesHPaHPbLPGROff-WUATOTALHPaHPbLPGROff-WUATOTAL
Rice-1.01.34.2-3.6-−21.2−33.76.7-4.5
Citrus-5.1---5.1--2.5---−2.5
Cattle A5.8----5.8−1.9----−1.9
Cattle B4.2----4.2−2.9----−2.9
Greenhouse0.72.13.43.7-1.2−7.3−3.3−5.73.8-−4.7
Vegetables- Cereals2.52.22.32.2-2.3−2.7−3.3−16.66.4-−6.8
Cereals- Forages-2.52.6--2.6-−2.2−6.7--−2.6
Tree and arable crops--0.82.8-1.1--−5.54.4-−1.6
Sheep A-1.11.72.1-1.3-−3.8−6.51.8-−3.2
Off-WUA
Vegetables-Fruit----2.12.1----0.00.0
Cereals-Forages----4.34.3----0.00.0
Sheep B----−0.2−0.2----0.00.0
Sheep C----0.40.4----0.00.0
Total4.82.42.13.71.13.0−2.2−3.0−14.76.30.0−2.6
Notes: HPa, HPb: high pressure; LP: low pressure; GR: gravity; Off WUA: not supplied by the WUA.
Table 7. Remuneration per hour of farm labor (RFL) for each farm type in the Baseline scenario, and its % variation under the Simulated scenario conditions.
Farm typeBaseline (€/h) Simulated (% ∆)
WUA facilitiesHPaHPbLPGROff-WUATOTAL HPaHPbLPGROff-WUATOTAL
Rice-−10.4−2.340.8-31.8 -−42.2−395.810.5-9.0
Citrus-21.2---21.2 -−2.7---−2.7
Cattle A16.1----16.1 −1.5----−1.5
Cattle B12.8----12.8 −2.1----−2.1
Greenhouse3.47.811.512.3-5.1 −8.2−2.2−4.83.3-−4.8
Vegetables-Cereals8.88.18.28.1-8.2 −1.7−2.4−12.34.4-−4.9
Cereals-Forages-18.418.9--18.5 -−3.5−10.9--−4.2
Tree and arable crops--5.19.0-5.7 --−2.22.5-−0.9
Sheep A-4.66.67.7-5.2 -−3.0−5.51.6-−2.6
Off-WUA
Vegetables- Fruit----7.77.7 ----0.00.0
Cereals-Forages----15.715.7 ----0.00.0
Sheep B----1.31.3 ----0.00.0
Sheep C----4.24.2 ----0.00.0
Total14.19.27.717.45.110.6 −1.5−3.0−11.58.00.0−2.0
Notes: HPa, HPb: high pressure; LP: low pressure; GR: gravity; Off WUA: not supplied by the WUA.
ROE is the ratio of the income that remains to remunerate the equity (after all other factors are compensated) to the value of the equity (including land value). Thus, it is a measure of the productivity of the invested property capital and a synthetic expression of the economic performance [37]. ROE disregards a crucial objective of family farms, which is to maximize labor use, and is not sufficient for assessing the economic performance of these types of units. However, it provides a good indication of the productivity of the capital invested. The upper section of Table 6 contains the values of ROE in the Baseline scenario and for different farm types. Intensive farming appears to be more valuable in terms of ROE, with higher values for citrus growers and dairy farms. The worst performing in terms of ROE are the sheep breeders whose farms are located outside the area served by the CBO-WUA. The lower section of Table 6 shows the percent variation in ROE under the Simulated scenario. As expected from the previous discussion, all farms serviced by gravity channels show some benefit under this scenario. This is because of the lower price resulting from charging farmers for the contribution they make to generation of the water distribution cost. Rice growers are mainly located in gravity-fed districts, so their ROE increases, even if a minor part of their operations occur in other districts and is heavily and negatively affected. The others in general charged with the full WDC are those already showing very low ROE in the Baseline scenario, such as sheep breeders and greenhouse farmers.
As maximization of the ROE is not always the major objective of family farms, the use of indicators of employment and the ability to compensate for family labor help in understanding the impact on farm performance. The results of this aspect of the study are shown in Table 7.
As noted above, rice growers are on average favored under the simulated condition through increased remuneration for labor, although because the farms are located in LP districts and are in the Baseline, they would probably cease production or transform to a different type of farming.

4. Conclusions

In this study we simulated the application of a hypothetical water policy in a Mediterranean agricultural area using basic principles of water pricing. Currently, as represented by the Baseline scenario, farmers in the area pay for irrigation water provided by a WUA that manages the water distribution facilities. The charges are based on irrigated area/crop pricing. The first step in the study involved estimating a translog cost function for the production of irrigation water by the WUA. This showed that the water distribution cost was based on the area of land supplied with water and the watering intensity on that land. The second step was to design a pricing method that considered all the information derived from the first step and to simulate implementation of the pricing method using a mathematical programming territorial model. This was undertaken with no accounting for implementation costs, but using complete and perfect information conditions (i.e., symmetric information). This procedure was over-compliant with the WFD but provided insights into the possible consequences for irrigated and water-constrained agriculture. Although the simulated pricing scheme is considered a “first best method”, the total gain from its application was barely neutral, but would be negative if implementation costs were included, and this was exacerbated by the reduction of labor and appeared unrealistic about the information available to farmers about the behavior of other farmers and the WUA cost structure.
The results of this case study confirm the results of previous theoretical studies [12,38]. Among these results, the neutral effect on total revenue and the importance of distributional effects are noteworthy. Of particular concern are the consequences of the sharp fall in the price of gravity-fed water supply in the Simulated scenario, which could lead to inefficient use of water resources. However, in other areas affected by specific water scarcity problems, and where the competition for water use is greater, the application of other tariff systems might be more efficient. For example, Alarcón et al. (2011) showed that water pricing and over-consumption penalties facilitated efficient utilization and also the ability to adjust consumption to resource availability and current economic and market situations, especially in response to crop subsidies [39].
In conclusion, assessment of the overall performance of a pricing method must include implementation costs. It is possible (and not uncommon where irrigation water is limited) that an inefficient per-area pricing method outperforms an efficient volumetric pricing method, especially if the difference in implementation costs between the two methods outweighs the efficiency difference, if any.

Acknowledgments

The study was funded by the Italian Ministry of Agriculture within the Agroscenari research project.

Author Contributions

Luca Giraldo prepared the paper, estimated the water distribution cost (WDC) function and plugged it into the territorial model. Raffaele Cortignani worked on the territorial model and performed the two-step calibration. Gabriele Dono had the original idea, contributed to the economic discussion and supervised the research. All three authors discussed the results and are responsible for the presented shape of the paper.

Conflicts of Interest

The authors declare no conflict of interest.

References

  1. European Parliament and the Council of EU. OJEC L 327: Directive 2000/60/EC Establishing a Framework for Community Action in the Field of Water Policy. European Parliament and the Council of EU: Aberdeen, UK, 2000. [Google Scholar]
  2. European Union of National Association of Water Suppliers and Waste Water Services. Water Framework Directive—Determination of Cost Recovery; European Federation of National Associations of Water Services: Brussels, Belgium, 2004. [Google Scholar]
  3. WATECO Group. Economics and the Environment—The Implementation Challenge of the Water Framework Directive. In CIS Guidance Document 01 Common Implementation Strategy for the Water Framework Directive (2000/60/EC); European Communities: Luxemburg, 2003; ISBN: 92-894-4144-5. [Google Scholar]
  4. Berbel, J.; Azahara Mesa-Jurado, M.; Pistón, J.M. Value of irrigation water in Guadalquivir basin (Spain) by residual value method. Water Resour. Manag. 2011, 25, 1565–1579. [Google Scholar] [CrossRef]
  5. Venot, J.P.; Molle, F. Groundwater depletion in the Jordan highlands: Can pricing policies regulate irrigation water use? Water Resour. Manag. 2008, 22, 1925–1941. [Google Scholar]
  6. Dono, G.; Giraldo, L.; Severini, S. Pricing Irrigation Water under alternative charging methods: Possible shortcomings of a volumetric approach. Agric. Water Manag. 2010, 97, 1795–1805. [Google Scholar] [CrossRef]
  7. Dono, G.; Giraldo, L. Un’analisi dei costi per la distribuzione dell’acqua in agricoltura. Riv. Econ. Agrar. 2009, 3–4, 339–357. [Google Scholar]
  8. Azevedo, L.G.T.; Baltar, A.M. Water pricing reforms: Issues and challenges of implementation. Water Resour. Dev. 2005, 11, 19–29. [Google Scholar] [CrossRef]
  9. Tsur, Y. Water regulation via pricing: The role of implementation costs and asymmetric information. In The Political Economy of Water Pricing Reforms; Dinar, A., Ed.; World Bank Publications: Washington, DC, USA, 2000. [Google Scholar]
  10. National Institute of Agricultural Economics (INEA), Rome, Italy. Unpublished work. 2014; Unpublished work.
  11. Van Ittersum, M.K.; Ewert, F.; Heckelei, T.; Wery, J.; Olsson, J.A.; Andersen, E.; Bezlepkina, I.; Brouwer, F.M.; Donatelli, M.; Flichman, G.; et al. Integrated assessment of agricultural systems—A component-based framework for the European Union (SEAMLESS). Agric. Syst. 2008, 96, 1–3. [Google Scholar] [CrossRef]
  12. Finger, J.M.; Kreinin, M.E. A measure of export similarity and its possible uses. Econ. J. 1979, 89, 905–912. [Google Scholar] [CrossRef]
  13. Louhichi, K.; Kanellopoulos, A.; Janssen, S.; Flichman, G.; Blanco, M.; Hengsdijk, H.; Heckelei, T.; Berentsen, P.; Lansink, A.O.; Ittersum, M.V. FSSIM, a bio-economic farm model for simulating the response of EU farming systems to agricultural and environmental policies. Agric. Syst. 2010, 103, 585–597. [Google Scholar] [CrossRef] [Green Version]
  14. Arfini, F.; Paris, Q. A positive mathematical programming model for regional analysis of agricultural policies. In The Regional Dimension in Agricultural Economics and Policies, Proceedings of the 40th EAAE Seminar, Ancona, Italy, 26–28 June 1995; pp. 17–35.
  15. Howitt, R.E. Positive mathematical programming. Am. J. Agric. Econ. 1995, 77, 329–342. [Google Scholar] [CrossRef]
  16. Paris, Q.; Howitt, R. An analysis of ill-posed production problems using maximum entropy. Am. J. Agric. Econ. 1998, 85, 254–265. [Google Scholar]
  17. Heckelei, T.; Wolff, H. Estimation of constrained optimisation models for agricultural supply analysis based on generalised maximum entropy. Eur. Rev. Agric. Econ. 2003, 30, 27–50. [Google Scholar] [CrossRef]
  18. Judez, L.; Chaya, C.; Martinez, S.; Gonzalez, A.A. Effects of the measures envisaged in “Agenda 2000” on arable crop producers and beef and veal producers: An application of positive Mathematical Programming to representative farms of a Spanish region. Agric. Syst. 2001, 67, 121–138. [Google Scholar] [CrossRef]
  19. Röhm, O.; Dabbert, S. Integrating agri-environmental programs into regional production models: An extension of positive mathematical programming. Am. J. Agric. Econ. 2003, 85, 254–265. [Google Scholar] [CrossRef]
  20. Calatrava, J.; Garrido, A. Modelling water markets under uncertain water supply. Eur. Rev. Agric. Econ. 2005, 32, 119–142. [Google Scholar] [CrossRef]
  21. Buysse, J.; Fernagut, B.; Harmignie, O.; de-Frahan, B.H.; Lauwers, L.; Polome, P.; van-Huylenbroeck, G.; van-Meensel, J. Farm-based modelling of the EU sugar reform impact on Belgian sugar beet suppliers. Eur. Rev. Agric. Econ. 2007, 34, 21–52. [Google Scholar] [CrossRef]
  22. Henry de Frahan, B.; Buysse, J.; Polomé, P.; Fernagut, B.; Harmignie, O.; Lauwers, L.; van Huylenbroeck, G.; van Meensel, J. Positive mathematical programming for agricultural and environmental policy analysis: Review and practice. In Handbook of Operations Research in Natural Resources; Weintraub, A., Bjorndal, T., Epstein, R., Romero, C., Eds.; Kluwer Academic Publishers: Dordrecht, The Netherlands, 2007; pp. 129–157. [Google Scholar]
  23. Iglesias, E.; Blanco, M. New directions in water resources management: The role of water pricing policies. Water Resour. Res. 2008, 44. [Google Scholar] [CrossRef]
  24. Cortignani, R.; Severini, S. Modeling farm-level adoption of deficit irrigation using Positive Mathematical Programming. Agric. Water Manag. 2009, 96, 1785–1791. [Google Scholar] [CrossRef]
  25. Cortignani, R.; Severini, S. A constrained optimization model based on generalized maximum entropy to assess the impact of reforming agricultural policy on the sustainability of irrigated areas. Agric. Econ. 2012, 43, 621–633. [Google Scholar] [CrossRef]
  26. Arfini, F.; Donati, M. Organic production and the capacity to respond to market signals and policies: An empirical analysis of a sample of FADN farms. Agroecol. Sustain. Food Syst. 2013, 37, 149–171. [Google Scholar]
  27. Heckelei, T.; Britz, W.; Zhang, Y. Positive mathematical programming approaches—Recent developments in literature and applied modelling. Bio Based Appl. Econ. 2012, 1, 109–124. [Google Scholar]
  28. Christensen, L.; Jorgensen, D.; Lau, L. Transcendental logarithmic production frontiers. Rev. Econ. Stat. 1973, 55, 28–45. [Google Scholar] [CrossRef]
  29. Dono, G.; Giraldo, L.; Severini, S. The cost of irrigation water delivery: An attempt to reconcile the concepts of cost and efficiency. Water Resour. Manag. 2012, 26, 1865–1877. [Google Scholar] [CrossRef]
  30. Zellner, A. An efficient method of estimating seemingly unrelated regressions and tests for aggregation bias. J. Am. Stat. Assoc. 1962, 57, 348–368. [Google Scholar] [CrossRef]
  31. Weninger, Q. Estimating multiproduct costs when some outputs are not produced. Empir. Econ. 2003, 28, 753–765. [Google Scholar] [CrossRef]
  32. Battese, G.E. A note on the estimation of Cobb-Douglas production functions when some explanatory variables have zero values. J. Agric.Econ. 2008, 48, 250–252. [Google Scholar] [CrossRef]
  33. Barabaschi, N. Analisi delle strutture di costo dell’industria idrica italiana: Le economie di scala, di densità e di scopo. Quaderni di Ricerca REF. 2007, 43. Available online: http://www.ref-e.com/downloads/abstract_q43ref.pdf (accessed on 04 April 2014).
  34. Regional Law of Regione Sardegna of 23 May 2008, n. 6, Art.44. Available online: https://www.regione.sardegna.it/j/v/80?s=85010&v=2&c=4426&t=1 (accessed on 30 January 2014).
  35. Fudenberg, D.; Tirole, J. Game Theory; MIT Press: Cambridge, MA, USA, 1993; Chapter 6, Section 1. [Google Scholar]
  36. Thomas, L.C. Games, Theory and Applications; Dover Publications: New York, NY, USA, 2003; p. 19. [Google Scholar]
  37. Woolridge, J.R.; Gray, G. Applied Principles of Finance; Kendall Hunt Publishing Company: Dubuque, IA, USA, 2006. [Google Scholar]
  38. Tsur, Y.; Roe, T.; Doukkali, R.; Dinar, A. Pricing Irrigation Water: Principles and Cases from Developing Countries; Resources for the Future: Washington, DC, USA, 2004. [Google Scholar]
  39. Alarcón, J.; Mesa-Jurado, M.A.; Berbel, J. Devising irrigation water tariffs with overconsumption penalties. Span. J. Agric. Res. 2011, 9, 971–980. [Google Scholar] [CrossRef]

