Article

Combined Impacts of Medium Term Socio-Economic Changes and Climate Change on Water Resources in a Managed Mediterranean Catchment

by
Anastassi Stefanova
*,
Cornelia Hesse
and
Valentina Krysanova
Potsdam-Institute for Climate Impact Research, Post Box 601203, Potsdam 14412, Germany
*
Author to whom correspondence should be addressed.
Water 2015, 7(4), 1538-1567; https://doi.org/10.3390/w7041538
Submission received: 2 February 2015 / Revised: 17 March 2015 / Accepted: 27 March 2015 / Published: 10 April 2015
(This article belongs to the Special Issue Hydro-Ecological Modeling)

Abstract

:
Climate projections agree on a dryer and warmer future for the Mediterranean. Consequently, the region is likely to face serious problems regarding water availability and quality in the future. We investigated potential climate change impacts, alone (for three scenario periods) and in combination with four socio-economic scenarios (for the near future) on water resources in a Mediterranean catchment, whose economy relies on irrigated agriculture and tourism. For that, the Soil and Water Integrated Model (SWIM) was applied to the drainage area of the Mar Menor coastal lagoon, using a set of 15 climate scenarios and different land use maps and management settings. We assessed the long-term average seasonal and annual changes in generated runoff, groundwater recharge and actual evapotranspiration in the catchment, as well as on water inflow and nutrients input to the lagoon. The projected average annual changes in precipitation are small for the first scenario period, and so are the simulated impacts on all investigated components, on average. The negative trend of potential climate change impacts on water resources (i.e., decrease in all analyzed components) becomes pronounced in the second and third scenario periods. The applied socio-economic scenarios intensify, reduce or even reverse the climate-induced impacts, depending on the assumed land use and management changes.

1. Introduction

The climate of the Mediterranean region is especially vulnerable to potential changes in the global circulation processes [1]. It is therefore not surprisingly, that Giorgi [2] identified the region of the Mediterranean as a primary climate change “Hot-Spot” based on projections of Phase 3 of the Coupled Model Intercomparison Project (CMIP3) for the late 21st century. More recently, Diffenbaugh and Giorgi [3] confirmed this result using a similar but more comprehensive approach and an ensemble of CMIP5 Representative Concentration Pathway (RCP) 8.5 and RCP4.5 simulations.
The agreement among climate models for the Mediterranean region is considerably strong compared to other regions in the world [4] and so are the trends for temperature and precipitation changes. Several studies state that the Mediterranean region is very likely to become dryer and warmer in future, as global warming continues (e.g., [5,6,7,8,9]). In consequence, the area is expected to face serious problems, such as agricultural production losses, land degradation and habitat losses [10]. Moreover, a decrease in water availability will in addition enhance the competition for water between economic sectors and by that the vulnerability of the Mediterranean countries to changes in climate [11].
Our study area, the catchment of the Mar Menor, a hyper saline lagoon in southeast Spain, is one of the driest and hottest regions in Spain and on the Iberian Peninsula [12]. The region is exposed to a severe water stress under the current climate [13] and still, due to intensive irrigation, is one of Europe’s major horticultural producers and exporters [14,15]. Apart from agriculture, mass tourism along the shoreline of the lagoon is also highly important for the local economy. The rapid development of both sectors during the last decades was possible due to the Tagus-Segura Inter Basin Transfer (IBT) that has been delivering water from the Tagus River to the Mar Menor catchment since 1978 [16].
Since then, the major watercourse in the catchment, the Albujon wadi, inputs regularly and especially during the wet period high amounts of nutrients from the adjustment agricultural fields to the lagoon [17]. Moreover, insufficiently treated effluents coming mainly from the touristic areas and reaching a maximum during the touristic peak in summer have been discharged into the same wadi over a long period [18]. These inputs have resulted in a rapid increase of the pollution in the lagoon [19,20,21,22], and need to be addressed urgently in order to prevent the ecosystem from further degradation.
In addition to current anthropogenic pressures, climate change is expected to pose further stress to the Mar Menor and its drainage area. An increase in sea water temperature, for example, is very likely to lead to an intensification of the eutrophication processes in the lagoon, and finally to a collapse of the water body [23]. Climate change will also affect the water resources in the donor basin of the IBT, the Tagus River Basin. According to Killsby et al. [23] the discharge of the Tagus River is likely to get reduced by almost a half (49%) until the end of the century, due to climate change. Consequently, the water resources transferred to the Mar Menor catchment could also decrease, which will certainly affect the agricultural and touristic sectors, and by that also the water and nutrient inputs to the lagoon. The natural, non-managed water resources in the catchment will be affected by climate change too and will most probably further decline, as climate becomes dryer. CMIP3 model simulations for the Mediterranean region project a long-term decrease in precipitation of about 15% for the end of the century (2070–2099) and of 8% for the near future (2020–2049) compared to 1950–2000 [24]. Based on their results, Mariotti et al. [24] expect a decrease in runoff and river discharge as well, which would certainly reduce the water available for irrigation and other uses, as climate change continues. A study on the impacts of climate change on water resources in Spain in particular [25] identified the Segura region, in which the catchment of the Albujon wadi is located, as highly critical regarding the hydrological implications of future climate. More recently Mariotti et al. [26] investigated the long-term climate changes in the Mediterranean region using the newly available CMIP5 model simulations, and obtained similar results as in their previous study. The arid and semi-arid regions in the Mediterranean are projected to become dryer, especially during the wet season (December–February), whereas there is no significant decrease in precipitation projected for the already dry summer (June–August) season [26]. Another study comparing the A1B emission scenario (balanced emphasis on all energy sources) simulations of CMIP3 with the RCP4.5 and 8.5 simulations of CMIP5 for the Mediterranean region on the seasonal basis [27] also identified a consistency between both types of scenarios. This indicates a robustness of future climate trends simulated for the region [27], and thus a warmer and dryer future for the Mar Menor catchment becomes even more plausible.
We therefore decided to assess the response of the Mar Menor catchment to potential changes in climate because of its importance for the ecological status of the lagoon and the region’s economy. Moreover, as the water resources in the catchment are strongly human influenced, the vulnerability to climate change was studied in combination with potential changes in land use and water management.
For that, we firstly quantified the total amount of water and nutrient inputs to the Mar Menor using the eco-hydrological Soil and Water Integrated Model (SWIM, [28]). The model was then driven by a set of 15 regional climate scenarios from the ENSEMBLES project [29] for one reference and three future scenario periods, of 30 years each. Next, four different socio-economic scenarios, including new land use maps and water management settings were run in combination with the 15 climate scenarios for the near future scenario period.
The results of this study were used for further analysis. They were used as input data to a specific lagoon model that can investigate the lagoons response to changes in its drainage basin, and also as scientifically founded information for stakeholders and policy makers and their future planning and decisions.

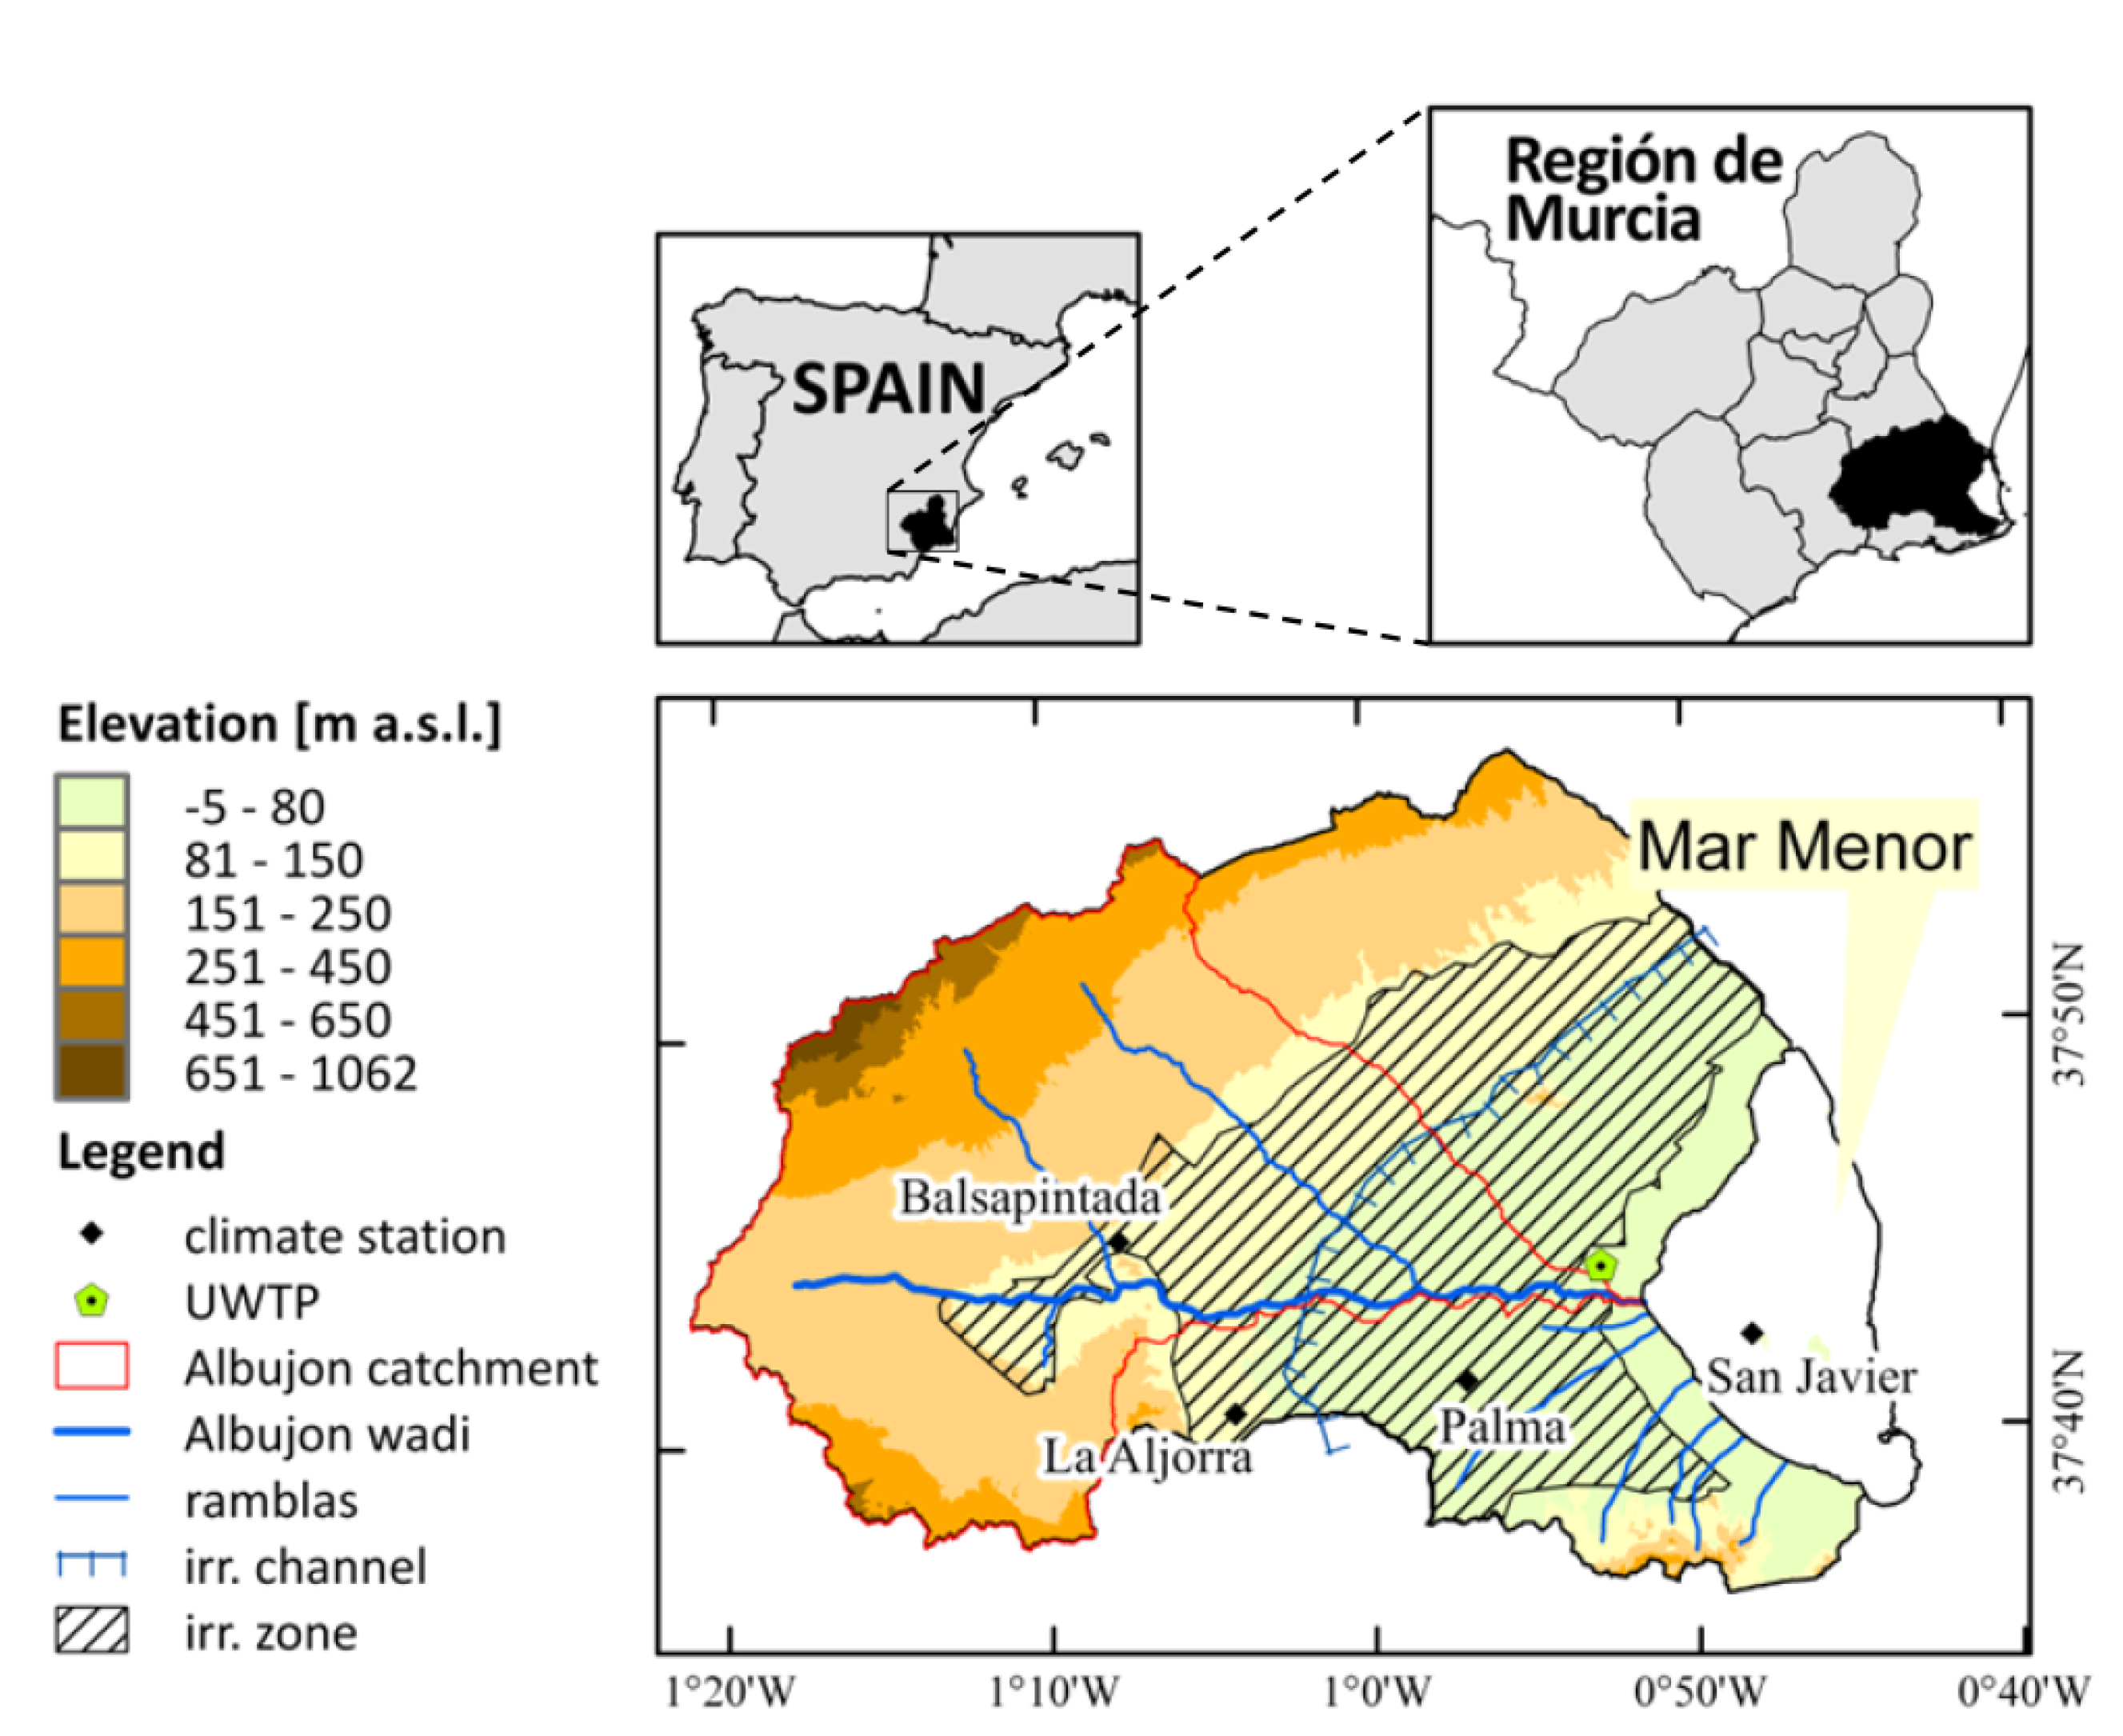
2. Case Study Area Description

The catchment of the Mar Menor is situated on the Mediterranean coast in southeast Spain, in the region of Murcia. It covers an area of about 1380 km2 and overlaps almost entirely with the basin of the Campo de Cartagena aquifer (Figure 1). The Albujon wadi is the major watercourse in the catchment and drains, together with several smaller, so called ramblas (ephemeral water courses with uncontinuous flow), into the Mar Menor. However, there are no gauging stations in the catchment, not even on the Albujon wadi. The main soils are deep Cambisols with low permeability (76%), and agricultural land occupies about 82% of the area.
Figure 1. Geographical location of the Mar Menor catchment and major characteristics of the case study area.
Water 07 01538 g001
The drainage area has a gentle slope and elevations ranging from 1062 m.a.s.l at the low mountainous range Sierra de Carrascoy in the West to −5 m.a.s.l. at the Mediterranean coast in the East. The climate is semi-arid Mediterranean, characterized by dry and hot summers and mild winters. The mean annual temperature is about 18 °C, and the mean annual precipitation about 300 mm, mostly occurring during short episodic storm events in autumn and spring. The estimated potential evapotranspiration is about three times higher than the mean annual precipitation and ranges between 800 mm·y−1 and 1200 mm·y−1 [30].
Since 1978, the catchment receives water for irrigation and public supply through the Tagus Segura Inter Basin Transfer. The water is transported from the Entrepenas and Buendia reservoirs in the Upper Tagus to the Talave reservoir in the Segura catchment and then redistributed among different sectors and regions, one of them being the Mar Menor catchment. The availability of additional water in the catchment has led to drastic economic and environmental changes over the last decades.
The so called Campo de Cartagena Irrigation District was established, and with it the agricultural practices in the catchment have changed from dry crop farming to intensively irrigated and fertilized fruits and vegetables (mainly lettuce and melon). This resulted in an increased nutrient input from the agricultural fields to water flows and to serious pollution problems in the Mar Menor [17].
Moreover, the former overexploitation of groundwater resources decreased, and surplus of irrigation water is infiltrating into the soil and recharging the aquifer. This has led to a rise in the phreatic levels of the aquifer and in consequence to a continuous flow of the Albujon wadi [22], which in addition also contributes to the pollution of the lagoon.
In parallel to agriculture, tourism was also developing rapidly. The permanent population in the catchment (about 10,000 inhabitants) rises by a factor of ten during the touristic peak in summer. In consequence the sewage water release also drastically increases. As a consequence, large amounts of untreated and insufficiently treated waste water are discharged regularly into the Mar Menor, which has led to planktonic changes [20] and the proliferation of jellyfish over the last decades [22]. Nowadays, all of the treated effluent from one of the smaller treatment plants, Torre Pachecco, and about half of the effluents (56%) from the enlarged and modernized major treatment plant, Los Alcazares (in operation since 2008), is reused for irrigation. By that, the nutrient input from point sources could be, at least partly, reduced.

3. Methods and Materials

3.1. The Eco-Hydrological Model SWIM

SWIM is a semi-distributed, process-based model simulating hydrological processes, vegetation growth and nutrient cycling at the river basin scale. It is driven by daily temperature (minimum, maximum and average), precipitation, solar radiation and air humidity, and requires a subbasin map (could be derived from a digital elevation model), a land cover map and a soil map with associated soil profile characteristics as spatial input data. All relevant processes related to water, plant and nutrient dynamics are calculated on the highest level of disaggregation, the hydrotope level. Hydrotopes are units within one subbasin that have a unique combination of land use and soil type. Next, the model outputs are aggregated at the subbasin level, and the lateral flows of water and nutrients are routed via river network to the outlet. A full description of the model structure and the simulated processes is given in the SWIM manual [28].
Before being suitable for any kind of impact assessment, the model should be set up for the specific area and calibrated and validated towards observed data. For that, apart from the above-mentioned input data, additional information on water and land management can be implemented, in order to better represent the hydrological situation and nutrient cycling in the catchment. These data are related to point sources of pollution (e.g., effluents), diffuse pollution (e.g., fertilizer rates, types and application dates), water abstraction (e.g., wells), water transfers, agricultural practices (e.g., irrigation scheme) and others. For model calibration, continuously long time series of measured daily river discharges and observed nutrient concentrations or loads (in case water quality is also subject to further assessment) are needed.

3.2. Model Setup, Calibration and Validation

The spatial and temporal input data used to set up the SWIM model for the Mar Menor catchment are listed in Table 1. The catchment was discretized into 215 subbasins and 1068 hydrotopes. By intersecting the hydrotopes map with the shape file of the Campo de Cartagena Irrigation Zone a total area of 500 km2 irrigated agricultural hydrotopes was identified. These hydrotopes were assigned a constant amount of water, added as daily precipitation during the irrigation period from March to September.
The amount of irrigation water supplied to the Mar Menor catchment depends on several factors and can vary from year to year [16]. According to the Irrigation Agency of Campo de Cartagena (Comunidad de Regantes del Campo de Cartagena, CRCC [16]) the Tagus-Segura Inter-Basin Transfer delivers on average about 122 hm3 of water per year to the Mar Menor catchment. Another 13.2 hm3 are reused effluents from the Urban Waste Water Treatment Plants (UWWTPs), and about 4.2 hm3 are diverted directly from the Segura basin. Desalination plants have the smallest share in the total water used for irrigation (2.2 hm3) [16]. In addition to that, about 1300 ponds with a total capacity of more than 21 hm3 [16] exist in the area, but there is no further information about their operation.
Table 1. Overview of spatial and temporal input data used to set up the SWIM model.
Type of Input DataData and Source
Observed climate5 stations (4 in the basin), period: 2000–2011, Source: Sistema de Informacíon Agraria de Murcia
DEM20 m × 20 m SRTM (Shuttle Radar Topography Mission), Source: CGIAR Consortium for Spatial Information
Land useCORINE Land Cover 2006 vector product, Version 13, Source: European Environmental Agency main crops: melons, lettuce, Source: [25] fertilization: 270 kg·N/ha , 110 kg·P/ha, Source: University of Murcia
Soil map and soil parameterization1 km × 1 km Raster map, Source: Harmonized World Soil Database (HWSD) Soil parameters: HWSD and estimated using the German soil mapping guidelines [31]
Therefore, as the actual amount of irrigation water used in the catchment every year is uncertain, we decided to apply an average of 150 hm3 per year (as sum of all sources plus half of the potential water stored in ponds) to the whole irrigated area, or in other words, of 1.51 mm per day to the irrigated hydrotopes. This value was assumed constant in all simulations, including the socio-economic scenarios, and only the size of the irrigated area was increased or decreased accordingly.
The effluents from the major UWWTP, collecting the sewages of Los Alcazares, were implemented in three different ways. For the calibration and validation periods, the average monthly values of discharged water, NO3-N, NH4-N and PO4-P loads to the Albujon wadi, estimated from available data (provided by the University of Murcia), were implemented as constant daily inputs. For the climate change scenario runs, an average year using the available monthly data from the period after construction of the new treatment plant was used. For the socio-economic scenarios, we firstly estimated the share of sewage water from the permanent population and of that from the touristic activities. Next, the assumed changes in population were applied to one part of the effluent constantly over the whole year, while the assumed changes in tourism were applied to the second part of the effluents during the touristic peaks only.
Further water management practices, that are less important for the water flow in the catchment, such as the reuse of water from the desalination plant or the discharge of agricultural water surplus drainages into the Mar Menor, could not be implemented, due to the lack of data.
After setup, the model should be calibrated towards discharge (Q) and nutrient loads (NO3-N, NH4-N and PO4-P). For that, only data from a measuring campaign performed between September 2002 and July 2006 with a total of 25 measurements for the mouth of the Albujon wadi were available from the University of Murcia. As this number was too little for a usual calibration based on performance criteria (e.g., Nash-Sutcliffe efficiency or percent bias), we decided to compare the model outputs with literature values. So, the simulated daily discharges were averaged to biweekly means and compared to the fortnightly discharges measured by Garcia-Pintado et al. [18] in the period between October 2002 and February 2004 by graphical fitting. Furthermore, the simulated and estimated by Garcia-Pintado et al. [18] average annual nitrate nitrogen, ammonium nitrogen and phosphate phosphorus loads for the same period were also compared.

3.3. Estimation of Water Inflow and Nutrients Input to the Lagoon

Previous studies estimated the water and nutrient input to the Mar Menor considering (a) the flow of the Albujon wadi and the Rambla de la Maraña, which is artificially connected to it; and (b) the drainages from some channels/pipelines at the mouth of the Albujon wadi (e.g., [17,18]). The above mentioned channels bring agricultural water surplus to a desalination plant close to the mouth of the Albujon wadi, which is then treated and reused for irrigation or in case the plant’s capacity is reached, discharged directly into the lagoon (e.g., [17,18]). There is however, a number of small ramblas (ephemeral watercourses) with uncontinuous flows that bring additional water and nutrients to the lagoon during storm events.
We included these ramblas and their catchments in our model setup by using the same calibration parameters as for the Albujon wadi and simulated their discharges and nutrient loads. By adding up all watercourses flowing into the Mar Menor, we then estimated the average total annual inflow and nutrient inputs to the lagoon from its drainage basin. A similar method has been also successfully applied to the drainage areas of the Ria de Aveiro [32] and the Vistula Lagoon [33]. Furthermore, in order to estimate the share of the infiltrated irrigation water on the total inflow an additional model run without any irrigation of the agricultural land was done.
The above mentioned drainages of agricultural water surplus as well as their partial reuse for irrigation after treatment in the desalination plant were not considered in our simulations, as no information about the volumes or the operation schemes of the plant were available.

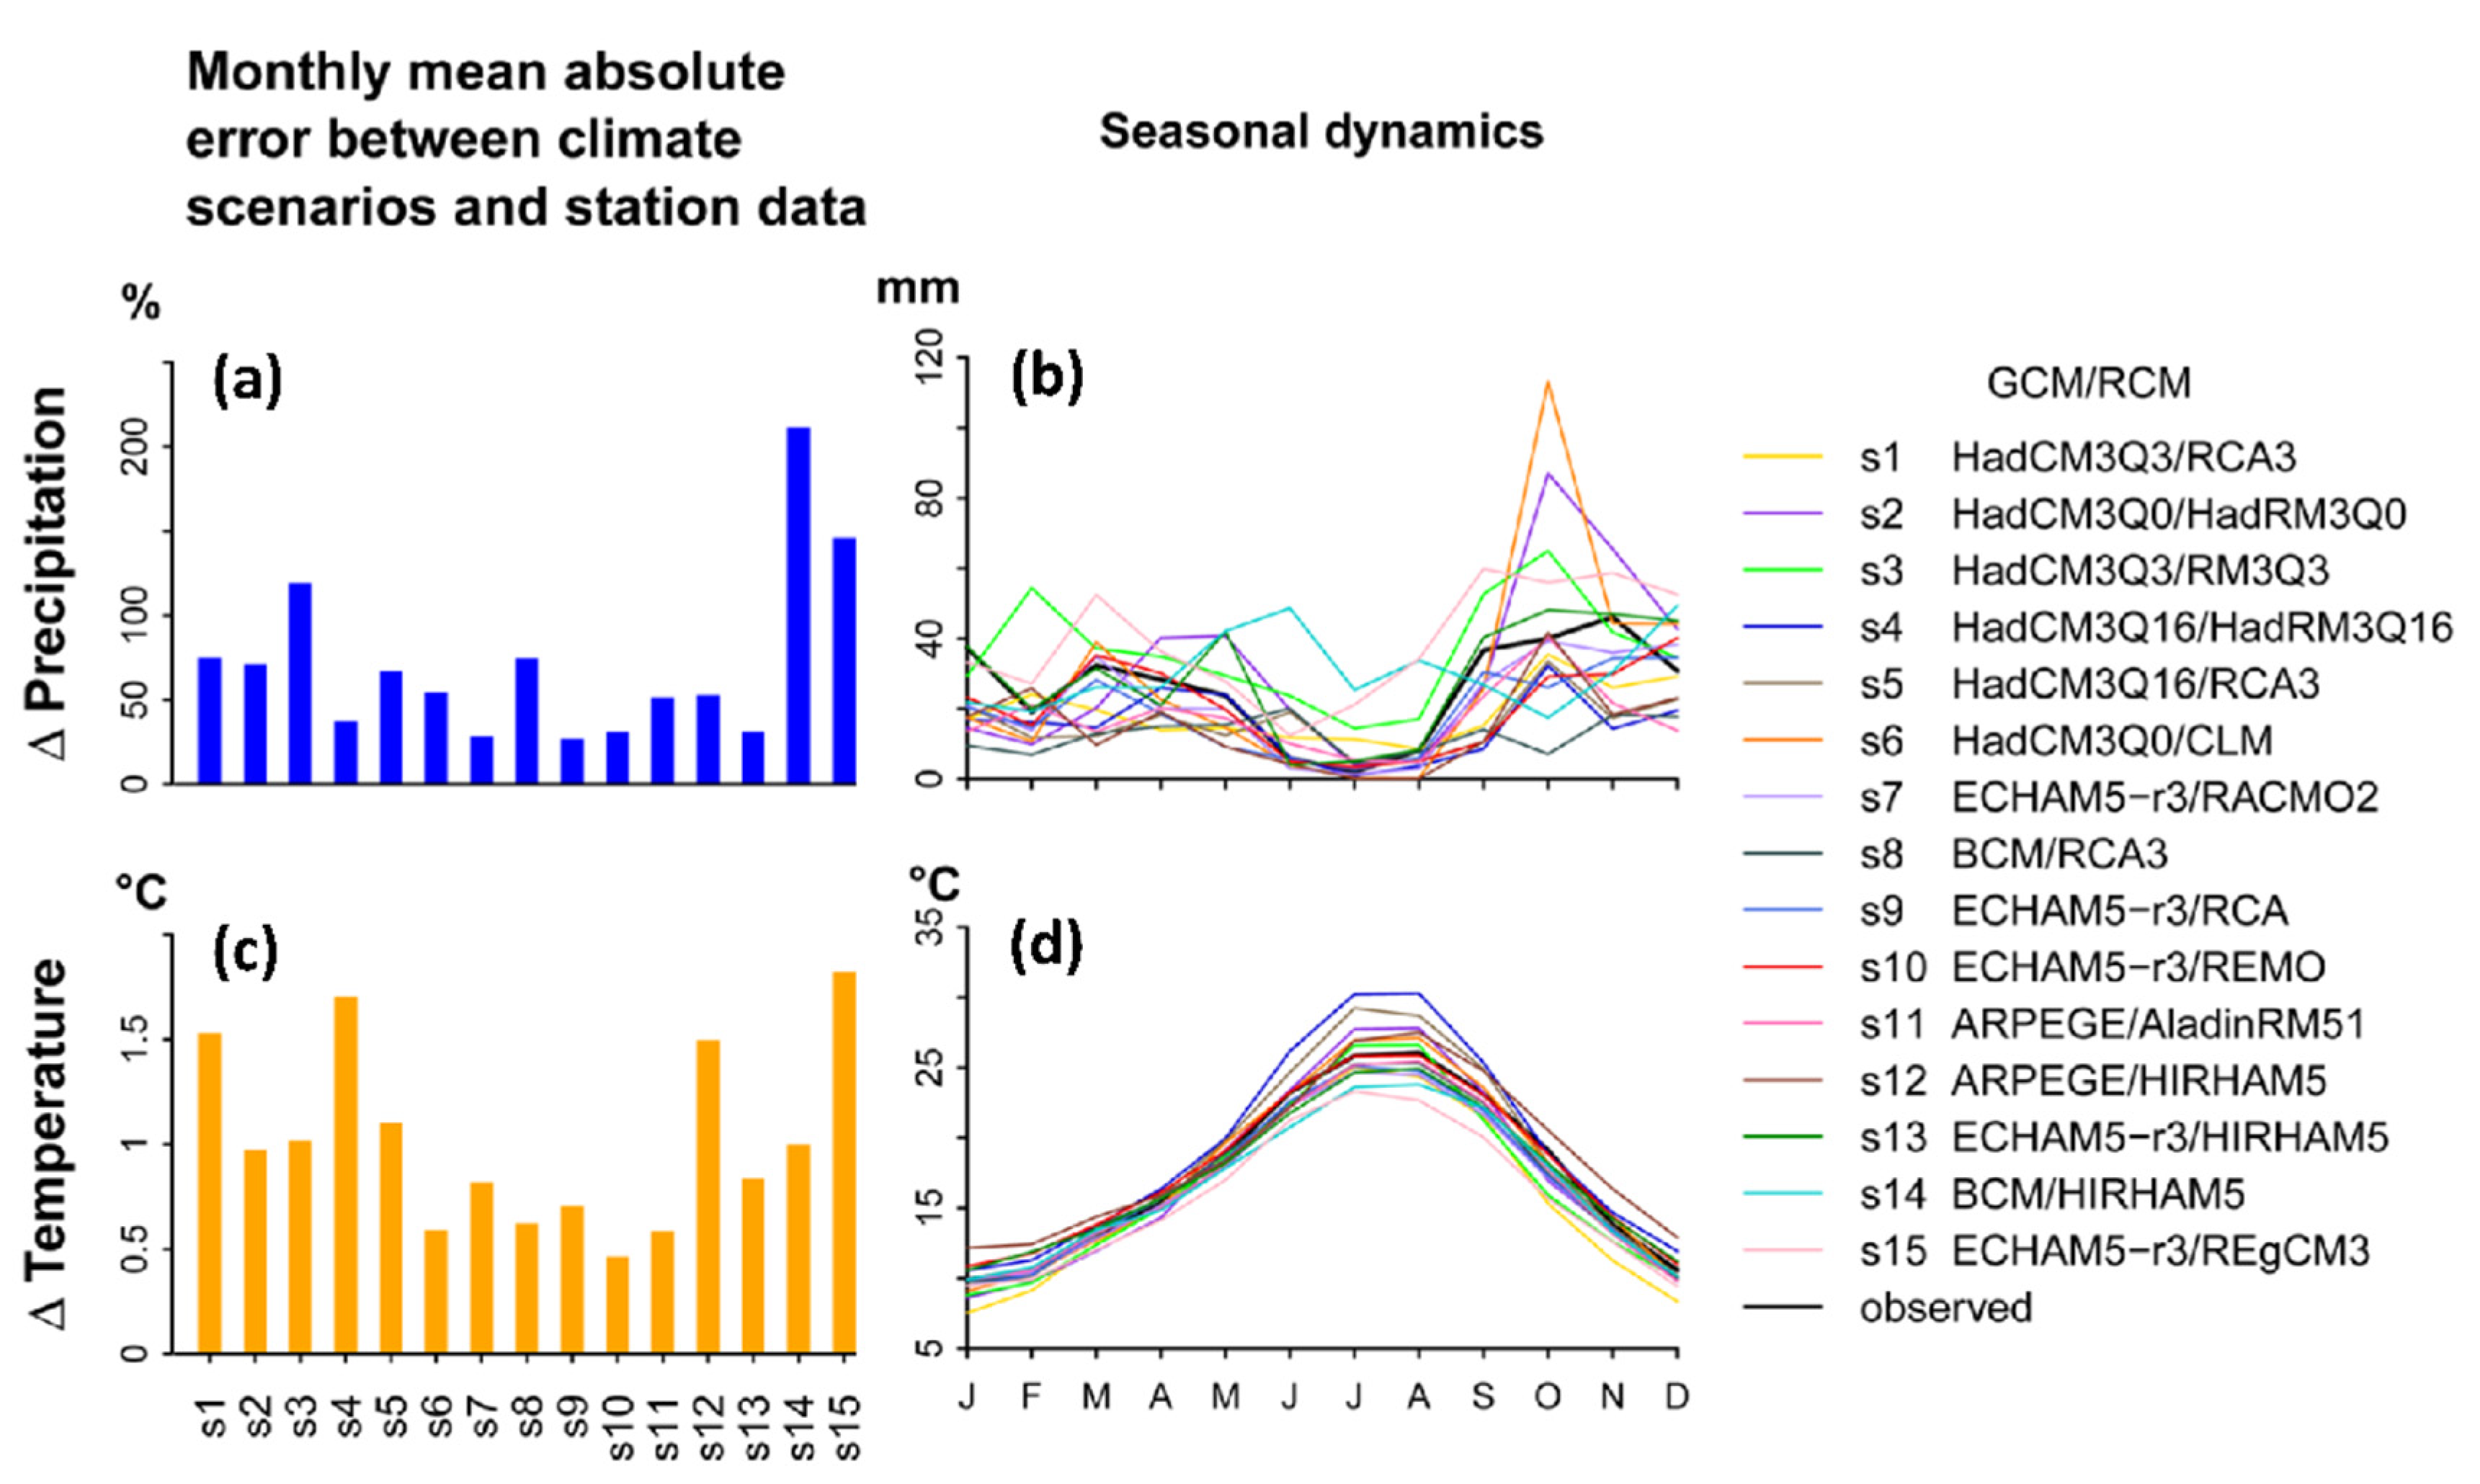
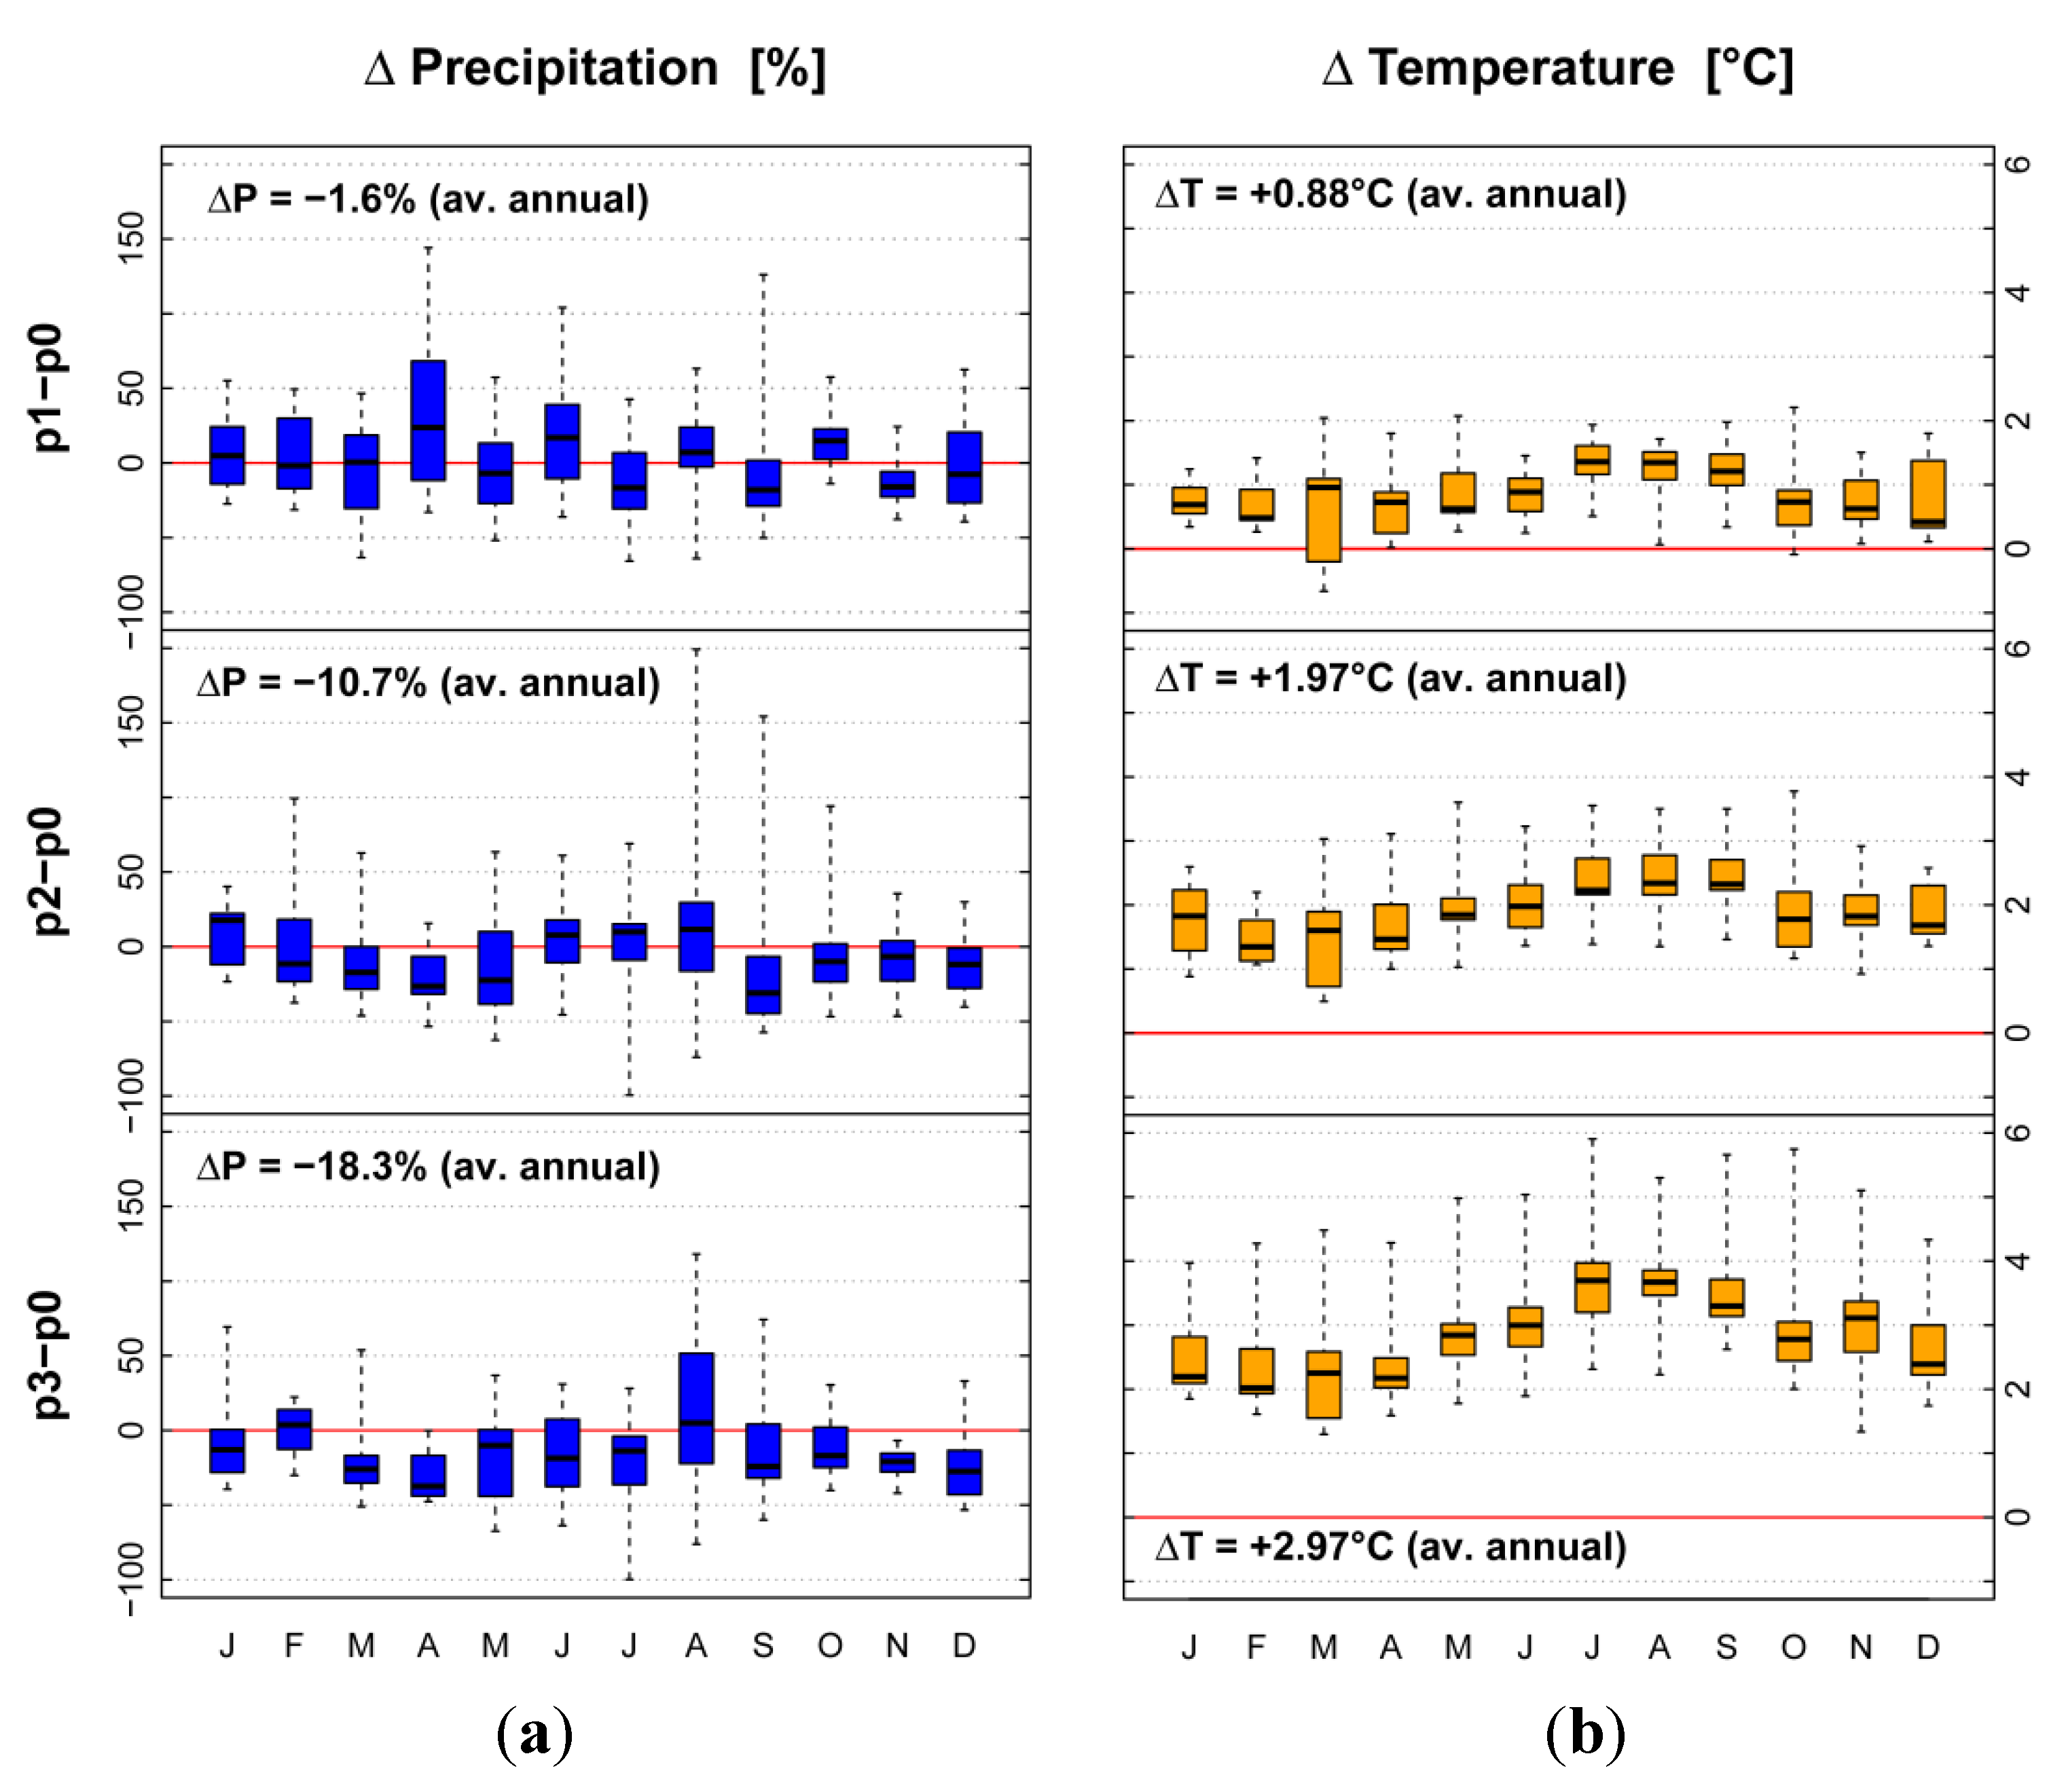
3.4. Climate Change Scenarios

As the resolution of General Circulation Models (GCMs) is too coarse (≥100 km) for regional studies, it is preferable to use climate scenarios from the Regional Climate Models (RCMs) with a higher resolution for an adequate impact assessment [34]. Moreover, as climate projections (e.g., temperature and precipitation trends) of different RCMs for the same region can vary significantly [35], a multi-model approach using scenarios from several RCMs that allows estimating the range of uncertainty is recommended [36].
The climate scenario data used in our study was obtained from the ENSEMBLES project [34]. It consists of a set of 15 climate scenarios, each being the output of a unique combination of different RCMs and GCMs (providing initial and boundary conditions). All models in the ENSEMBLES project have been driven by the A1B emission scenario, which can be described as moderate regarding future projections of atmospheric CO2 concentrations. The resolution of the applied scenarios is 25 km, and the available time frames are 1951–2098 or 1951–2100, depending on the scenario. For consistency, the end year of all scenario time periods was set to the year 2098.
Before applying the climate scenarios in SWIM simulations for impact assessment, we evaluated their ability in simulating the present climate as well as their climate change signals, considering temperature and precipitation.
For the first task, we used the longest available time period (2000–2011) of daily mean temperature and precipitation records from a station inside the catchment (Balsapintada) to calculate the average monthly and average annual means and compare these with the average climate scenario data of the nearest grid cell for the same period (Figure 2).
Figure 2. Evaluation of climate scenario data for the historical period by comparing the modeled and observed station data in the catchment for the years 2000–2011: Mean monthly absolute error between modeled and observed station data for precipitation (a) and temperature (c); and average seasonal dynamics of modeled and observed station data for precipitation (b) and temperature (d).
Water 07 01538 g002
As visible in the graph, some scenarios reproduce well the annual dynamics of precipitation (e.g., s7, s9, s10), while others clearly overestimate rainfall in autumn (e.g., s6) or underestimate it in spring (e.g., s12). The smallest mean annual absolute error for precipitation between scenario data and station data was calculated for the s9 scenario (27%), and the biggest, reaching a bias of 211%, was found for the s14 scenario.
The agreement between the modeled and the observed temperatures is clearly higher. Still, some scenarios underestimate average monthly temperatures throughout the whole year (e.g., s15), while others overestimate the annual dynamics (e.g., s4). The s10 scenario produces the smallest annual absolute error (0.5 °C) in this case and the s15 the biggest (1.5 °C).
The climate change signals for temperature and precipitation were obtained for three chosen scenario periods (Section 3.6). We calculated the long-term average monthly and annual differences between each of the three future periods (p1, p2 and p3) and the reference period (p0). The results are shown in Figure 3.
The average annual precipitation in the Mar Menor catchment is projected to decrease by −1.6% in the first, −10.7% in the second, and −18.3% in the third scenario period.
The calculated average monthly changes for p1 do not show any shifts in the seasonality of future precipitation. The projected changes range between −51% in March and 144% in May for different scenarios. In January, March–June, August, and October, about one half of the climate scenarios project higher precipitation rates compared to the reference period, while there is a negative trend for the remaining months. The median projected changes for all months in p1 are in the range of ±20%. In the second and third scenario periods the decreasing trend becomes more clear, and seasonal dependency of the projected changes can be observed. In p2, the mean precipitation decreases during the wet period (between −10% and −30%), except for January and slightly increases (about 10%) during the dry period in summer. In p3 it decreases for all months (between −20% and −40%), except for February and August. It is also visible from the graphs that the disagreement between scenarios decreases from period p2 to period p3, as the ranges of future projections become smaller.
Figure 3. Average monthly climate change signals for the three future scenario periods (p1, p2 and p3) compared to the reference period (p0) for precipitation (a) and temperature (b) shown as boxplots, where the whiskers represent the min/max values, the boxes the 25th/75th percentiles and the thick lines the median values of changes for 15 climate scenarios.
Water 07 01538 g003
Regarding air temperature in the catchment, the climate scenarios project an average annual increase of 0.88 °C in p1, 1.97 °C in p2 and 2.97 °C in p3. Some of the climate scenarios (s9, s1 and s15) in p1 have negative signals in April and October but still, in general, we can observe a clear increase in temperature among scenarios in all months and periods. The increase is slightly higher (about 1 °C) during the summer months, and unlike precipitation, the range of future projections (whiskers in boxplots) increases with time and is the biggest for the last scenario period.

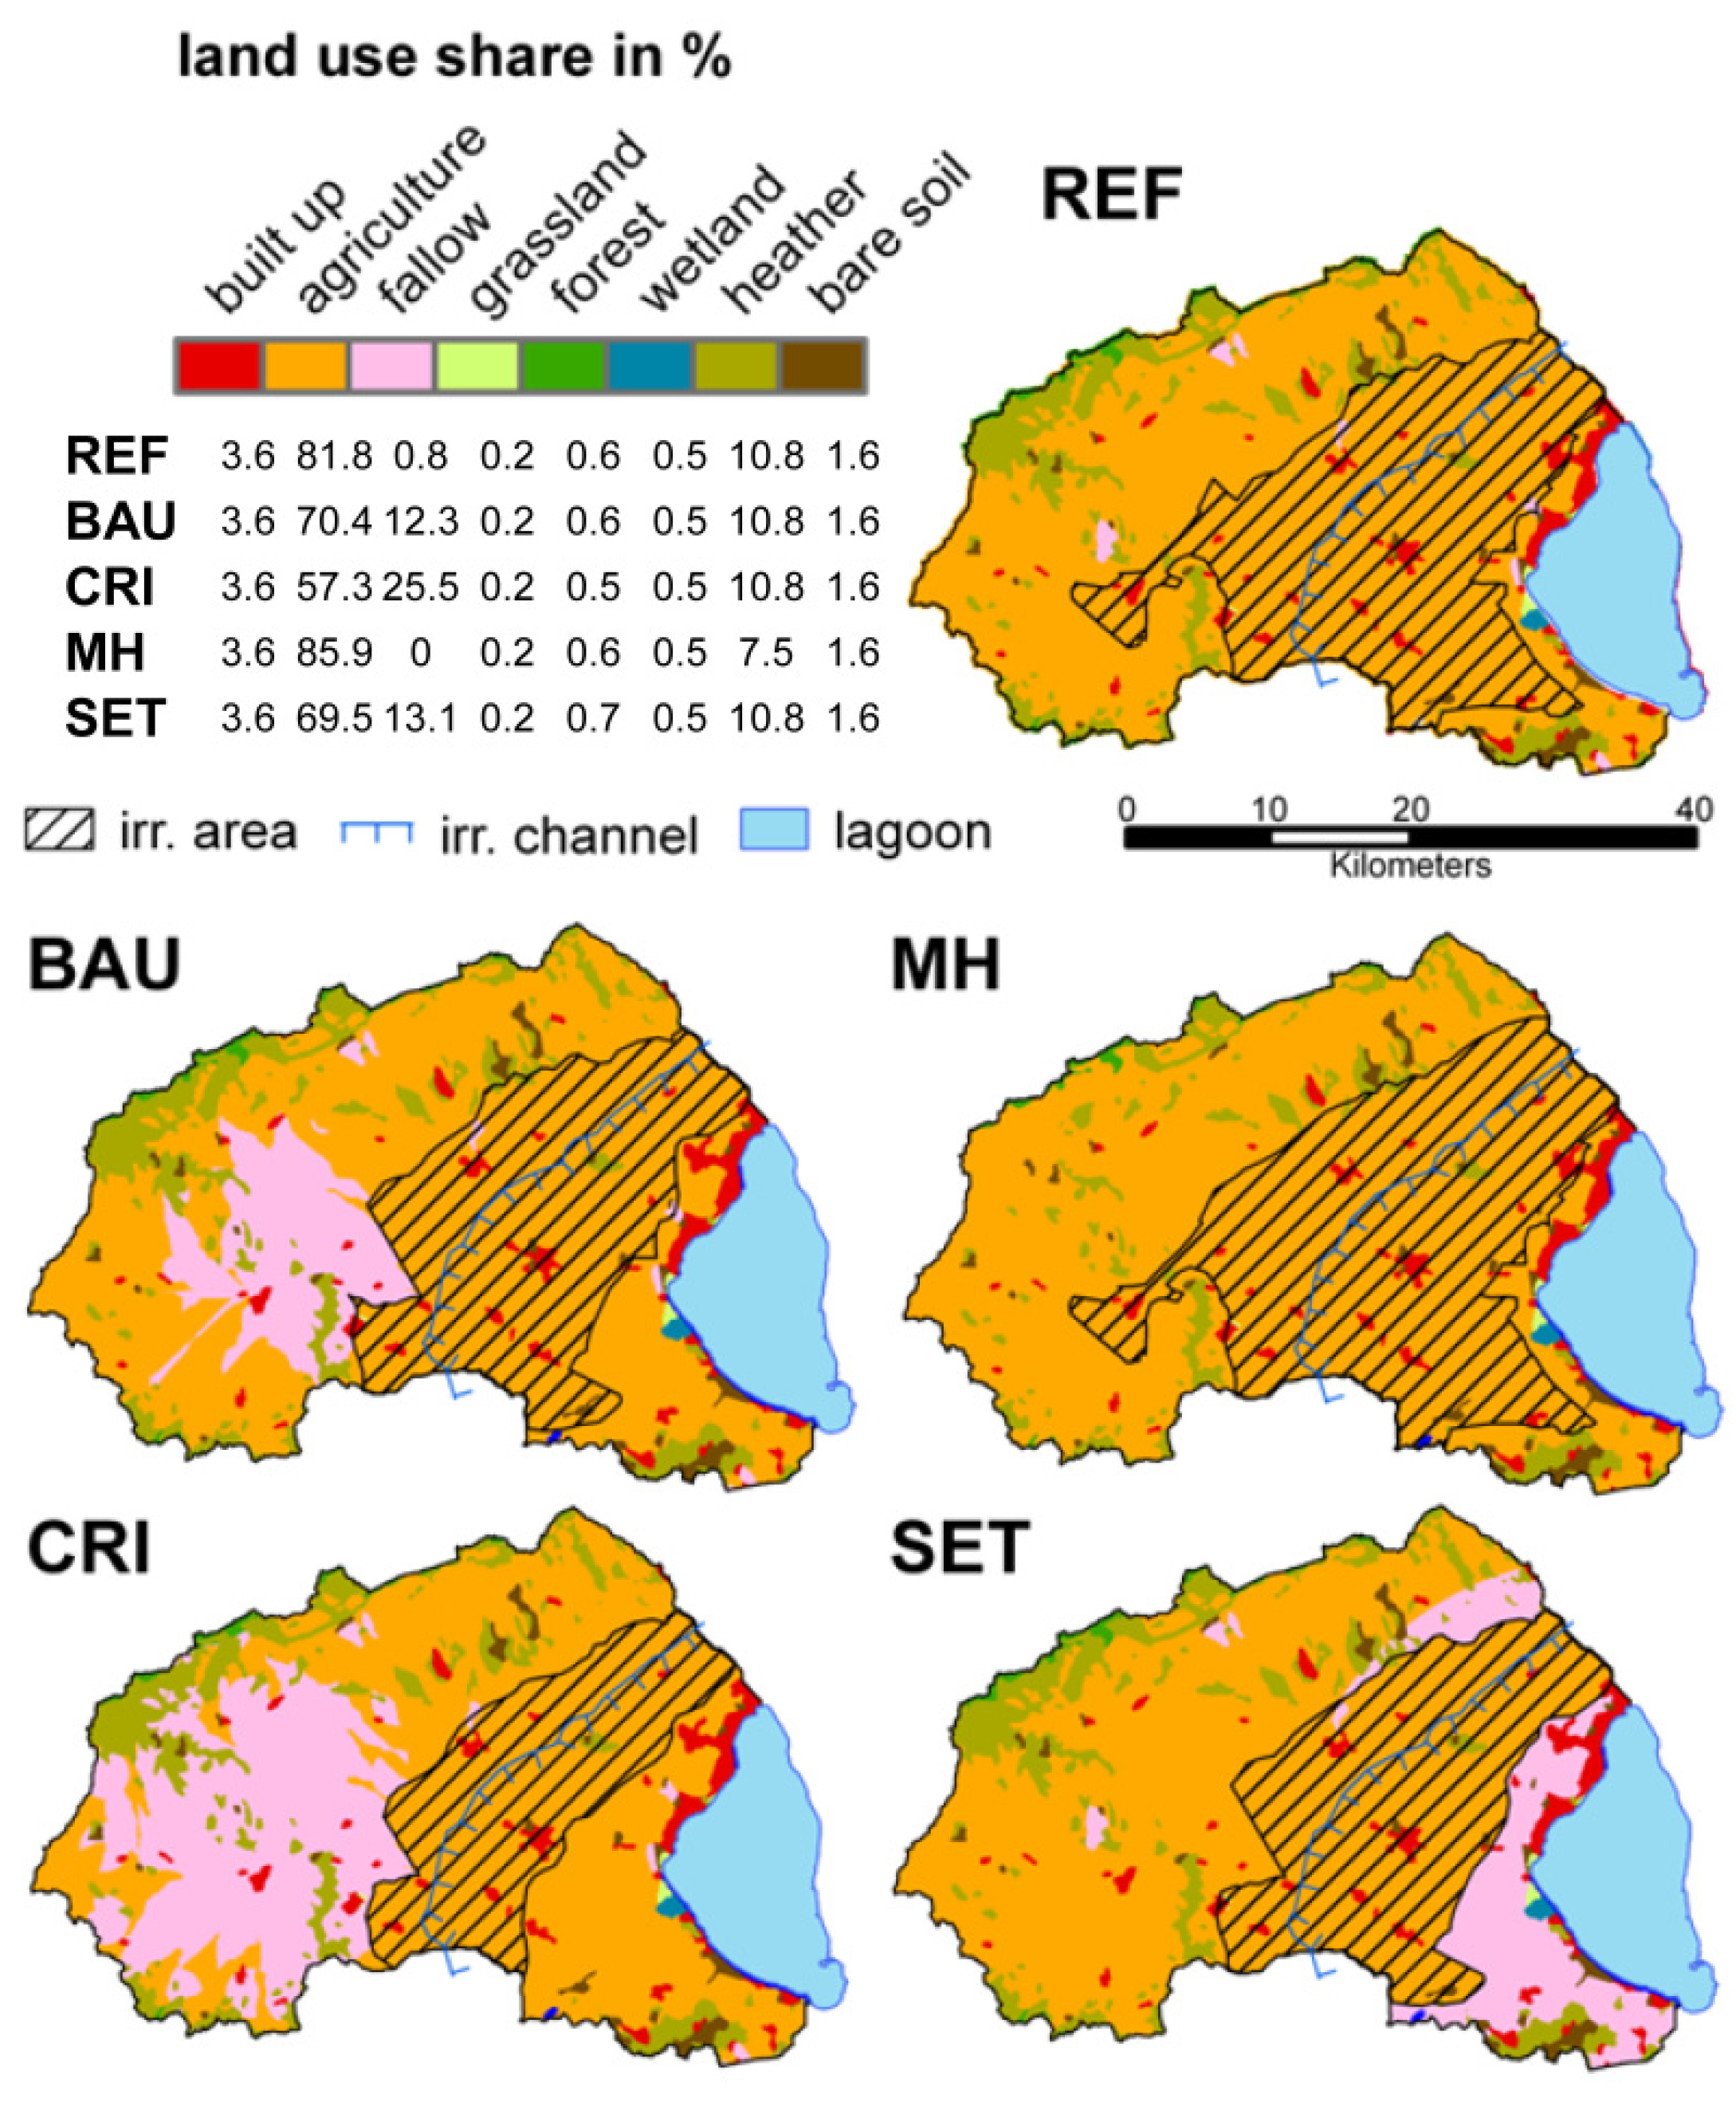
3.5. Socio-Economic Scenarios

The socio-economic scenarios used in this study are the product of a complex multi-stage process, including discussions focus groups, citizen juries and scenario workshops. Firstly, narrative storylines representing four different directions of the economic and environmental development for the near future (around year 2030) in the catchment were developed. Their main aspects are shortly described in the following.
The “business as usual” (BAU) scenario represents a possible future of the catchment based on the continuation of current trends of the economic development. In particular, this means a strong increase in tourism along with slight decrease in the agricultural sector and their observed negative effects on the environment and the lagoon (high nutrients input).
The “crisis” (CRI) scenario assumes a negative development of the local economy (a decrease in tourism and a strong decrease of agricultural activities), which leaves no space for environmental protection measures, and hence is likely to lead to further environmental and ecological degradation.
The “managed horizons” (MH) scenario considers a possible future based on economic growth (i.e., increase in touristic development and agricultural area) along with an improvement of the environmental situation through the introduction of appropriate measures (e.g., decrease of mineral fertilization).
And finally, the “set-aside” (SET) scenario describes a possible future of a shrinking economy (i.e., a decrease in tourism and agriculture), which is meant to improve the environmental situation in the catchment and the ecological status of the lagoon.
A detailed description of the scenario development can be found in the Lagoons deliverables [37,38]. The narrative storylines of each socio-economic scenario are presented in Deliverable 4.2 [38].
For the purpose of modeling and the assessment of potential changes the qualitative scenarios were translated into quantitative ones, using statistical data from the Statistical Office of the European Communities (EUROSTAT) and expert knowledge. The assumed relative changes were then transferred into new land use maps and a modified set of SWIM input parameters (effluent characteristics and fertilizer amounts) for each scenario. The effluents from the UWWTP (discharge and nutrient loads) were modified according to the assumed changes in permanent population and touristic activities. The changes of SWIM input data for each scenario are shown in Table 2.
Table 2. Assumed management related relative changes in population, tourism and agricultural practices for the four socio-economic scenarios (BAU, CRI, MH and SET).
ParameterBAUCRIMHSET
Population (%)28−2010−10
Tourism (%)2−104−5
Min. fertilization (%)-−20−15−20
Org. fertilization (%)-−20+15+20
Irrigation (%)−22−45+5−25
The new land use maps were created by implementing the assumed changes in agricultural land and land cover type. For that, different criteria, such as the soil quality (in terms of water holding capacity), distance to the lagoon/urban areas/major irrigation channel, catchment morphology, rainfall distribution and others were used. The assumed changes in irrigation were implemented through changes in the size of the irrigated area, whereas the amount of irrigation water per hectare remained constant. The implementation of the assumed changes for each scenario is briefly described in the following. The reference land use map and the four new land use maps are presented in Figure 4.
Figure 4. Land use maps for the reference (REF) and scenario (BAU, CRI, MH and SET) conditions for the Mar Menor catchment, as well as shares of land use classes for the reference conditions and the four socio-economic scenarios.
Water 07 01538 g004
For the BAU scenario all irrigation units from the “Zona Regable Occidental” and some irrigation units from the “Zona Regable Oriental” (located most far away from the major supply channel) were excluded from the irrigated area. Besides, 14% of the agricultural land was converted to fallow. For that, areas outside the new irrigation zone, having low precipitation rates and low quality soils (low water holding capacity) were chosen.
In the CRI scenario, some more irrigation units from the “Zona Regable Oriental” were excluded from the irrigated area, resulting in a narrow irrigation stripe along the major supply channel. Agriculture land was reduced by 30% (converted to fallow), using the same criteria as for the BAU scenario. In addition, forest was reduced by 20%. Deforestation was implemented preferably close to urban areas (which is still mostly in the mountainous areas of the catchment) and on soils with lower water holding capacity.
In the MH scenario the irrigated area was slightly extended. For that, land units outside the reference irrigation zone and close to the major supply channel were chosen. All of the abandoned land (fallow) and 5% of the land cover “heather” were converted into new agricultural land. The conversion was made preferably within the new irrigation zone but also outside the zone on good quality soils (high water holding capacity).
In the SET scenario the irrigated area was reduced similarly as in the BAU scenario (exclusion of irrigation units located most far away from the main supply channel). The abandonment of agricultural land was on purpose and had an intension to improve the environmental situation in the catchment. Therefore the changes were implemented as close as possible to the lagoon, in order to create a kind of buffer strip along the water body. Some less suitable agricultural units (with lower water holding capacity) outside the irrigation zone were converted to fallow as well as some areas at high elevations were even afforested. In total, the agricultural area was reduced by 15%.

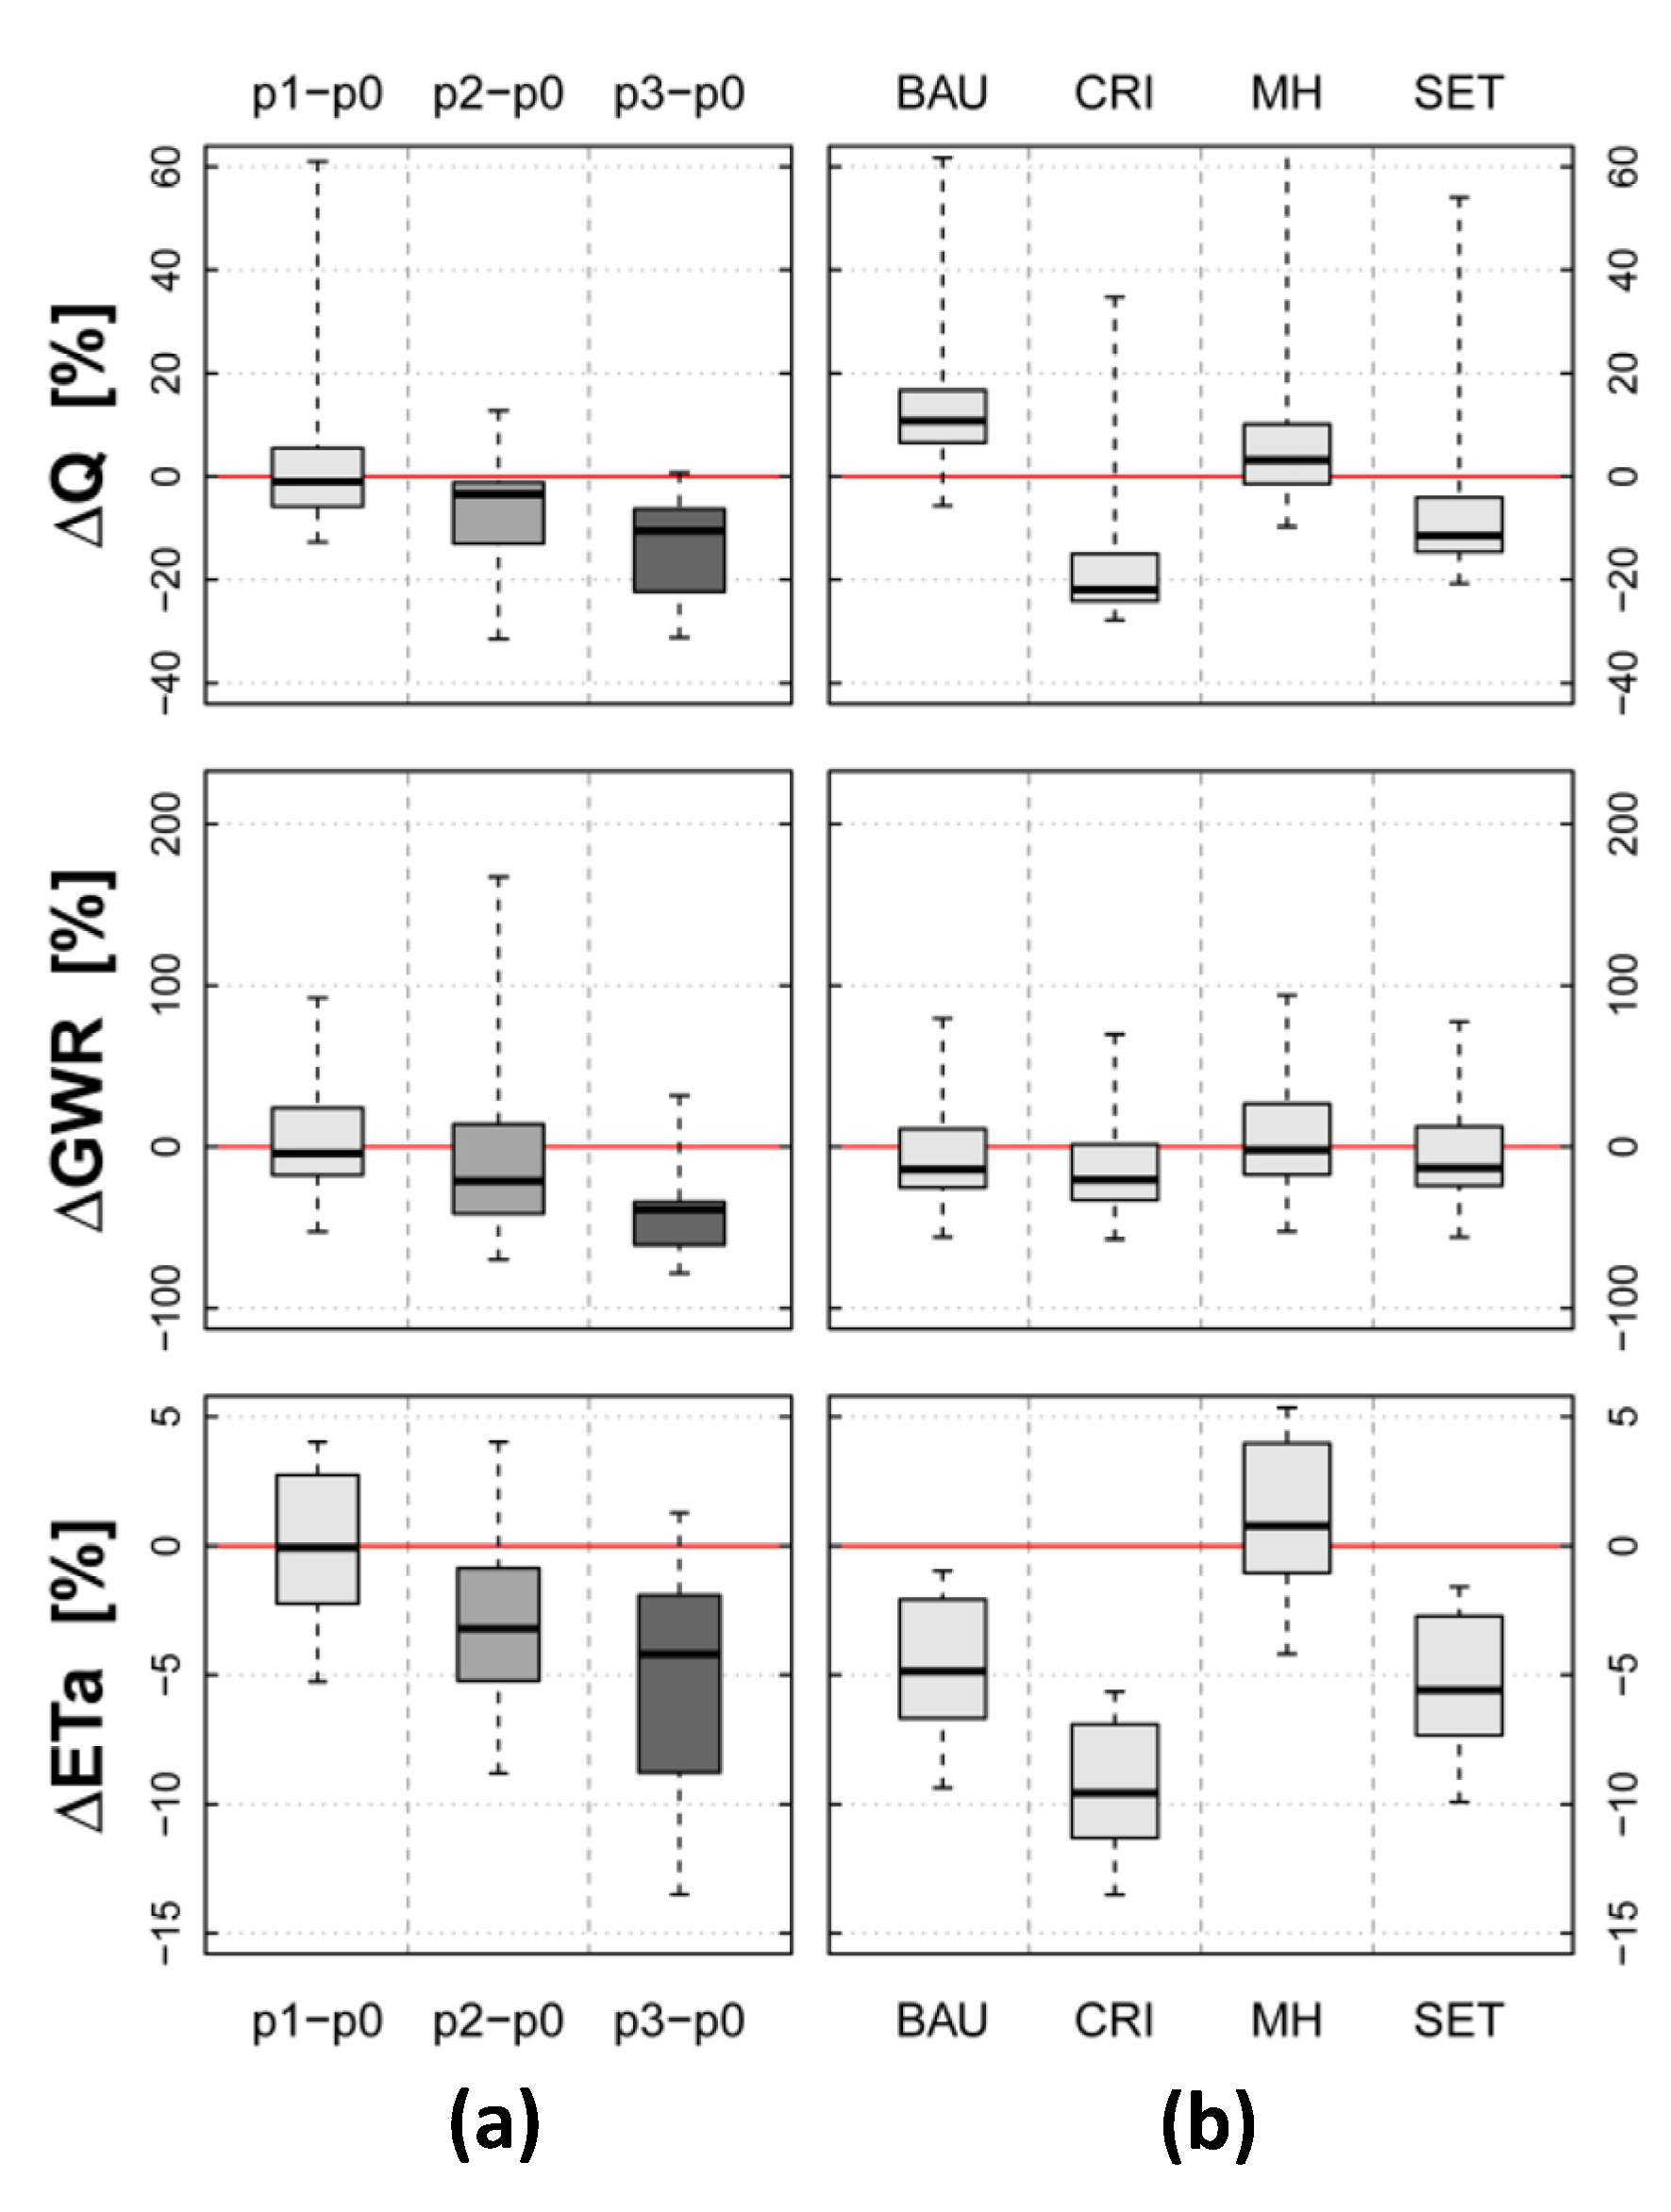
3.6. Approach for Impact Assessment

For climate change impact assessment, we ran the calibrated model with each of the 15 ENSEMBLES scenarios for one reference (p0: 1971–2000) and three future (p1: 2011–2040, p2: 2041–2070 and p3: 2071–2098) scenario periods using the reference model setup (reference land use map and reference management settings). This approach has been already successfully used in Stefanova et al. [32] and Hesse et al. [33] for climate change impact assessment in the catchments of the Ria de Aveiro in Portugal [32] and the Vistula Lagoon in Poland and Kaliningrad [33].
Next, each of the four socio-economic model setups (four different land use maps in combination with four different management settings) was run with the ENSEMBLES climate data for the first scenario period (p1), assuming that the socio-economic changes around the year 2030 correspond to climate in 2011–2040. In total, the outputs of 120 SWIM simulations (15 climate scenarios × 4 periods + 15 climate scenarios × 1 period × 4 socio-economic scenarios) were used for impact assessment.
The responses of water resources to climate change only, combined climate and socio-economic changes and socio-economic changes only were estimated by calculating differences in model outputs between periods and scenarios in the following ways:
(a)
Climate change impacts:
p1(reference), p2(reference), p3(reference) − p0(reference)
(b)
Combined impacts:
p1(BAU), p1(CRI), p1(MH), p1(SET) − p0 (reference)
(c)
Socio-economic impacts:
p1(BAU), p1(CRI), p1(MH), p1(SET) − p1 (reference)
We calculated the long-term mean annual and monthly relative changes in average daily total water inflow (Q), nitrate nitrogen (NO3-N), ammonium nitrogen (NH4-N) and phosphate phosphorus (PO4-P) input to the lagoon, as well as differences in total annual and monthly groundwater recharge (GWR) and actual evapotranspiration (ETa) in the catchment.

4. Results and Discussion

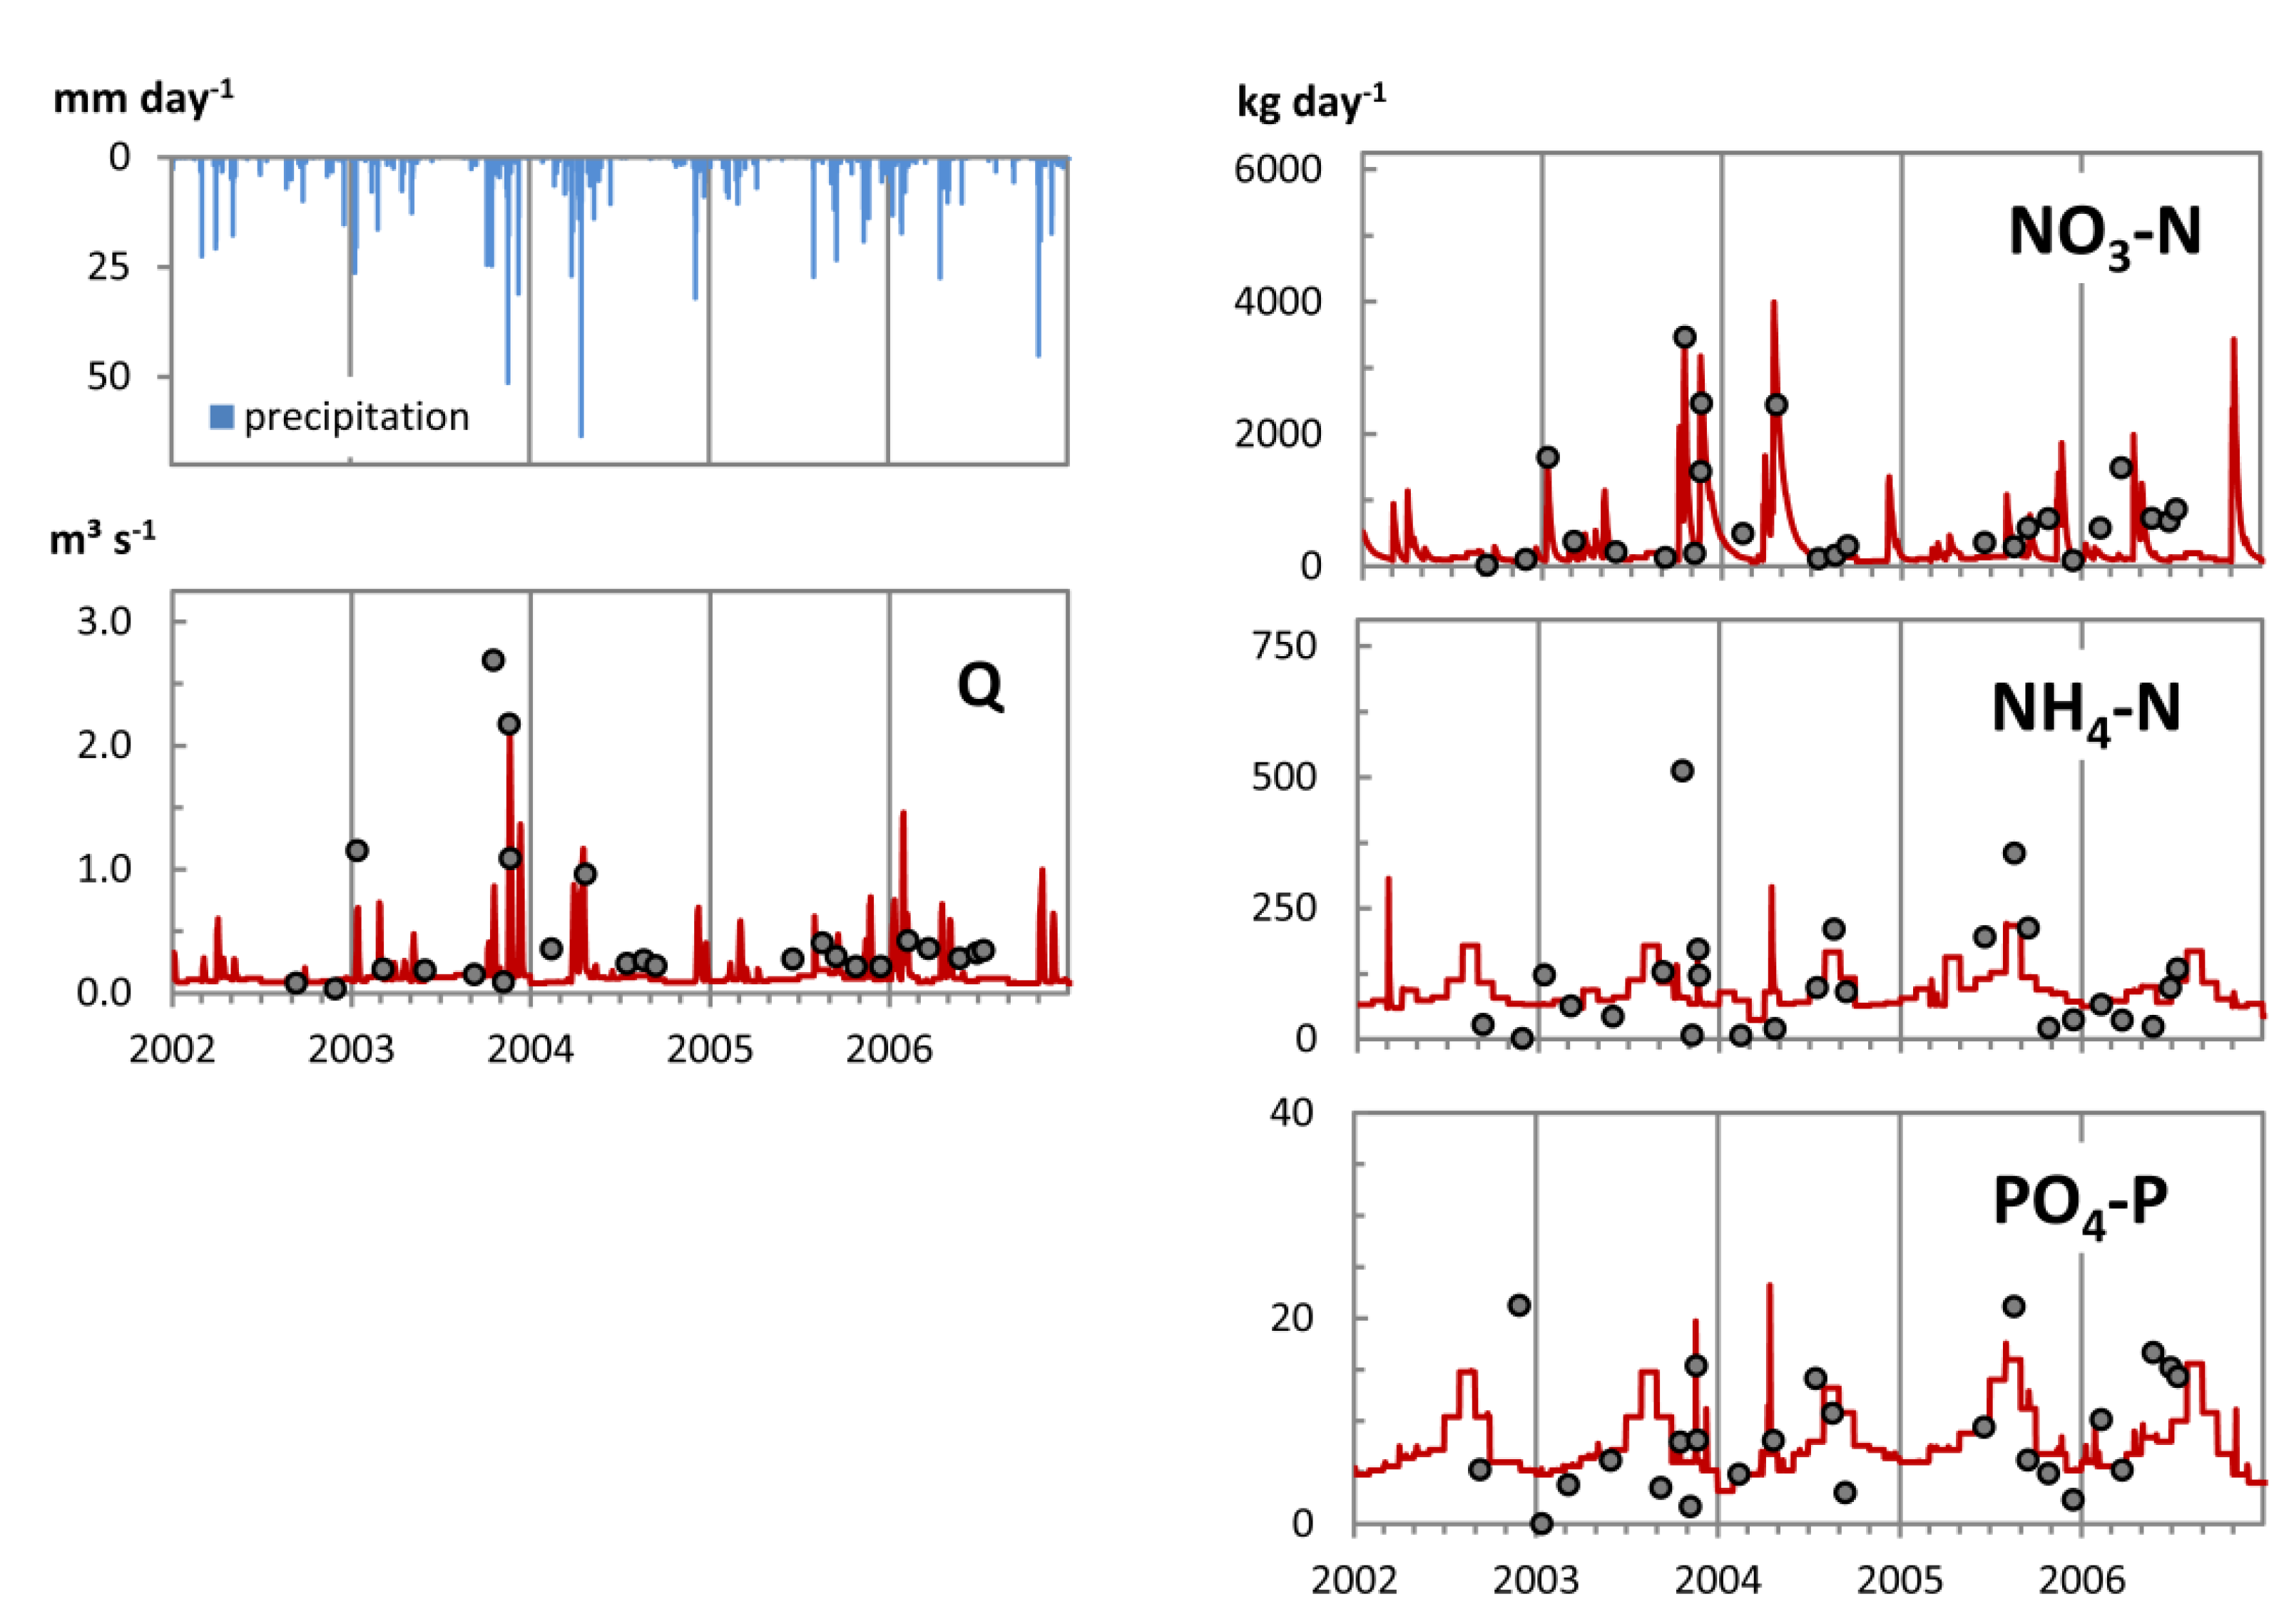
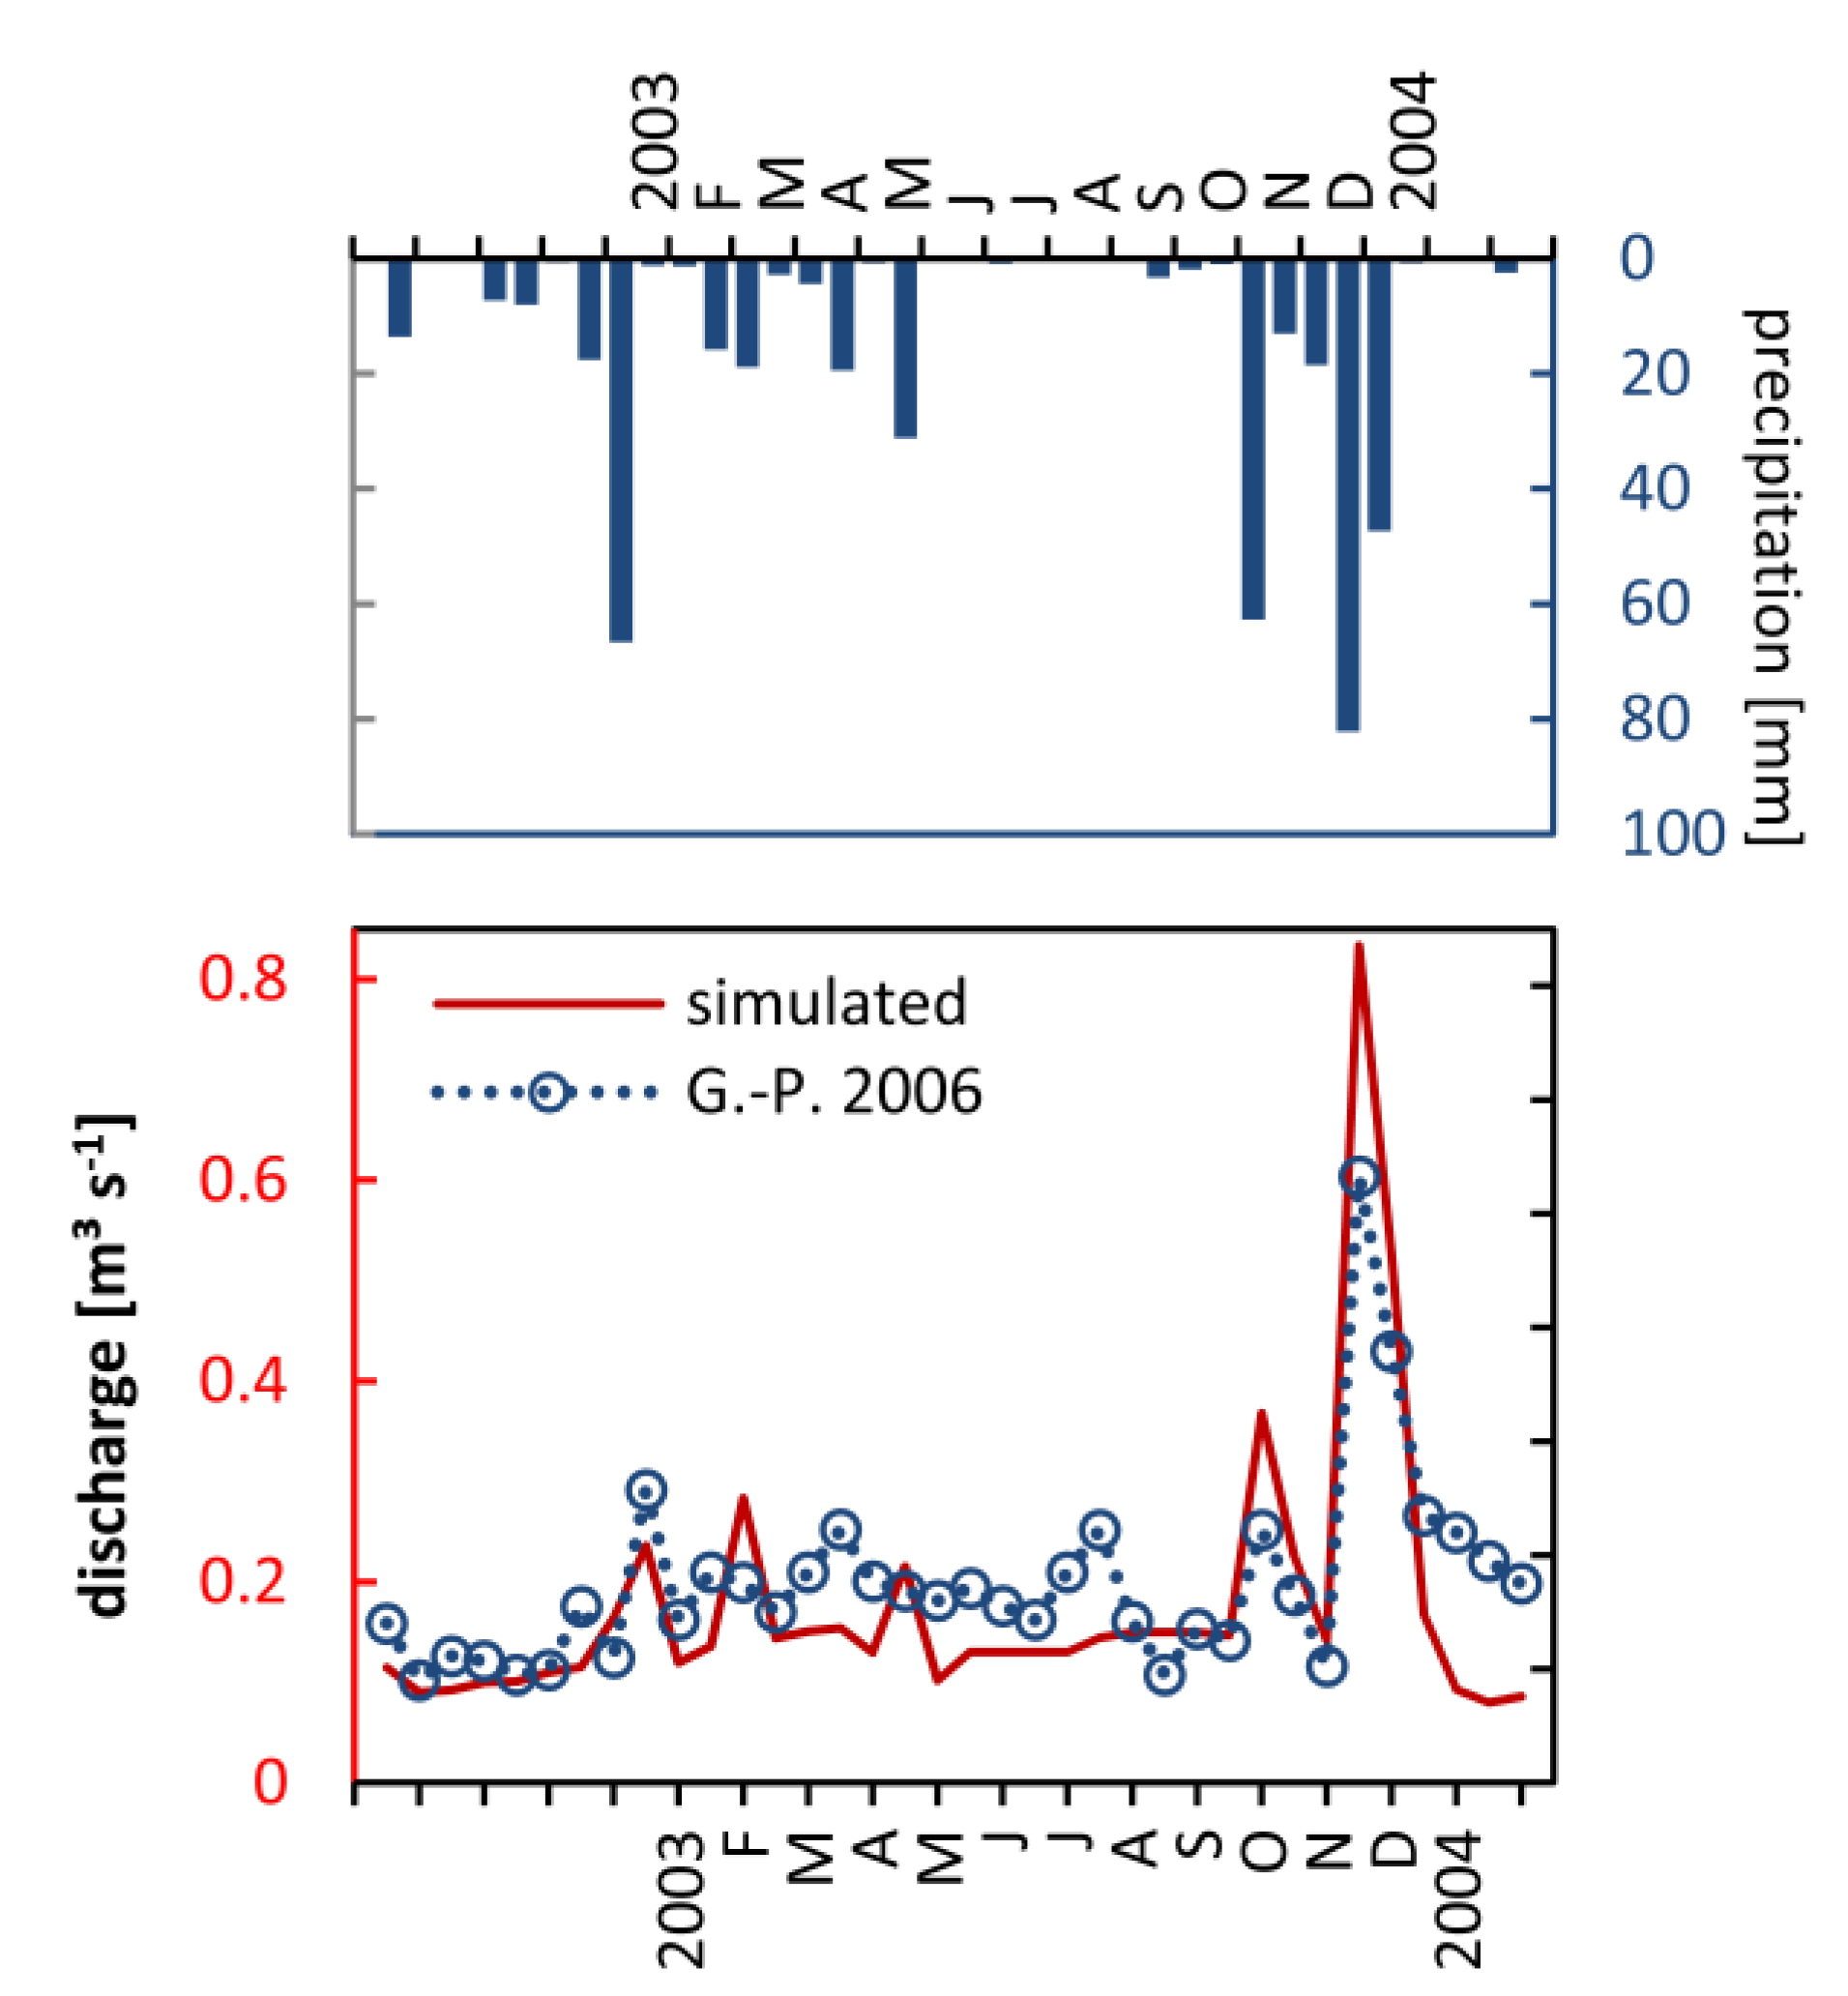
4.1. Model Performance

Despite all uncertainties related to measured data (see Section 3.2), the simulation results for the Albujon wadi show a satisfactory model performance (Figure 5). With regard to river discharge (Q) we can observe that SWIM is able to reproduce adequately most of the winter peaks (e.g., November 2003 and April 2004) and summer low flows (e.g., Septempber 2002, May 2003 and August 2004) obtained during the measuring campaign between September 2002 and July 2006. The maximum simulated daily discharge within this period reaches 2.74 m3/s, whereas the average low flow lies between 0.12 m3/s and 0.15 m3/s.
Figure 5. Comparison of simulated daily (red lines) and measured (dots) river discharge (Q), nitrate nitrogen (NO3-N), ammonium nitrogen (NH4-N) and phosphate phosphorus (PO4-P) loads for the catchment of the Albujon wadi (including the diversion from Rambla de la Maraña) and the simulation period 2002–2006.
Water 07 01538 g005
The model also simulates sufficiently well the annual dynamics of nitrate nitrogen (NO3-N), ammonium nitrogen (NH4-N) and phosphate phosphorus (PO4-P) loads (Figure 5). The NO3-N loads to the Mar Menor are dominated by agricultural activities. The peaks of both the simulated and the observed NO3-N loads in the Albujon wadi occur during extreme precipitation events (storms), as a result of increased surface and subsurface runoff from the agricultural fields. The relationship between nitrogen enrichment and agriculture has been discussed in Lloret et al. [20] and Salas et al. [39], and also demonstrated by means of sampling in various studies on the Mar Menor and its catchment (e.g., [17,40]), and could also be nicely reproduced by our model.
In contrast to that, the NH4-N and PO4-P loads originate mainly from point source pollution (e.g., effluents from UWWTP) [19]. The simulated and observed NH4-N and PO4-P loads reach their maxima during the touristic peak in summer, when the population in the catchment increases by a factor of ten [17]. In most of the winter months, the observed NH4-N and PO4-P loads are close to zero, which does not comply with the chemical composition of the released effluents from the UWWTP (higher loads). The simulated winter loads correspond to the loads from the UWWTP, and are by that a bit higher than the observed ones. It is very likely that the actual released pollutants (ammonium and phosphate) are reduced through in-stream processes and plant uptake (e.g., by reeds) on their way from the UWWTP to the mouth of the Albujon wadi. In their study, for example, Álvarez-Rogel et al. [41] show that the coastal marshes of the Mar Menor play an important role in reducing phosphorus and nitrogen input to the lagoon. These processes are very complex and, at the current stage they are not included in the model, as a result of which the simulated nutrient loads at the mouth cannot be lower. On the other hand, skipping this step from the nutrient cycling would usually produce overestimated summer loads as well, which does not apply. The reasons for this discrepancy could be unknown small additional point sources in the catchment or incorrect information on the quality of the discharged effluents from the UWWTP.
The additional model validation using discharge data from Garcia-Pintado et al. [18] also shows quite satisfactory results (Figure 6). In the dry period, between June 2003 and September 2003 the model misses one small observed peak, which is most likely due to incorrect data from the UWWTP or the lack of information on other point sources in the catchment. Furthermore, the simulated peaks in winter 2003/2004 are slightly higher than the observed ones. At this point, it should be recalled that the curve adopted from Garcia-Pintado et al. [18] is based on 36 measurements only, while the simulated biweekly flow dynamics from SWIM are based on about 580 values. It is not unlikely that some of the actual peaks or low flow values were not recorded during the measuring campaign. This may, to some extent explain the discrepancies between both curves, which are in general small.
Figure 6. Comparison of simulated and estimated (Garcia-Pintado et al. [18]) biweekly discharge for the Albujon wadi catchment (including the diversion from Rambla de la Maraña).
Water 07 01538 g006
Table 3 summarizes the average annual water inflow and nutrient (NO3-N, NH4-N and PO4-P) loads to the lagoon as simulated by SWIM and estimated by Garcia-Pintado et al. [18]. The projected total discharge of the Albujon wadi (5.51 hm3) for this period is nearly equal to the one estimated by Garcia-Pintado et al. [18] (5.46 hm3). At the same time it is considerably lower than the one estimated by Velasco et al. [17] (20.14 hm3) for the same period, which based their estimates on seven sporadic measurements only. This demonstrates nicely how uncertain estimates could be due to rare measurements, and how important it is to use sufficiently long and continuous time series for extrapolations of this type. The simulated total NO3-N input to the lagoon is slightly higher than the one estimated by Garcia-Pintado et al. [18], whereas the loads of the two point-sources dominated nutrients (NH4-N and PO4-P) are very close to the observed ones.
Table 3. Comparison of simulated and estimated (Garcia-Pintado et al. [18]) average annual total inflow (Q) and nutrients (NO3-N, NH4-N and PO4-P) input from the Albujon catchment (including the diversion from Rambla de la Maraña) to the Mar Menor.
VariableG.-P. (2006) (October 2002–February 2004)SWIM (October 2002–February 2004)
Q5.465.51
NO3-N112.84 *153.84 *
NH4-N29.431.55
PO4-P2.572.54
Note: * (February 2003–February 2004).

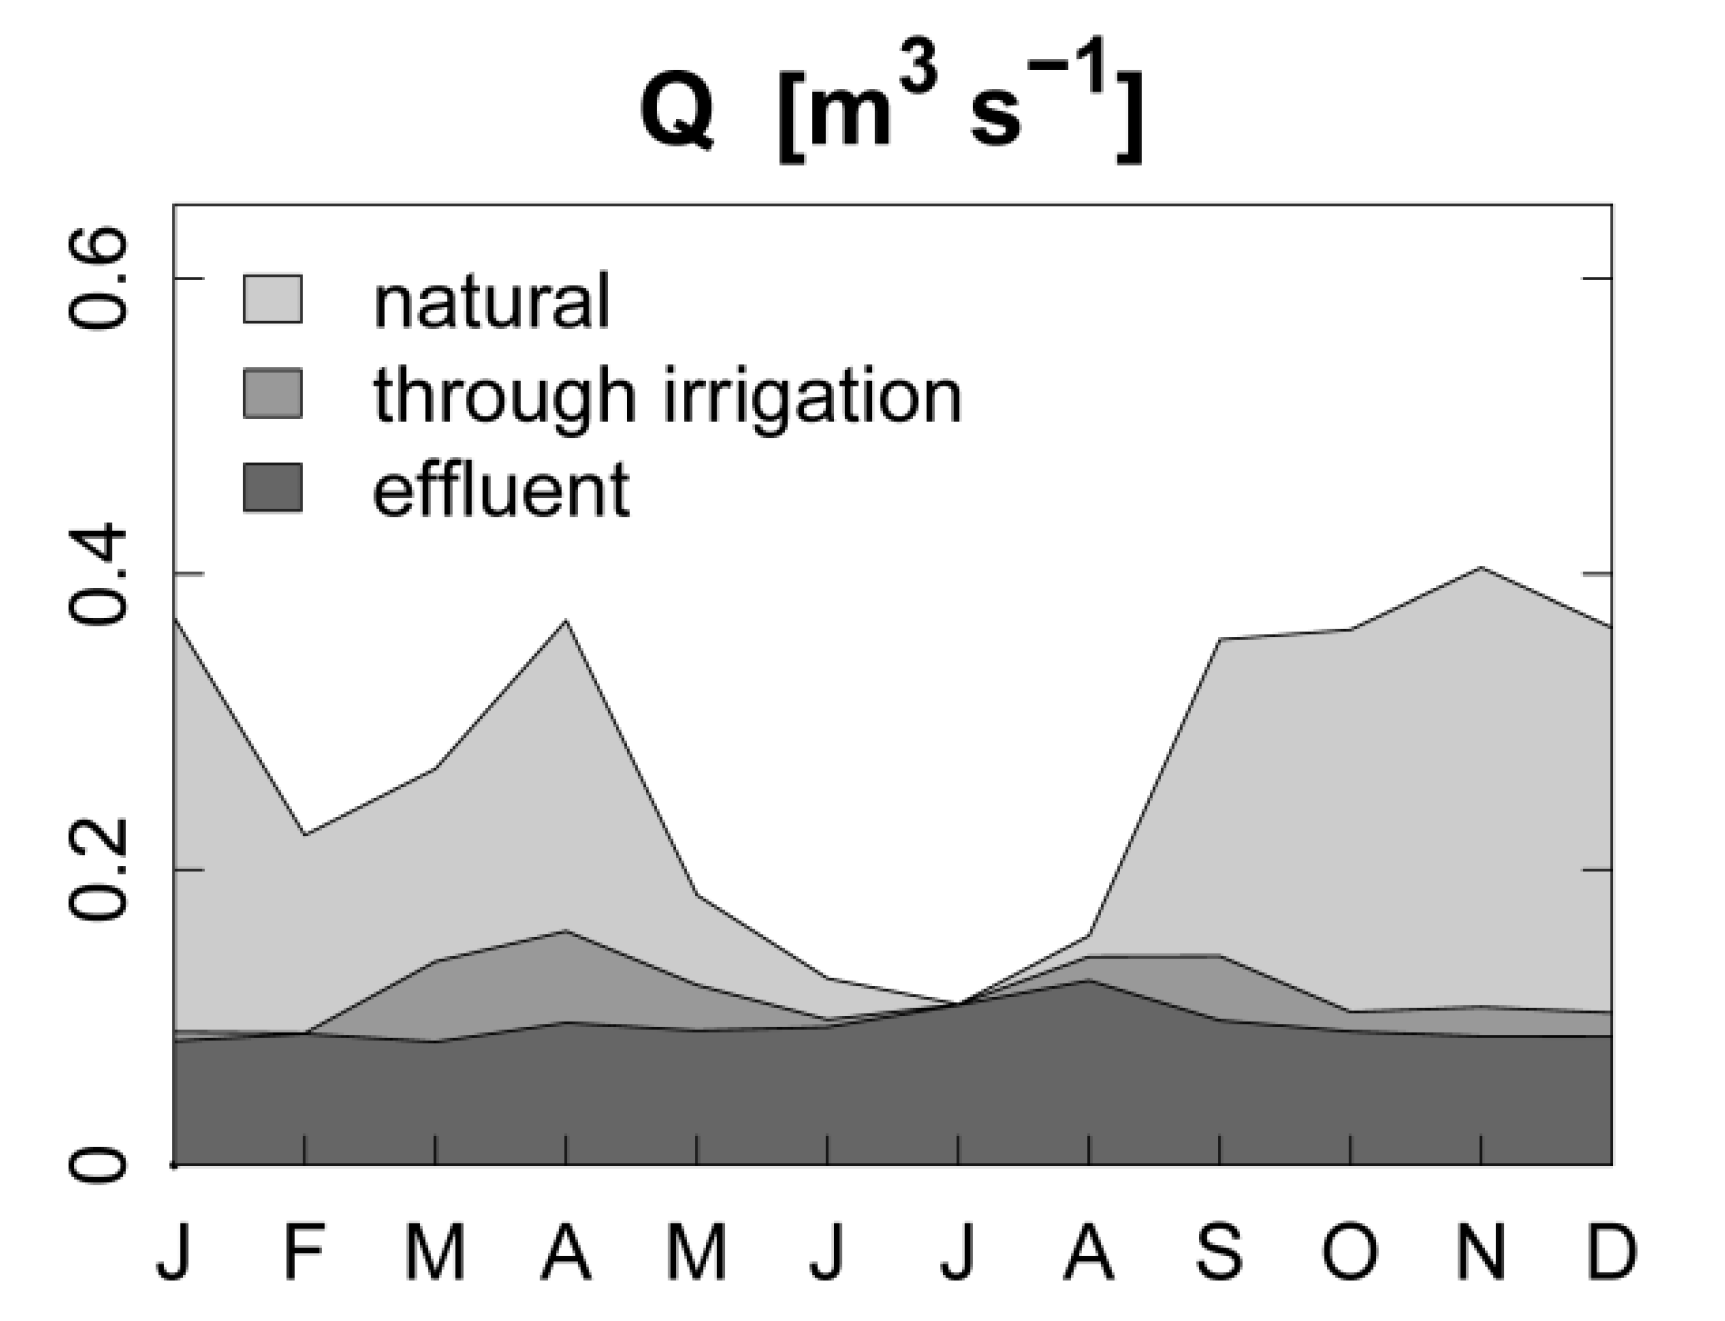
4.2. Water Inflow and Nutrients Input to the Lagoon

The simulated total annual inflow to the Mar Menor for the period 2002–2011 is about 8.7 hm3 (Table 4). The share of the effluent is about 35% and that of infiltrated irrigation water about 8%. According to our calculations, less than 1% of the applied water for irrigation reaches the Mar Menor, which implies that almost all of it is used in plant transpiration, soil evaporation processes and groundwater recharge.
Table 4. Values of long-term average annual (2002–2011) simulated water inflow from the total drainage area of the Mar Menor and from the catchment of the Albujon wadi to the lagoon, as well as of the amount of additional water added to the whole system (effluent and irrigation water).
Unit (Hm3·a−1)Mar Menor Drainage AreaAlbujon Wadi Catchment *
Q8.75.2
Q without irrigation8.05.0
Effluent3.03.0
Irrigation water15163
Note: * including Rambla de la Maraña.
In the catchment of the Albujon wadi (including diverted water from Rambla de la Marana) the share of natural flow is about 39% only. Almost 2/3 of the total discharge at the mouth of the wadi consists of infiltrated irrigation water (4%) and discharged effluents (60%).
The seasonal dynamics of the total water inflow to the Mar Menor (Figure 7) follows the precipitation dynamics in the catchment. We can observe higher flows during the wet period from September to April, reaching 0.4 m3·s−1 on average. Since in our model setup irrigation is applied between March and September we can also observe some peaks, but less pronounced in the flow dynamics of the infiltrated irrigation water. In comparison, the effluent induced part to the total inflow is nearly constant over the year. The small rise in April, followed by a continuous increase until August represents the touristic activities and variations in water consumption in the catchment.
The total average annual nutrient inputs to the Mar Menor are about 192 t NO3-N, 25 t NH4-N and 2 t PO4-P. Almost all of the NH4-N and PO4-P loads reaching the lagoon every year are coming from the released effluents. The point source contribution to the total NO3-N input is about 14% only, whereas the diffuse sources from arable land account for about 72% of the total average annual NO3-N input to the lagoon.
Figure 7. Long-term average (2002–2011) seasonal dynamics of total water inflow to the Mar Menor.
Water 07 01538 g007
The simulated average annual groundwater recharge in the catchment is about 97 mm·y−1. The mean evapotranspiration rate sums up to 412 mm·y−1 (potential evapotranspiration accounts for 882 mm·y−1). The surface and subsurface flows (excluding UWWTP effluents) reaching the Mar Menor every year are about 4 mm·y−1 only. The mean recorded precipitation over the catchment for this period (2002–2011) is about 336 mm·y−1.

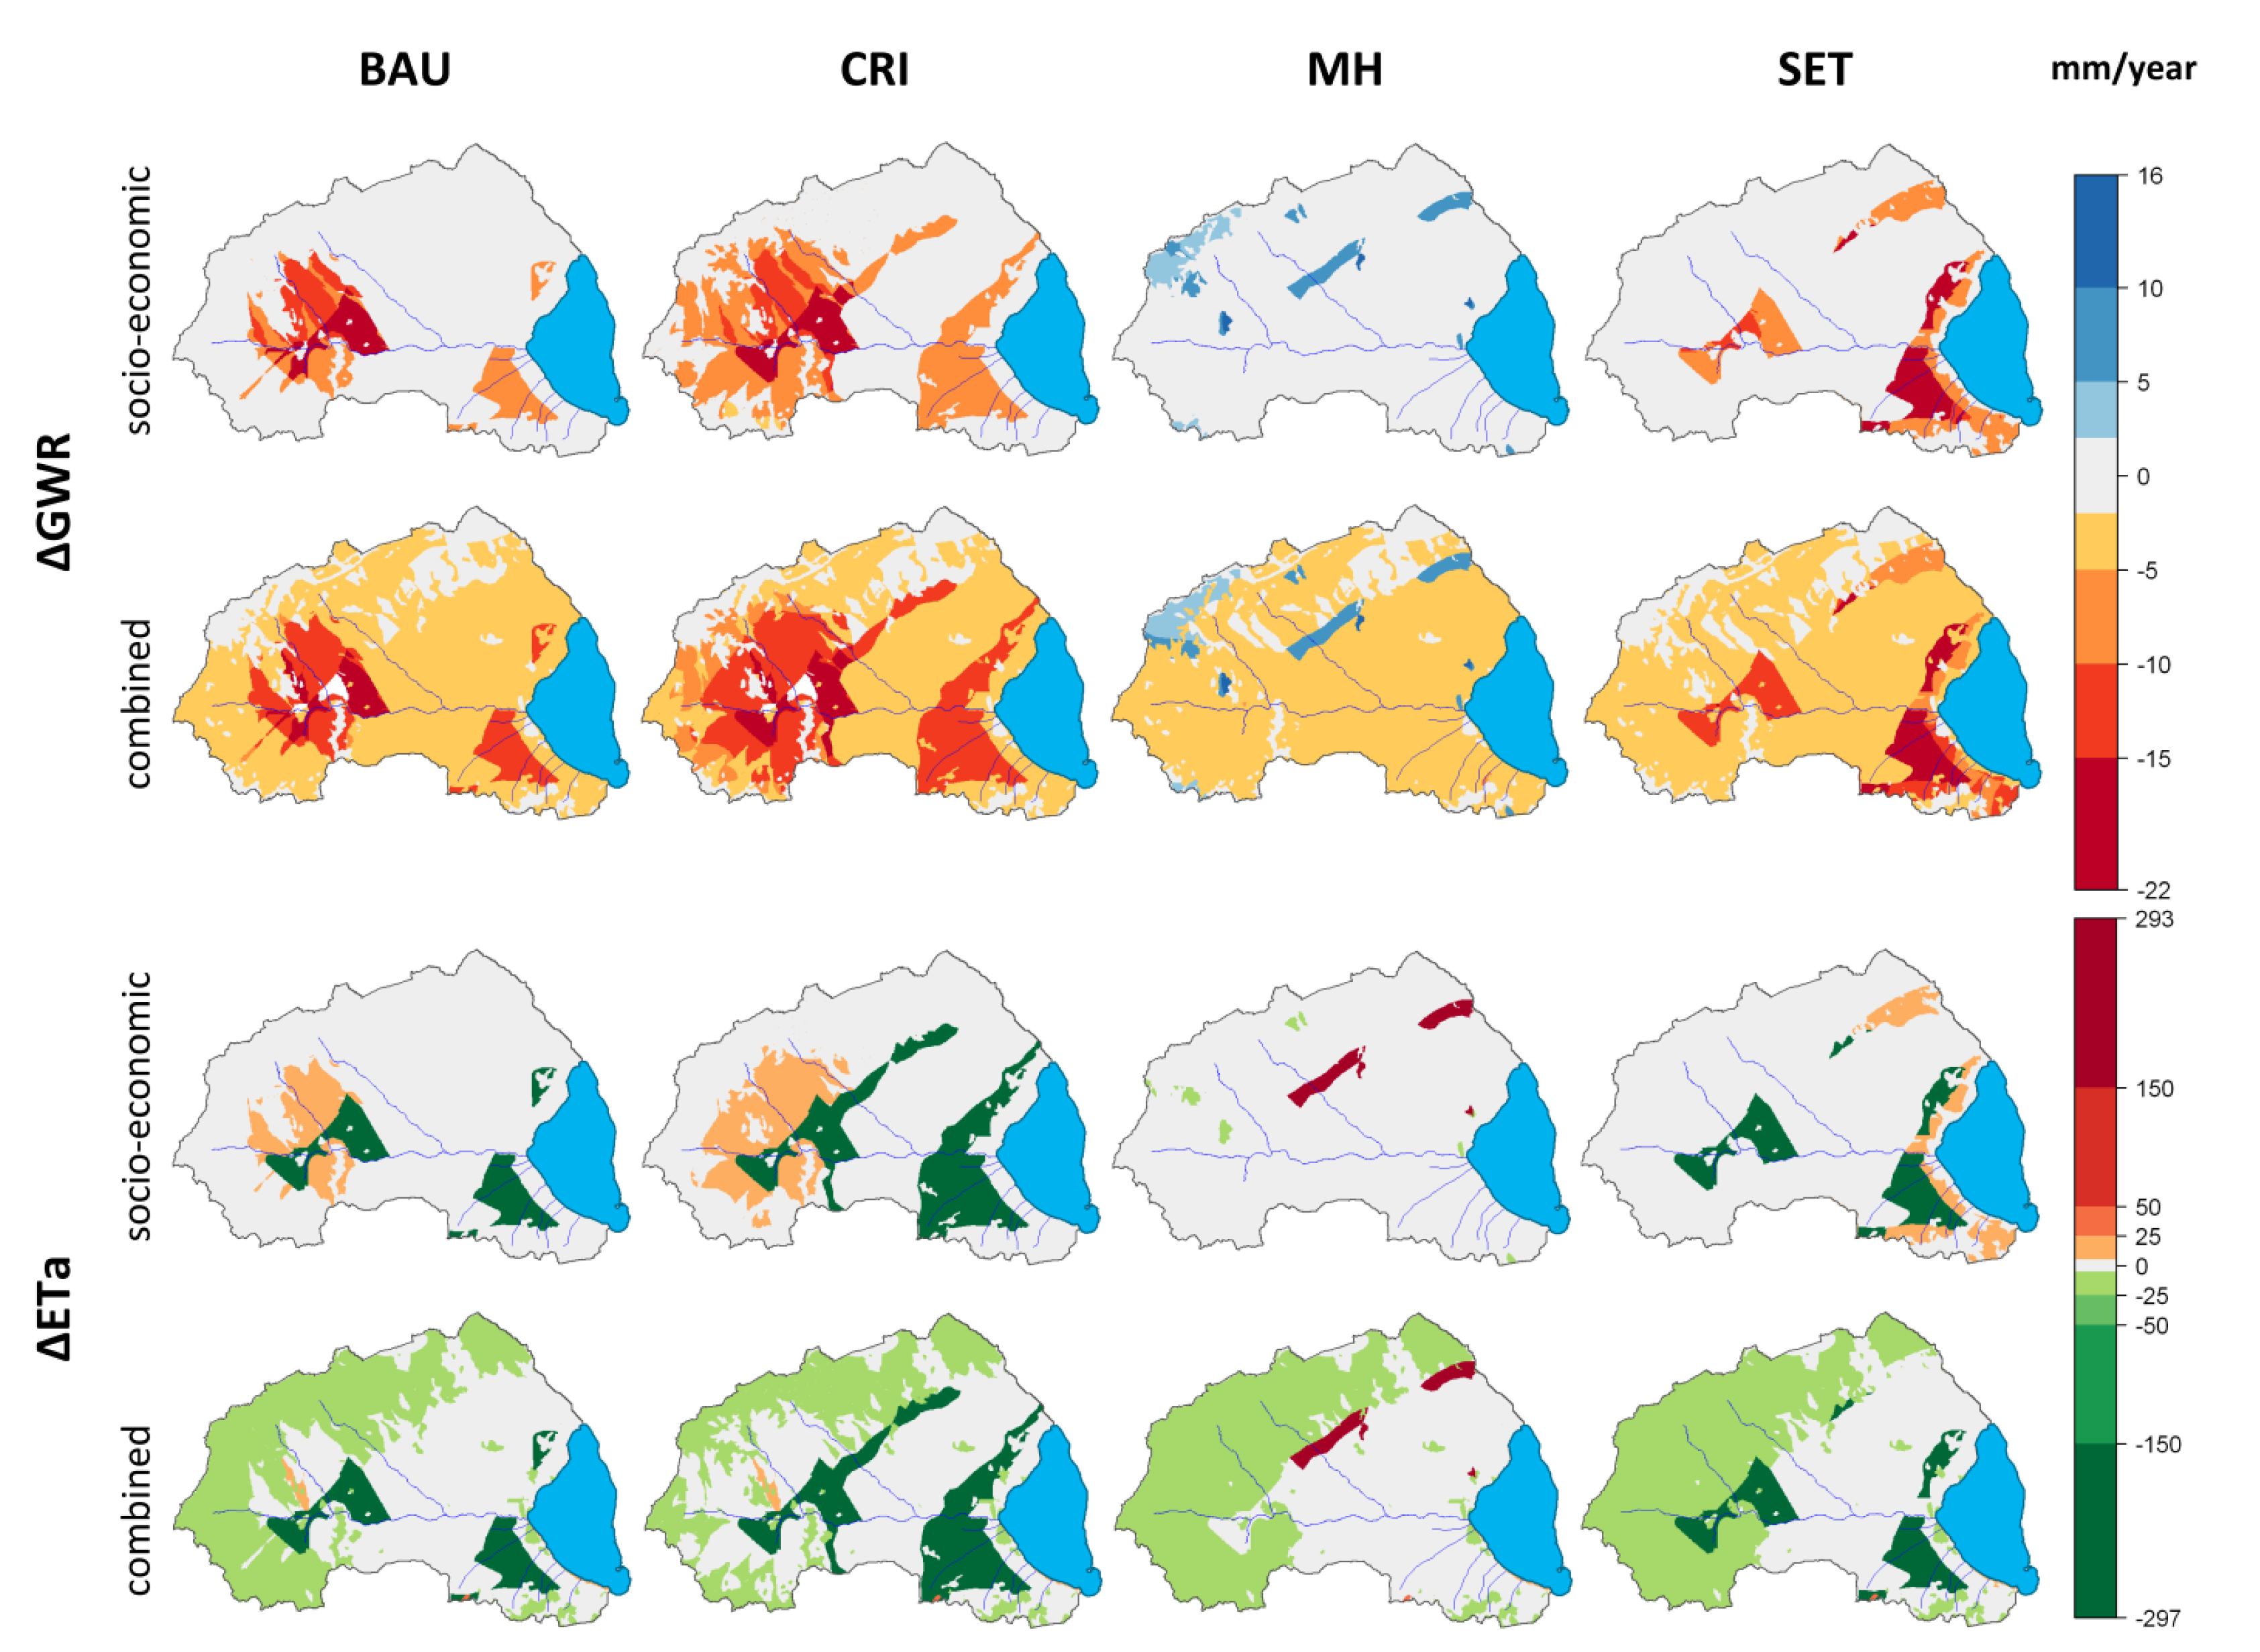
4.3. Average Annual Impacts on Water Resources

The results of the impact assessment on the major water cycle components in the catchment and the major nutrient inputs to the lagoon are presented firstly for each parameter set for the climate change scenarios only, and for the combined scenarios subsequently.

4.3.1. Changes in Major Water Cycle Components

(a) Climate change impacts
The simulated impacts of climate change on average daily discharge (Q), average annual groundwater recharge (GWR) and average annual evapotranspiration (ETa) in the catchment correspond well to the observed climate change signals for precipitation.
The projections, driven by 15 climate scenarios show a moderate decrease of long-term average daily discharge to the lagoon for all three scenario periods compared to the reference period p0 (Figure 8). The disagreement among scenarios is the biggest for the first scenario period p1 and decreases visibly towards the end of the century. Moreover, the negative trend in daily discharge becomes more obvious for the last scenario period p3. The simulated median annual changes in Q are −1.0% for p1, −3.5% for p2 and −10.6% for p3.
Figure 8. Long-term average annual changes in total inflow (Q) to the lagoon as well as in groundwater recharge (GWR) and actual evapotranspiration (ETa) in the Mar Menor catchment shown as boxplots. (a) Climate change impacts, showing results for the three future scenario periods (p1, p2 and p3) compared to the reference period (p0); (b) Combined, climate and socio-economic impacts showing results for each of the four socio-economic scenarios (BAU, CRI, MH and SET) compared to the reference conditions.
Water 07 01538 g008
Other studies on climate and land use change impacts on water resources in Mediterranean catchments have come to similar results, although, in general, the analyzed catchments were more natural and the effect of climate change was more evident. For example, Morán-Tejeda et al. [41] constructed future climate scenario data based on the information from three climate scenarios from the ENSEMBLES project (corresponding to s1, s5 and s13 scenarios in this study) and applied these to drive two different hydrological models, one of them being the SWAT model. Their results showed on average a decrease in water yield of 9%–15% for the period 2021–2050. Another study, carried out by Molina-Navarro et al. [42] estimated an average decrease in runoff of 22% for 2045–2064 using climate data based on the A1B emission scenario and a set of regional climate projections provided by the Spanish meteorological service. D’Agostino et al. [43] used climate data based on the temperature and precipitation changes projected by a single GCM for their case study area and estimated as well an average decrease in streamflow of 16%–25% by the year 2050.
Similar as for Q, the average annual groundwater recharge in the Mar Menor catchment is also projected to decrease in periods p2 and p3. However, although GWR is strongly related to irrigation [28,44,45], it is still less influenced by water management (irrigation + effluents), and, in comparison to Q, more sensitive to climate change (variations in precipitation). The s1 scenario, for instance causes an average annual increase of 167% in p2, while the s4 scenario leads to a decrease of −78% in p3. Nevertheless, on average we can observe a decreasing trend in groundwater recharge for the three scenario periods (−4.1% for p1, −21.2% for p2 and −38.8% for p3).
These results are again similar to the values on changes in groundwater recharge reported in literature. Pulido-Velazquez et al. [46], for example, estimated an average decrease of 7% for 2010–2040, 16% for 2040–2070 and 30% for 2070–2100 compared to 1961–1990 for a mesoscale catchment located just north (in the Jucar basin) of our study area. D’Agostino et al. [43] projected a decrease of 21%–31% by the year 2050 for their case study area in Italy.
The average annual actual evapotranspiration in the catchment also follows the precipitation trend of climate scenarios, although the relative changes for ETa are clearly lower compared to that of the other two components Q and GWR. This is mainly because actual evapotranspiration, on the one hand decreases with decreasing water availability (less rainfall), but on the other hand increases with rising air temperatures, as projected by all 15 climate scenarios, and for all three scenario periods. According to our simulations ETa stays almost the same on average in period p1 (−0.06%) and decreases slightly in the last two scenario periods (−3.2% for p2 and −4.2% for p3). It should be also mentioned that the lower percentage changes for ETa are partly explained by its high absolute average values compared to Q and GWR.
(b) Combined scenario impacts
Depending on the assumed changes, the applied socio-economic scenarios reduce or intensify the projected climate change impacts on Q, GWR and ETa for the first scenario period (Figure 8b).
The average daily total discharge to the lagoon increases for the BAU (13.7%) and MH (7.6%) scenarios and decreases for the CRI (−16.5%) and SET (−5.8%) scenarios. The simulated changes are the result of changes in water management mainly, and only to some extent of changes in the land use patterns. An increase in population and tourism, as assumed for the two scenarios BAU and MH leads to an increase in external water transfer for drinking water supply and to higher effluent volumes released from the UWWTP to the Albujon wadi. The decreasing population and touristic activities in the CRI and SET scenarios on the contrary lead to a decrease of the released effluents and consequently to a decrease of the total inflow to the lagoon. The reduction (BAU, CRI and SET) and increase (MH) of the irrigation zone and the agricultural land have only a minor impact on Q.
In contrast to discharge, the combined impacts on groundwater recharge are clearly influenced by changes in the land use patterns. In the CRI scenario, the reduction of the irrigated area (−45%) as well as of the agricultural land (−30%) lead, in combination with climate change, to an average decrease in GWR by about 10%. The projected average reductions of GWR in the BAU and SET scenarios are, compared to that, relatively low (−1.6% and −0.7%). In the MH scenario, an increase of irrigated and agricultural area by 5% each is assumed. This leads to an increase of infiltrated irrigation water, and by that, to a slight intensification of the climate induced average trend for GWR to 10.4% on average.
The projected vague trend in actual evapotranspiration for p1 (−0.1% on average) is intensified in the BAU (−4.7%), CRI (−9.2%) and SET (−5.3%) scenarios and reversed in the MH scenario (1.1%). The reasons are similar, as for the observed changes in groundwater recharge. The assumed decrease in agricultural land reduces on average the transpiration rate of the vegetation in the catchment. In addition, the decrease of the irrigated area reduces the amount of water available for evapotranspiration. In the MH scenario, the assumed agricultural expansion (increase of agricultural land and of irrigated land) has exactly the opposite effect.
The simulated average annual spatial changes in runoff (RUN), groundwater recharge (GWR) and actual evapotranspiration (ETa) in the Mar Menor catchment (Figure 9) can be easily related to the implemented scenario specific land use changes (compare with Figure 2), especially to those concerning the Campo de Cartagena irrigation zone.
Figure 9. Maps of long-term average annual absolute spatial changes in groundwater recharge (GWR) and actual evapotranspiration (ETa) in the Mar Menor catchment showing the socio-economic impacts only as well as the combined climate and socio-economic impacts for each of the four socio-economic scenarios (BAU, CRI, MH and SET) compared to the reference conditions.
Water 07 01538 g009
The obtained changes in average annual runoff are negligible, and range between −2 and 1 mm. Therefore, maps showing these results were excluded from further analysis and are not shown in this paper.
In general, groundwater recharge and actual evapotranspiration decrease on agricultural land that was excluded from the irrigation zone and increase on areas that were included into the new irrigation zone. In addition, the conversion of agricultural land into fallow leads to further reduction in GWR and at the same time to an increase in ETa.
We can observe that under the BAU, CRI and SET scenarios groundwater recharge decreases between −5 and −22 mm and actual evapotranspiration between −150 and −297 mm on areas affected by land use changes. On areas that are located outside the reference irrigation zone and which were converted to fallow ETa increased between 5 and 25 mm. This is mainly because the vegetation cover of fallow is permanent and the plant transpiration is on average higher than on cultivated land. This also means that less water remains available for groundwater recharge, which results in a reduced GWR compared to the reference conditions. The decrease is further intensified through the absence of additional irrigation water on areas that were excluded from the irrigation zone under the three scenarios. The actual evapotranspiration on those areas is also reduced compared to the reference conditions.
In the MH scenario the irrigation zone is extended, which leads to an increase in both groundwater recharge (5–10 mm) and actual evapotranspiration (150–293 mm) on the newly formed irrigated areas. The conversion of fallow and grassland into agricultural land outside the reference irrigation zone leads to an increase in GWR (2.5–16 mm) and a decrease in ETa (−5–25 mm).
In combination with climate, many of the observed negative changes in groundwater recharge are intensified, as precipitation is projected to decrease slightly (−1.6%) for the first scenario period. Moreover, an average decrease in GWR of −0.25–5 mm can be observed over the catchment. The effect of climate change on actual evapotranspiration is visible only on areas outside the irrigation zone. In general, ETa decreases as precipitation decreases. This leads to an average reduction in ETa of −5–25 mm on areas that were not affected by land use changes, and an intensification of the trend on areas with a negative change under the socio-economic scenarios. On the other hand, most of the land with a slight positive trend under the socio-economic scenarios shows a negligible change of ±5 mm under the combined scenarios.
Unlike the climate change impacts, this part of our results practically cannot be compared with other studies, as the applied socio-economic scenarios are unique and were developed exclusively for the drainage area of the Mar Menor. Moreover, to our knowledge, there are only few studies considering land use changes in combination with climate change in the Mediterranean region (e.g., [41,42,43,46]), however in none of these catchments, except for one, water management aspects were considered. Still, some similarities to these studies can be found. In the Mancha Oriental Aquifer [46] for example, the assumed increase of irrigation area leads, similar as in the Mar Menor catchment (MH scenario) to an increase in groundwater recharge. Nevertheless, the authors conclude that climate change will put additional stress on the system in future, although, currently (and similar as in the Mar Menor catchment) there is a stabilization of the groundwater levels.

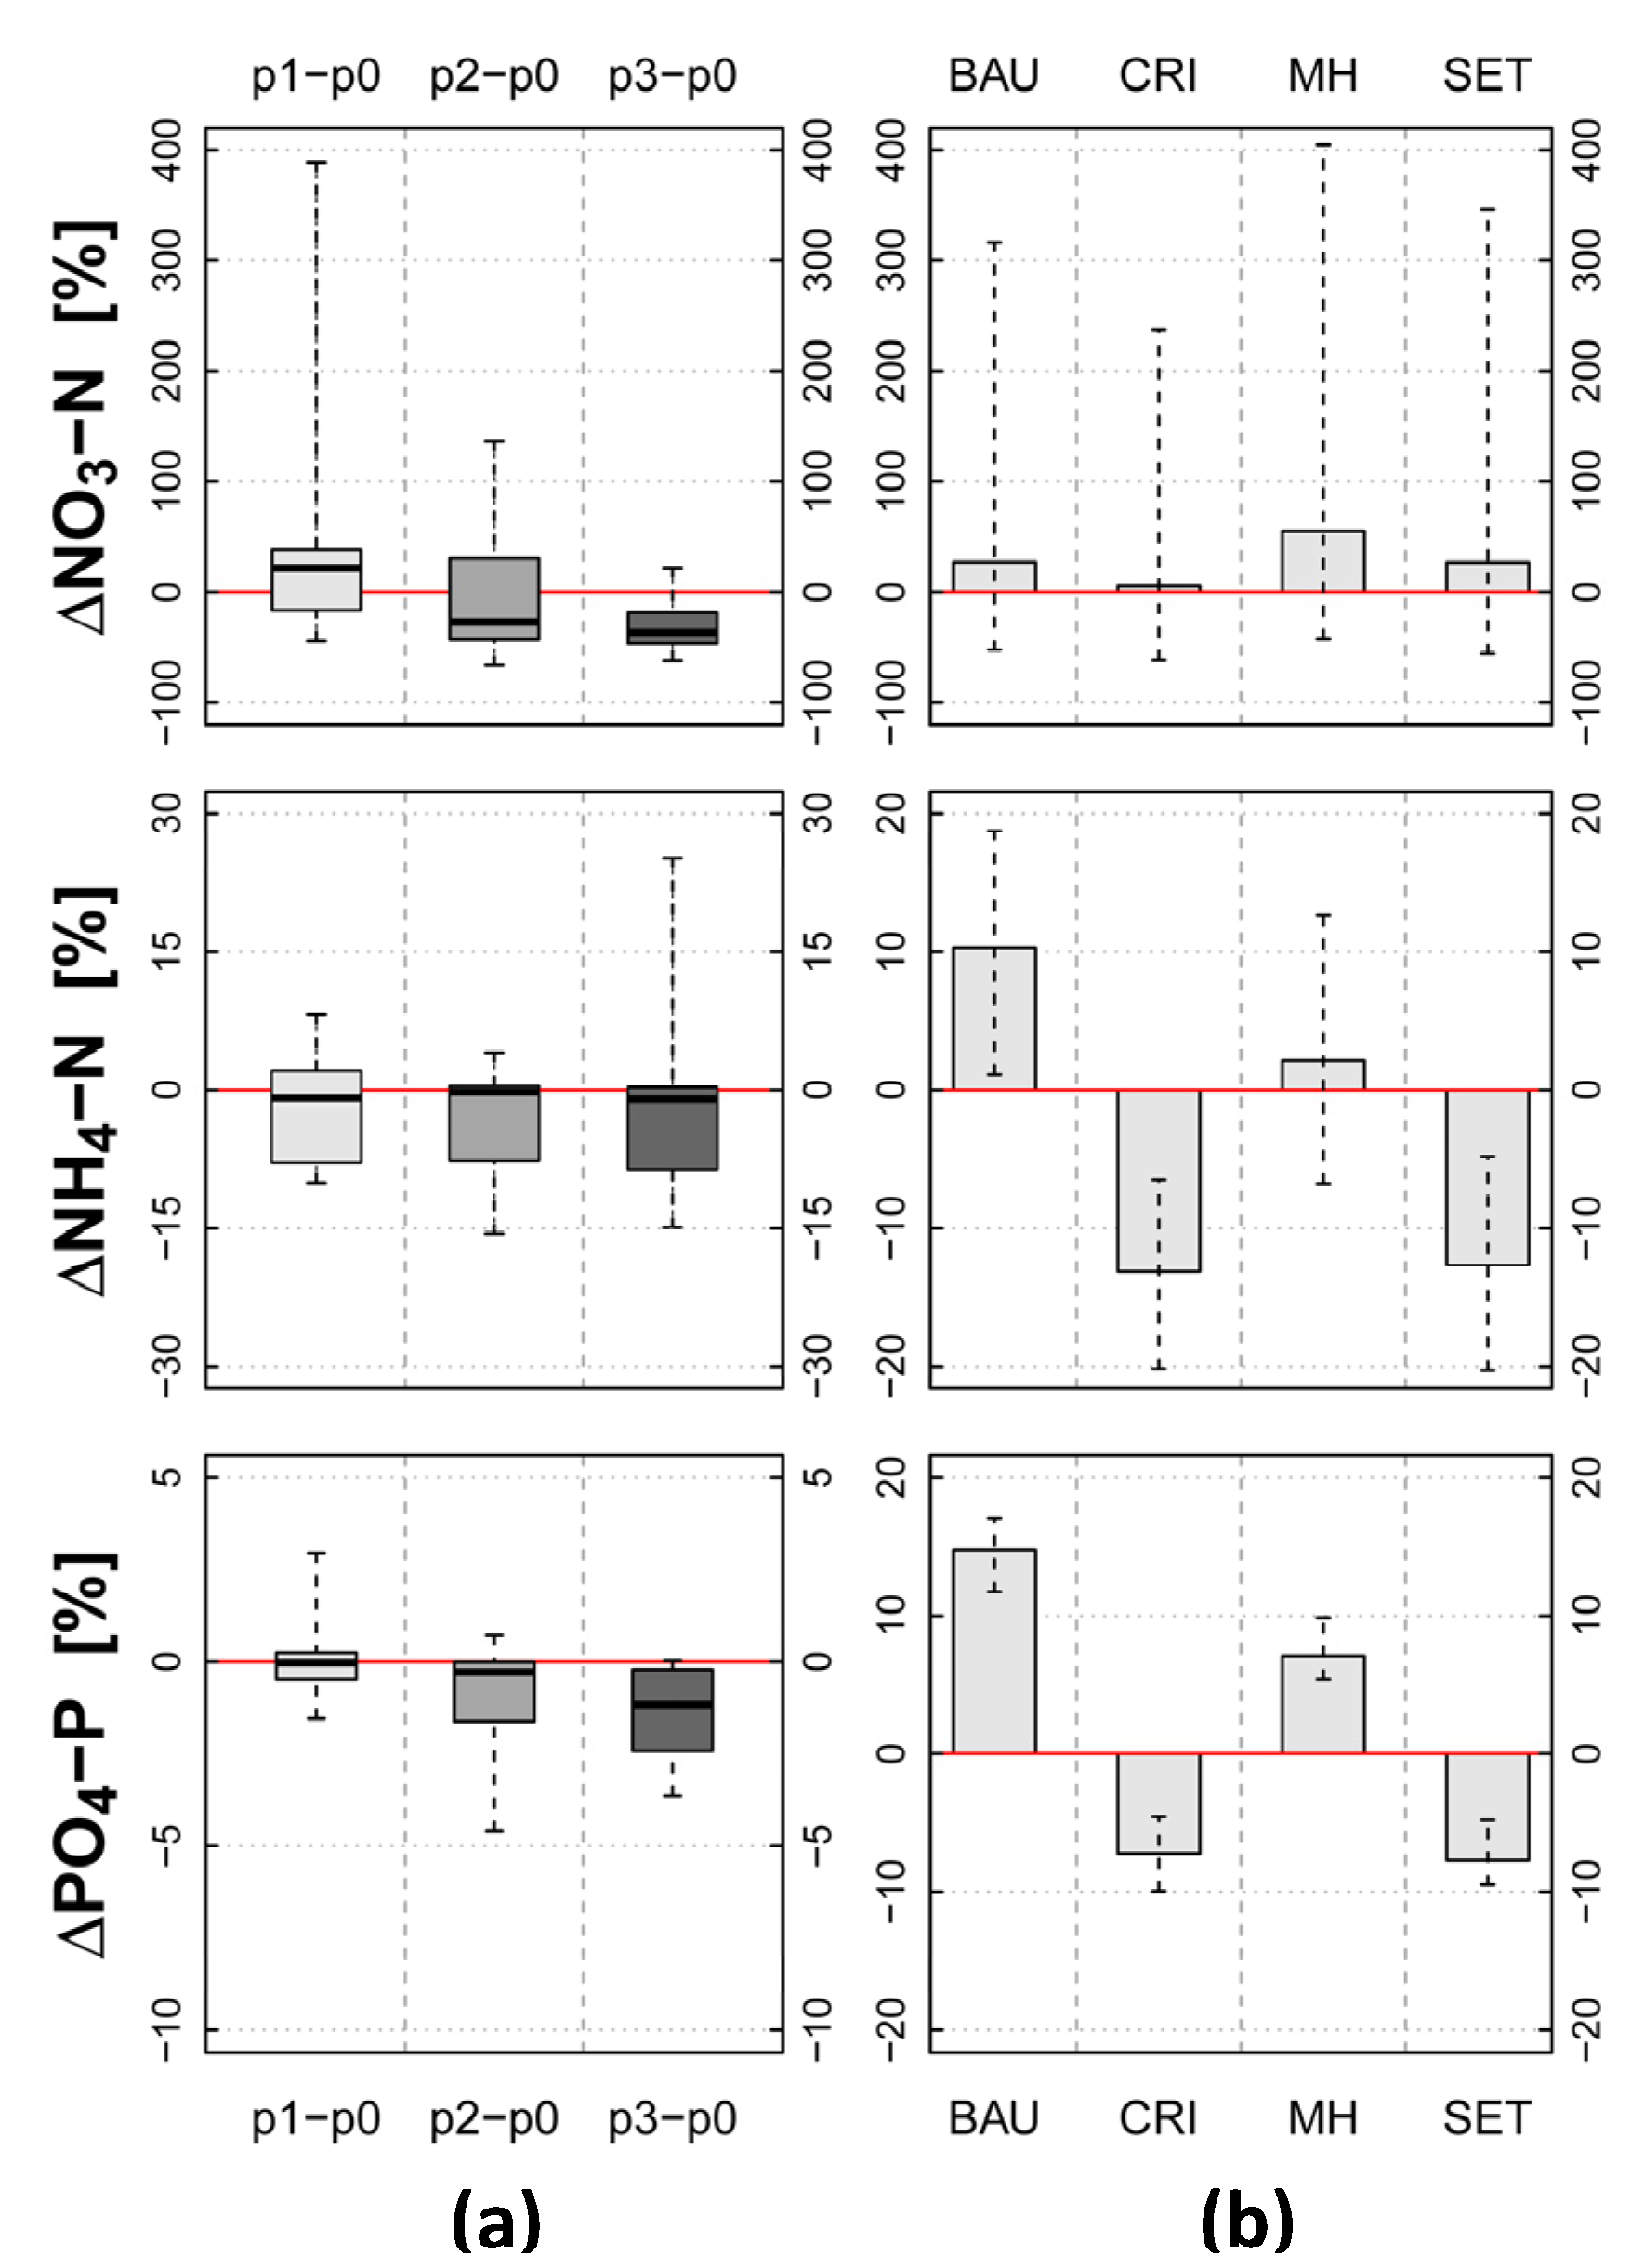
4.3.2. Changes in Major Nutrients Loads

(a) Climate change impacts
The nutrient input to the Mar Menor can be subdivided into two groups: the input dominated by diffuse pollution (NO3-N), and the input dominated by point source pollution (NH4-N and PO4-P). While diffuse pollution is highly sensitive to changes in precipitation and runoff, point source pollution is influenced by water management, and has no direct response to climate change. The results of the climate change impact assessment on nitrate nitrogen, ammonium nitrogen and phosphate phosphorus loads clearly reflect this behavior (Figure 10).
The average daily NO3-N loads in the Mar Menor catchment are projected to increase in the first period (22% for p1) and then to decrease in the two following scenario periods (−27% for p2 and −36% for p3). For the period 2011–2040, simulations driven by 10 out of 15 climate scenarios project a positive change, although only eight climate scenarios have a positive precipitation signal for this period. Moreover, the simulations driven by the s4 scenario produce an increase of 389%, which is much higher than the increase in simulated average daily discharge (surface-, subsurface runoff and groundwater contribution) for this scenario (61%). Peaks in nitrate load like this can occur, when some of the projected extreme precipitation events take place exactly after fertilization, which causes higher nutrient concentrations in the generated runoff. For the second and third scenario periods, the agreement on future projections between climate scenarios is much higher and the direction of the trend is much clearer, the simulated loads decrease.
Figure 10. Long-term average annual changes in nitrate nitrogen (NO3-N), ammonium nitrogen (NH4-N) and phosphate phosphorus (PO4-P) loads to the lagoon shown as boxplots. (a) Climate change impacts, showing results for the three future scenario periods (p1, p2 and p3) compared to the reference period (p0); (b) Combined, climate and socio-economic impacts showing results for each of the four socio-economic scenarios (BAU, CRI, MH and SET) compared to the reference conditions.
Water 07 01538 g010
In contrast to NO3-N, the range of projections for ammonium nitrogen and phosphate phosphorus loads is rather small. The changes of average daily NH4-N input to the lagoon are negligible (−0.9% for p1, −0.2% for p2 and −1.0% for p3) and so are the simulated changes for daily PO4-P loads (−0.03% for p1, −0.3% for p2 and −1.2% for p3). Besides the fact that both components originate mainly from the effluents of the UWWTP, which is not directly influenced by climate change, the positive ammonium and phosphate ions are absorbed by the negatively charged soil particles, which protect them from being washed out during heavy precipitation events.
(b) Combined scenario impacts
Similar, as for the major water flow components, the applied socio-economic scenarios reduce or intensify the projected climate change impacts on NO3-N, NH4-N and PO4-P loads to the lagoon and show similar uncertainty ranges as for the climate change impacts for the first scenario period (Figure 10b). However, unlike climate, the assumed socio-economic changes have a significant impact on both, the nutrients input from diffuse pollution (e.g., through changes in fertilization) and the input dominated by point source pollution (e.g., through changes of the effluents). The nitrate nitrogen loads for instance are strongly influenced by changes related to fertilization (amount of applied fertilizer and size of fertilized area), whereas the ammonium nitrogen and phosphate phosphorus loads are affected mostly by variations in the amount and chemical composition of the urban effluents.
In the case of nitrate nitrogen the BAU, CRI and SET scenarios reduce the projected climate change impact on the total NO3-N input to the lagoon, while the MH scenario intensifies the climate-induced change (50.1% on average). The simulated average daily NO3-N load increases the least for the CRI scenario (5.3%), in which the strongest decrease in agricultural land (−30%) and irrigated area (−45%) as well as the highest reduction of applied mineral and organic fertilizers (by −20% each) were assumed. The loads increase the most for the MH scenario (55.3%), as this scenario assumes an increase in both, agricultural land (5%) and irrigated area (5%). In the BAU and SET scenarios the NO3-N loads increase by 27.1% and 26.9%. The agricultural land and irrigated area are reduced by a similar factor in both scenarios (BAU: −14% and −22%; SET: −15% and −25%) and lead therefore to a similar change in the total NO3-N input.
According to these results the conversion of agricultural land to fallow in close proximity to the lagoon (SET scenario) does not have the desired effect of acting like a buffer strip and reducing notably the amount of generated nutrient load from the agricultural fields.
The simulated average daily ammonium nitrogen and phosphate phosphorus inputs to the Mar Menor increase in the BAU and MH scenarios, and decrease in the CRI and SET scenarios. These changes can be related to both, the assumed changes in population and tourism and changes in the agricultural practices. As population and tourism increase/decrease, the nutrients released with urban effluents into the Albujon wadi also increase/decrease. In addition, the reduction of mineral and organic fertilizers, as assumed for the CRI (only mineral), MH and SET scenarios reduce to some extent the total NH4-N and PO4-P loads in the catchment.
We can observe a stronger increase of average daily NH4-N and PO4-P loads in the BAU scenario (10.3% and 14.8%) compared to the MH (2.7% and 7.1%) scenario, although the increase of point source pollution is higher in the MH scenario. However, this increase is partly compensated by a decrease in mineral fertilization, which has not been assumed in the BAU scenario. There is not much difference between the simulated changes in NH4-N and PO4-P loads in the CRI (−13.1% and −7.2%) and SET scenarios (−12.7% and −7.7%), which was to be expected, as these two scenarios are very similar regarding the assumed changes.

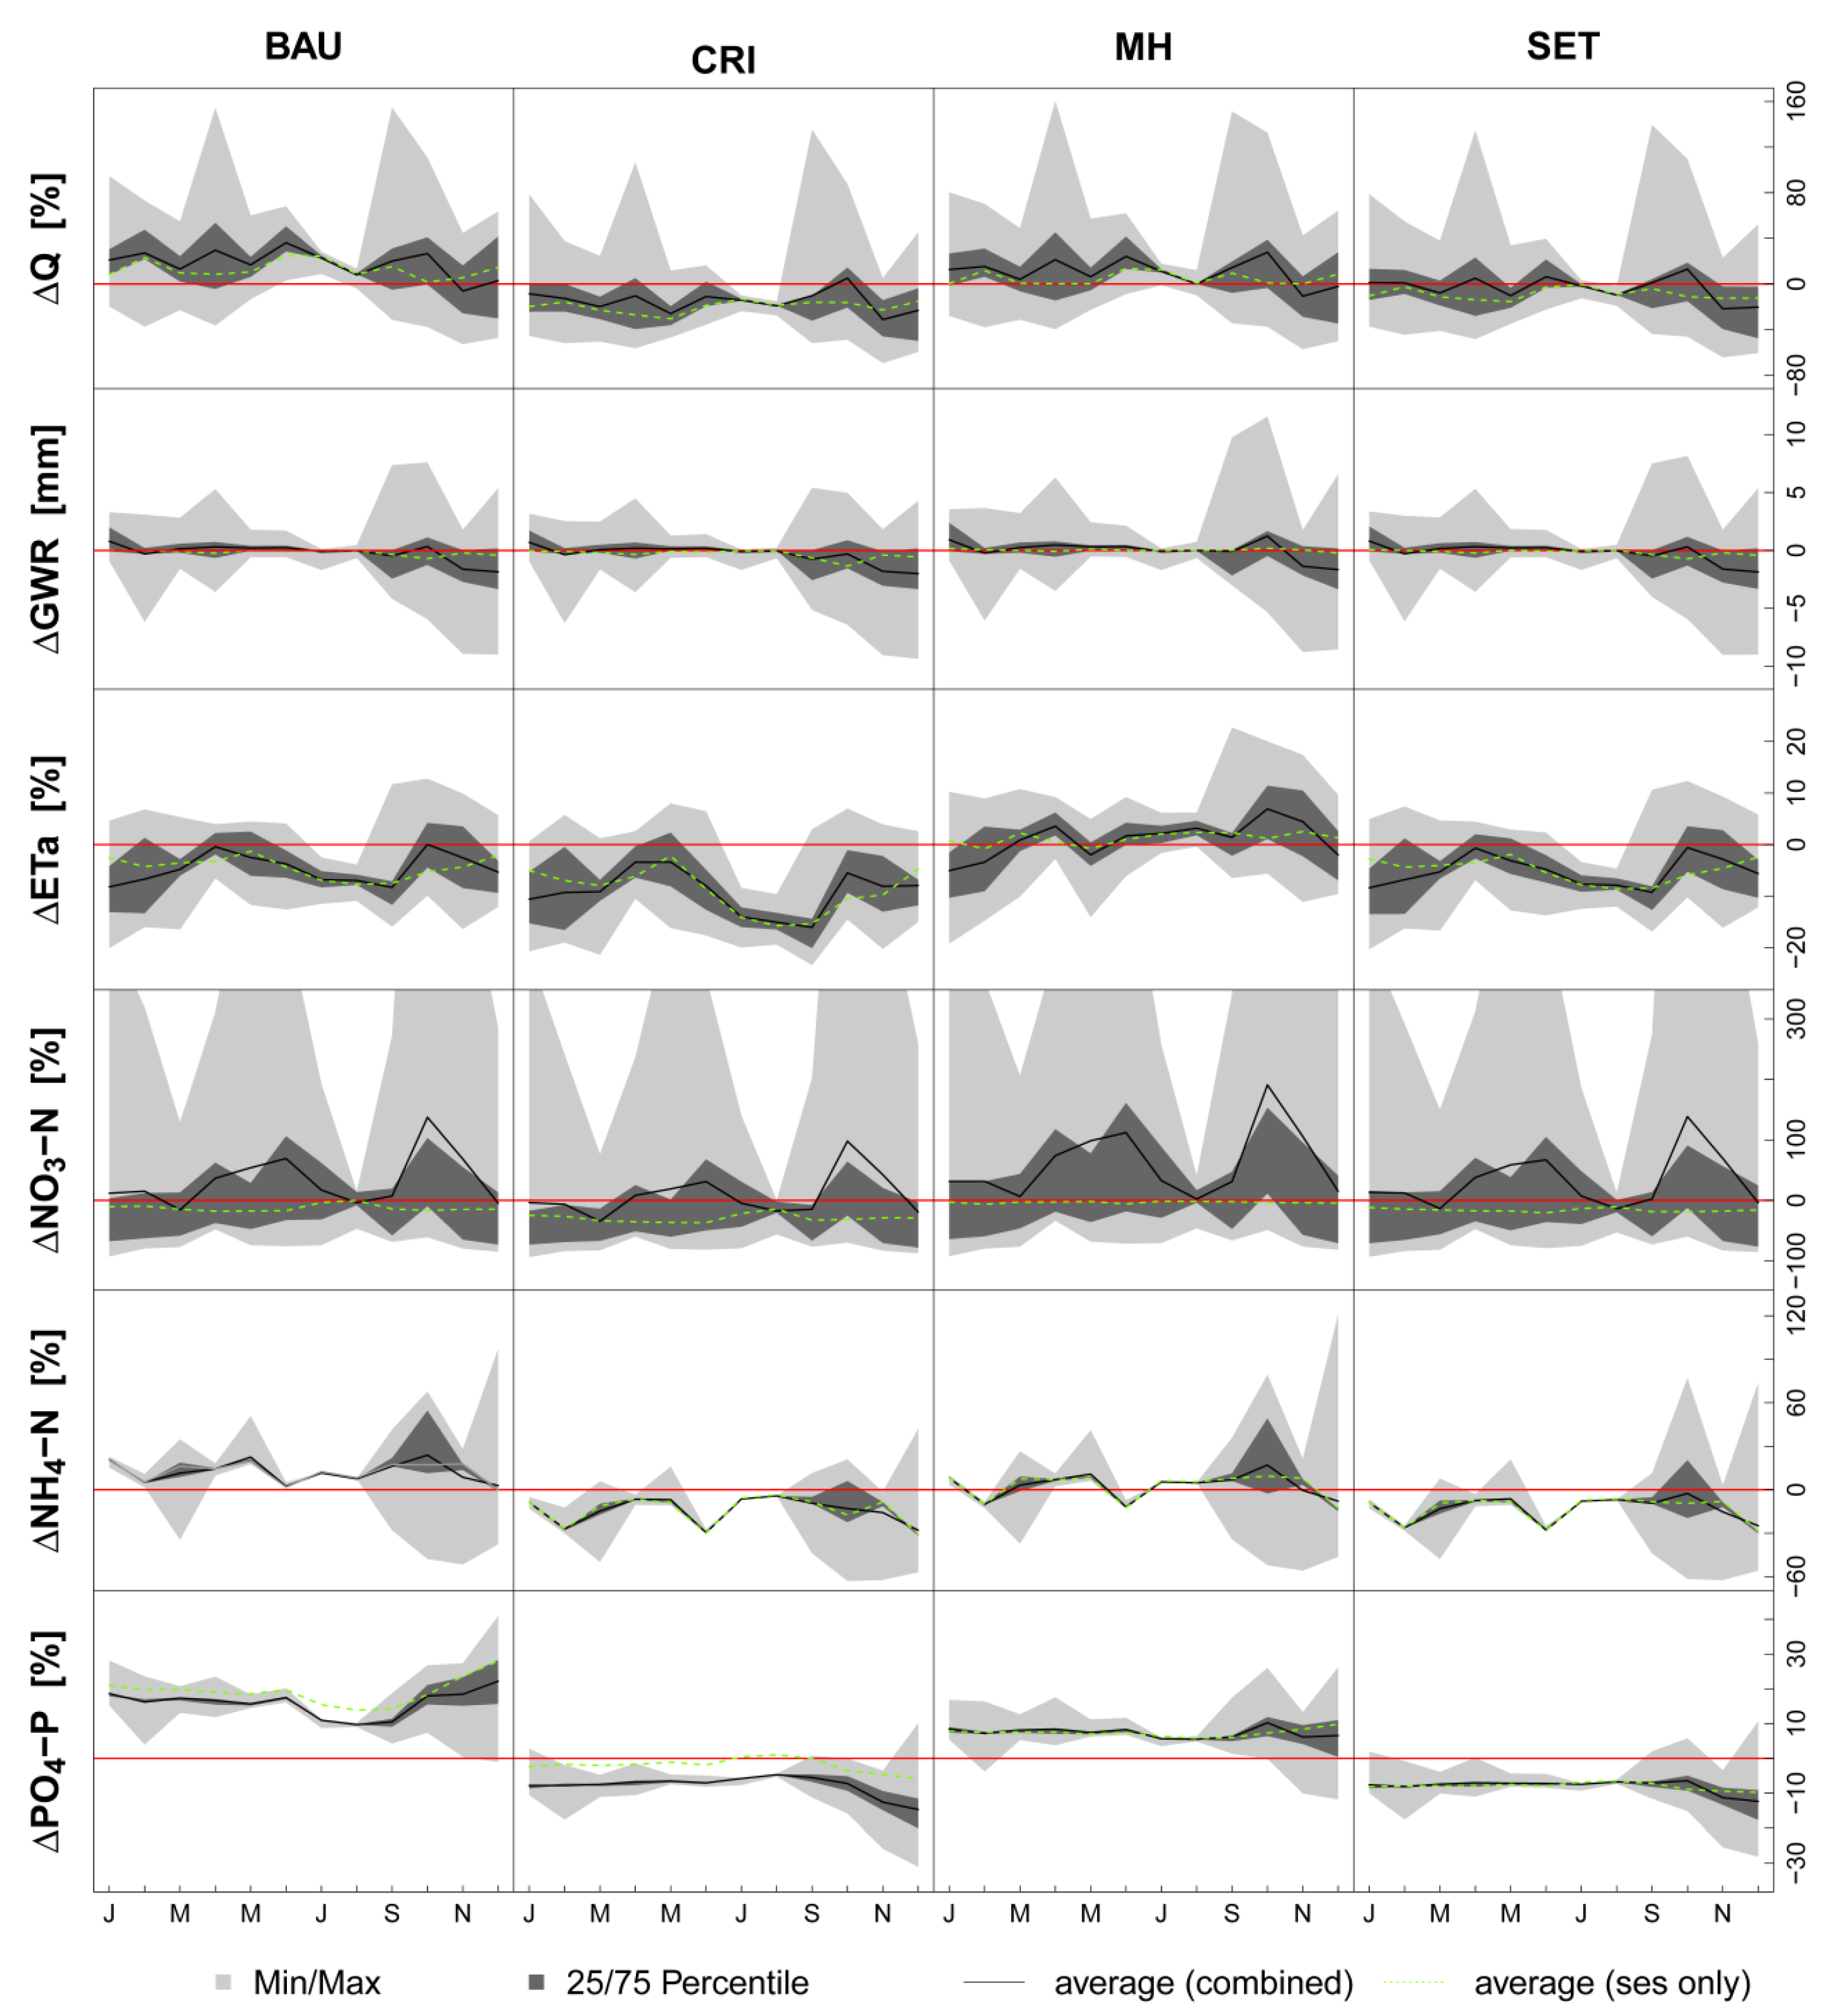
4.4. Impacts on Seasonal Dynamics

The combined impacts on seasonal dynamics of total inflow (Q), groundwater recharge (GWR), actual evapotranspiration (ETa) and nutrient loads (NO3-N, NH4-N and PO4-P) are presented in Figure 11. The graphs show the long-term average (mean of SWIM outputs driven by 15 climate scenarios) monthly combined (black lines) and socio-economic (green lines) differences between each of the four socio-economic scenarios and the reference scenario, as well as an outer uncertainty band (light grey), defined by the maximum and minimum values of all model outputs and an inner range (dark grey), representing the 25th and 75th percentiles of all results driven by the 15 climate scenarios.
Figure 11. Long-term average monthly impacts of combined climate and socio-economic changes (black line) and of socio-economic changes only (green dashed line) for each of the four socio-economic scenarios (BAU, CRI, MH and SET) on water inflow (Q), groundwater recharge (GWR), actual evapotranspiration (ETa), nitrate nitrogen (NO3-N), ammonium nitrogen (NH4-N) and phosphate phosphorus (PO4-P) shown with uncertainty bands representing the minimum and maximum values (light grey) as well as the 25th and 75th percentiles (dark grey) of the results obtained from 15 climate scenarios.
Water 07 01538 g011
On average, the combined impacts on total inflow to the lagoon show a moderate variation throughout the year for all four scenarios. The uncertainty between projections is very high during the wet periods in spring and autumn (e.g., between −40% and 161% for the MH scenario in April), which reflects the disagreement between the 15 climate scenarios on future precipitation trends. The inner uncertainty band of model outputs (25th/75th percentiles) is considerably smaller and shows nearly the same dynamics as the socio-economic impacts only. In all four scenarios, the agreement among projections is the strongest for the period between June and August, when water flow in the catchment is mainly influenced by the inputs from the UWWTP and the infiltrated irrigation water. The disagreement among scenarios is higher during the wet periods, when the natural flow, which is influenced exclusively by climate, has a large share in the total water inflow to the lagoon.
The impacts on groundwater recharge are shown in absolute values, as their relative changes are too high in some months, due to small absolute values. Similar as for Q, the uncertainty among projections is stronger for the wet periods and much lower for the dry period. The seasonal dynamics of combined changes in GWR are practically the same for all four scenarios, and the impacts of socio-economic changes only are negligible.
The changes in seasonal dynamics of actual evapotranspiration are shown in the third row (Figure 11). In the BAU, CRI and SET scenarios, the simulated changes show on average a decrease between −16% (September, CRI) and −0.4% (April, BAU). The decrease is the smallest in April and October, when some of the ENSEMBLES scenarios show a strong increase in precipitation that in turn leads to an increase in actual evapotranspiration. In the MH scenario, the applied changes in land use and irrigation act in most months against the projected climate change trends for ETa and the actual evapotranspiration increases between 1% and 7% in all months except for January, February, May and December, when climate change has still a higher impact. The uncertainty ranges do not show similar distinct peaks in wet periods as observed for Q or GWR, due to a strong dependency of ETa on irrigation in addition to climate.
The uncertainty of projected seasonal changes in total nitrate nitrogen (NO3-N) inputs to the lagoon is among the highest from the analyzed components. The maximum simulated monthly changes reach 987% in the CRI scenario and even 1550% in the MH scenario. This is the result of extreme precipitation events projected especially by one of the climate scenarios (s5). During such events high amounts of NO3-N are washed from the soils and transported via surface, subsurface and groundwater flow to the streams flowing into the Mar Menor. In the CRI scenario, in which the rate of applied mineral and organic fertilizers was reduced by 20%, the simulated NO3-N peaks are is the smallest, whereas they are the highest in the BAU and especially MH scenarios. The socio-economic impacts only correspond well to the assumed changes in land use and agricultural practices, and are nearly constant throughout the year.
The relative monthly changes in ammonium nitrogen (NH4-N) and phosphate phosphorus (PO4-P) loads follow mainly the estimated relative changes in NH4-N and PO4-P inputs from the urban effluents. Therefore, the uncertainty related to climate change is relatively low compared to the other components and mainly visible during the wet periods in autumn and spring, when, similar as for NO3-N, fertilizers surplus from the agricultural fields are washed to the lagoon. The seasonal dynamics of the combined impacts on both components however are still quite uncertain, as the annual distribution of the estimated effluent changes is based on very simple assumptions.

5. Summary and Conclusions

We assessed the combined impacts of medium term socio-economic changes and climate change on water resources in the Mar Menor catchment by applying the eco-hydrological model SWIM driven by a set of 15 regional climate scenarios, and in combination with a set of four different management settings and land use maps. Our results show that potential socio-economic changes can further intensify or reduce the climate induced impacts on total water inflow and nutrient input to the lagoon, as well as on groundwater recharge and actual evapotranspiration in the catchment in the near future (around the year 2030). This is due to the fact that the Mar Menor catchment is highly human influenced through intensive irrigation and mass tourism (significant point source pollution).
The climate change signals of the 15 applied climate scenarios suggest a warmer and dryer future for the Mar Menor catchment, which in turn causes a decreasing trend in all six analyzed components (Q, GWR, ETa, NO3-N, NH4-N and PO4-P) by the end of the century. The projected changes in precipitation are quite mixed for the first scenario period (2011–2040), and so are the simulated impacts on all investigated components. Looking at outputs averaged over 15 scenarios, we can see that NO3-N loads show some increase, and all other variables remain practically unchanged. The projected negative trends of potential climate change impacts on water resources become pronounced in the second (2041–2070) and third (2071–2098) scenario periods, and also the uncertainty of the results increases with time. It is worth mentioning that NH4-N and PO4-P loads in the Mar Menor catchment are less vulnerable to changes in precipitation and show considerably lower climate change impacts compared with the other components. The reason is that they are strongly human influenced and depend mainly on changes in the released urban effluents. As intense and strong precipitation events are likely to increase in future [6] the outputs of model simulations driven by some of the 15 climate scenarios reach in these cases (Q and NO3-N in p1, GWR in p2) extremely high maximum values. The combination of climate change and socio-economic scenarios revealed that the two least desirable scenarios for the near future from the economic point of view, the crisis and set-aside scenarios, could be beneficial for the lagoon and its catchment from the ecological point of view, whereas the opposite is the case for the business as usual and the managed horizons scenarios.
The CRI and SET scenarios assume a strong reduction of the agricultural land, along with a reduction of the applied fertilizers. These measures reduce drastically the nutrient load from diffuse sources, and by that the nitrate nitrogen input to the Mar Menor. In addition, the assumed decrease in population and tourism reduces the nutrient contribution from point sources (UWWTP) and decreases further the nutrient loads to the lagoon.
Being concerned about the diffuse pollution only (NO3-N), the business as usual scenario can be also awarded an environmental friendly scenario with a positive effect on NO3-N input to the lagoon. However, the assumption of agricultural reduction in the BAU scenario is accompanied by an assumed increase in tourism, which leads to a significant increase in ammonium nitrogen and phosphate phosphorus loads.
The population and tourism changes in the managed-horizons scenario are less dramatic regarding point source pollution (lower increase compared to BAU), but instead rather problematic with regard to diffuse pollution. The MH scenario is the only scenario assuming an intensification of the current agricultural practices, which contributes significantly to a NO3-N enrichment in the catchment.
Apart from their impacts on nutrient loads, the socio-economic scenarios also influence water inflow to the lagoon as well as groundwater recharge and actual evapotranspiration in the catchment. It must be noted that the reduction of irrigation and urban effluents in the CRI and SET scenarios, leads not only to a reduction of diffuse and point source pollution but also to a decrease in average daily discharge to the Mar Menor, which is not necessarily beneficial for the lagoon. A decrease in water inflow can cause changes in the salinity level of the lagoon, which in turn may lead to shifts in the lagoon’s biological community. Furthermore, the conversion of agricultural land to a vegetation type with a higher annual transpiration rate (BAU, CRI and SET scenarios) leads, on average, to lower groundwater recharge rates in the catchment. This effect is enhanced when land is excluded from the irrigation zone and might, on the long-term, lead to a problematic drop of the phreatic levels in the catchment.
The results of this study have shown that certain measures can reduce the negative impacts caused by climate change in the near future, while others are less recommendable as they would intensify the existing problems in the catchment. It should be kept in mind that the assumed future changes in water supply from the Tagus-Segura IBT, which is one of the key factors regarding agricultural productivity and touristic development in the region, are extremely uncertain. The amount of water transferred to the catchment and the allocation of this water to the different sectors (agriculture, domestic use, etc.) depends, of course, on future climatic conditions but also, and very strongly on political decisions that are practically impossible to predict. Therefore, and keeping in mind other sources of uncertainty (e.g., one emission scenario only, static socio-economic scenarios, fixed management and land use changes, etc.) our results should always be seen in the context of the applied methodology in this study.
The described model outputs of SWIM were used as input in a carry on study [47], which first analyzed the physiochemical and biological changes in the Mar Menor and then assessed their potential implications for the ecological status of the lagoon and the ecosystem services it supports. Furthermore, they are used, in combination with the results of other scientific disciplines (biology, sociology, legal science and others), to develop a framework for an integrated management of the lagoon under the context of climate change [48].
Although the results of this study have already found reasonable applications, they can be improved and extended. For example, coastal marshes could be implemented into the model, in order to investigate their effect on reducing the nutrient input to the lagoon. Moreover, assumptions on the potential changes in water supply from the Tagus-Segura IBT could be based on a hydrological impact study on the capacities and future operations of relevant reservoirs in the Tagus River Basin. This would allow implementing water management changes in a dynamic way that is scientifically underpinned and linked directly to climate change. Besides, a land use scenario assuming dry-crop farming instead of the intensively irrigated horticulture, and an assessment of its implications for the catchment and the lagoon, is recommended, as such scenario could be become unavoidable in case of a strong decrease in the supplied water from the IBT.

Acknowledgments

This research was performed in the framework of the LAGOONS project, which was funded by the European Commission 7th Framework Programme (EU FP7) under grant agreement No. 283157. The climate scenario data used in this study were produced in the EU FP6 Integrated Project ENSEMBLES (No. 505539). The applied land use maps were created by Stein Turtumøygard from the Norwegian Institute for Agricultural and Environmental Research. The authors would also like to acknowledge the LAGOONS partners from the University of Dundee for their work in developing the framework and methodologies that were used to create the qualitative socio-economic scenarios as well as the LAGOONS case study partners from the University of Murcia for providing data for the model setup as well as for organizing and running the stakeholder workshops in the Mar Menor catchment. The authors also thank Vanessa Wörner for her support in data management.

Author Contributions

The methodology described in this paper was planned and designed by all authors. The model setup, calibration and validation, as well as the scenario simulations were performed by Anastassi Stefanova. The analysis and interpretation of climate scenario evaluation and model outputs was done by all authors. The manuscript, including all text, tables and figures was prepared by Anastassi Stefanova and supervised by Valentina Krysanova.

Conflicts of Interest

The authors declare no conflict of interest.

References

  1. Lionello, P.; Malanotte-Rizzoli, P.; Boscolo, R. Mediterranean climate variability over the last centuries: A review. In The Mediterranean Climate: An Overview of the Main Characteristics and Issues; Elsevier: Amsterdam, The Netherlands, 2006. [Google Scholar]
  2. Giorgi, F. Climate change hot-spots. Geophys. Res. Lett. 2006, 33. [Google Scholar] [CrossRef]
  3. Diffenbaugh, N.S.; Giorgi, F. Climate change hotspots in the CMIP5 global model ensemble. Clim. Chang. 2012, 114, 813–822. [Google Scholar]
  4. Van Oldenborgh, G.J.; Collins, M.; Arblaster, J.; Christensen, J.H.; Marotzke, J.; Power, S.B.; Rummukainen, M.; Zhou, T. Annex I: Atlas of global and regional climate projections. In Climate Change 2013: The Physical Science Basis. Contribution of Working Group I to the Fifth Assessment Report of the Intergovernmental Panel on Climate Change; Stocker, T.F., Qin, D., Plattner, G.K., Tignor, M., Allen, S.K., Boschung, J., Nauels, A., Xia, Y., Bex, V., Midgley, P.M., Eds.; Cambridge University Press: Cambridge, UK, 2013. [Google Scholar]
  5. Giannakopoulos, C.; Bindi, M.; Moriondo, M.; LeSager, P.; Tin, T. Climate Change impacts in the Mediterranean resulting from a 2 °C global temperature rise. In WWF Report for a Living Planet; The Global Conservation Organization: Gland, Switzerland, 2005. [Google Scholar]
  6. Giorgi, F.; Lionello, P. Climate change projections for the Mediterranean region. Glob. Planet. Chang. 2008, 63, 90–104. [Google Scholar] [CrossRef]
  7. Planton, S.; Lionello, P.; Artale, V.; Aznar, R.; Carrillo, A.; Colin, J.; Congedi, L.; Dubois, C.; Elizalde, A.; Gualdi, S.; et al. The climate of the Mediterranean region in future climate projections. In The Climate of the Mediterranean Region; Lionello, P., Ed.; Elsevier: Amsterdam, The Netherlands, 2012. [Google Scholar]
  8. Gualdi, S.; Somot, S.; Li, L.; Artale, V.; Adani, M.; Bellucci, A.; Braun, A.; Calmanti, S.; Carillo, A.; Dell’Aquila, A.; et al. The CIRCE simulations: Regional climate change projections with realistic representation of the Mediterranean Sea. Bull. Am. Meteor. Soc. 2013, 94, 65–81. [Google Scholar] [CrossRef]
  9. Navara, A.; Tubiana, L. Regional assessment of climate change in the Mediterranean. In Advances in Global Change Research; Springer: Heidelberg, Germany, 2013; Volume 3. [Google Scholar]
  10. Kovats, R.S.; Valentini, R.; Bouwer, L.M.; Georgopoulou, E.; Jacob, D.; Martin, E.; Rounsevell, M.; Soussana, J.F. Europe. In Climate Change 2014: Impacts, Adaptation, and Vulnerability. Part B: Regional Aspects. Contribution of Working Group II to the Fifth Assessment Report of the Intergovernmental Panel on Climate Change; Barros, V.R., Field, C.B., Dokken, D.J., Mastrandrea, M.D., Mach, K.J., Bilir, T.E., Chatterjee, M., Ebi, K.L., Estrada, Y.O., Genova, R.C., Eds.; Cambridge University Press: Cambridge, UK, 2013; pp. 1267–1326. [Google Scholar]
  11. Ulbrich, U.; Lionello, P.; Belušić, D.; Jacobeit, J.; Knippertz, P.; Kuglitsch, F.G.; Leckebusch, G.C.; Luterbacher, J.; Maugeri, M.; Maheras, P.; et al. 5–Climate of the Mediterranean: Synoptic Patterns, Temperature, Precipitation, Winds, and Their Extremes. In The Climate of the Mediterranean Region; Elsevier: Oxford, UK, 2012; pp. 301–346. [Google Scholar]
  12. Atlas Climático Ibérico—Iberian Climate Atlas; Agencia Estatal de Meteorología (AEMET): Madrid, Spain, 2011; (In Spanish, Portuguese and English).
  13. Water Resources across Europe—Confronting Water Scarcity and Drought; Report No 2/2009; European Environment Agency: Copenhagen, Denmark, 2009.
  14. Ruiz, M.; Velasco, J. Nutrient bioaccumulation in Phragmites australis: Management tool for reduction of pollution in the Mar Menor. Water Air Soil Pollut. 2009, 205, 173–185. [Google Scholar] [CrossRef]
  15. LAGOONS 2012: Factsheet Mar Menor, Socio-Economic and Policies Issues. Available online: http://lagoons.web.ua.pt (accessed on 6 January 2015).
  16. Comunidad de Regantes Campo de Cartagena (CRCC). Available online: http://www.crcc.es/informacion-general/informacion-c-r-c-c/ (accessed on 7 January 2015).
  17. Velasco, J.; Lloret, J.; Millán, A.; Marín, A.; Barahona, J.; Abellán, P.; Sánchez-Fernández, D. Nutrient and particulate inputs into the Mar Menor lagoon (SE Spain) from an intensive agricultural watershed. Water Air Soil Pollut. 2006, 176, 37–56. [Google Scholar] [CrossRef]
  18. García-Pintado, J.; Martínez-Mena, M.; Barberá, G.G.; Albaladejo, J.; Castillo, V.M. Anthropogenic nutrient sources and loads from a Mediterranean catchment into a coastal lagoon: Mar Menor, Spain. Sci. Total Environ. 2007, 373, 220–239. [Google Scholar] [CrossRef]
  19. Gilaber, J. Seasonal plankton dynamics in a Mediterranean hypersaline coastal lagoon: The Mar Menor. J. Plankton Res. 2001, 23, 207–217. [Google Scholar] [CrossRef]
  20. Lloret, J.; Marin, A.; Marin-Guirao, L.; Velasco, J. Changes in macrophytes distribution in a hypersaline coastal lagoon associated with the development of intensively irrigated agriculture. Ocean Coast. Manag. 2005, 48, 828–842. [Google Scholar] [CrossRef]
  21. Lloret, J.; Marín, A. The contribution of benthic macrofauna to the nutrient filter in coastal lagoons. Mar. Pollut. Bull. 2011, 62, 2732–2740. [Google Scholar] [CrossRef] [PubMed]
  22. Lloret, J.; Marin, A.; Marin-Guirao, L. Is coastal lagoon eutrophication likely to be aggravated by global climate change? Estuar. Coast. Shelf Sci. 2008, 78, 403–412. [Google Scholar] [CrossRef]
  23. Kilsby, C.G.; Tellier, S.S.; Fowler, H.J.; Howels, T.R. Hydrological impacts of climate change on the Tejo and Guadian Rivers. Hydrol. Earth Syst. Sci. 2007, 11, 1175–1189. [Google Scholar] [CrossRef]
  24. Mariotti, A.; Zeng, N.; Yoon, J.H.; Artale, V.; Navarra, A.; Alpert, P.; Li, L.Z.X. Mediterranean water cycle changes: Transition to drier 21st century conditions in observations and CMIP3 simulations. Environ. Res. Lett. 2008, 3. [Google Scholar] [CrossRef]
  25. Estrela, T.; Pérez-Martin, M.A.; Vargas, E. Impacts of climate change on water resources in Spain. Hydrol. Sci. J. 2012, 57, 1154–1167. [Google Scholar] [CrossRef]
  26. Mariotti, A.; Pan, Y.; Zeng, N.; Alessandri, A. Long-term climate change in the Mediterranean region in the midst of decadal variability. Clim. Dyn. 2015, 44, 1437–1456. [Google Scholar] [CrossRef]
  27. Baker, N.C.; Huang, H.P. A Comparative Study of precipitation and Evaporation between CMIP3 and CMIP5 Climate Model Ensembles in Semiarid Regions. J. Clim. 2014, 27, 3731–3749. [Google Scholar] [CrossRef]
  28. Krysanova, V.; Wechsung, F.; Arnold, J.; Srinivasan, R.; Williams, J. SWIM (Soil and Water Integrated Model): User Manual; PIK Report No. 69; Potsdam Institute for Climate Impact Research: Potsdam, Germany, 2000. [Google Scholar]
  29. Van der Linden, P.; Mitchell, J.F.B. ENSEMBLES: Climate Change and Its Impacts: Summary of Research and Results from the ENSEMBLES Project; Met Office Hadley Centre: Exeter, UK, 2009; p. 160. [Google Scholar]
  30. Poch-Massegú, R.; Jiménez-Martínez, J.; Wallis, K.J.; Ramírez de Cartagena, F.; Candela, L. Irrigation return flow and nitrate leaching under different crops and irrigation methods in Western Mediterranean weather conditions. Agric. Water Manag. 2014, 134, 1–13. [Google Scholar] [CrossRef]
  31. Ad-hoc-Arbeitsgruppe Boden. Bodenkundliche Kartieranleitung, 5th ed.; Bundesanstalt für Geowissenschaften und Rohstoffe in Zusammenarbeit mit den Staatlichen Geologischen Diensten: Hannover, Germany, 2005; p. 438. (In German) [Google Scholar]
  32. Stefanova, A.; Krysanova, V.; Hesse, C.; Lillebø, A. Climate change impact assessment on water inflow to a coastal lagoon: Ria de Aveiro watershed, Portugal. Hydrol. Sci. J. 2014. [Google Scholar] [CrossRef]
  33. Hesse, C.; Krysanova, V.; Stefanova, A.; Bielecka, M.; Domnin, D. Assessment of climate change impacts on water quantity and quality of the multi-river Vistula Lagoon catchment. Hydrol. Sci. J. 2014. [Google Scholar] [CrossRef]
  34. Teutschbein, C.; Seibert, J. Regional Climate Models for Hydrological Impact Studies at the Catchment Scale: A Review of Recent Modeling Strategies. Geogr. Compass 2010, 4, 834–860. [Google Scholar] [CrossRef] [Green Version]
  35. Christensen, J.H.; Hewitson, B.; Busuioc, A.; Chen, A.; Gao, X.; Held, I.; Jones, R.; Kolli, R.K.; Kwon, W.T.; Laprise, R.; et al. Regional Climate Projections. In Climate Change 2007: The Physical Science Basis. Contribution of Working Group I to the Fourth Assessment Report of the Intergovernmental Panel on Climate Change; Solomon, S., Qin, D., Manning, M., Chen, Z., Marquis, M., Averyt, K.B., Tignor, M., Miller, H.L, Eds.; Cambridge University Press: Cambridge, UK, 2007. [Google Scholar]
  36. Giorgi, F.; Hewitson, B.; Christensen, J.H.; Hulme, M.; von Storch, H.; Whetton, P.; Jones, R.; Mearns, L.; Fu, C. Regional Climate Information—Evaluation and Projections, Chapter 10, Climate Change 2001: The Scientific Basis. In Contribution of Working group I to the Third Assessment Report of the Intergovernmental Panel on Climate Change; Cambridge University Press: Cambridge, UK, 2001; pp. 583–638. [Google Scholar]
  37. Baggett, S.; Gooch, G.D. Activities Report: Report on Raising Public Participation and Awareness Including Design of Uptake and Capacity Building Activities; LAGOONS Report D4.1; European Commission: Brussels, Belgium, 2014; p. 61. [Google Scholar]
  38. Baggett, S.; Gooch, G.D. Final Scenarios; LAGOONS Report D4.2; European Commission: Brussels, Belgium, 2014; p. 45. [Google Scholar]
  39. Salas, F.; Teixeira, H.; Marcos, C.; Marques, J.C.; Pérez-Ruzafa, A. Applicability of the trophic index TRIX in two transitional ecosystems: The Mar Menor lagoon (Spain) and the Mondego estuary (Portugal). ICES J. Mar. Sci. 2008, 65, 1442–1448. [Google Scholar] [CrossRef]
  40. Marin-Perez, R.; García-Pintado, J.; Gómez, A.S. A Real-Time Measurement System for Long-Life Flood, Monitoring and Warning Applications. Sensors 2012, 12, 4213–4236. [Google Scholar] [CrossRef] [PubMed]
  41. Morán-Tejeda, E.; Zabalza, J.; Rahman, K.; Gago-Silva, A.; López-Moreno, J.I.; Vincente-Serrano, S.; Lehmann, A.; Tague, C.L.; Benistn, M. Hydrological impacts of climate and land-use changes in a mountain watershed: Uncertainty estimation based on model comparison. Ecohydrology 2014. [Google Scholar] [CrossRef]
  42. Molina-Navarro, E.; Trolle, D.; Martínez-Pérez, S.; Sastre-Merlín, A.; Jeppesen, E. Hydrological and water quality impact assessment of a Mediterranean limno-reservoir under climate change and land use management scenarios. J. Hydrol. 2014, 509, 354–366. [Google Scholar] [CrossRef]
  43. D’Ágostino, D.R.; Trisorio, L.G.; Lamaddalena, N.; Ragab, R. Assessing the results of scenarios of climate and land use changes on the hydrology of an Italian catchment: Modelling study. Hydrol. Process. 2010, 24, 2693–2704. [Google Scholar] [CrossRef]
  44. Álvarez-Rogel, J.; Jiménez-Cárceles, F.; Egea Nicolás, C. Phosphorus and nitrogen content in the water of a coastal wetland in the Mar Menor Lagoon (SE Spain): Relationships with effluents from urban and agricultural areas. Water Air Soil Pollut. 2006, 173, 21–38. [Google Scholar] [CrossRef]
  45. Baudron, P.; Barbecot, F.; García Aróstegui, J.L.; Leduc, C.; Travi, Y.; Martinez-Vicente, D. Impacts of human activities on recharge in a multi-layered semiarid aquifer (Campo de Cartagena, SE Spain). Hydrol. Process. 2013, 28, 2223–2236. [Google Scholar] [CrossRef]
  46. Pulido-Velazquez, M.; Peña-Haro, S.; Garcia-Prats, A.; Mocholi-Almudever, A.F.; Henriquez-Dole, L.; Macian-Sorribes, H.; Lopez-Nicolas, A. Integrated assessment of the impact of climate and land use changes on groundwater quantity and quality in Mancha Oriental (Spain). Hydrol. Earth Syst. Sci. 2014, 11, 10319–10364. [Google Scholar] [CrossRef]
  47. Results of Combined Climate and Ecosystem Processes: Report Describing Results of Combined Climate and Ecosystem Processes; LAGOONS Report D6.3; European Commission: Brussels, Belgium, 2014; p. 139.
  48. Lillebø, A.; Stålnacke, P.; Gooch, G.D. Coastal Lagoons in Europe: Integrated Water Resource Strategies; International Water Association: London, UK, 2015; p. 250. [Google Scholar]

