Article

Local Perception of Risk to Livelihoods in the Semi-Arid Landscape of Southern Africa

1
Department of Geography, University of Florida, 3141 Turlington Hall P.O. Box 117315, Gainesville, FL 32611, USA
2
Center for African Studies, University of Florida, 427 Grinter Hall P.O. Box 115560, Gainesville, FL 32611,USA
*
Author to whom correspondence should be addressed.
Land 2013, 2(2), 225-251; https://doi.org/10.3390/land2020225
Submission received: 24 March 2013 / Revised: 3 May 2013 / Accepted: 6 May 2013 / Published: 15 May 2013

Abstract

:
The United Nations and Intergovernmental Panel on Climate Change deem many regions of southern Africa as vulnerable landscapes due to changing climatic regimes, ecological conditions, and low adaptive capacity. Typically in highly vulnerable regions, multiple livelihood strategies are employed to enable sustainable development. In Botswana, livelihood strategies have diversified over time to include tourism and other non-agricultural activities. While such diversification and development have been studied, little is known about how locals perceive livelihood risks. This article analyzes perceptions of risk through a risk hazards framework. During the summer of 2010, 330 surveys were completed within seven villages in northern Botswana and the Caprivi Strip of Namibia. During the survey respondents were asked to list the biggest threats/challenges to their livelihoods. Responses were grouped into categories of risk according to the capital assets on which livelihoods depend: natural, physical, financial, human, and social. A risk mapping procedure was utilized, for which indices of severity, incidence, and risk were calculated. It is hypothesized that people’s perception of risk is directly dependent on environmental conditions and employment status of the household. Results indicate that problems related to natural and financial assets are the greatest source of risk to livelihoods. Furthermore, flood, drought, and other measures of climate variability are perceived as influential, typically negatively, to livelihood strategies.

1. Introduction

Patterns of human-environment interactions vary globally as a result of complex and intermingled land use strategies, ecological processes, government policies, and a plethora of other social, cultural, and environmental variables [1]. In rural and/or underdeveloped regions of the world, complex human-environment interactions have led to diversification of livelihood strategies in order to develop sustainably or to mitigate the effects of shocks and stresses [2]. Such diversification, especially in sub-Saharan Africa, involves both pastoral and non-pastoral activities including tourism and crafting [3,4,5,6]. With such diverse socioeconomic activities, which depend largely on the natural resources, shocks and stresses to the system can cause great distress to ecological, social, and economic conditions [2]. Rural and underdeveloped regions are especially vulnerable to such shocks due to dependence on natural resources and minimal means of risk management or mitigation.
Carney [7] described a sustainable livelihood as one that can cope and recover from stresses and shocks while maintaining or enhancing its capabilities and assets, both now and in the future, without diminishing the natural resource base. This definition links closely with the themes commonly emerging from social-ecological system studies on resilience. Walker [8] defined resilience as the capacity of a system to experience shocks while retaining essentially the same function, structure, and identity. Shocks and stresses are similar in that they can result in adverse livelihood and socioeconomic conditions, but they differ in their temporal scale. Shocks refer to the abrupt changes to a system [2,9]. Examples of common shocks include: disease (animal or human), conflict, drought, flood, and market fluctuations [10,11,12]. Such extreme events are said to have a greater adverse effect on social, economic, and environmental sustainability than stresses since they destroy assets [13,14]. Sallu et al. [2] refers to stresses as the enduring shifts of a landscape. Stresses can be further understood as the specific factors that adversely affect the physiology or function of a system. Examples include alterations to seasonal patterns or amounts of precipitation, changes in the trends of environmental conditions, and policy changes [10,15]. Climate change and variability are the most well noted shocks or stresses to a landscape, but varying climates are rarely the only stressor in a system [16,17,18,19]. Complex human-environment systems, like those in rural/underdeveloped landscapes, involve a variety of environmental variables, socioeconomic conditions, and stresses/shocks [20]. Studies of these systems should strive to highlight the scale, role, and interaction of stresses/shocks as they manifest via ecological, social, cultural, economic, and livelihood changes [20]. Whether the term be stress, stressor, shock, or hazard they all reflect threats to livelihoods [21].
According to Ellis [13], a livelihood comprises the assets, activities, and access to resources and services that together determine the living of an individual or a household. Accordingly, livelihood strategies do not just encompass income generating activities but also the environmental condition, culture, infrastructure, and social services around or accessible to the household [2,13]. These are commonly referred to as livelihood assets. Such assets are key components of the sustainable livelihood framework, as they are the foundation on which livelihoods are built [22]. Livelihood assets are divided into five core types of capital: human, social, physical, natural, and financial [22]. No single asset on its own is sufficient to achieve development in rural landscapes. For example, social capital involves access to government support, schools, hospitals, and other facilities or programs; whereas financial capital includes employment, market access, and financial aspects necessary for a sustainable livelihood. While traditional studies on human-environment interactions have focused on the direct relationship between landscape patterns and the aforementioned variables (e.g., [23,24,25]), understanding what people perceive as the biggest risk to their livelihood also holds great value. It is the totality of livelihood assets that drives overall livelihood outcomes, but human perception of risks to their livelihoods has been underexplored and yet influences individual and community decision-making, as well as government policy.
Risk is undesirable. It refers to the exposure to potentially unfavorable conditions or circumstances that can result in economic, cultural, or physical loss. People’s perception of risk varies across individuals, households, and communities [26]. Residents in the same environmental conditions could perceive livelihood risks differently as one’s livelihood is not built on a single variable such as economic condition but also includes cultural, social, political, and environmental variables. For example, Quinn et al. [27] noted that within the same environmental conditions, household structure, and village in Tanzania, weather and irrigation problems were perceived as more risky to the livelihoods of farmers in cultivation than pastoralists. Perceptions influence people’s decisions both in deciding to act or not [28] and what adaptive measures are taken over the short and long term [29]. Research has shown that community-level shocks associated with rainfall, animals, disease, and markets have a pronounced effect on individual-level risk perceptions [30]. Such results suggest that people learn actively from the experiences of others around them and adjust their risk assessment quickly. Studies focusing on risk tend to take one of two broad research approaches [26]. The first approach looks to monitor or measure the sources of stress/shock whether they are physical or social sources of vulnerability. The other approach focuses on the social side, analyzing people’s perception.
This paper examines local perception of livelihood risk in the arid and semi-arid savanna landscapes of the Kwando, Okavango, and Zambezi catchments. Furthermore, we assess how risk perception reflects the experiences of a changing social-ecological system in Botswana and Namibia. Using Smith et al. 2000s perception framework as a jumping point, a risk mapping procedure is employed to calculate three indices: incidence, severity, and risk. This risk-mapping procedure has been widely utilized in risk/vulnerability literature including case studies in Tanzania, Ethiopia, and Kenya [1,26,27]. Building on these perception studies, research that has illustrated the importance of understanding the complex socio-ecological system [19,31], and the interaction between high-level government and villages [32], we ask “how will perceptions of risk to one’s livelihood differ within and across our surveyed villages?” It is hypothesized that people’s perception of risk is directly linked to diversification of livelihood strategies in the household and therefore two variables: environmental condition and employment status. Residents of the region are closely linked to the land making the environmental conditions of their surrounding important. Furthermore, the economic stability that employment provides offers alternative livelihood strategies and means to mitigate the effects of shocks and stresses.

2. Data and Methods

2.1. Study Area

Savanna ecosystems are defined as seasonal ecosystems with a continuous herbaceous layer and discontinuous woody (tree and shrub) cover. The structure and composition of savanna landscapes, especially those in southern Africa, are believed to be impacted by climate variability, fire, herbivory, soil nutrients, and humans [33,34,35,36]. These landscapes are considered stable ecosystems whose dynamics fluctuate around one or more steady states or points of equilibrium [37,38,39,40]. Vast portions of sub-Saharan Africa are classified as arid to semi-arid systems, as dictated by the precipitation regimes. This study focuses on seven villages across the Okavango, Kwando, and Zambezi catchments in the arid to semi-arid savanna landscapes of Botswana and Namibia. Across all three catchment the average annual precipitation ranges from 400–2,200 mm/yr, but within the study region precipitation range is not as large and the 650 mm/yr precipitation line runs through the surveyed region (Figure 1). Seasonal precipitation is related to the migration of the Intertropical Convergence Zone (ITCZ) and results in a single wet and dry season. The start to the wet season typically runs from September to April. The dry season occurs in the other months and is associated with drought like conditions, a die off of grasses, and browning of vegetation. Extreme or long-term changes in the precipitation regimes are related to major ocean oscillations like the El Nino Southern Oscillation (ENSO) and shifts in the ITCZ. While the drivers and seasonal patterns remain the same, across the surveyed villages the range of annual rainfall (500–700 mm/yr) is less than what is exhibited across the three large catchments.
Figure 1. Southern Africa study site (a) highlighting the seven villages surveyed across Botswana and Namibia. This map illustrates (b) the differing economic influences, network connectivity, and (c) environmental factors influencing the socioeconomic strategies of those residing in the villages.
Land 02 00225 g001
While households in the study area have diversified their livelihoods to mitigate risk, most livelihood approaches still utilize or take advantage of the region’s rich supply of natural resources. However, these resources are vulnerable to stress and shock via climate, animals, and human populations and pattern change [41]. Two of the main livelihood strategies in the region, agriculture and tourism, illustrates the coupled socio-ecological nature of the system. The high variability in land cover type, climate conditions, and human-environment interactions results in multiple livelihood strategies including pastoralism, agro-pastoralism, subsistence farming, and tourism [27,42]. Furthermore, such high variability in environmental conditions leads to multiple land management strategies and, in some cases, a heavy reliance on government subsidies. Conservancies or trusts, depending on the country, play an instrumental role as the localized government. These governing boards direct a village’s future by distributing aid, finding employment for locals, monitoring natural resource consumption, and setting the overarching management plan among other things. Community Based Natural Resource Management (CBNRM) has been used since the 1980’s to monitor, survey, and protect the natural resources of the region [4,43]. This participatory and community-based approach is grounded in common property theory and argues for common pool resources to be utilized sustainably given certain principles are applied [44,45,46]. The inherent environmental conditions and governing of this region creates diversity in a semi-arid landscape, leading to spatially and temporally different livelihood activities and approaches to mitigate risk.

2.2. Survey Data

To date 330 surveys have been administered across seven villages in Botswana and Namibia (Figure 1). The villages surveyed differ in their dominant livelihood strategy, government organization, and environmental conditions (Table 1, Table 2). While there are numerous villages in the study area the seven selected were determined based on previous experience/connections in the region. Though convenience sampling was employed the differing aforementioned environmental patterns, socioeconomic conditions, and levels of connectivity/accessibility made the sampled villages ideally unique (Figure 1). The Okavango Conservation Trust (OCT) is located along the northernmost border of Botswana, and while comprised of several villages only three were surveyed. These villages, Beetsha, Eretsha, and Seronga, are heavily dependent on subsistence agriculture and pastoralism for economic stability. While these villages are all part of the same trust, with governance occurring through Seronga, there are many kilometers and varying economic conditions between the villages. These villages are located adjacent to Moremi National Park, but economic influence from the park and tourism is minimal as a result of lacking infrastructure (roads and electricity) and considerable distance to park gates/entrances. All of the sampled villages in OCT are located within the Okavango Delta/floodplain and are therefore greatly influenced by water levels. Their location within the Delta makes agriculture ideal, as the soil is nutrient rich. As a result of economic instability, location within the Okavango Delta, and reliance on agriculture, these villages consistently reported the highest hunger and unemployment rates (Table 2). Located adjacent to Chobe National Park in the northeast corner of Botswana is the Chobe Enclave Conservation Trust (CECT; Figure 1). Mabele and Satau, the two surveyed villages in CECT have similar ethnic makeup but exhibit differing economic and livelihood approaches. Mabele is located closest to Chobe National Park and the populated town of Kasane. Mabele has prospered in recent years as a result of road development and employment in the local park and tourism-related establishments. On the other hand, Satau is one of the most remote villages in CECT, and heavily reliant on agriculture and pastoralism. Environmentally, these two villages receive similar amounts of rainfall, and both are located in or adjacent to the floodplain of the Okavango River. However, Satau is much more susceptible to changing water levels in the catchment, making the residents highly vulnerable to flooding. The final village located in Botswana is Sankuyo, the southernmost of the villages studied. This village has its own trust, the Sankuyo Tshwaragano Management Trust. Those residing in Sankuyo have diversified their livelihood strategies to include agriculture, tourism, pastoralism, crafting, and jobs outside of the village. Environmentally, Sankuyo is the most unique of the villages sampled. The other six villages were located along a major river, delta, or floodplain whereas Sankuyo is in a dryland region far from a river or water body. Furthermore, as the southernmost sampled it therefore receives the lowest mean annual precipitation values. The uppermost soil layer in this region is Kalahari sand, which is not conducive to large-scale agriculture. Sankuyo is located adjacent to Moremi National Park from which it extracts resources and obtains economic stimulus via jobs with the Department of Wildlife and National Parks and in tourism. The only surveyed region in Namibia is Wuparo conservancy. This conservancy is located in the Caprivi Strip of Namibia close to the Botswana boarder (Figure 1). Wuparo is composed of multiple villages, closely tied to one another socially and geographically, and therefore for this study the surveys were aggregated. Livelihood strategies in the village are predominantly agricultural. Other livelihood activities involve tourism-related jobs at several camps and lodges in the area and crafting. Wuparo is located along the Kwando River and receives approximately the same amount of precipitation as the CECT villages. Of the villages surveyed Wuparo, Mabele, and Satau, receive the most precipitation. The villages sampled provide for comparative research given that the villages sampled were in floodplain and dry lands, across political boundaries, comprised of differing livelihood strategies, and situated varying distances to national parks. Table 1, Table 2 document the basic descriptive statistics of the surveyed villages.
Table 1. Country and village level information in regards to the areas surveyed.
Village# of Households SurveyedCountryConservancy/Trust
Beetsha36BotswanaOkavango Conservation Trust
Eretsha37BotswanaOkavango Conservation Trust
Mabele56BotswanaChobe Enclave
Sankoyo34BotswanaSankuyo Tshwaragano Management Trust
Satau56BotswanaChobe Enclave
Seronga49BotswanaOkavango Conservation Trust
Wuparo62NamibiaWuparo Conservancy
Table 2. Basic household level statistics derived per village based on semi-structured interviews. Average number of core family members represents the average number of people living at least six months a year in the household. Average number of subsidies represents average number of government supplied support programs utilized by the households.
VillageAverage Core Number of Family MembersAverage Number of Subsidies Obtained per HouseholdAverage Number of Months Hungry Each Year per HouseholdAverage Total Plot Size (ha), including Potential Outliers
Beetsha5.40.722.701.81
Eretsha5.21.24.802.05
Mabele5.30.771.506.07
Sankoyo6.01.882.641.54
Satau4.10.462.303.83
Seronga3.60.695.363.02

2.3. Methods: Risk Mapping

Risk-mapping requires data on the type and relative importance of threats perceived by individuals in villages. This information was obtained via semi-structured open-ended questionnaires, administered during the dry season of 2010. The open-ended questionnaire was used for risk identification so as not to influence the cited risks, the number of risks mentioned, or the order in which they were mentioned. Locals were employed as research assistants to help administer the survey within each village. During the training process research assistants were asked to define the extent of the village. From this information the village was divided into quadrants and research assistants were assigned to areas. While the selection of households within the quadrants was based on convenience sampling, by dividing the village it was ensured that the entire area was sampled. The aim was to interview at least half of the households in each village, meaning that at least 30 household surveys were conducted in all villages. More surveys were administered in larger villages, yielding a final sample size of 330 households (Table 1).
The questionnaire was typically administered in one hour and included information on family structure, economic inputs and outputs, livelihood activities, assets, threats, and a wide variety of other socioeconomic metrics. In the final stages of the questionnaire, respondents were asked to identify the biggest threats to their livelihood and to compare their current household prosperity to what it was five years ago. These questions lay the groundwork for our risk perception analysis. Respondents were not restricted in the number of risks that they could list, but few listed more than three. Forty-six people did not list any risks; no response to the question could indicate that the household does not perceive any risk to their livelihood or it could indicate that the survey was not completed. Furthermore, a few households (n = 6) said that they did not perceive any risks to their livelihood. These were included in the analysis and coded as a separate category.
Data preparation required that each risk given by the respondents be coded into major reoccurring themes. In the first step of coding, responses were grouped into 25 categories of risk (Table 3). These categories were previously defined in the literature and are based on the capital asset for which livelihoods depend, including natural, physical, financial, human, and social [7,27]. Natural capital represents the natural resource stocks and services that are useful for livelihoods. Natural capital is closely linked to vulnerability in that many shocks that impact livelihoods are usually natural processes (floods, drought, etc.). Physical capital is defined as necessary basic services and infrastructure. Financial capital refers to the economic resources needed/used to meet livelihood objectives. Examples include employment status, market variables, and economic status/gain associated with land and animals (Table 3). The last two types of capital, human and social, can appear to be very similar. Human capital represents the skills, health, and ability of people to pursue varying livelihood strategies. Whereas social capital is related to the human networks established in the pursuit of livelihood objects. These include variables of support, aide, safety, and social connections. By breaking up the 25 categories of risk, we allow for analysis using livelihood assets for the entire sample size and at the village level. This allows us to determine overall which livelihood asset is perceived to be at greatest risk. Once the data were categorized, indices of perception were calculated.
Table 3. Livelihood assets by which survey responses were classified. Such categories are divided according to the capital assets on which livelihoods most closely depend: physical, natural financial, human, or social [7,27].
Asset TypeRisk CategoryDescriptionExample
NaturalWater/WeatherRelated to any way water affects those residing in a regionFlooding, Drought, Water Shortage
AnimalsDestruction of crops/livestock related to wild animalsElephant eat crops, lions/hyenas killing cattle
ResourcesOverall less natural resources for consumption, crafts, housing materialsDecrease in natural product abundance over time making villagers more reliant on purchased goods
LandInability to cultivate landAccess to land; low soil fertility
PestsAbundance of pest in a region which can destroy crops, and cause illnessMosquitoes
LivestockLivestock disease or lossHuff and mouth disease
PhysicalTransportationRoad infrastructure and transportLack of connectivity
HousingHousing location, size, or typeHouse to small for everyone, house is crumbling
ElectricityAccess to electrical supply, or installation of lines within regionElectricity poles have been laying on side of road for year
WaterRelated to shortage of water due to the lack of infrastructure in villageWater cutoff by utility company, lack of standpipe
FinancialEmploymentInability to find a jobUnemployment
FinancesFinancial securityAccess to credit, poverty, lack of basic essentials
MarketsAccess to markets to sell producesDistance to market is to far and thus unable to sell goods
Agri-InputsAvailability of fertilizers, seeds, plow, sledgeCannot cultivate land because lack of equipment
Agriculture and LivestockInability to obtain or maintain animals or land due to financial constraintsNo land given by land board, not able to buy a plough, cannot afford to live at cattle post
HumanHealthHuman illness/diseaseHIV, water induced illness, alcoholism
HungerHunger and malnutritionFood shortage
DeathDeath of head of household or core family memberDeath of a core family member/provider to household
AgeEffects of age on livelihoodI am to old to grow crops
SocialSubsidies/Government SupportAccess to goods, support, or money from the trusts/conservancies or the national governmentThe proposed hunting ban our mean less meat in the house, there is no government support
SchoolsAccess to schoolSchool fees are high, access to schools
ClinicAccess to health care systemHospital is far away, there is no clinic in the village
No support or head of householdLack of leadership or assistance in household including with land cultivationNo head of household, no one is sending us money anymore
SafetyRelated to theft, assault, or any other crimes that could impact the villageTheft of cattle or crops, scared of wildlife
Supporting Others/OrphansSupport via assistance, living accommodations, or moneyMultiple orphans are supported by the household
In this study we approach the risk perception analysis with the Smith et al. [26] framework in mind. However this is a modified approach to risk perception analysis given the limitation of available data. In Smith et al. [26], the authors classified and ordered perceived sources of livelihood risk for villagers residing in arid and semi-arid lands of southern Ethiopia and northern Kenya. This methodology has now been utilized in numerous studies across Africa, Asia, and South America. For example, Baird et al. [1] analyzed the effect of national parks of people’s perception of livelihood risk. Additionally, Tschakert [47] used a similar approach but expanded/altered the technique to further analyze perceptions of climatic stresses in the Sahel. The definition of risk used here relates to that of Quinn et al. [27]/others who have utilized this risk perception methodology and while used in a different region than others it provides for a nice comparison of results. Furthermore following Tschakert [47], the terms concern, problem, stress, shock, and threat are used here interchangeably as they all reflect threats to people and the things they value [21].
For each risk mentioned by a respondent, an incidence index (I), severity index (S), and risk index (R) were calculated [47]. The incidence index gives a simple measure of the proportion of respondents identifying a particular response. I is calculated as the proportion of respondents that identified the same risk divided by that population. The population will vary according to the group being studied. For example, for all villages the population was 330 but when calculated by each village the population is the number of households surveyed. The severity index (S) measures the severity of risk for each threat on a continuous scale from 0 (least severe) to 1 (most severe) [26,47]. This index is calculated for each risk identified by the respondents:
Land 02 00225 i001
where r is the rank of the response based on the order in which it was mentioned by the respondent, and n is the total number of threats identified by the respondent. While the survey did not explicitly ask those surveyed to rank the perceived risks in a numbered listing, like the Smith et al. [26] study, the wording of the question and the instructed approach to asking the question allows one to infer rank. Furthermore, while the inferred rank could in some cases lead to errors in the analysis there are several points that justify the assumption of rank in this study. First, almost all surveyed households gave three or less responses to the perceptions of risk survey question. Secondly, this paper represents a single moment in time in which the households were surveyed. Meaning that the most important issues are first to mind at that time. Even though in all risk perception studies we ask for the overall biggest perceived threat to one’s livelihood there is little doubt that the most important issues at the survey time are the first to come to mind. In order to have a broader understanding of overall perceptions of livelihood threats, studies of this nature would need to be done based on repeat sampling. Lastly, the continuity of answers across our study, especially in regard to the top three perceived threats for all villages, gives power to the risk perception indices.
The risk index incorporates the values of the S and I indices and is calculated as [47]:
Land 02 00225 i002
R will increase with higher values of both I and S, as high I values indicate a high incidence of a particular response and high S values indicate a more severe risk. The methodology of the risk perception analysis does not mean that the risk index values per village are a simple composite of the individual subset. The differing number of households in the population and the differing rank of a risk accounts for the differing values when compared to village-level index values.
Next, overall S, I, and R-values are calculated by averaging the individual S values for a subset of the entire population. For example, if we were interested in comparing perceptions of risk between male and female-led households, the S values would be averaged for each risk for each subset (male-led and female-led households) of the population. For this study, the survey data was subset in multiple ways in order to study the entire study area and the various subpopulations of interest. In addition to analyzing risk perception for the entire sample and each village, the data were also subset according to male versus female-led households, and households with members engaged in wage labor versus those reliant on subsistence activities. Households with at least one core member in a wage labor position were categorized into one class, while all other households were categorized into another class, including households reliant on cultivation, pastoralism, and government subsidies. Lastly, to determine which overall livelihood asset (physical, natural, social, human, financial) was deemed at greatest risk (highest R-value), the responses were aggregated to the asset-level. Meaning that all responses that could adversely affect each livelihood asset were grouped together and the S, I, and R indices were calculated. For example all responses related to water/weather, animals, resources, land, pests, and livestock were grouped together as such responses could affect natural assets (Table 3). By grouping these responses together the risk perception indices can be recalculated and we can determine which overall livelihood asset was perceived at greatest risk.

3. Results and Discussion

3.1. Results

The S-scores were graphed in relation to the I-score for each of the risk response categories (Table 4). The risk map illustrated in 
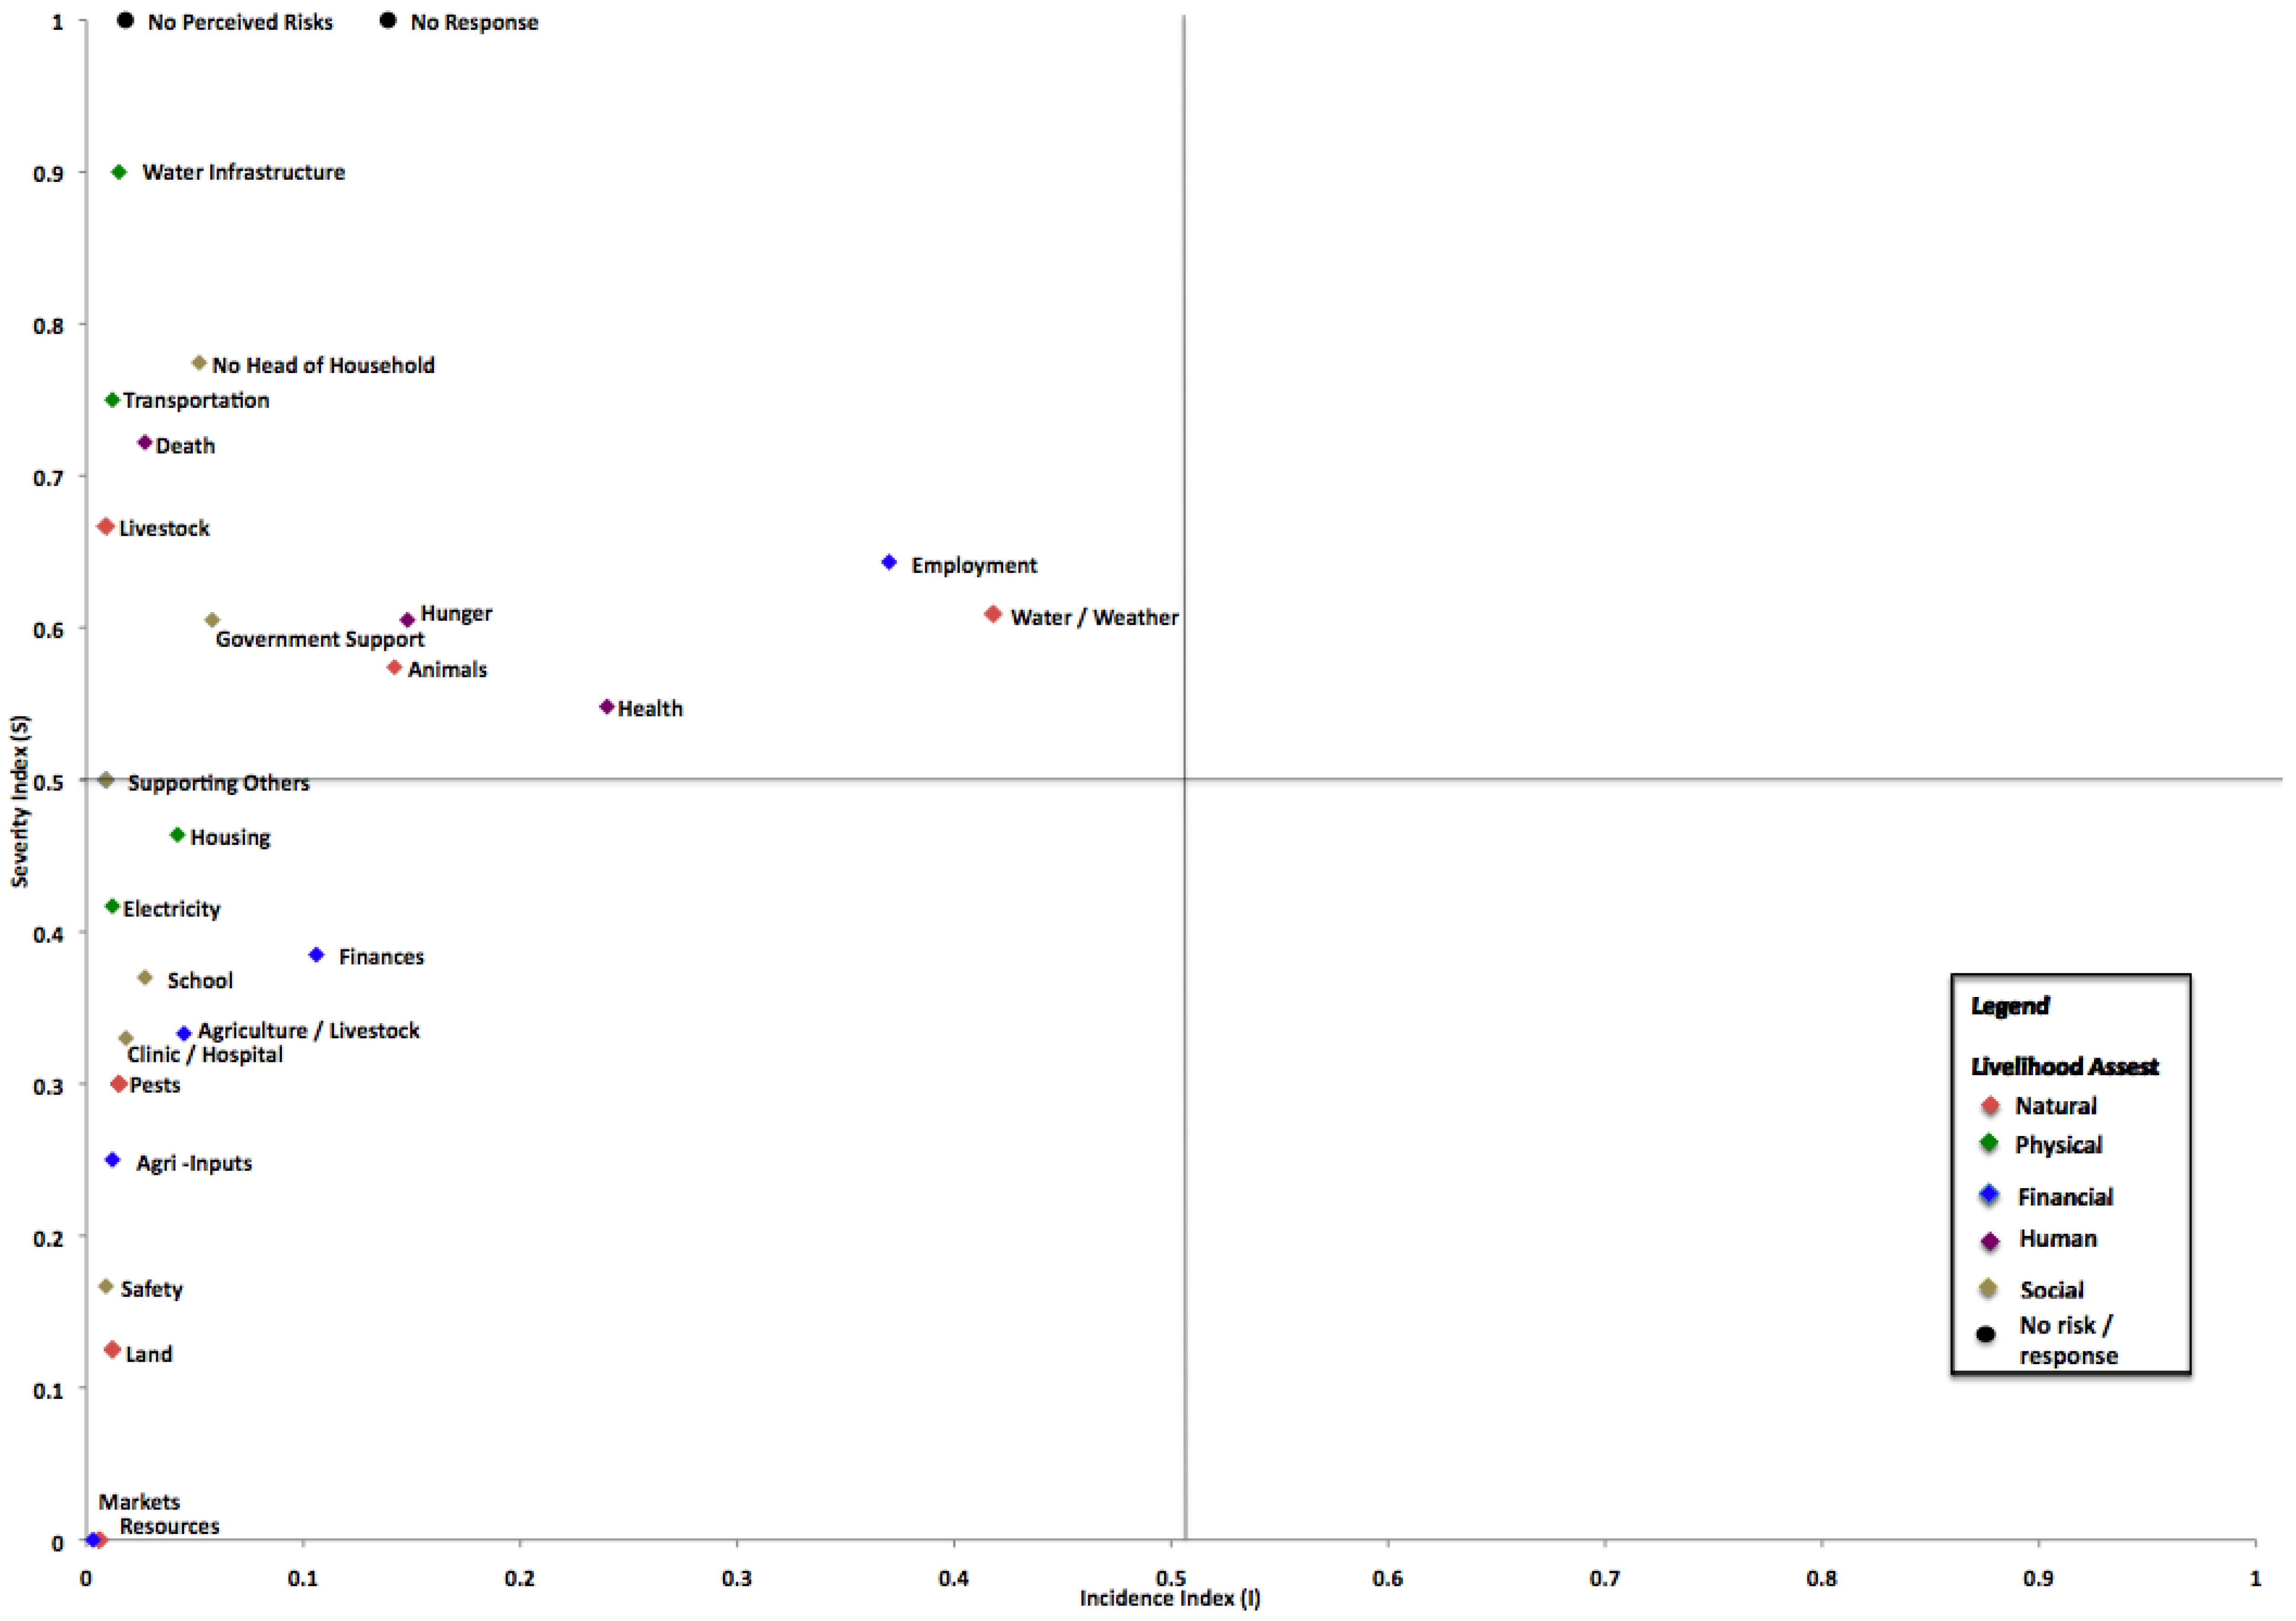
Figure 2 depicts the most commonly and severely perceived risks to livelihoods across all villages. Obviously, if we were to develop risk maps for each village they would look quite different, as S and I values varied among the differing study subsets (villages, gender, and employment). The lower left portion of the risk map shows responses with the lowest incidence and lowest severity. Given the variety of answers from our surveys, many of the categories lie in this region. Responses related to weather/water and employment had the highest incidence. Just under half of all respondents identified some sort of water or weather-related issue as a risk to livelihoods (42%). This includes responses such as drought, flood, and temporal change in rainy season. Ranking highest on the severity index were responses related to water infrastructure (Figure 2). The water infrastructure issue is considered highly severe but it was an uncommon answer among respondents. While not commonly mentioned by respondents on surveys, focus groups in individual villages commonly highlighted the lack standpipes as a major issue. For example, the focus group discussion in Beetsha was dominated by the issue of the lack of nearby standpipes in the village. Other responses with a high severity and rather high incidence index value include those related to hunger and animals. Risk mapping illustrates that responses related to water/weather, employment, and health as the most commonly identified risks to ones livelihood (Figure 2). Furthermore, these issues have relatively high severity index values ranging from 0.55 to 0.65.
While Figure 2 illustrates the overarching patterns across all of the villages, Figure 3 and 
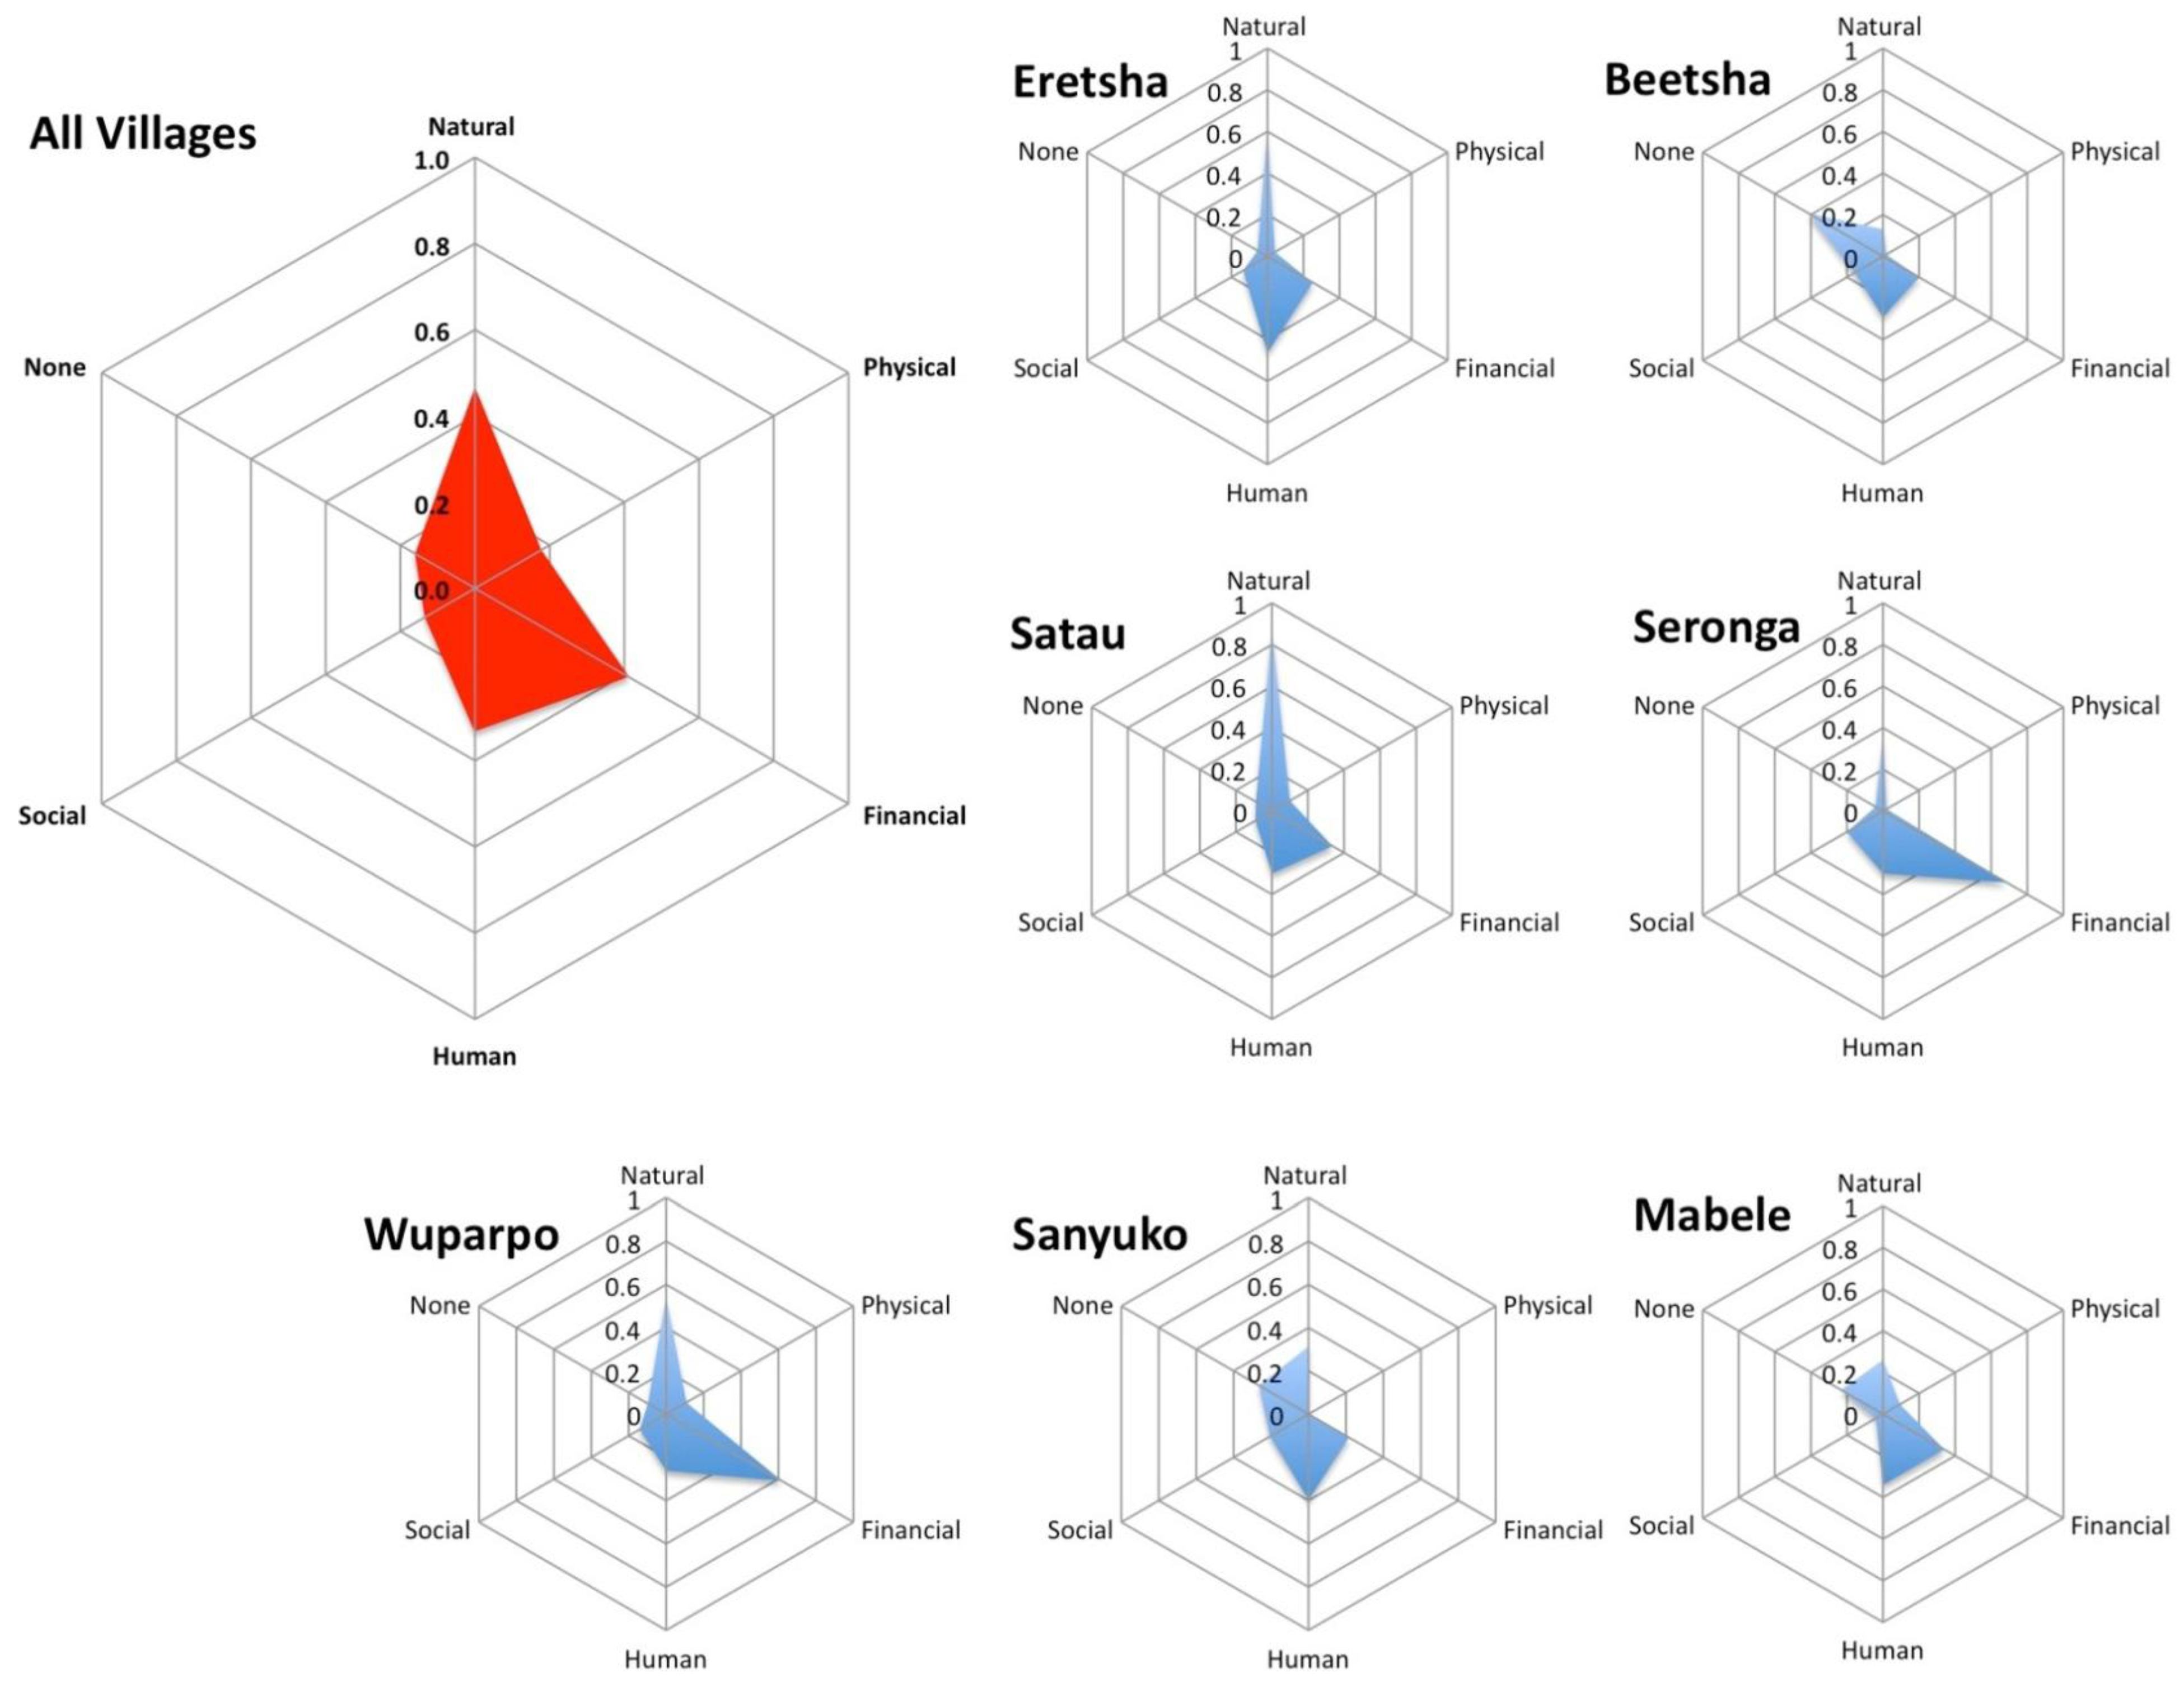
Table 4 look at the risk index values by villages. In the first village, Beetsha, the top risk index scores were related to health (0.208), employment (0.158), and weather/water (0.129). These top perceived risks to livelihood are understandable given the environmental and socioeconomic conditions in the area. This village is many kilometers away from a hospital/clinic and from viable employment sources. Furthermore, the village is located within the Okavango Delta. The seasonal fluctuation of water levels could explain the numerous responses related to weather/water. Collectively, responses associated with human and financial assets had the highest R-value and therefore these assets were considered at greatest risk (Figure 3). Located adjacent to Beetsha is the village of Eretsha. Although these villages are only 10 km from one another, there was a differing risk index pattern. Overall, the respondents in Eretsha perceived threats related to natural and financial assets as the greatest source of risk (Figure 3). At the individual response level weather/water (0.527) and hunger (0.252) produced the highest R-values. This village, like the others in OCT, is heavily reliant on subsistence agriculture and pastoral activities. With livelihood approaches so reliant on natural resources any climate variability, especially climate extremes, would impact the total socio-economic structure of the village. In the last OCT village, Seronga, survey respondents perceived threats related to financial assets as the biggest source of livelihood risk, especially employment (0.537) and finances (0.105). Within the Okavango Conservation Trust (OCT), the responses associated with the greatest risk were related to natural and financial assets. Given the trust’s heavy reliance on agriculture and pastoralism and its distance from major sources of employment, these responses are understandable; additionally, the lack of economic development and difficulty in cultivation due to climate variability is observed for this area and seen in the number of months reported hungry statistic (Table 2). The villages of OCT report a higher number of months hungry per year when compared to all other villagers surveyed. Seronga reports the highest hunger levels, averaging 5.4 months per year.
Table 4. Risk index values for the entire sample and by villages. This index ranges from 0 (least risk) to 1 (most severe risk). Where n refers to the number of households surveyed in each village and the bold values represent significantly high values for each village compared to the all village category.
Livelihood Assets All VillagesBeetshaEretshaMabeleSankuyoSatauSerongaWuparo
n = 330 n = 36n = 37n = 56n = 34n = 56n = 49n = 62
Natural
1Water/Weather0.3260.1290.5270.0890.1180.7140.2880.328
2Animals0.109-0.0590.1630.1810.1040.0560.161
3Resources0.003--0.009--0.01-
4Land0.007---0.0150.012-0.016
5Pests0.010-0.027--0.039--
6Livestock0.008-----0.0100.032
Physical
1Transport0.011-0.027--0.027-0.016
2Housing0.03030.0190.1350.027-0.06250.0210.046
3Electricity0.0078--0.0134---0.030
4Water0.014--0.054-0.0119-0.016
Financial
1Employment0.3000.1580.2250.2600.0880.2410.5370.423
2Finances0.071-0.0270.0540.1270.0510.1050.116
3Markets0.002-- --0.010-
4Agri-Inputs0.007-- -0.018-0.022
5Agriculture/Livestock0.0280.042-0.027-0.0270.0340.060
Human
1Health0.1830.2080.2120.2780.1860.1430.2000.083
2Hunger0.116-0.2520.0710.2110.1490.0440.119
3Death0.0230.083----0.0210.060
4Age0.007----0.0090.034-
Social
1Government Support0.0450.0280.081-0.1280.057-0.051
2School0.0180.0190.0270.0090.018-0.0440.016
3Clinic/Hospital0.012--0.0178-0.0270.031-
4No support system 0.0450.1110.027-0.051-0.1260.032
5Supporting Others0.0065--0.0119-0.009-0.016
6Safety0.005------0.027
None
1No Risks to Livelihoods0.0180.028-0.0710.029---
2No Response0.1390.3890.0540.1610.2350.0890.0410.097
Figure 2. Risk map plotting severity index versus the incidence index for all villages surveyed. Both indices, I and R, range from 0 (lowest incidence or least severe) to 1 (highest incidence or most severe).
Land 02 00225 g002
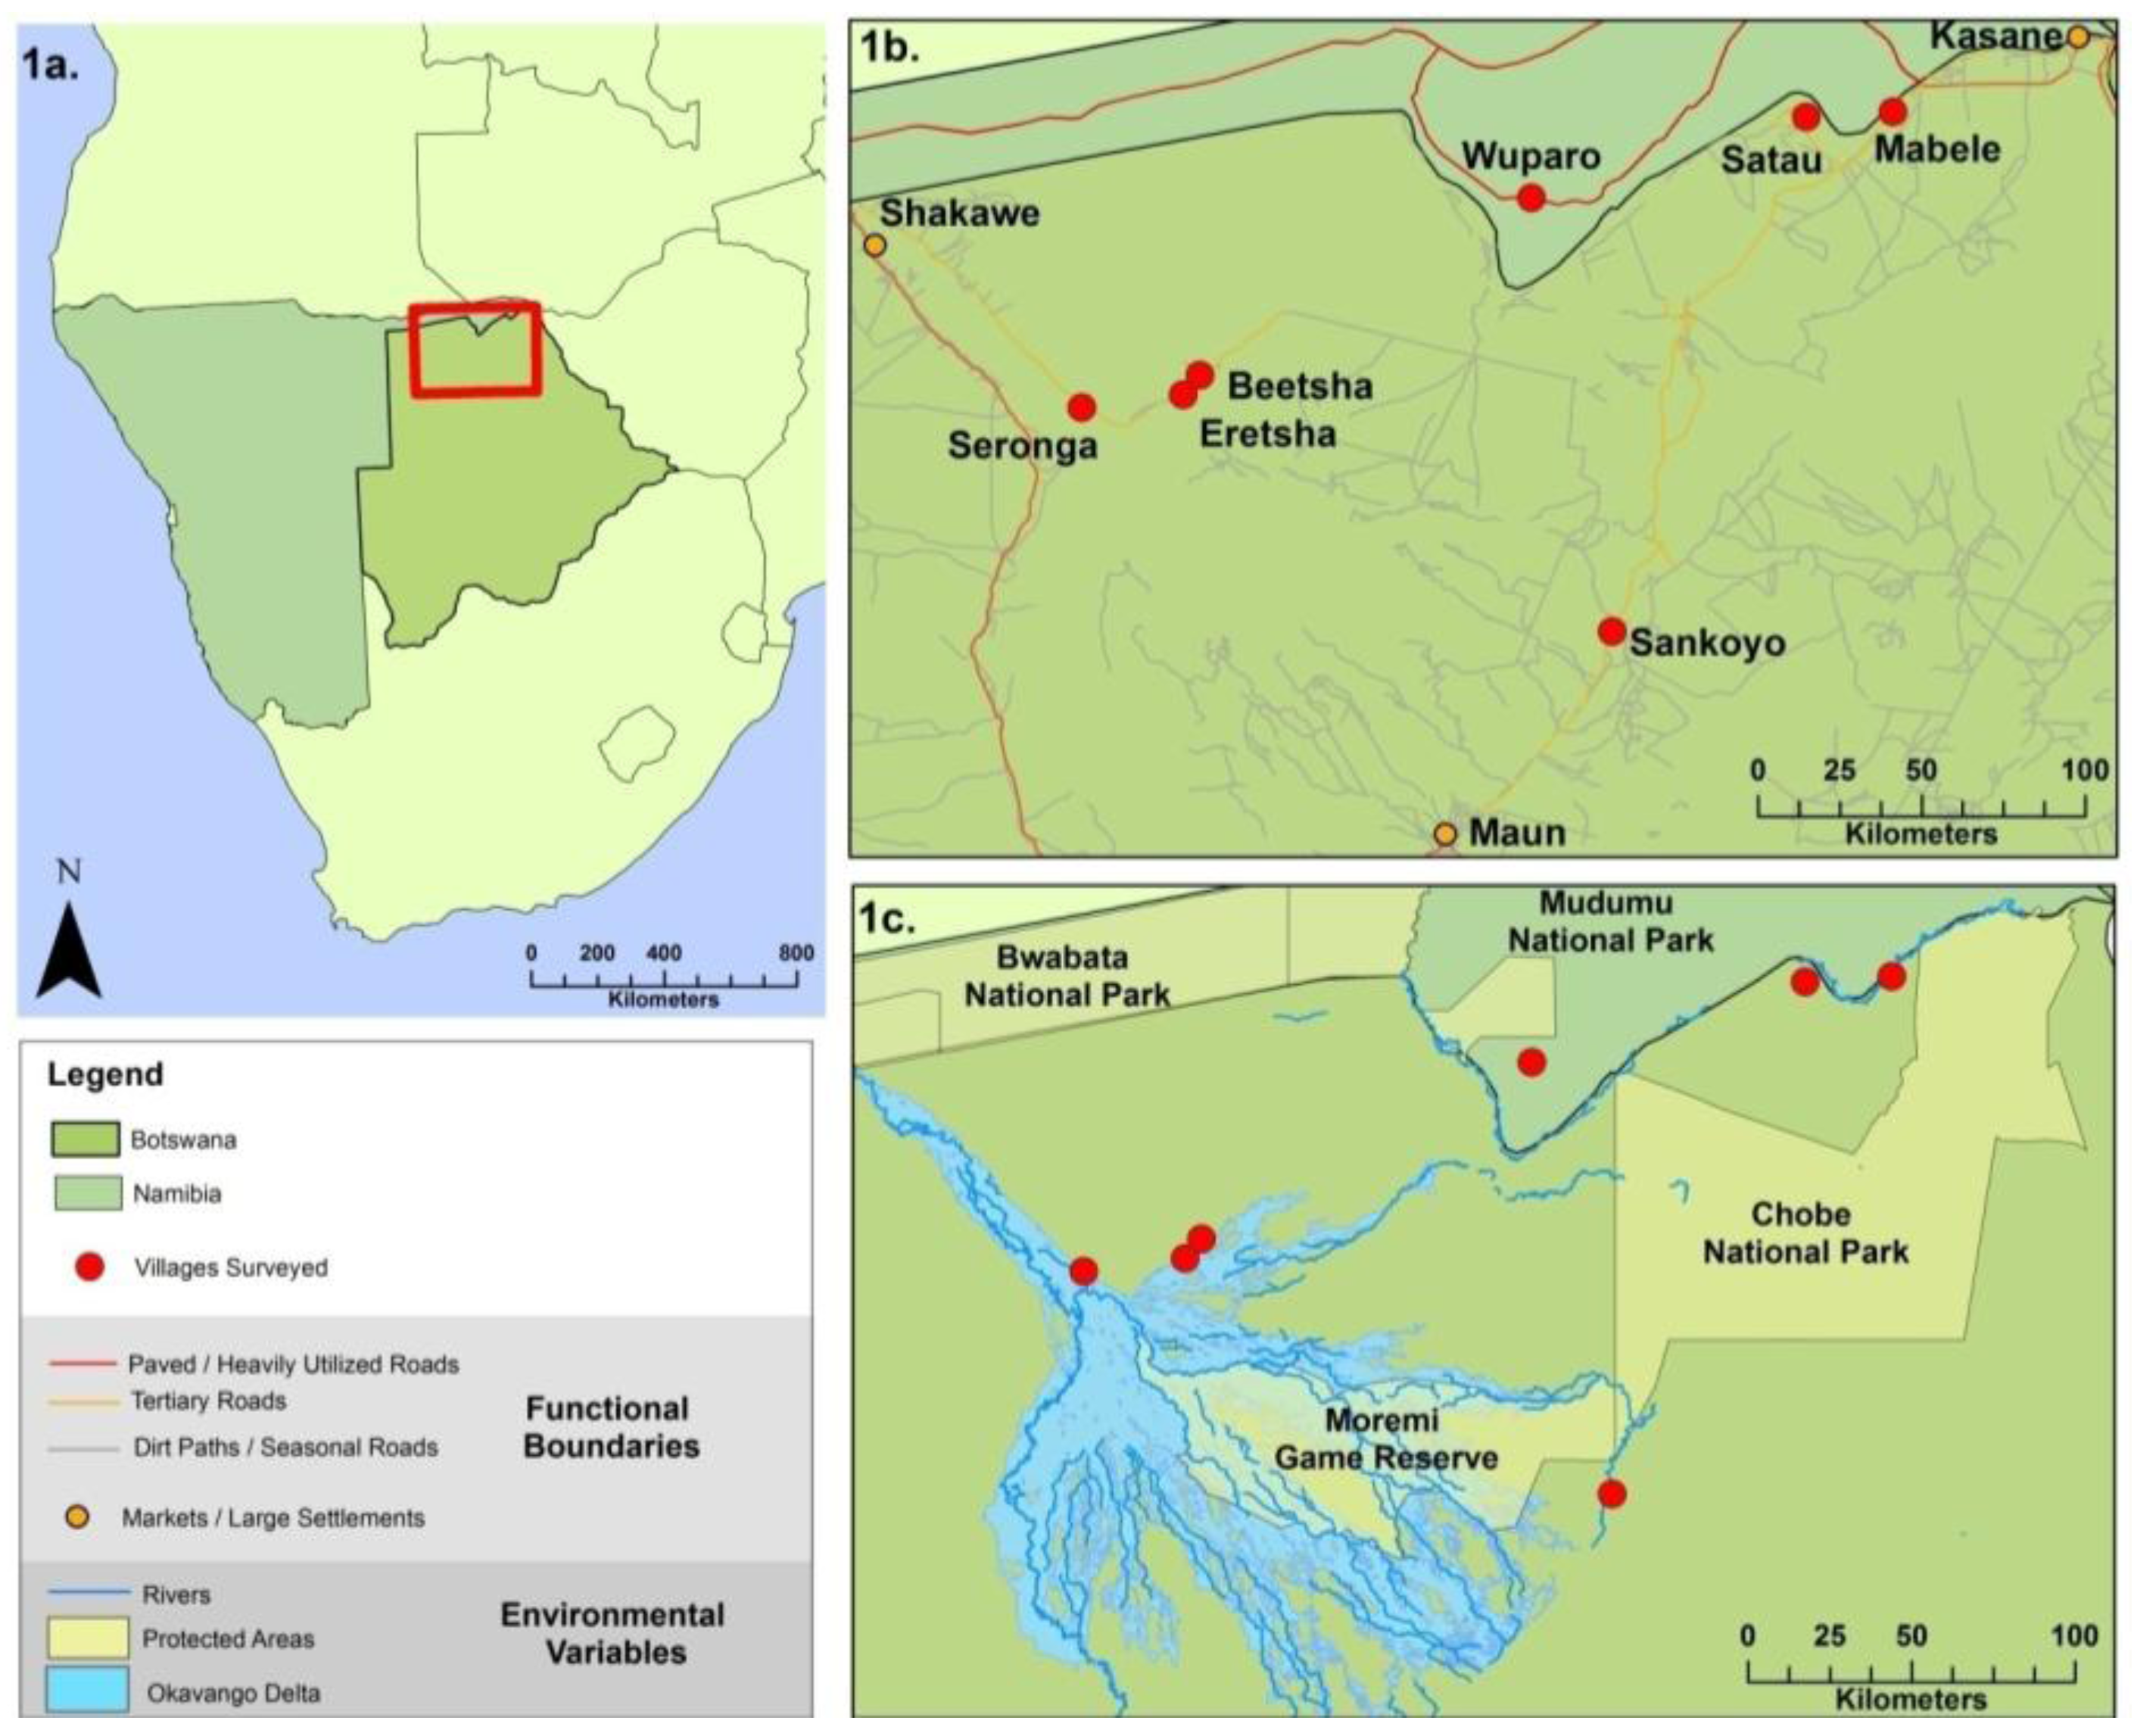
The two villages surveyed in CECT, Mabele and Satau, exhibit different risk index patterns. Though these two villages are within the same governing trust, they have different environmental conditions and are in differing proximities to the large and tourism-heavy Chobe National Park. CECT itself, which is composed of five main villages, is surrounded by protected areas on three sides, by Chobe National Park and the Chobe Forest Reserve. The majority of CECT is located in the floodplain of the Chobe River. In Satau, which is furthest from the park (distance to park gate = 55 km, Euclidean distance = 40 km) but within the floodplain, problems related to natural assets, especially flooding, presented severe risk to livelihoods. Overall, the weather/water category had an R-value of 0.714, the highest for any village or category. Additionally, employment (0.241) and hunger (0.149) produced high R-values. Responses of hunger go hand in hand with the flooding issues in the region as crops are destroyed or an area is not able to be cultivated. The other surveyed village in the CECT, Mabele, is located adjacent to Chobe National Park (Figure 1) and in relatively close proximity (50 km) to the town of Kasane (Figure 1). Responses indicate that health was a concern (0.278), followed closely by employment with an R value of 0.26. Interestingly, respondents perceived animals (0.163) as greater threats than water/weather (0.089). Chobe National park is known for its high populations of elephants and given its proximity to the village crop raiding by wild animals is high.
Sankuyo is set in a very different physical environment than any other sampled villages, as it is not adjacent to a major waterway. Overall, response related to human and natural assets were most commonly observed and produced the highest overall R-values (Figure 3). This can be further broken down to show that animals (0.181) and weather/water (0.118) were the main natural concerns for the village. The main weather-related response was associated with drought due to Sankuyo’s reliance on seasonal precipitation and location approximately 38 km away from the Okavango Delta. Though the village is not located within the Okavango Delta with its rich fertile soils, main forms of subsistence involve agriculture and natural resource utilization. Agricultural production consistently suffers every year due to raiding by elephants and other wild animals. Great measures have been taken to try and minimize this problem, but generally with little success. Variability in precipitation and animal raiding leads to reduced agricultural production and subsequent hunger. For Sankuyo the response with the highest R-value was, in fact, hunger (0.211), followed by health (0.186).
Of the seven villages sampled, only one lies in Namibia, making comparisons of country-level differences in risk perception difficult. However, in general the responses with the highest R-values and therefore posing the greatest risk to livelihoods in Botswana were the same in Namibia, with problems related to natural and financial assets perceived as the greatest source of risk to livelihoods (Figure 3). The four highest R-values for Wuparo came from the employment, weather/water, animals, and hunger categories (Table 4). Employment was highest, with an R-value of 0.423. Given the village’s location and environmental condition, it is understandable that lack of employment is perceived as the biggest threat to livelihoods. There are several lodges in the area but all are rather small, and the other main employment hub is located many kilometers from Wuparo in the town of Katima Mullilo. Thus, many of the residents of Wuparo look to agricultural activities for subsistence. The next concern to livelihoods was related to water/weather issues, especially flooding and drought. The village’s proximity to the riverfront and its heavy reliance on agriculture explain this relatively high R-value. Lastly, animal problems (such as crop raiding) were commonly listed as threats, both domestic and wild. Wuparo is situated near Mudumu National Park, which accounts for wildlife problems in the village.
Figure 3. Web diagrams illustrating each village’s R values by livelihood asset including: natural, physical, financial, human, and social. The none portion of the web diagram illustrates those surveyed that did not perceive any risks to their livelihoods or did not respond to the question.
Land 02 00225 g003
Gender lines provided an opportunity to further analyze the risk perception results (Table 5). As defined by Hahn et al. [48], the female-led households were houses where the primary adult is female. If a male head of household is away from the home for more than six months per year, the female is counted as the head of household [48]. Based on this definition, 32% of households included in the analysis were female-led and 68% were male-led. Overall for female-led households, the highest R-values were associated with water/weather, employment, health, and hunger. As shown in Table 5, women perceived employment as a greater concern than men. In terms of male-led households, water/weather, animals, employment, health, and hunger had the highest R-values. Interestingly, men perceive health issues as more of a concern than do women. It is also interesting to note that men see human-wildlife interactions as a greater threat than women do.
Table 5. Risk index values subset by gender. Where n refers to the number of households surveyed in each subset.
Livelihood Assets MaleFemale
n = 221n = 107
NaturalWater/Weather0.3550.273
Animals0.1290.069
Resources0.005-
Land0.0080.005
Pests0.014-
Livestock0.0020.019
PhysicalTransport0.0110.009
Housing0.0330.028
Electricity0.0080.007
Water0.0170.009
FinancialEmployment0.2780.338
Finances0.0620.092
Markets0.002-
Agri-Inputs0.011-
Agriculture/Livestock0.0220.047
HumanHealth0.2040.142
Hunger0.1110.122
Death0.0260.019
Age0.0080.005
SocialGovernment Support0.0470.044
School0.0190.017
Clinic/Hospital0.0160.005
No support system/HH0.0340.07
Supporting Others0.0050.009
Safety0.0030.011
OtherNo worries/Challenges0.0230.009
No response0.1090.187
Breaking down the results by employment status shows some differentiation in perceived risks to livelihoods (Table 6). Households with at least one core member in a wage labor position were categorized into one class, while all other households were categorized into another class called subsistence, including households reliant on cultivation, pastoralism, and government subsidies. Under this definition of wage labor versus subsistence, results indicate that 56% of all households surveyed had at least one core member in wage labor and 44% fell into the subsistence category. As expected, the R-value for the employment category was higher for households in the subsistence subset as compared to those in wage labor. Additionally, for the subsistence subset threats associated with natural assets, like water/weather and animals, were the greatest sources of risk. In terms of human livelihood assets, those in wage labor worried more about health than the subsistence subset. Furthermore, the subsistence subset perceived hunger as a greater threat than those in wage labor, but surprisingly the R-values only varied slightly between the two subsets.
Table 6. Risk index values subset by employment status. Employment is defined as economic activities from which a salary is drawn. Meaning those working in agricultural pursuits or without jobs were classified as subsistence.
Livelihood Asset Subsistence Wage Labor
n = 144n = 186
NaturalWater/Weather0.3590.304
Animals0.1190.102
Resources0.0030.003
Land0.0070.006
Pests0.0190.003
Livestock0.0140.003
PhysicalTransport0.0140.008
Housing0.0310.03
Electricity0.010.006
Water0.0140.014
FinancialEmployment0.3380.262
Finances0.0760.067
Markets-0.003
Agri-Inputs0.0080.006
Agriculture/Livestock0.040.022
HumanHealth0.1240.228
Hunger0.140.10
Death0.0310.017
Age0.0030.009
SocialGovernment Support0.0320.056
School0.020.017
Clinic/Hospital0.0030.019
No support system/HH0.0590.034
Supporting Others0.0060.006
Safety0.012-
OtherNo Worries/Challenges-0.032
No Response0.140.14
For the final question of our survey, respondents were asked about their current prosperity level compared with that of five years ago. Overall, 40.6 percent of those surveyed said they were less prosperous than they were five years ago (Table 7), whereas 53.3% reported they were either more prosperous or the same as five years ago. Mabele and Satau were the only villages where the vast majority (great than 60%) of the respondents said they are more prosperous or at the same prosperity level now than they were five years ago. As previously mentioned these villages are located in a region with growing tourism through the adjacent national park. These villages are both undergoing development, especially in regard to Mabele, in the last two years the road network has improved in the area, as has village infrastructure. In the OCT region of Botswana a large portion of the respondents noted that they are less prosperous now. There are a great number of potential causes for this perceived decrease in prosperity. Firstly, there is a lack of employment in the region making residents in the area heavily reliant on subsistence agriculture. Additionally, the region is a great distance from markets and at the time of the survey had little physical infrastructure (roads, electricity, standpipes, cell phone towers). Overall, many government reports such as Arntzen [49] have noted an increase in prosperity across portions of Botswana as livelihood assets improve. While prosperity and perceptions are very different things, they both show the impacts of shocks/stresses and the problems resulting from the lack essential livelihood assets. For example, the majority of villagers in communities such as Eretsha have said they are less prosperous and that the biggest perceived risks come from weather and water problems and lack of employment. This lack of prosperity can therefore be attributed to the inability of community members to find wage labor and the destruction of yearly crops or households via drought or flooding. One village that is a bit of an outlier is Satau, where the majority of respondents said they were more prosperous or the same as five years ago. The risk perception analysis for this village showed that problems related to natural and financial assets are of biggest concern. However, compared to five years ago the trust in which this community lies has grown and prospered to a degree, and this fact maybe skewing the survey responses.
Table 7. Village prosperity comparison based on the survey question “Compared to five years ago are you more, less, or of the same prosperity?”.
VillageProsperity CategorynPercentages
BeetshaMore Prosperous/Same2055.56
Less Prosperous1644.44
Don’t Know00.00
EretshaMore Prosperous/Same1437.84
Less Prosperous2156.76
Don’t Know25.41
MabeleMore Prosperous/Same3664.29
Less Prosperous1730.36
Don’t Know35.36
SankoyoMore Prosperous/Same1750.00
Less Prosperous1235.29
Don’t Know514.71
SatauMore Prosperous/Same4173.21
Less Prosperous1526.79
Don’t Know00.00
SerongaMore Prosperous/Same2142.86
Less Prosperous2448.98
Don’t Know48.16
WuparoMore Prosperous/Same2743.55
Less Prosperous2946.77
Don’t Know69.68
TotalMore Prosperous/Same17653.33
Less Prosperous13440.61
Don’t Know206.06

3.2. Discussion

Risk perception is conceptualized as the perceived likelihood of negative consequences to oneself, household, or community from a specific threat or risk. When responses were reclassified to the asset level results show that overall environmental, human, and financial assets were perceived as the most likely to be negatively impacted and therefore affect livelihoods. Basic trends in these variables are described above, but there have been impactful environmental and social changes in the region. In a natural resource driven landscape such as this, key environmental variables include precipitation and vegetation, both of which are undergoing alterations in pattern. There is a long history of climatic shifts in the region, the most notable of which occurred in the late 1970s. This period correlates to noted shifts in global climate and a decrease in precipitation in southern Africa; this major climate shift has been highly correlated with a strong El Nino Southern Oscillation (ENSO) phase [50,51,52,53]. Additionally the IPCC projects further climate shifts across southern Africa. Long-term general circulation model (GCM) projections indicate a likely 4%–9% decrease in precipitation in the next 20–25 years for sub-Saharan countries. In terms of temperature, the IPCC project a minimum increase of 1.9 °C [54]. Accordingly, the United Nations Framework Convention on Climate Change (UNFCCC) considers many of the countries of southern Africa, including Botswana and Namibia, to be highly vulnerable to climate change. Further environmental changes have been noted in the vegetation structure for the region, where an increased percentage of shrub cover has been noted in the literature and linked to bush/shrub encroachment [55,56,57]. Environmental risk across the studied villages is primarily a function of climate change or variability, alterations to vegetation composition, and wildlife disturbance. The adaptive capacity for dealing with such environmental risks is dependent on the extent to which the risk is understood, the ability of residents to respond, and the perception of how such a threat will impact their household or livelihood [47,58]. Within the studied villages there appears to be a great understanding of the impacts and results from climate variability or change, as indicted by the high incidence index scores for such natural risks.
Many social programs have been put in place across both Botswana and Namibia in order to help bolster financial stability and livelihoods. These governmental programs distribute goods and money with the goal of lowering household vulnerability. For example, within Botswana the government drought relief program looks to lower environmental risk by providing money, jobs, or food to those whose livelihoods are most affected by drought [59,60]. This program has brought about two major sources of social change: transformation in adaptation and coping measures of the drought-affected, and changes in risk perception at both the household and community scale in rural landscapes. Drought relief programs do exists in Namibia with the same objectives of Botswana’s program: to ensure household food security, encourage and support farmers, ensure the continuous supply of potable water to communities, and minimize the degradation of natural resources during droughts. With the goal of socioeconomic and livelihood development many other social programs have been put in place within the study region.
Botswana has experienced great economic growth in the last twenty years [61]. However, this success appears to be uneven. In rural developments more than 60% of the residences are still living below the poverty line [61,62]. A wide range of subsidies and government assistance are distributed within rural villages, though sometimes unevenly, with the goal of assisting orphans, older residents, those affected by climate variability, and people impacted by wild animals. In addition to the drought relief program the government has other programs to minimize environmental risk. Commonly, water development programs are brought into communities in order to provide standpipes and catchment tanks [61]. Additionally, assistance is provided to farmers by way of farming machinery that can be loaned to residents in need. This available farming equipment and seed allocations could have increased both the amount of land cultivated and the total crop yield. As it stands, agricultural production is typically low with many households producing no extra crops to sell [63]. As indicated in Table 4, households surveyed did not perceive a lack of government support. The aforementioned programs likely play a role in these results. The minor outlier, in terms of perceived risk via lack of social assets, occurs in village of Sankuyo, which on average has the highest number of subsidies per household but still perceived a lack of government support and resulting impacts on livelihoods (Table 2, Table 4).

3.2.1. Effects of Livelihood Strategy and Employment

Livelihoods of rural inhabitants are complex and dynamic, including a variety of activities that enhance household income and provide basic assets needed to thrive [64]. The livelihood strategies within the study region include both natural resource based activities (farming, fishing, hunting, and tourism) and non-natural resourced based activities (governmental positions). Arntzen [49] notes that most assets of social, physical, and financial nature have expanded or improved within the Botswana portion of the study area. Livelihood assets related to education, infrastructure, and other social capital seem to be improving or not posing a risk as compared to other risk categories. Such improvements are not only asserted by Arntzen [49] but in this study as well. As seen in Figure 2, the aforementioned variables are not perceived as great sources of risk. However it is noted in the literature and shown in this work that risks are still hindering the region. Arntzen [49] points out the growing reliance on government support, greater climate variability, limited employment opportunities outside of agriculture and resource use, and the effect of HIV/AIDS as the key trends hindering livelihood development. In this study we conclude that those residing in the villages perceive these same variables as risks to their livelihoods.
The livelihood assets perceived at greatest risk differed between the wage labor and subsistence-based households. The subsistence subset indicates that weather/water and animals are some of the greatest threats to livelihoods. Droughts, floods, and animal raiding result in loss of crops or natural products. For the subsistence households, even with low yields or loss of natural products, they are still reliant on this livelihood approach as there are no real alternatives [61]. Other than agricultural production, the subsistence-based households look to multiple sources of income generation, which includes piecework and government subsidies. Additionally, perceived sources of risk for the subsistence subset understandably came from the employment category. For those subsistence households surveyed, the lack of steady income combined with threats to agricultural production via environmental sources of risk has resulted in food insecurity. Hunger is not only reported as a risk to livelihoods but survey results indicate that households in all villages surveyed exhibited between two and five months of hunger each year.

3.2.2. Effects of Gender

Gender is a socio-economic variable that is commonly used to analyze roles, opportunities, constraints, and responsibilities within households [65]. Within the study area, as in other developing regions, men are traditionally seen as the providers to the household [66]. Such traditional roles lead to men associating livelihood risk with events outside the home, while women perceive greater risk related more to the community and household [66]. Within the surveyed villages this traditional household dynamic, while still the most commonly associated household structure, is changing. The traditional role of women is changing in order to provide for the household and to develop a sustainable livelihood. Women tend to be responsible for the family’s small farming plot, which provides the main source of nutrition to the household, but there have also been an increased number of women seeking wage labor outside the household [27,67,68,69].
Risk via natural sources (i.e., weather/water and animals) consistently had some of the highest incidence and severity index values. Both men and women found this category to pose a great risk to livelihoods, with men perceiving it as a slightly greater risk than women. However, the reasoning for the responses relates back to the differing roles of gender within the villages. Within southern Africa, the vast majority of land rights are secured by men for cultivation, potentially leading to natural assets being perceived at great risk [70]. Therefore, responses from men related to floods, drought, and other sources of climate variability could indicate potential risks to these lands and damage to livelihood activities. Furthermore, the possession of land rights and reliance on subsistence agriculture for a family’s livelihood could account for the male subset perceiving animals as a great problem. The utilization of lands by females within the rural villages is changing, as cultivation of land becomes a family activity. Throughout the entire study area, natural resources are used and extracted by males and females for housing materials, crafting, and consumption.
With a shift in the employment base, as more women seek wage labor, it is fitting that employment issues are perceived as concerns to the livelihoods in female headed households. The survey data indicates that common jobs among women in the study area include employment with the trust or conservancy, and tourism-related work such as in a lodge or as a shopkeeper. The distance that wage labor puts between the employed member and the households varies depending on numerous factors including the level of education obtained and the distance to market access from the village. Many households explained during the survey that it is common to work several months at a job far from home, at lodges or safari camps, and then return home for several weeks to a month. This out-migration from the household is becoming more common for women. Traditionally in rural households of Botswana and Namibia the out-migration of men for employment resulted in a relatively high proportion of female led households, this paradigm is shifting [71,72].
The gender effects are less evident in the other risk categories. For example, the effects of social change show no gender effects as both male and female-led households produce approximately the same risk index values in the categories of government support, schools, and clinics. The low risk index values indicate that very few households were concerned with a lack of social capital or assets. The reasoning for these low risk index values could relate back to the economic success within much of the study area. As previously mentioned, Botswana has extensive social programs to help both rural and urban inhabitants. While the economic prosperity of this country is skewed toward those residing in urban regions [61], households in rural areas also receive subsidies. Additionally, physical infrastructure development has occurred across rural and urban areas resulting in more continuous road networks, schools, and clinics.

3.2.3. Research Limitation

While studies on risk perception have the potential for great impact on household, community, and government decision making, it should be noted that this initial study only captures one snapshot in time. Risk studies of this nature give insight into community management and national policy of the region, as there are a great variety of responses at the household levels, which when scaled up can highlight the perceived threats of a village or larger region. For a more sound understanding of village dynamics and the perceived risks to livelihoods, this approach would need to utilize a time series of surveys. While our study showed variability in perceptions across space, repeated surveys could discern temporal variation as well. For example, after the initial field season in 2010 a subsequent trip was made to the OCT region of Botswana during 2011. Within this timeframe, electricity and cell phone infrastructure had been put in place. These new technologies would undoubtedly change the responses given on livelihood surveys, but more importantly, improve the livelihoods of those residing in the region. Furthermore, at the time of our initial survey, flooding was occurring in several villages (Eretsha and Beetsha). Given the proximity to the Okavango delta, this is a common occurrence. Adding a temporal aspect to this study would better illustrate the true risks and perceptions of risk in this region of the world.

4. Conclusions

This paper draws on concepts of sustainable livelihood development, risk, and resilience in the analysis of perceived vulnerability in seven villages across the arid and semi-arid landscapes of southern Africa. Participatory risk mapping demonstrated variables that households viewed as most influential or risky to their livelihoods. Overall, more than 50% of those surveyed said they have equal or greater prosperity than five years ago. This may explain why, when aggregated to the entire sample size of 330 surveys, no single survey response had an R-value greater than 0.50. The heterogeneity of risk perception across surveyed villages results from the differing environmental, social, and political conditions; meaning that at the village level perceptions of risk associated with certain categories maybe greater than at the regional scale. As seen in Table 4, water/weather risks had an overall risk index value of 0.326, however several villages greatly exceeded this score. In Satau and Eretsha the R-index scores exceeded 0.50, which can be explained at least in OCT by the seasonal flooding that was occurring at the time surveys were conducted. The second response with the highest R-values was associated with financial livelihood assets. Across all villages, employment had an R-value of 0.3, but the villages of Seronga and Wuparo exceeded this index value. Justification for these two village’s R-values could relate to their distance to the closest market or employment source.
Based on reviews of the literature and the findings of this analysis, the region sampled is diversifying their livelihood strategies in order to develop more sustainable livelihoods [2,49]. Such developmental trends look to mitigate the effects of common shocks or stresses in the region, especially climate variability, lack of employment, and financial instability. While livelihood diversification is a strong underpinning in sustainable livelihood development, this area’s dependence on natural resources puts households at risk. The perception analysis utilized in this study illustrates the combined influence of environmental condition or change, and socio-economic institutions in determining a household’s ability to create more resilient livelihood outcomes.
Though the risk analysis discussed in this present study lacks a temporal aspect, there are still applications of the results in terms of adaptive capacity of communities and management. Through our survey approach, focus groups, and this paper’s perception analysis, it is clear that key issues in these communities are related to natural and financial livelihood assets. This research supports the view that strong narratives on climate exist in the local communities [73]. While adaptive measures directly related to climate-related vulnerability are found, they appear less important in shaping rural livelihood strategies than adaption to economic factors [73]. In terms of policy implications, it appears best to exercise caution before implementing adaptation solutions that may not minimize local sources of risk identified in this study. The sensible focus on economic development and adaptive measures to mitigate climate vulnerability appear to be the most successful/ideal approaches to minimize household risk and to develop sustainable livelihood approaches.

Acknowledgments

There are multiple people and organizations that made this publication possible and the authors wish to express their gratitude. The authors wish to acknowledge the other PIs on the project: Peter Waylen, Michael Binford, Youliang Qui, Greg Kiker, and Rafa Mundoz-Carpena. Additionally, tremendous gratitude is expressed to the numerous research assistants in Botswana and Namibia. This research was made possible by funding from the NASA LCLUC program; proposal NNX09AI25G: Understanding and Predicting the Impact of Climate Variability and Climate Change on Land Use and Land Cover Change Via Socio-Economic Institutions in Southern Africa. Additional funding was received from the National Science Foundation GK12 SPICE program, the University of Florida Center for African Studies, University of Florida College of Liberal Arts and Science, and the University of Florida Department of Geography.

Conflict of Interest

The authors declare no conflict of interest.

References

  1. Baird, T.D.; Leslie, P.W.; McCabe, J.T. The effect of wildlife conservation on local perceptions of risk and behavioral response. Hum. Ecol. 2009, 37, 463–474. [Google Scholar] [CrossRef]
  2. Sallu, S.M.; Twyman, C.; Stringer, L. Resilient or vulnerable livelihoods? Assessing livelihood dynamics and trajectories in rural botswana. Ecol. Soc. 2010, 15, 3. [Google Scholar]
  3. Scoones, I. Hazards and Opportunities. Farming Livelihoods in Dryland Africa: Lessons from Zimbabwe; Zed Books: London, UK, 1996. [Google Scholar]
  4. Twyman, C. Natural resource use and livelihoods in Botswana’s wildlife management areas. Appl. Geogr. 2001, 21, 45–68. [Google Scholar] [CrossRef]
  5. Sporton, D.; Thomas, D.S.G. Sustainable Livelihoods in Kalahari Environmental—A Contribution to Global Debates; Oxford University Press: Oxford, UK, 2002. [Google Scholar]
  6. Sallu, S.M.C.; Twyman, C.; Thomas, D.S.G. The multidimensional nature of biodiversity and social dynamics and implications for contemporary rural livelihoods in remote kalahari settlements, Botswana. J. Ecol. 2009, 47, 1–9. [Google Scholar]
  7. Carney, D. Implementing the Sustainable Rural Livelihoods Approach. In Sustainable Rural Livelihoods: What Contribution Can We Make? Department for International Development: London, UK, 1998. [Google Scholar]
  8. Walker, B.; Anderies, J.; Kinzig, A.; Ryan, P. Exploring resilience in socio-ecological system through comparative studies and theory development. Ecol. Soc. 2006, 11, 12. [Google Scholar]
  9. Leach, M.; Scoones, I.; Stirling, A. Pathways to Sustainability: An Overview of the STEPS Centre Approach; STEPS Centre: Brighton, UK, 2007. [Google Scholar]
  10. Misselhorn, A.A. What drives food insecurity in Southern Africa? A meta-analysis of household economy studies. Glob. Environ. Change 2005, 15, 33–43. [Google Scholar] [CrossRef]
  11. O’Brien, K.; Leichenk, R.; Kelkar, U.; Venema, H.; Aandahl, G.; Tompkinsa, H.; Javedc, A.; SuruchiBhadwal, S. Mapping vulnerability to multiple stressors. Glob. Environ. Change 2004, 14, 303–313. [Google Scholar] [CrossRef]
  12. O’Brien, K.; Sygna, L.; Haugen, J.E. Vulnerable or resilient? A multi-scale assessment of climate impacts and vulnerability in Norway. Clim. Change 2004, 64, 193–225. [Google Scholar] [CrossRef]
  13. Ellis, F. Rural Livelihoods and Diversity in Developing Countries; Oxford University Press: Oxford, UK, 2000. [Google Scholar]
  14. Wisner, B.; Blakie, P.; Cannon, T.; Savis, I. At Risk: Natural Hazards, People’s Vulnerability and Disasters, 2nd ed; Routledge: London, UK, 2004. [Google Scholar]
  15. O’Brien, K.; Syna, L.; Naess, L.O.; Kingamkono, R.; Hochobeb, B. Is Information Enough? User Responses to Climate Forecasts in Southern Africa; Report to the World Band; AFTE1-ENVGC; Center for International Climate and Environmental Research: Blindern, Norway, 2000. [Google Scholar]
  16. Reid, P.; Vogel, C. Living and responding to multiple stressors in South Africa—Glimpses from KwaZulu-Natal. Glob. Environ. Change 2006, 16, 195–206. [Google Scholar] [CrossRef]
  17. Eakin, H. Smallholder maize production and climatic risk: A case study from Mexico. Clim. Change 2000, 45, 19–36. [Google Scholar] [CrossRef]
  18. Eakin, H.; Luers, A.L. Assessing the vulnerability of social-environmental systems. Ann. Rev. Environ. Resour. 2006, 31, 365–394. [Google Scholar] [CrossRef]
  19. Adger, N.W. Social vulnerability to climate change and extremes in coastal Vietnam. World Dev. 1999, 27, 249–269. [Google Scholar] [CrossRef]
  20. Turner, B.L.; Kasperson, R.E.; Matson, P.A.; McCarthy, J.J.; Corell, R.W.; Christensen, L.; Eckley, N.; Kasperson, J.X.; Luers, A.; Martello, M.L.; et al. A framework for vulnerability analysis in sustainability science. Proc. Natl. Acad. Sci. USA 2003, 100, 8074–8079. [Google Scholar] [CrossRef]
  21. Kates, R.W.; Kasperson, J.X. Comparative risk analysis of technological hazards (a review). Proc. Natl. Acad. Sci. USA 1983, 80, 7027–7038. [Google Scholar] [CrossRef]
  22. McLeod, R. The Impact of Regulations and Procedures on the Livelihoods and Assets Base of the Urban Poor—A Financial Perspective. In Proceedings of the International Workshop on Regulatory Guidelines for Urban Upgrading, Warwickshire, UK, 17–18 May 2001.
  23. Walker, R.; Perz, S.; Caldas, M.; Silva, L.G.T. Land use and land cover change in forest frontiers: The role of household life cycles. Int. Reg. Sci. Rev. 2002, 25, 169–199. [Google Scholar]
  24. Brockington, D. Fortress Conservation: The Preservation of the Mkomazi Game Reserve, Tanzania; Indiana University Press: Bloomington, IN, USA, 2002. [Google Scholar]
  25. Campbell, D.J. Response to drought among farmers and herders in Southern Kajiado District, Kenya: A comparison of 1972–1976 and 1994–1995. Hum. Ecol. 1999, 27, 377–416. [Google Scholar] [CrossRef]
  26. Smith, K.; Barrett, C.B.; Box, P.W. Participatory risk mapping for targeting research and assistance: With an example from East African Pastoralists. World Dev. 2000, 28, 1945–1959. [Google Scholar] [CrossRef]
  27. Quinn, C.H.; Huby, M.; Kiwasila, H.; Lovett, J.C. Local perceptions of risk to livelihood in semi-arid Tanzania. J. Environ. Manag. 2003, 68, 111–119. [Google Scholar] [CrossRef]
  28. Alessa, L.; Kliskey, A.A.; Williams, P.; Barton, M. Perception of change in freshwater in remote resource-dependent arctic communities. Glob. Environ. Change 2008, 18, 153–164. [Google Scholar]
  29. Berkes, F.; Jolly, D. Adapting to climate change: Social-Ecological resilience in a canadian western arctic community. Conserv. Ecol. 2001, 5, 18. [Google Scholar]
  30. Lybbert, T.J.; Barrett, C.B.; McPeak, J.G.; Luseno, W.K. Bayesian herders: Updating of rainfall beliefs in response to external forecasts. World Dev. 2007, 35, 480–497. [Google Scholar] [CrossRef]
  31. Gunderson, L.H.; Holling, C.S. Panarchy: Understanding Transformations in Human and Natural Systems; Island Press: Washington, DC, USA, 2002. [Google Scholar]
  32. Cernea, M.M.; Schmidt-Soltau, K. Poverty risks and national parks: Policy issues in conservation and resettlement. World Dev. 2006, 34, 1808–1830. [Google Scholar] [CrossRef]
  33. Huntley, B.J.; Walker, B.H. Introduction in Ecology of Tropical Savannas. In Ecology of Tropical Savannas; Springer: London, UK, 1982; pp. 1–20. [Google Scholar]
  34. Scholes, R.J.; Walker, B.H. An African Savanna: Synthesis of the Nylsvley Study; Cambridge University Press: Cambridge, UK, 1993. [Google Scholar]
  35. Scholes, R.J.; Dowty, P.R.; Caylor, K.; Parsons, D.A.B.; Frost, P.G.H.; Shugart, H.H.; et al. Trends in savanna structure and composition along an aridity gradient in the kalahari. J. Veg. Sci. 2002, 13, 419–428. [Google Scholar] [CrossRef]
  36. Sankaran, M.; Hanan, N.P.; Scholes, R.J.; Ratnam, J.; Augustine, D.J.; Cade, B.S.; Gignoux, J.; Higgins, S.I.; Le Roux, X.; Ludwig, F.; et al. Determinants of woody cover in African Savannas. Nature 2005, 438, 846–849. [Google Scholar] [CrossRef]
  37. Noy-Meir, I. Stability of grazing system: An application of predator-prey graphs. J. Ecol. 1975, 63, 459–481. [Google Scholar] [CrossRef]
  38. Walker, B.H.; Noy-Meir, I. Aspects of Stability and Resilience of Savanna Ecosystems. In Ecology of Tropical Savannas; Springer Verlag: Berlin, Germany, 1982; pp. 556–590. [Google Scholar]
  39. Lamprey, H. Pastoralism Yesterday and Today: The Overgrazing Problem. In Tropical Savannas; Elsevier: Amsterdam, The Netherland, 1983; pp. 643–666. [Google Scholar]
  40. Dublin, H.T.; Sinclair, A.R.; McGlade, J. Elephants and fire as causes of multiple stable states in the serengeti-mara woodlands. J. Anim. Ecol. 1990, 59, 1147–1164. [Google Scholar] [CrossRef]
  41. Wolski, P.; Savenije, H. Dynamics of surface and groundwater interactions in the floodplain system of the Okavango Delta, Botswana. J. Hydrol. 2006, 320, 283–301. [Google Scholar] [CrossRef]
  42. Mwalyosi, R.B.B. Land-Use changes and resource degradation in South-West Masailand, Tanzania. Environ. Conserv. 1992, 19, 145–152. [Google Scholar] [CrossRef]
  43. Gibbes, C.; Keys, E. The illusion of equity: An examination of community based natural resource management inequality in Africa. Geogr. Compass 2010, 4, 1324–1338. [Google Scholar] [CrossRef]
  44. Ostrom, E. Governing the Commons: The Evolution of Institutions for Collective Action; Cambridge University Press: Cambridge, UK, 1990. [Google Scholar]
  45. Bromley, D.W. The commons, common property, and environmental policy. Environ. Resour. Econom. 1992, 2, 1–17. [Google Scholar] [CrossRef]
  46. Murphee, M.W. Communities as Resource Management Institution; International Institute for Environment and Development: Maputo, Mozambique, 1993. [Google Scholar]
  47. Tschakert, P. Views from the vulnerable: Understanding climatic and other stressors in the Sahel. Glob. Environ. Change 2007, 17, 381–396. [Google Scholar] [CrossRef]
  48. Hahn, M.B.; Riederer, A.M.; Foster, S.O. The livelihood vulnerability index: A pragmatic approach to assessing risks from climate variability and change—A case study in Mozambique. Glob. Environ. Change 2009, 19, 74–88. [Google Scholar] [CrossRef]
  49. Arntzen, J. Livelihood and Biodiversity in the Okavango Delta, Botswana; Report Prepared for the PDF-B Stage of the GEF Project; Gaberone, Botswana, 2005. [Google Scholar]
  50. Hara, S.; Mantua, N. Empirical evidence for North Pacific regime shifts in 1977 and 1989. Progr. Oceanogr. 2000, 47, 103–145. [Google Scholar] [CrossRef]
  51. Mason, S.J.; Goodard, L. Probabilistic precipitation anomalies associated with ENSO. Bull. Amer. Meteorol. Soc. 2001, 82, 619–638. [Google Scholar] [CrossRef]
  52. Chavez, F.P.; Ryan, J.; Lluch-Cota, S.E.; Niquen, M. From anchovies to sardines and back: Multidecadal change in the Pacific Ocean. Science 2003, 299, 217–221. [Google Scholar] [CrossRef]
  53. Shi, G.; Ribbe, J.; Cai, W.; Cowan, T. Multidecadal variability in the transmission of ENSO signals to the Indian Ocean. Geophys. Res. Lett. 2007, 34, L09706. [Google Scholar]
  54. Parry, M.L.; Canziani, O.F.; Palutikof, J.P.; van der Linden, P.J.; Hanson, C.E. Climate Change 2007: Impacts, Adaptation and Vulnerability—Contribution of Working Group II to the Fourth Assessment Report of the International Panel on Climate Change; Cambridge University Press: Cambridge, UK, 2007; p. 976. [Google Scholar]
  55. Roques, K.G.; O’Connor, T.G.; Watkinson, A.R. Dynamics of shrub encroachment in an African savanna: Relative influences of fire, herbivory, rainfall and density dependence. J. Appl. Ecol. 2001, 38, 268–280. [Google Scholar] [CrossRef]
  56. Jeltsch, F.; Milton, S.J.; Dean, W.R.J.; van Rooyen, N. Analyzing shrub encroachment in the Southern Kalahari: A grid-based modeling approach. J. Appl. Ecol. 1997, 34, 1497–1508. [Google Scholar] [CrossRef]
  57. Skarpe, C. Structure of the woody vegetation in disturbed and undisturbed Arid Savanna, Botswana. Vegetation 1990, 87, 11–18. [Google Scholar] [CrossRef]
  58. Tarhule, A.; Lam, P.J. Climate research and seasonal forecasting for West Africans. Bull. Am. Meteorol. Soc. 2003, 84, 1741–1759. [Google Scholar] [CrossRef]
  59. Holm, J.; Morgan, R. Coping with drought in Botswana: An African success. J. Modern Afr. Stud. 1985, 23, 463–482. [Google Scholar] [CrossRef]
  60. Teklu, T. The prevention and mitigation of famine: Policy lessons from Botswana and Sudan. Disasters 1994, 18, 35–47. [Google Scholar] [CrossRef]
  61. Wikan, G. Cash, Crops, and Cattle: A Study of Rural Livelihoods in Botswana. Available online: http://www.fulltekst.bibsys.no/hihm/rapport/2001/07/rapp07_2001.pdf (accessed on 1 May 2012).
  62. Datta, K. Rural homes and urban dwellings? Gender, migration and the importance of tenure in Gaberone, Botswana. Int. J. Popul. Geogr. 1995, 1, 183–195. [Google Scholar] [CrossRef]
  63. Cassidy, L. Anthropogenic Burning in the Okavango Panhandle of Botswana: Livelihoods and Spatial Dimensions. M.Sc. Thesis, University of Florida, Gainesville, FL, USA, 2003. [Google Scholar]
  64. Shackleton, C.M.; Shackleton, S.E.; Cousins, B. The role of land-based strategies in Rural Livelihoods: The contribution of arable production, animal husbandry and natural resource harvesting in communal areas in South Africa. Dev. S. Afr. 2001, 18, 581–604. [Google Scholar] [CrossRef]
  65. Oladele, O.; Monkhei, M. Gender Ownership Patterns of Livestock in Botswana. 2008. Available online: http://www.lrrd.org/lrrd20/10/olad20156.htm (accessed on 1 May 2012).
  66. Narayan, D.; Chambers, R.; Shah, K.; Petesch, P. Chapter 6. Gender Relations in Troubled Transition. In Voices of the Poor: Crying out for Change; Oxford University Press for the World Bank: New York, NY, USA, 2000; pp. 45–70. [Google Scholar]
  67. Narayan, D.; Schafft, K.; Patel, R.; Rademacher, A.; Koch-Schulte, S. Chapter 8. Anxiety, Fear, and Insecurities. In Voices of the Poor. Can Anyone Hear US? Voices from 46 Countries; The World Bank: Washington, DC, USA, 2000. [Google Scholar]
  68. Soussan, J. Water/Irrigation and Sustainable Rural Livelihoods. In Sustainable Rural Livelihoods: What Contribution Can We Make? Department for International Development: London, UK, 1998; pp. 191–196. [Google Scholar]
  69. Tourton, C. Enhancing Livelihoods through Participatory Watershed Development in India; ODI Working Papers Series 131; Overseas Developmental Institute: London, UK, 2000. [Google Scholar]
  70. Adams, M.; Sibanda, S.; Turner, S. Land Tenure Reform and Rural Livelihoods in Southern Africa. In Evolving Land Rights, Policy and Tenure in Africa; Toulmin, C., Quan, J., Eds.; Overseas Development Institute: London, UK, 1999; Volume 39. [Google Scholar]
  71. Van Hoof, P.J.M.; Kirkels, M.; Riezebos, H. Ngamiland District CSDA (Western Part)—Socio-Economic Baseline Survey and Land Suitability Analysis. University of Utrecht: Utrecht, the Netherlands, 1991; p. 114. [Google Scholar]
  72. Van Hoof, P.J.M.; Kirkels, M.; Riezebos, H. Ngamiland District CSDA (Eastern Part)—Socio-Economic Baseline Survey and Land Suitability Analysis. University of Utrecht: Utrecht, the Netherlands, 1993; p. 195. [Google Scholar]
  73. Mertz, O.; Mbow, C.; Reenberg, A.; Diouf, A. Farmers’ perceptions of climate change and agricultural adaptation strategies in Rural Sahel. Environ. Manag. 2009, 43, 804–816. [Google Scholar]

