Article

Land Cover Change Detection in Ulaanbaatar Using the Breaks for Additive Seasonal and Trend Method

1
Graduate School of Global Environmental Studies, Kyoto University, Yoshida-honmachi, Sakyo-ku, Kyoto 606-8501, Japan
2
Natural Sciences Cluster, Kochi University, 200 Monobe-otsu, Nankoku, Kochi 783-8502, Japan
3
Research Institute for Global Change, Japan Agency for Marine-Earth Science and Technology, 3173-25 Showa-machi, Kanazawa-ku,Yokohama 236-0001, Japan
*
Author to whom correspondence should be addressed.
Land 2013, 2(4), 534-549; https://doi.org/10.3390/land2040534
Submission received: 20 August 2013 / Revised: 11 September 2013 / Accepted: 5 October 2013 / Published: 11 October 2013

Abstract

:
Ulaanbaatar, the capital of Mongolia, has expanded rapidly over the past decade. Insufficient authority is in place to address this expansion, and many residential plots have been developed in the peripheral regions of the city. The aim of this study is to estimate changes in land cover within the central part of Ulaanbaatar, which has been affected by anthropogenic disturbances. The breaks for additive seasonal and trend (BFAST) method is a powerful tool for implementing this study because it is able to robustly and automatically derive the timing and locations of land cover changes from spatio-temporal datasets. We applied the BFAST method for the first time to urban expansion analysis, with NDVI time series calculated from MODIS (MOD09A1 product) during the period 2000–2010. The results show that land cover has changed across 22.51% of the study area, and that the change occurs at a later time with increasing distance from the city center. Bi-temporal high-resolution satellite images of a sample area in 2000 and 2008 confirmed that the detection of land cover changes by BFAST corresponds to areas in which residential development is dominant. This study demonstrates that BFAST is an effective method for monitoring urban expansion. In addition, it increases the applicability of NDVI time series.

1. Introduction

Rapid urbanization is a paramount issue in global development, and must be continually monitored and controlled. The United Nations forecast a rise in the global population from 7 billion in 2011 to more than 8 billion in 2030, with 60 percent of this population concentrated in urban areas [1]. On average, urban areas are expanding twice as fast as the population is growing [2,3]. Urban areas are economic, social, cultural, and political centers that serve as the hub of regional development [4], but substantial urban development comes at a price, with haphazard expansion affecting environmental sustainability in and around urban areas. This phenomenon threatens biodiversity [5,6], drives land cover changes, potentially resulting in environmental degradation such as the loss of farmland [7,8], and also the loss of natural resources [9,10]. From the perspective of human habitation, one of the most crucial problems faced by developing countries is the rapid growth of informal settlements in peripheral regions [11,12]. Such informal settlements develop without planning controls, and the basic infrastructure required for living is significantly lacking [12].
As with other capital cities in developing countries, Ulaanbaatar, the capital of Mongolia, has rapidly expanded in parallel with an increase in population, causing critical development issues [13]. Mongolia experienced a drastic transition from a central planning system to a market-based economy in the 1990s. Following a change in policy that previously restricted internal migration, many Mongolians moved from rural areas to Ulaanbaatar seeking employment, an income and education, and to seek a better standard of living [14,15]. By 2010, Mongolia’s population had doubled from 0.58 million in 1992, and 41% of the total population was concentrated in Ulaanbaatar, with overspill into grasslands surrounding the urbanized area [16]. Many residential plots have developed rapidly in the peripheral regions, and are called “ger-areas”. These areas comprise formal and informal residential plots characterized by newly-built detached houses and the construction of “gers”, which are traditional Mongolian dwellings designed for a nomadic lifestyle, built easily from wood, and covered with felt. This type of development has a unique feature, in that most residential plots are surrounded by wooden fences, called “khashaas” (see Figure 1) [17]. Migrants typically claim open land, build khashaas at the property boundary, and finally build a ger or a detached house on the enclosed land [18].
The main reason for the unrestricted development of these ger-areas is the clash of two different legislation frameworks for land management: between the current master plan and the land reform policy. The current master plan of Ulaanbaatar was developed in 2002, and it seeks to challenge the legitimacy and permanency of these regions, which are viewed as being available only for temporary land use, while the land reform seeks to give the ger-areas formal, permanent, and legal status [15]. The master plan has been criticized for having insufficient authority to implement directives, and its apparent inability to address the rapid population growth and expansion of ger-areas [15]. In apparent opposition to the master plan, the land reform policy, introduced in 2003 to accelerate the development of a free market economy, has allowed Mongolians to own land and to hold renewable, inheritable, and tradable long-term ownership rights for the first time in Mongolian history [19,20]. The land reform policy stipulates that each household is allowed to privatize and possess one plot of land at no cost until 2018. As a result of this stipulation, residential plots have become prevalent, particularly in the city’s fringes; and 60% of the population of Ulaanbaatar now lives in these peripheral areas [13,15,21].
Figure 1. Residential plots surrounded by khashaas in the ger-area.
Land 02 00534 g001
In managing the rapid urban expansion of cities in developing countries, any development needs to be planned and properly monitored in order to maintain internal equilibrium through the sustainable management of natural resources [22]. Appropriate strategies for managing urban expansion must be identified and effectively employed [2]. It is therefore clear that an analysis of urban expansion would assist regional planners and decision-makers in understanding growth patterns, thereby allowing plans to be made that include certain essential infrastructures [23]. Detecting and characterizing changes in land cover is a natural first step towards identifying and understanding the drivers and mechanisms for such change [23].
Many techniques have been developed to detect and analyze land cover change and apply the methods to different regions. The most popular techniques are post-classification comparison, principal component analysis (PCA), and wavelet decomposition [23,24,25,26,27,28,29,30,31,32,33,34,35]. The post-classification comparison technique is used to compare images in which the land use/cover has been classified between different periods, by using high-resolution satellite images such as those from Landsat and SPOT. This method is widely used [27,28,29,30], however some pre-processing of the images is necessary due to differences between observing sensors, serious effects of atmospheric disturbances, missing data due to clouds and shadows, and correction of inaccurately observed time spans. PCA is a simple and effective technique for enhancing information about change. However, it usually neglects seasonal variation by intentionally summarizing time series data (e.g., yearly composite images), resulting in the loss temporal change information [25,31,32,33]. In comparison, wavelet decomposition, normally using vegetation indices like the normalized difference vegetation index (NDVI), which is the most commonly used measure of vegetation, is a useful basis for the development of a land cover change analysis [26,34,35]. However, until recently, one of the main problems associated with the application of this technique was that it required the determination of several thresholds [26,34,35], and it often led to misleading outputs, caused by the different spectral and phenological characteristics of differing land cover types [23].
Therefore, a new approach is proposed, using the Breaks For Additive Seasonal and Trend (BFAST) method, which is a type of wave decomposition technique [23] developed to overcome the limitations of the methods described above. It is much more useful in estimating land cover change than other techniques, because it is able to robustly and automatically derive both the time and location of land cover changes from NDVI time series, without needing to select a reference period, set thresholds, or define a change trajectory [23,36]. To apply this method, high-level MODIS products are useful. These are provided freely by NASA and have been atmospherically corrected to yield surface reflectance data. They are gridded into a map projection with temporal periods of a high frequency [37]. These datasets have been applied by several pieces of urban expansion research in the analysis and implementation of land cover detection [34,37,38]. Although the BFAST method has been shown to be useful, it has not previously been used in an urban expansion analysis. We propose that it could be applied widely and should therefore be made more available, to allow it to be a practical tool for urban planners when monitoring urban expansion. A robust and feasible method is needed to estimate land cover change in Ulaanbaatar in particular, because urban expansion is rapidly accelerating in this developing city. The aim of this study, therefore, is to estimate changes in land cover in Ulaanbaatar using the BFAST method, and to explore the capacity of the BFAST method to be a tool for urban expansion analysis.

2. Materials and Methods
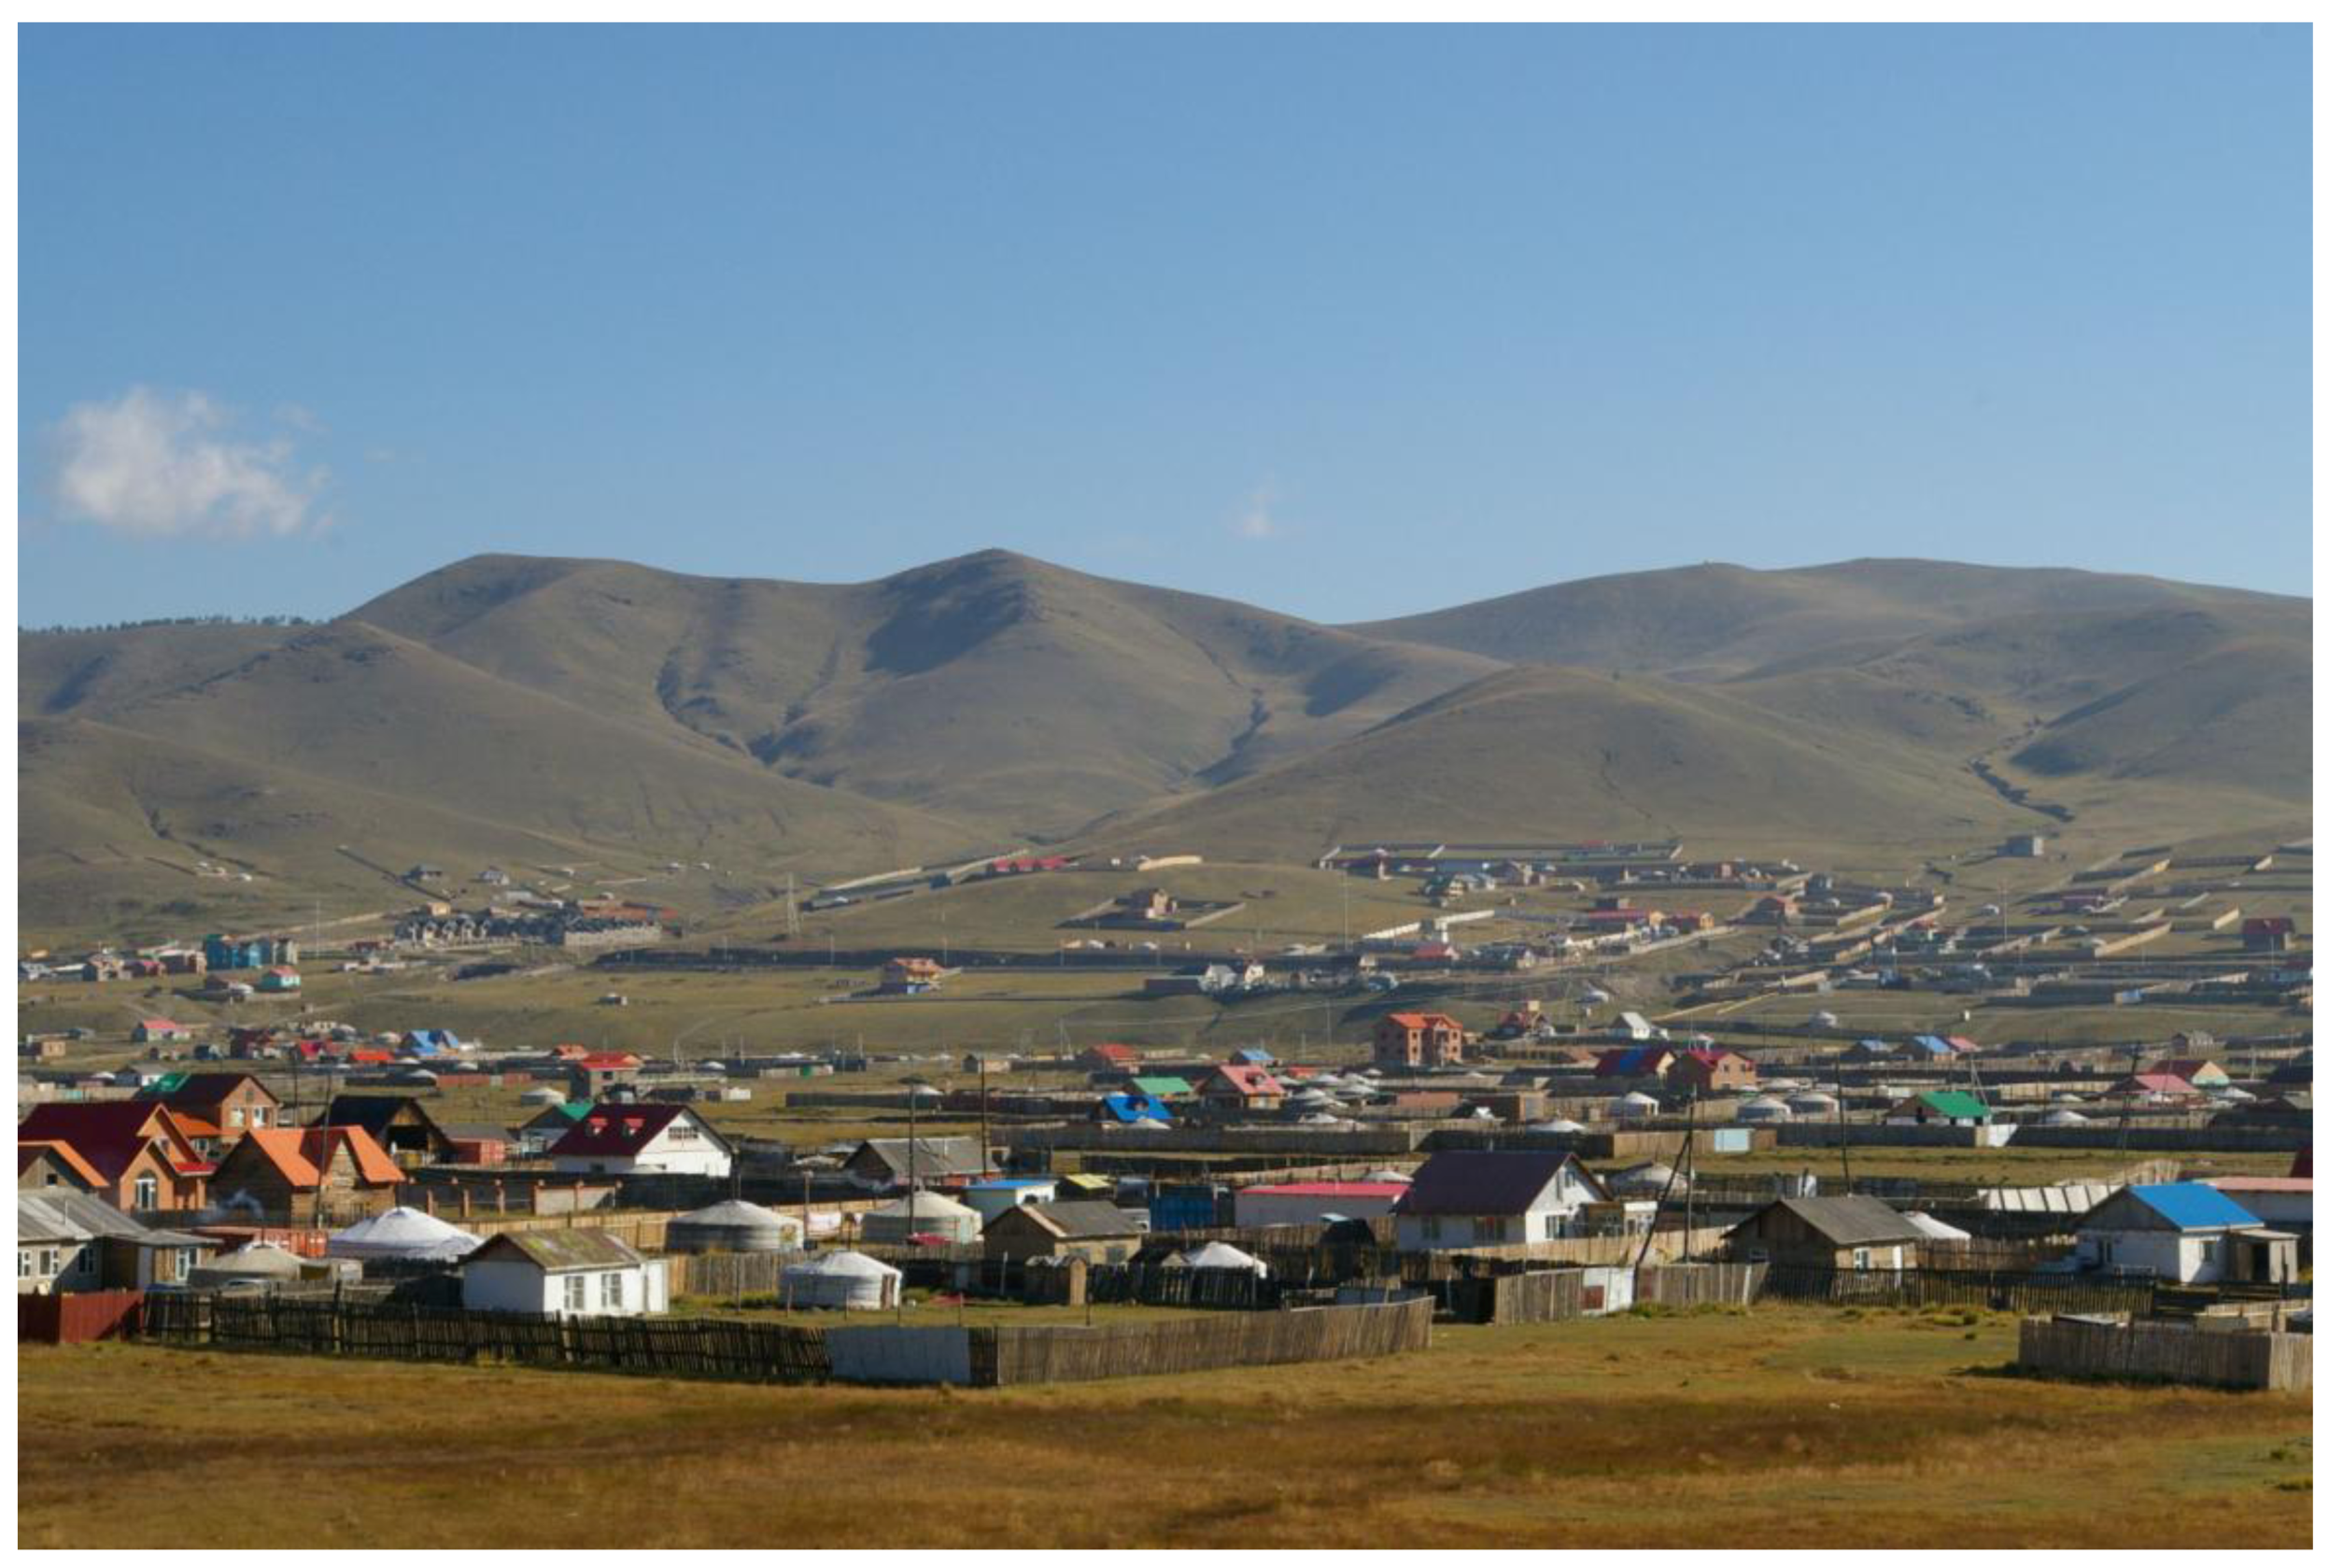
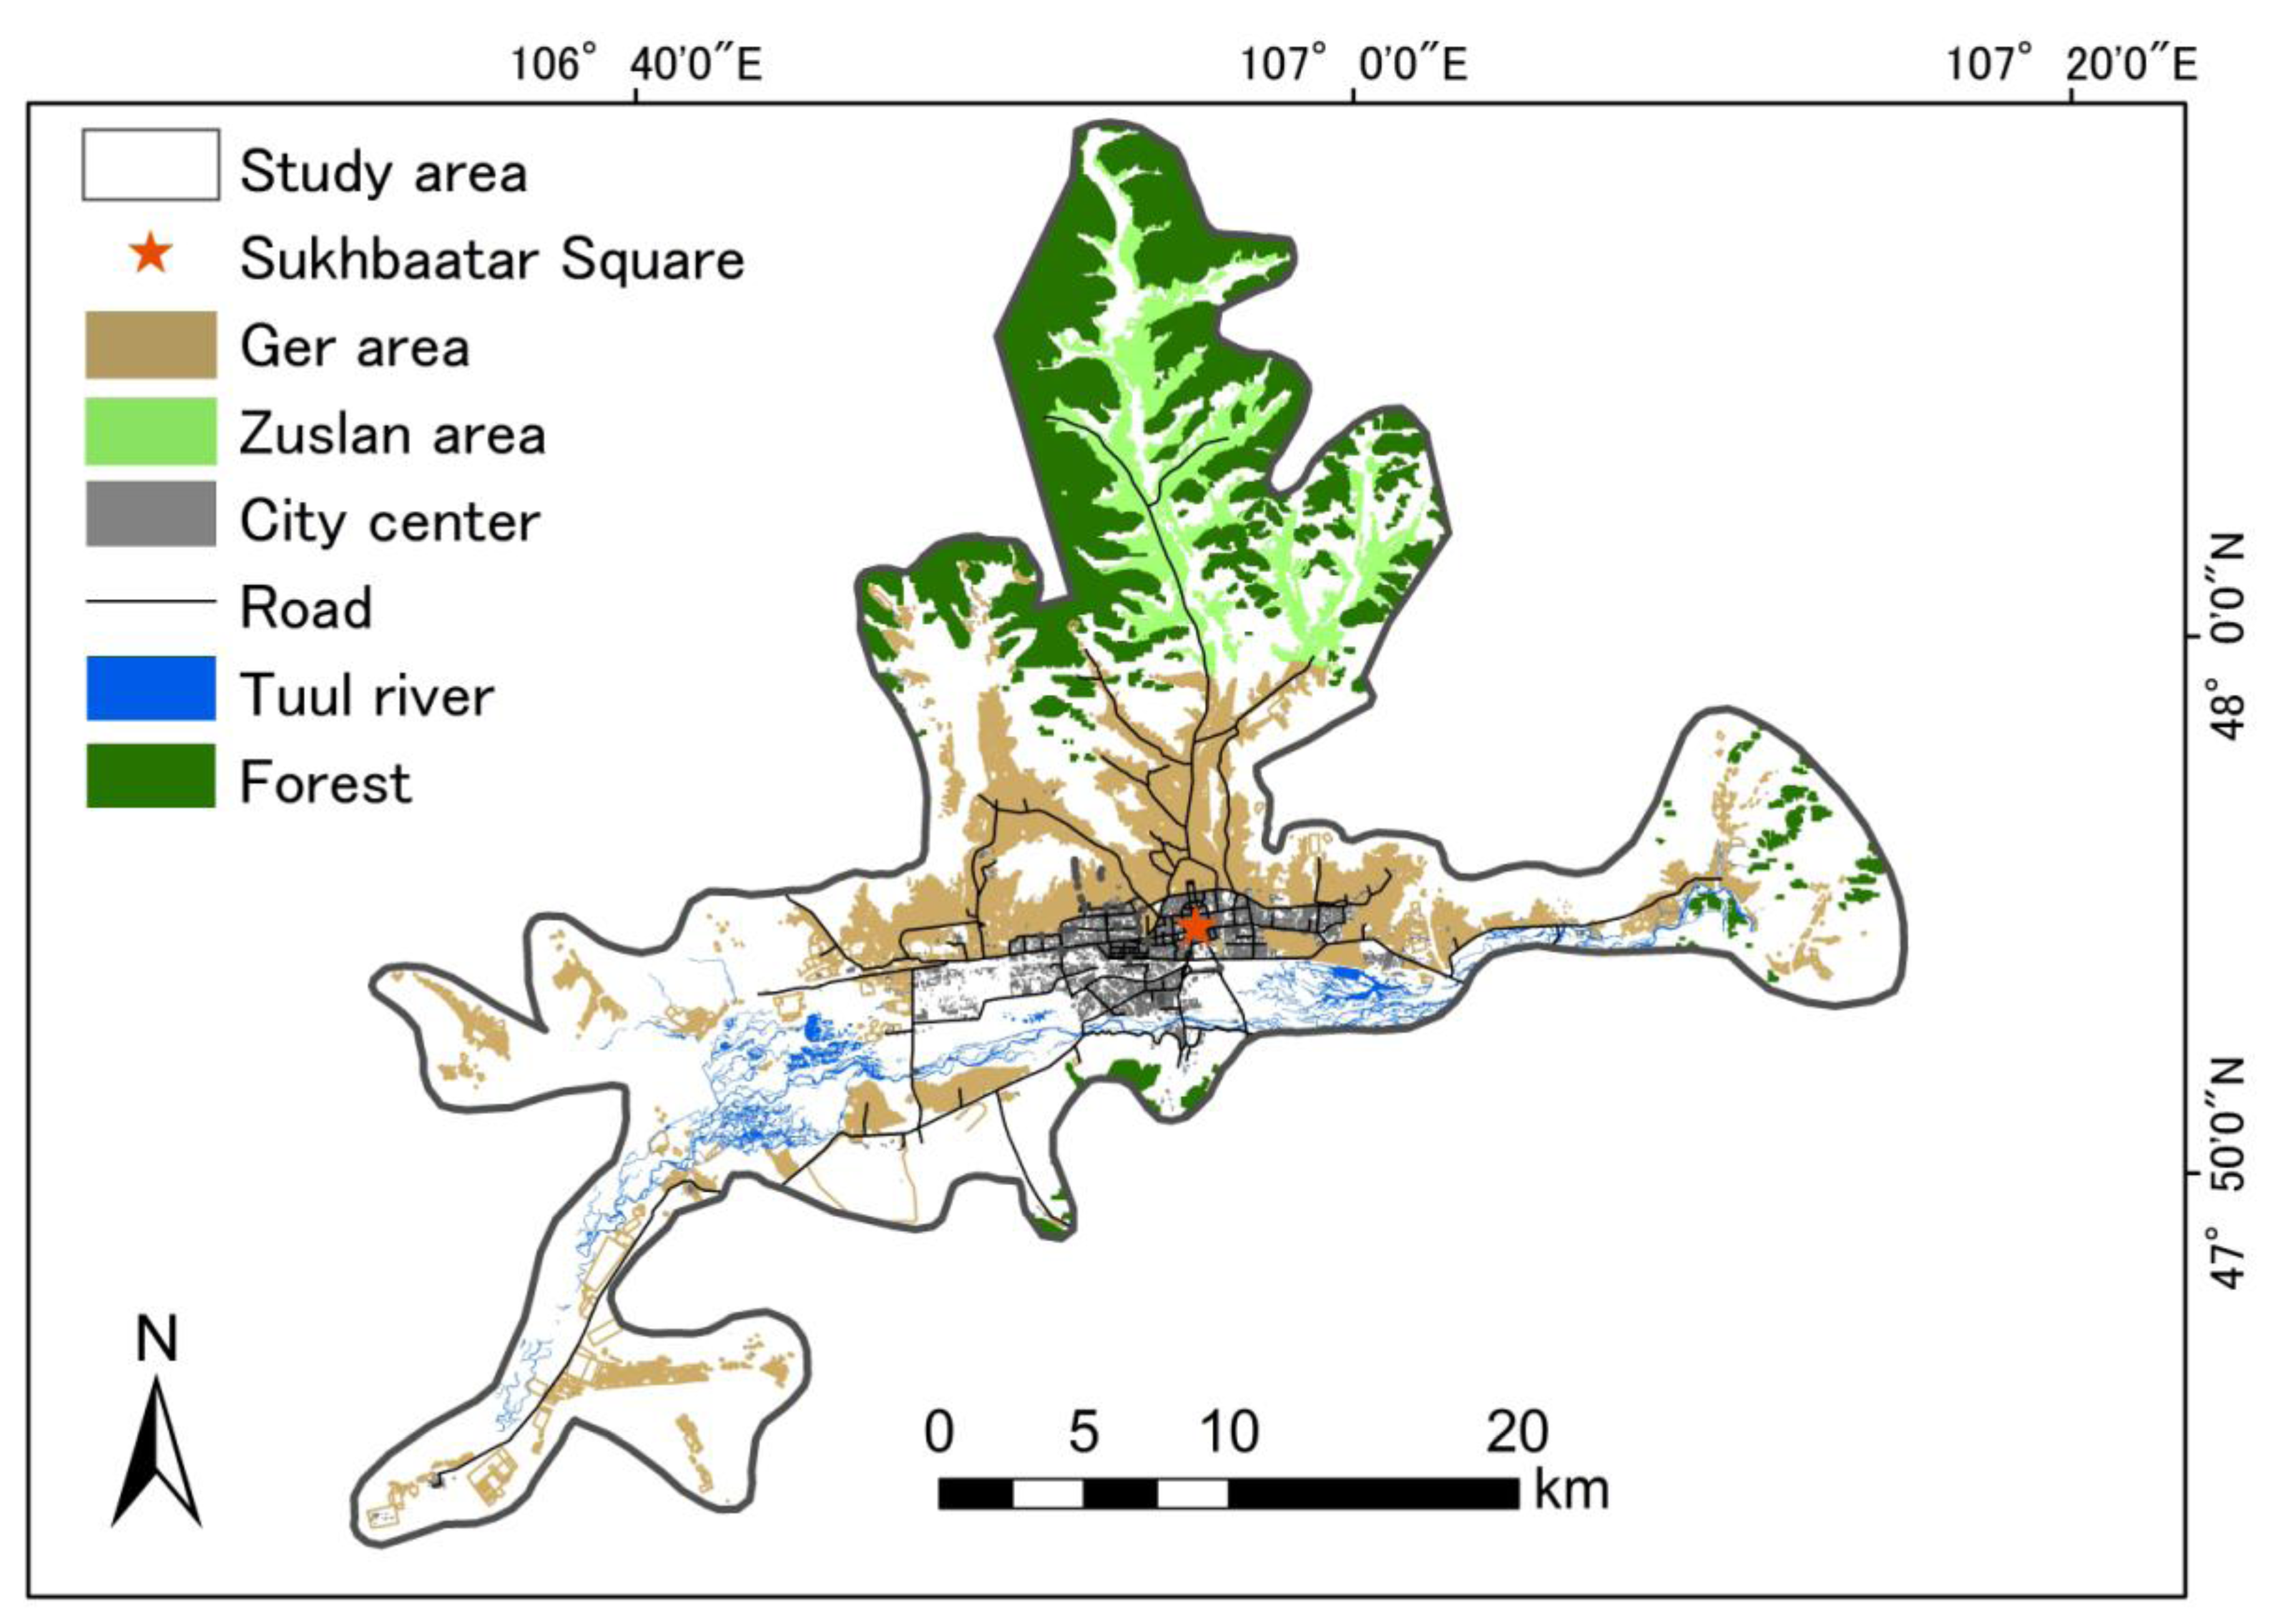
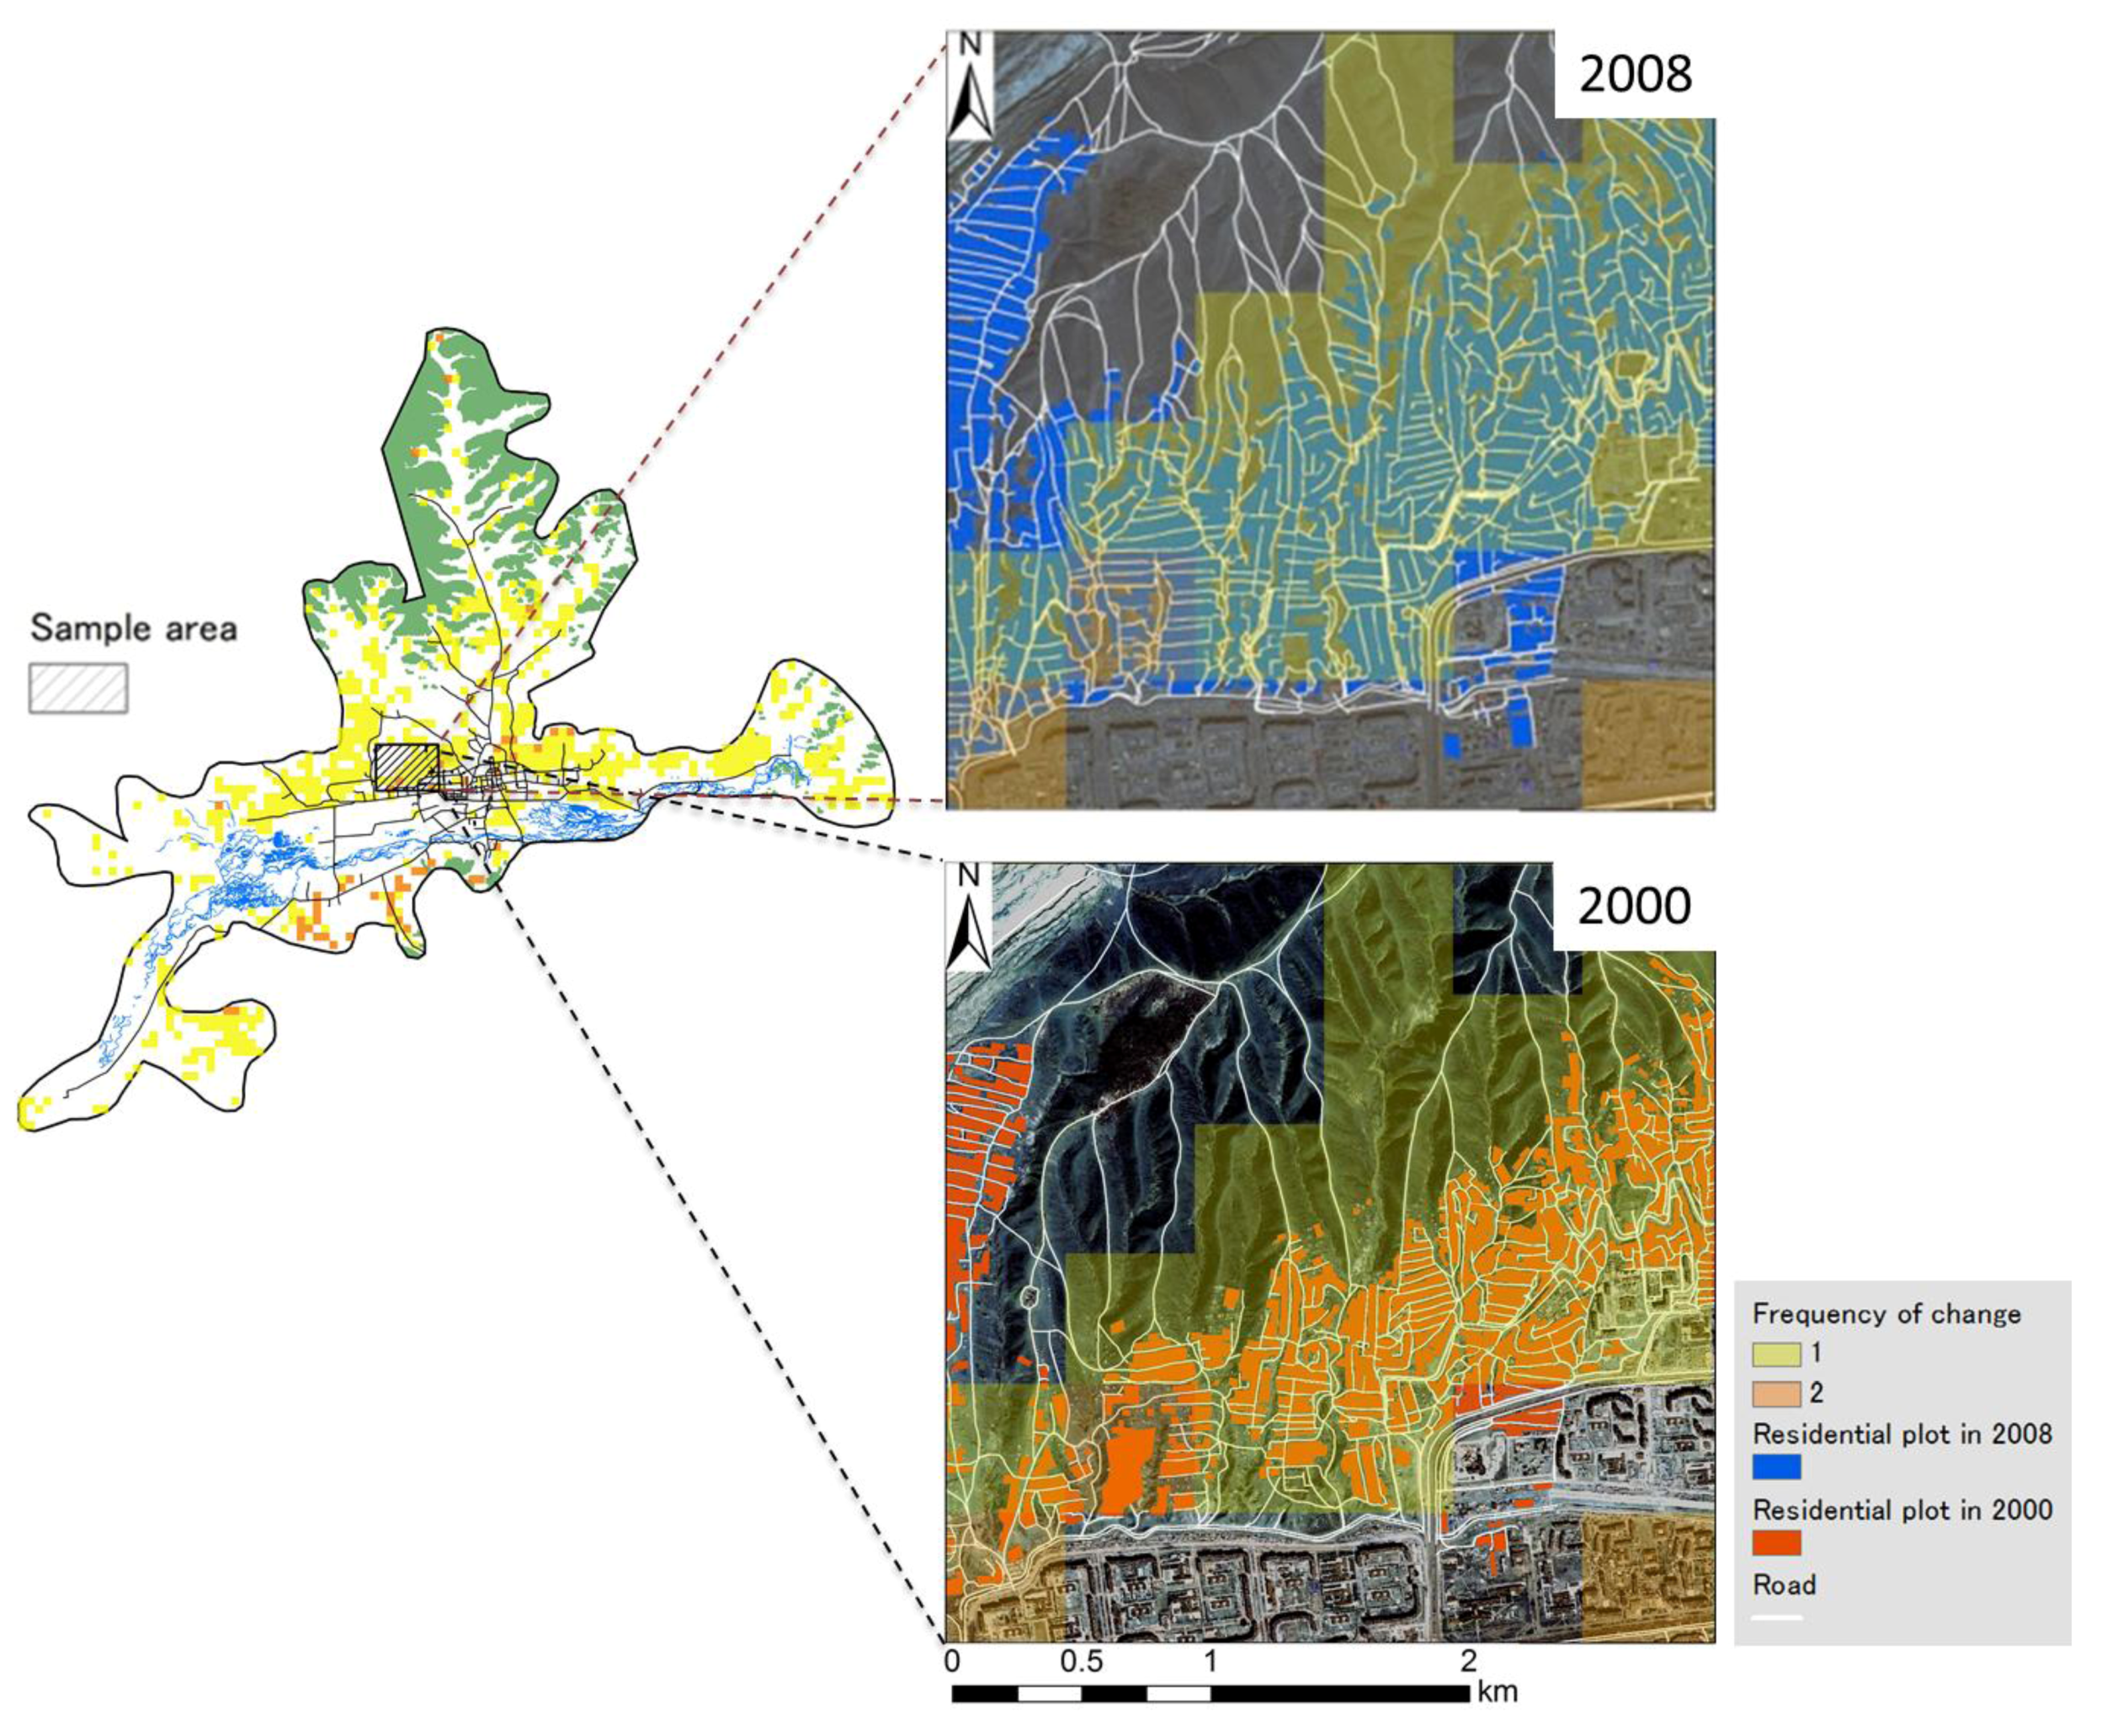
2.1. Study Area

The Municipality of Ulaanbaatar consists of nine administrative districts, which are sub-divided into 124 sub-districts, called “khoroos”. Two districts, Baganuur and Bagakhangai, and two khoroos in the Songinokhanirkhan district and the Bayansurkh district are excluded from the study area because of their remote and disparate locations. Therefore, the study area comprises 122 khoroos in seven districts, with a total area of approximately 756.25 km2 (see Figure 2). The study area is divided into three main areas: the city center area; the ger-areas; and others [21]. The center of the city is located around Sukhbaatar Square, in front of the governmental palace, and has been extensively developed with high-rise offices and apartment buildings.
The ger-areas have developed mainly in suburban areas, and over recent years have rapidly expanded. Today, migrants from rural areas continue to arrive in the city to claim their own land and build gers and khashaas. It is evident that there is a severe lack of essential urban infrastructure in these suburban areas, such as piped water systems, sanitation facilities, paved roads, public transportation, and heating systems [13]. Issues that must be urgently addressed include social and spatial inequality, water supply and sanitation, waste management, flood risk reduction, and air pollution [13]. Ger-areas are also found in the northern part of the study area, where developments mainly comprise summer camps, known as “zuslans”. These areas originally contained summer houses and second homes for city residents, but the area is now being exploited by new residents, and a large number of settlement clusters have now been established [39]. Although residential plots are found both in the city center and the ger-areas, those in the city center have experienced a gradual conversion to apartment blocks [18].
Figure 2. Overview of the study area.
Land 02 00534 g002
Other areas of note within the study area include: parts of the forest, the riverside, grasslands, and industrial areas such as electronic plants, factories, and the airport. The Tuul River, one of the largest rivers in Mongolia, runs to the south of the study area, and divides Ulaanbaatar north and south.
Since natural land covers are not as affected by anthropogenic land cover changes, compared to urban surfaces [34], the forests and the Tuul River are masked from the analysis in order to focus on land cover changes caused only by anthropogenic disturbances.

2.2. BFAST Method

BFAST integrates the iterative decomposition of time series data into trend, seasonal, and remainder components, with methods for detecting changes (Figure 3) [29]. The model is used iteratively to fit a piecewise linear trend and a seasonal model, given by the equation:
Land 02 00534 i001
where Yt is the observed data at time t, Tt is the trend component, St is the seasonal component, and et is the remainder component [23]. It is assumed that Tt is piecewise linear with segment-specific slopes and intercepts on the different segments of m + 1 (m ≥ 0). Thus, there are m breakpoints Land 02 00534 i004, such that:
Land 02 00534 i002
where i = 1, . . . , m and we define Land 02 00534 i005 and Land 02 00534 i006 represents the piecewise phenological cycle on different p + 1 (p ≥ 0) segments divided by the seasonal breakpoints, Land 02 00534 i007 and Land 02 00534 i008), shown as:
Land 02 00534 i003
where the coefficients are Yj,k and θj,k, K is the number of harmonic terms, and f is the frequency. We employed the harmonic model proposed by Verbesselt et al. [36] which sets K = 3 in Equation (3). This model has a robust approach that avoids noise, and parameters that can be easily used to characterize phenological change [36]. The frequency is set as f = 46 for annual observations of an 8-day time series in this study. The remainder component is the remaining variation in the data beyond that defined by the seasonal and trend components [36].
Breakpoints in trend and seasonal components are detected iteratively [23,36,40] as follows: (1) breakpoints Land 02 00534 i009 are estimated using the residuals-based moving sum (MOSUM) test, and are assessed by minimizing Bayesian information criterion (BIC) from the seasonally adjusted data Land 02 00534 i010, where Land 02 00534 i011 is first found by the STL method [41]; (2) Land 02 00534 i012 and Land 02 00534 i013 are estimated using robust regression based on M-estimations; (3) breakpoints Land 02 00534 i014 are similarly estimated by MOSUM and BIC from the de-trended data Land 02 00534 i015; (4) revised Land 02 00534 i011 is estimated based on the M-estimation; (5) the estimation of parameters is iteratively performed until the number and position of breakpoints are unchanging.
All parameters above are determined automatically. BFAST requires only the parameterization of the minimal segment size between potentially detected breaks [42]; in this study, this was set to two years.

2.3. Data Pre-Processing and Implementation
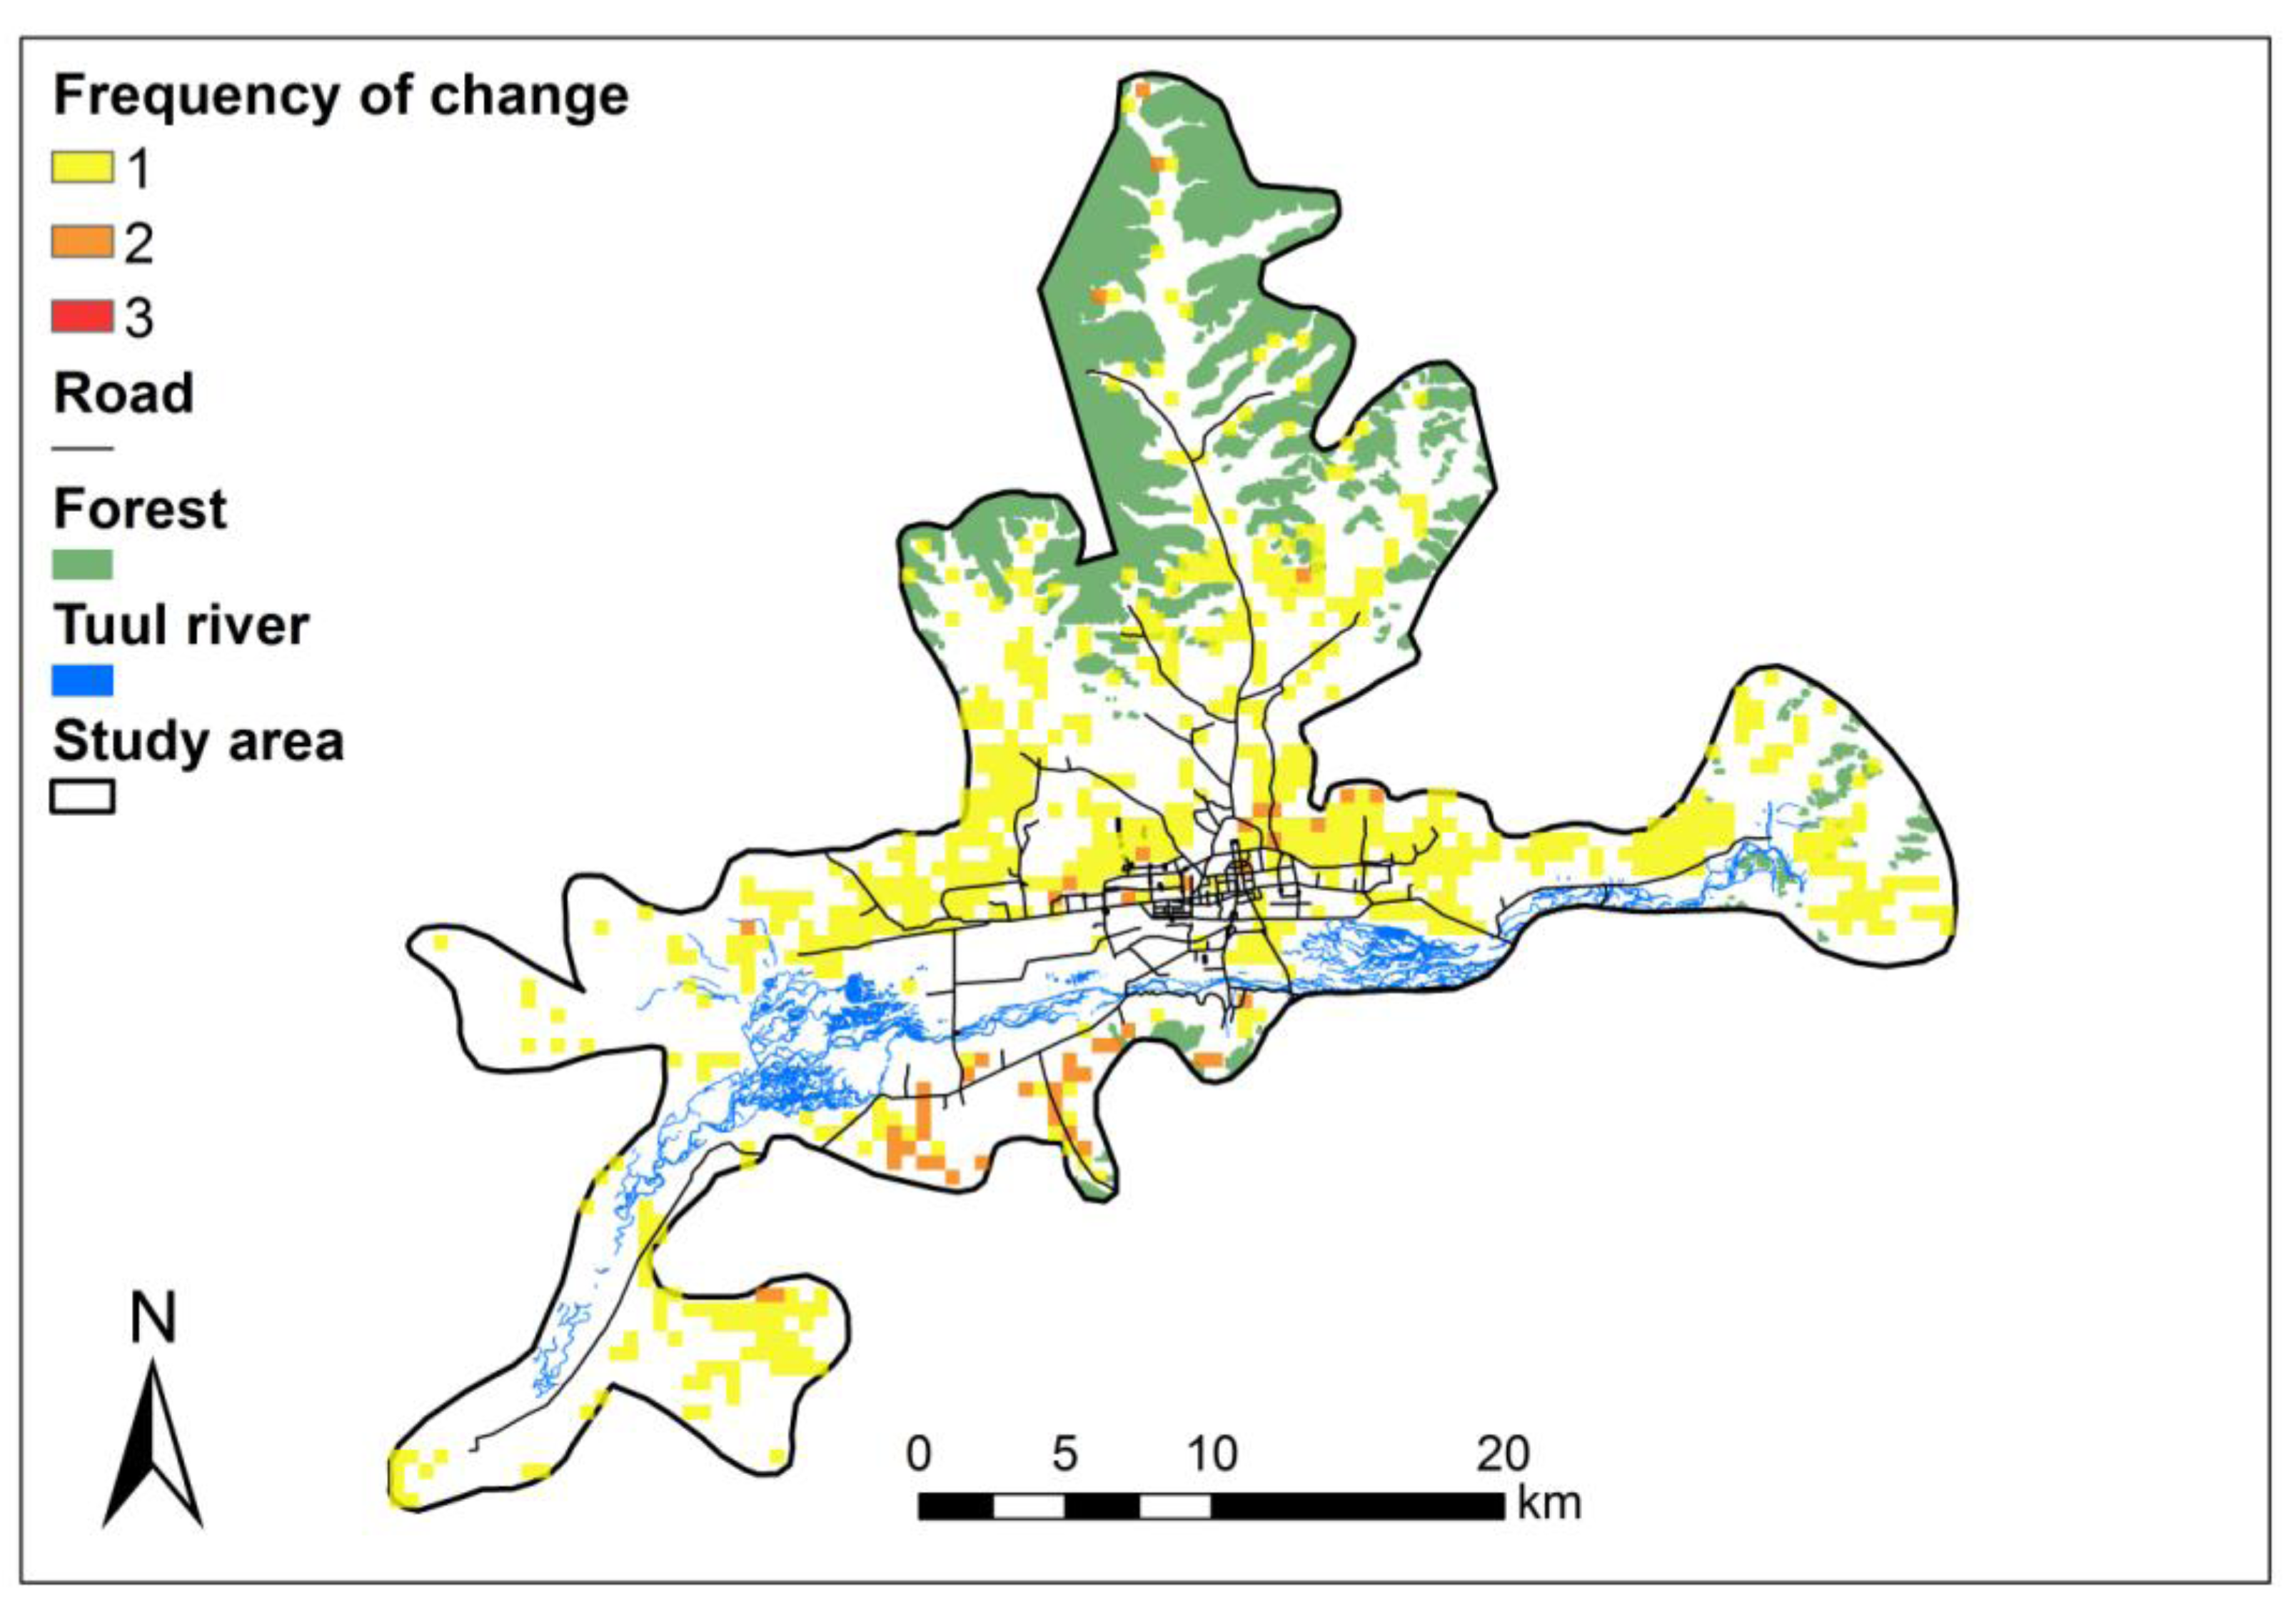
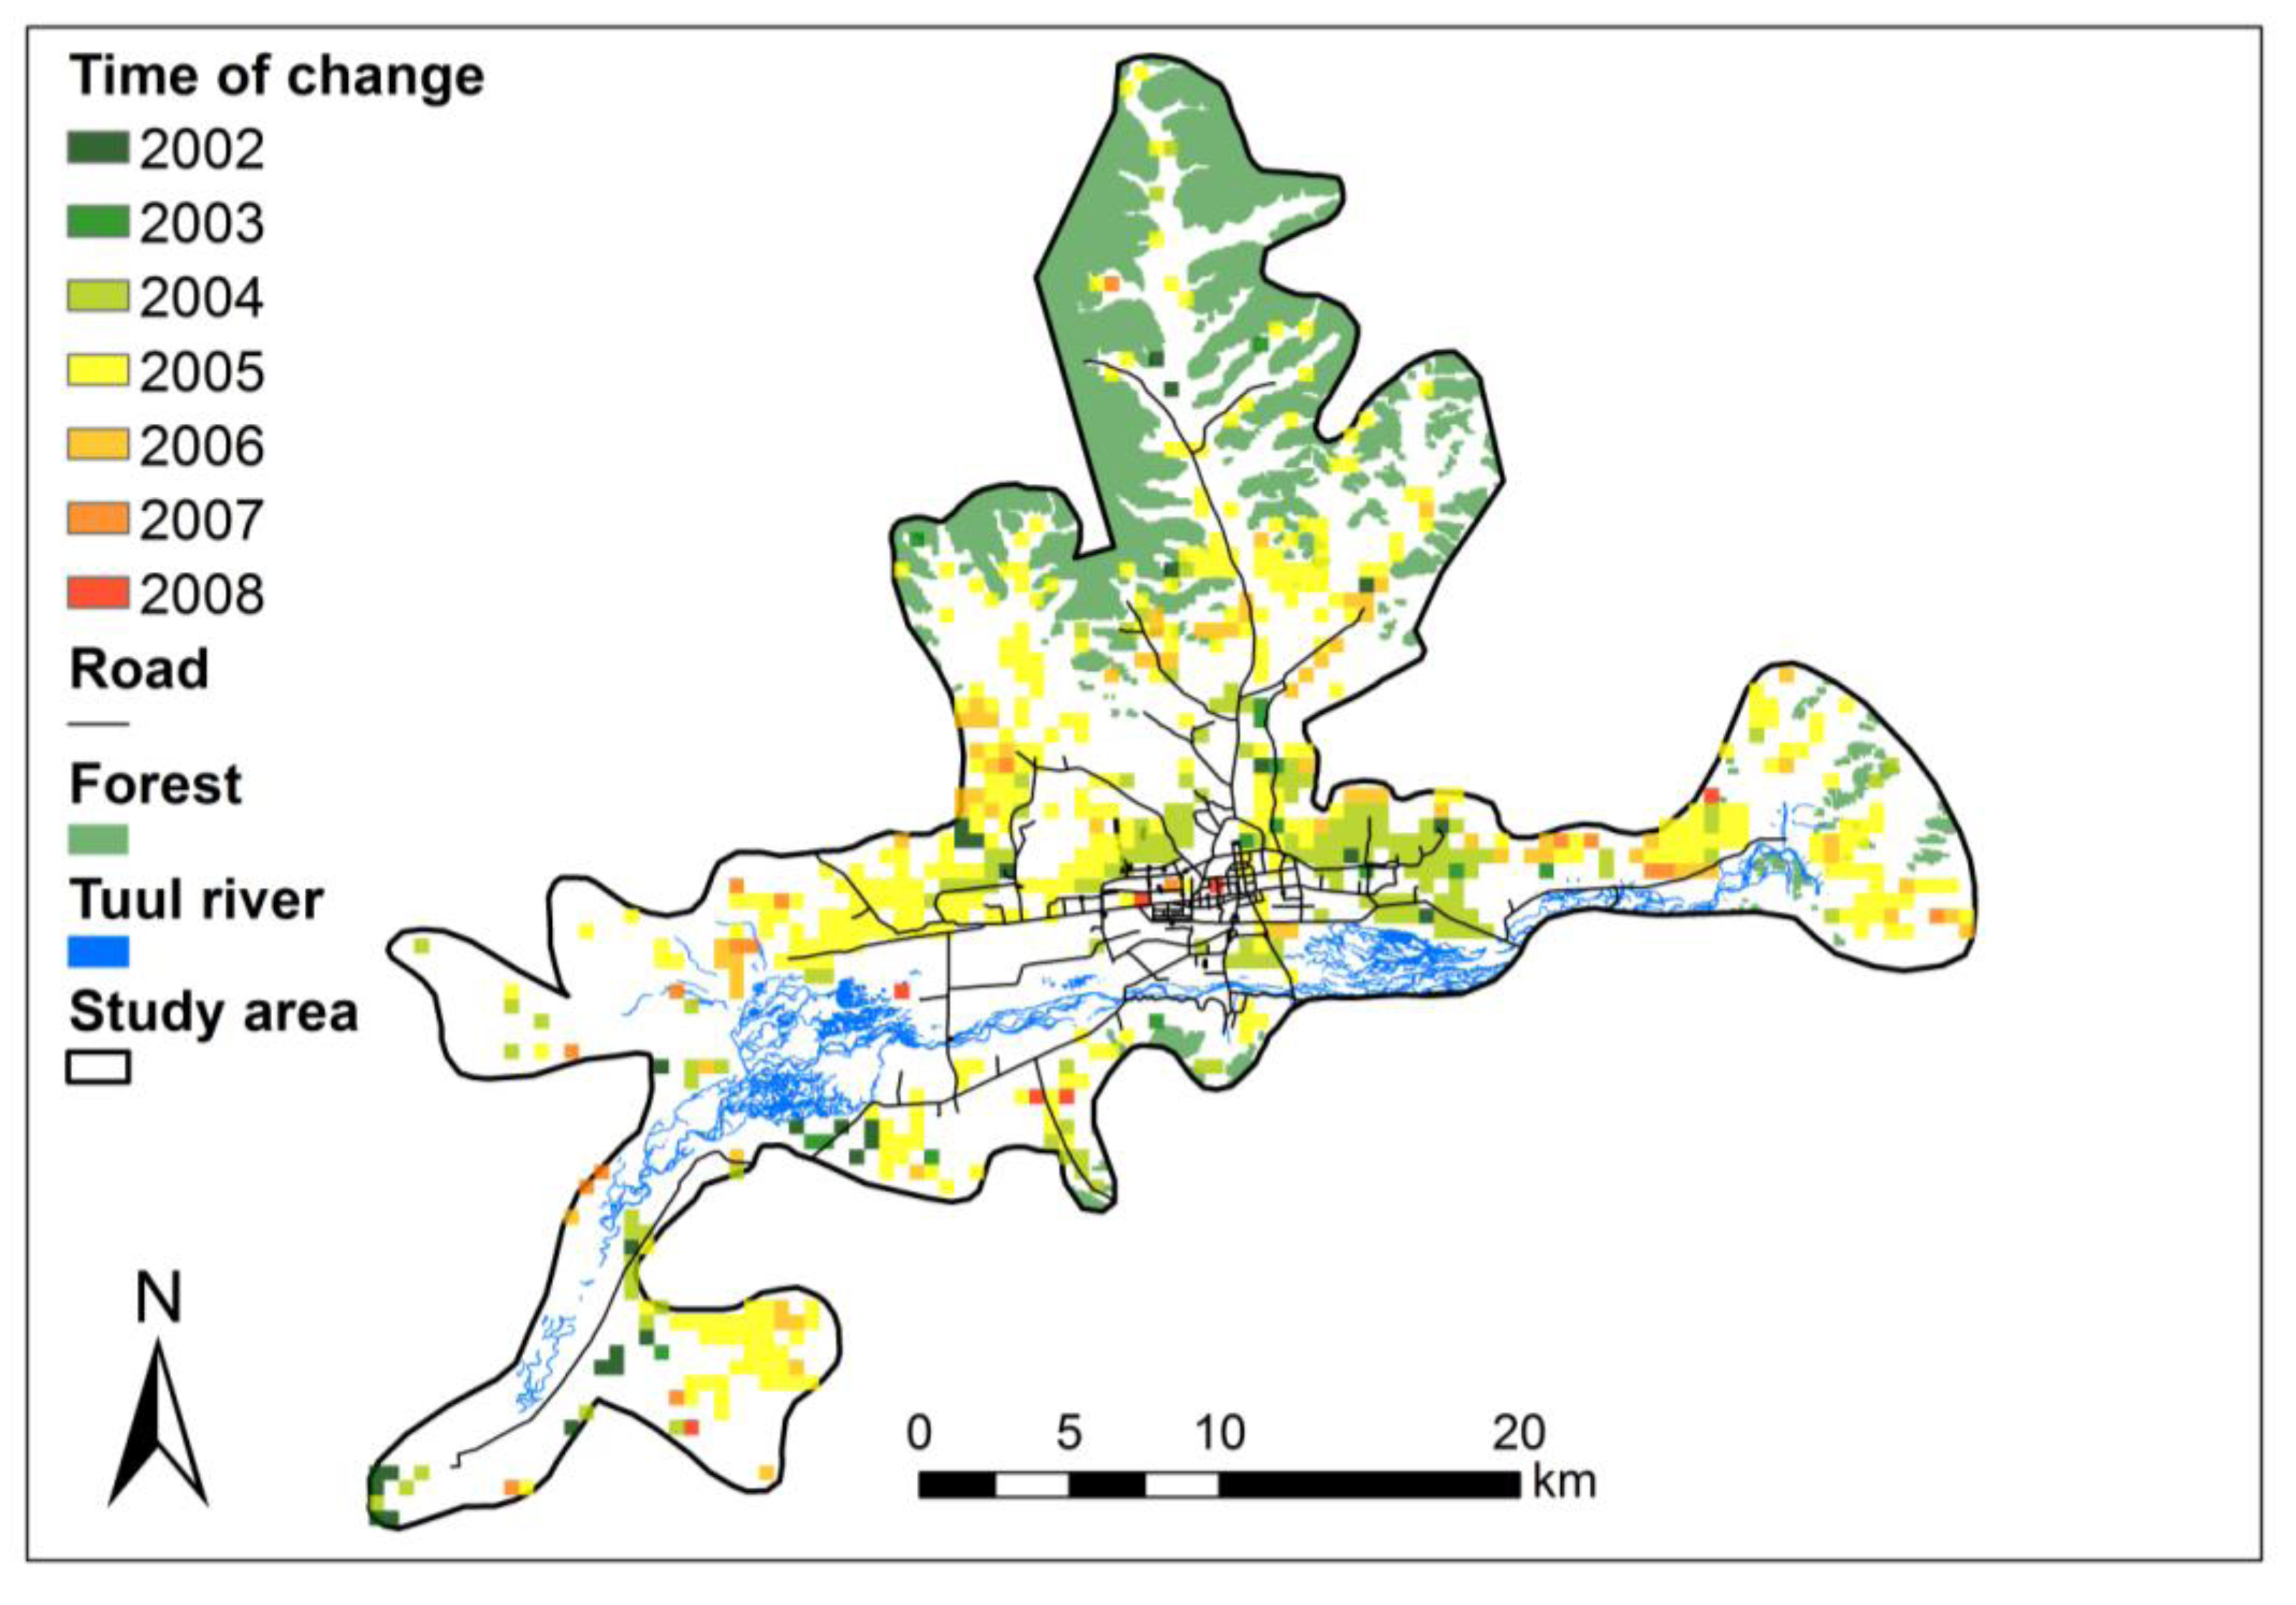
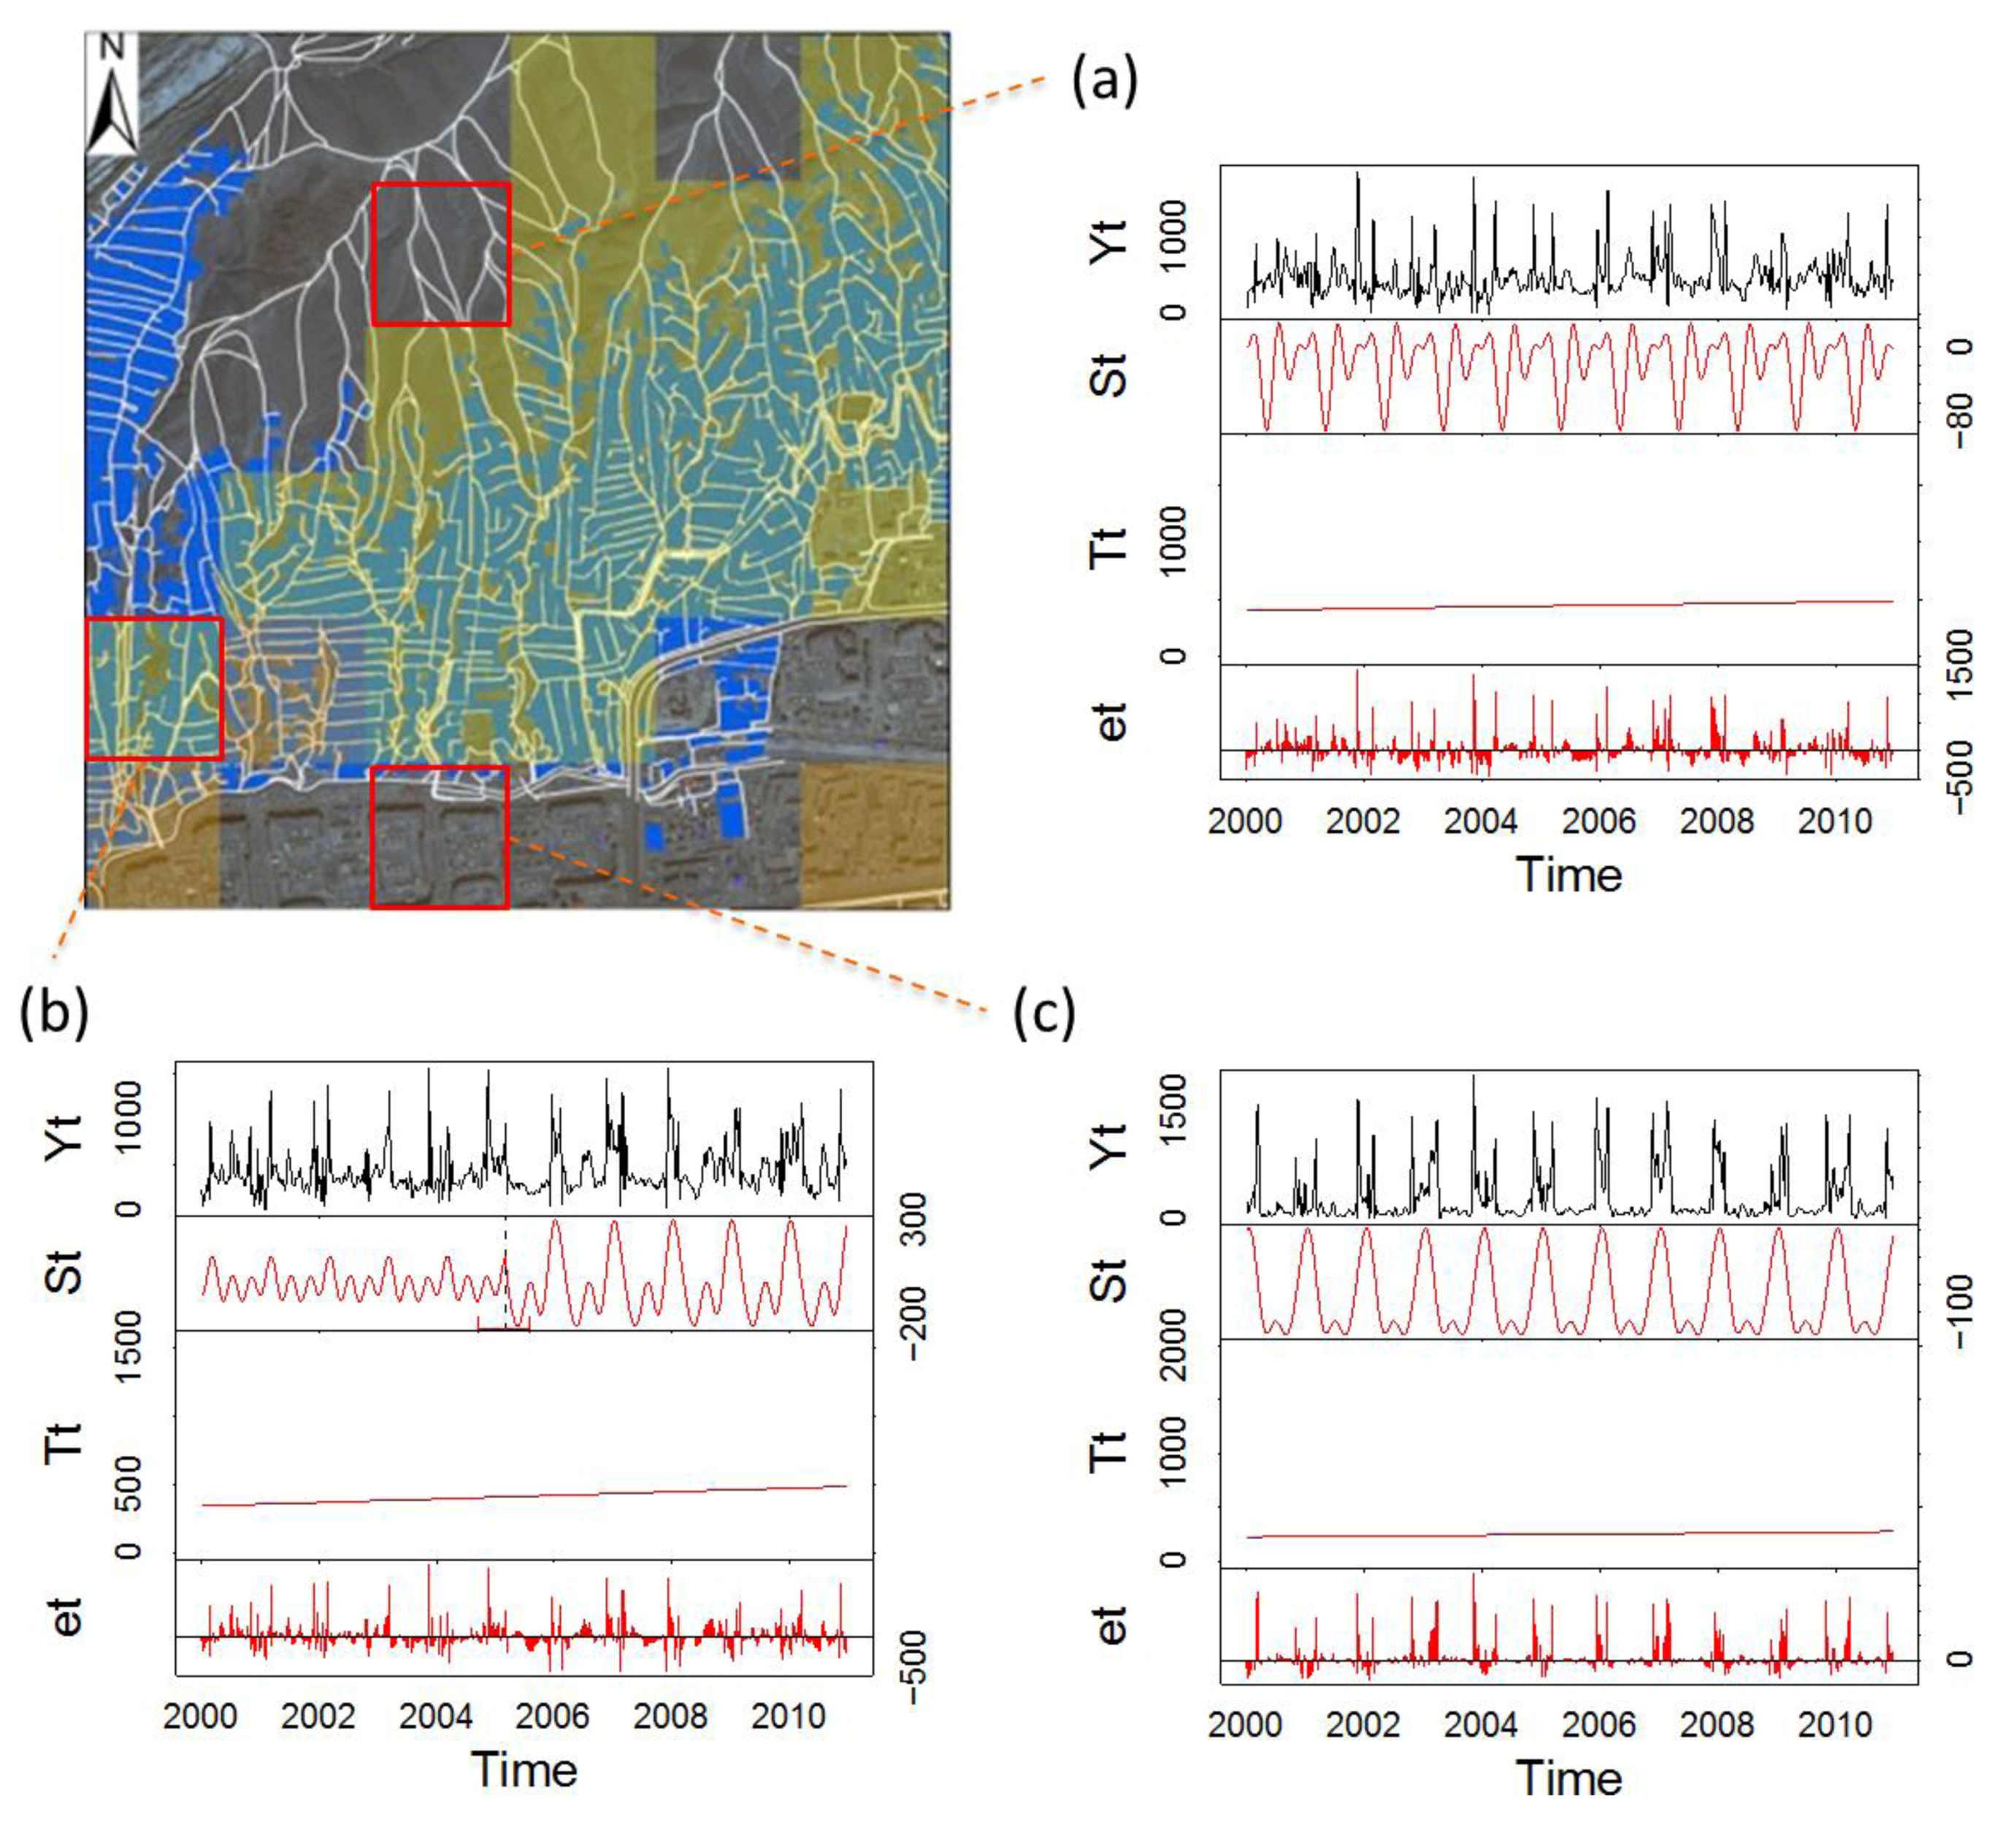
The MODIS data product MOD09A1 is used in this study, containing calibrated reflectance for seven spectral bands within the 400 nm to 2,500 nm spectral region, and surface reflectance quality control flags at a resolution of 500 m pixels. Each MOD09A1 pixel contains the best possible observation during an 8-day period, selected on the basis of high observation coverage, low viewing angle, the absence of clouds or cloud shadow, and low aerosol loading [43]. We acquired MOD09A1 data for the period 2000–2010 and extracted only the best quality pixels using the surface reflectance quality control flags. The NDVI was calculated by (band 2 − band 1)/(band 1 + band 2) × 10,000 in each dataset, making a total of 506 NDVI time-series images. Seven images that were lacking, due to the pre-observation of MODIS between 1 January and 25 February 2000, were set to NA, as implementation of the BFAST method requires a complete set of data covering the observed period (i.e., 46 images × 11 years = 506 images are needed). In order to smooth the data and suppress disturbances, a Savitzky-Golay filter from the TIMESAT processing scheme was applied [44]. This filter interpolates any missing data and fits disturbed values to neighboring values within a temporal trajectory [45]. The process is fast and simple to use over a large area, and works well for NDVI filtering [46,47]. We implemented BFAST through the ndvits package in the R statistical software [41,48]. Interpolated time-series images were clipped along the boundary of the study area, and datasets were then extracted in chronological order by the ExtractFile function within the R-ndvits package. In this study we found a high frequency of breakpoints in the trend components during the period 2000–2010 (e.g., Figure 3). Since the trend component represents gradual changes due to interannual climate variability or land degradation [40,49], its breakpoints do not assist in the detection of land cover changes on urban surfaces well. Instead, breakpoints in the seasonal component do indicate changes in seasonal trend patterns, and therefore we focus only on the breakpoints in these seasonal components, which could represent a change in land cover.
Figure 3. Fitted seasonal, trend, and remainder components for MODIS time series (2000–2010), generated by the breaks for additive seasonal and trend (BFAST) method. The dashed lines represent the dates of detected breakpoints, together with their confidential intervals (red).
Land 02 00534 g003

3. Results

The BFAST method was implemented in the study area to detect the number and timings of breakpoints in the seasonal components.
The frequency of detection of seasonal components changes during the period 2000–2010 (see Figure 4). Changes are detected in 22.51% of the study area, and are mostly seen just once during the 11-year period. Since the forest and Tuul River areas are masked, the changes are detected within areas affected by anthropogenic disturbances. These areas are distributed spatially in locations governed by the extent of the ger-areas, the internal development of the ger-areas, and land degradation due to anthropogenic activities, such as the development of earthen roads. The main concentration of detected change is around the edge of the city center, corresponding to locations in and around the ger-areas. A smaller number of breakpoints are found in the zuslan areas in the northern part of the study area. The temporal periods of the detected seasonal component changes are shown in Figure 5, and the timing of the changes estimated by BFAST are summarized each year to facilitate a comparison, similar to that performed by Verbesselt et al. [29].
Figure 4. Spatial distribution of the frequency of seasonal component changes.
Land 02 00534 g004
In the areas around the city center, change was mostly detected during 2004 and 2005, and it is clear that the later a change is detected, the further that area will be from the city center (see Figure 5). Most of the change occurred within the suburban areas between the years 2005 and 2007.
Significant difficulties were encountered in evaluating the performance of change detection methods, and result from an inability to adequately characterize outcome accuracies [34]. Therefore, in order to verify that our detected results are in accordance with actual land cover changes, the spatial distribution of detected areas in a sample area were compared with bi-temporal satellite images from IKONOS in 2000, and Quickbird in 2008 (see Figure 6). Apartments are illustrated in the southern portion, ger-areas in the central part, and mountainous areas in the northern part of the sample area. Each residential plot is colored to facilitate the identification of the extent of the ger-areas. An expansion of the ger-areas, shown by the increase of residential plots towards the northern mountainous area, was clearly observed in the bi-temporal high-resolution satellite images. In comparison with the BFAST data, few breakpoints of seasonal component changes are found in the apartment areas, while many are found in the ger-areas, mostly corresponding to areas experiencing internal development of ger-areas, or the conversion of open lands to ger-area residential plots. Although some pixels are false findings of land cover changes, it is evident here that the spatial distribution of detected changes corresponds well to the areas of expansion.
Figure 5. Spatial distribution of the timing of seasonal component change occurrences (showing only the first detected changes).
Land 02 00534 g005
Figure 6. Spatial distribution of detected changes in the sample area and the expansion of the ger-area observed by bi-temporal images in 2000 and 2008.
Land 02 00534 g006

4. Discussion

Until recently, the expansion of urban areas from the city center outwards to peripheral areas was often confirmed by observing an urban surface with satellite images [7,27,50,51,52]. However, such an approach to understanding changes in land cover caused by urban expansion has been insufficient, because most studies have applied change detection techniques to less-frequently observed time-series images such as those from Landsat and SPOT [6,11,27,28,32,53]. These satellites could not capture the ger-areas precisely due to the insufficient spatial resolution. Furthermore, the patterns of change on urban surfaces are also not clear, especially in terms of their temporal characteristics. However, we used images from a MODIS satellite, which has the advantage of performing observations on a regular basis (although the images are of a lower resolution than those from Landsat and SPOT), and by using the break points detected by BFAST in the seasonal components, we were able to identify when and where the land cover changed.
Results from a BFAST calculation over sample areas of open land, an area converted from open land to ger-areas, and an area of apartment buildings, indicate the different wavelet characteristics of each land cover type (Figure 7). Although it was difficult to interpret the differences between each type of land cover using the observed data and the trend component, the characteristics were captured well by the seasonal component. The ger-area (after the breakpoint in Figure 7b) and the apartment area (Figure 7c) have a notably strong cyclic interannual variation with one peak in each year, while the hilly open areas (Figure 7a, and the period before the breakpoint in Figure 7b) have a less obvious periodicity. The breakpoint shown in Figure 7b indicates the structural change of the seasonal component and gives a profound insight into the changes of land cover from the NDVI time series. In this way, use of the NDVI time series, particularly by BFAST, is able to describe land cover changes.
Our results show that land cover changes occurred at the edge of the city center region in Ulaanbaatar (Figure 4), and that the changes have tended to occur at a later time with increasing distance from the city center (Figure 5). Due to the land reform legislation, the expansion of urban areas in Ulaanbaatar has been accelerating since 2003. In the first stage of policy implementation, only lands at that time under unadmitted possession were privatized to families who lived on land in the ger-areas [20], and only those who lived there had the right to possess land. After this first wave of privatization, open land around the city center became attractive to new migrants, and the ger-areas developed rapidly. The first step to claiming private land in open areas was the building of khashaas to clarify the property boundary, as described above, and as a result a vast number have been erected in the ger-areas [15]. The expansion of the ger-areas has also occurred to the north and north-west of the city, which are predominantly mountainous areas with steep slopes [39].
Previously, the BFAST method has only ever been applied in areas of rich vegetation, for instance, with the aim of distinguishing plantation land from grassland and detecting forest fires [23,36,42,54,55]. We have here identified that the BFAST method is also able to monitor land cover changes caused by urban expansion, however we acknowledge that the following lessons may be learned from further study.
Firstly, in this investigation, we focused only on the seasonal component changes of BFAST, instead of the trend component changes. It is known that the detection of the trend component change in BFAST is much more sensitive than that of the seasonal component change [23], as illustrated by the larger number of breakpoints in the trend component (areas of detected change were found to comprise 39.17% of the study area by this method). However, the trend component includes abrupt and gradual changes in the NDVI time series [23], which are regarded as disturbances and noise against the seasonal component changes [36]. Consequently, we were not able to capture any meaningful information relating to land cover changes from the trend component.
Figure 7. Results of applying BFAST to sample sites: (a) open land; (b) area converted from open land to ger-area; and (c) apartment.
Land 02 00534 g007
Secondly, in any investigation, the study period should be of a sufficient length to grasp the target phenomenon. We set the study period to be 11 years, from 2000 to 2010, and were required to exclude the first two years (2000 and 2001) and last two years (2009 and 2010) in order to set the segment size as two years. When conducting an analysis of time-series satellite images, this limited period is still considered to be relatively short for the detection of long-term land cover change [29,49]. Urban expansion is still progressing in Ulaanbaatar and monitoring should be continued in order to manage it. Continuous long-term observations on a regular basis and the construction of a spatio-temporal database would be useful in further understanding interannual spatial phenomena [52].
Thirdly, it is essential to precisely distinguish land cover types. Forests and the Tuul River were masked to focus on the urbanized areas profoundly affected by anthropogenic disturbances, although many changes were also found in the masked areas covered by rich vegetation. The Tuul River and the forests have different characteristics in the NDVI time series, and are more highly affected by natural disturbances than human ones. Although it is currently difficult to acquire precise land classification maps in rapidly developing urban areas, validation data for change detection need to be collected, to enable future analysis to provide sufficient documentation of change events (i.e., before and after) [34]. Ground-based land cover maps also need to be developed to understand detailed land use and land cover changes. Finally, an accurate assessment of the result has yet to be developed. An assessment of the identified areas in which land cover has changed could be carried out using traditional methodologies derived from a confusion or error matrix [34,56]. However, as mentioned above, time-series spatial information of the entire land cover is insufficient for the assessment of land cover changes, especially in terms of temporal changes, and although IKONOS and Quickbird images give fully detailed land cover data, the frequency of observations and their spatial ranges are limited. New remote sensing instruments such as RapidEye, which has a spatial resolution of 5 m and was launched in 2008, would provide great opportunities for this large-scale assessment as it has wider spatial extents compared to IKNOS and Quickbird.
Although these approaches can be considered in further studies, we believe that the use of BFAST in this investigation has provided meaningful results that are applicable in the monitoring of urban expansion over large geographic regions. In addition, the application of BFAST, developed alongside a maximum utilization of MODIS time series, which cover the globe, and is available free of charge, could facilitate easy analysis in other regions.

5. Conclusions

Reliable information about land cover and land cover changes caused by urban expansion is clearly needed to enable informed planning decisions [2], because unplanned growth of ger-areas and the unprecedented pace of urbanization in Ulaanbaatar have resulted in unemployment, traffic congestion, air pollution, and other negative environmental impacts [13]. The findings in this study could contribute to an understanding of the characteristics of urban expansion and consequently the countermeasures that must be taken to halt or minimize future haphazard urban expansion.
The BFAST method was applied for the first time to urban expansion analysis, and was able to estimate the time and location of land cover changes at the fringes of Ulaanbaatar, simultaneously and automatically. The results are verified by comparing bi-temporal high-resolution satellite images, which show the actual land cover changes caused by anthropogenic disturbances, such as the development of residential plots. The areas of detected change are concentrated around the city center, indicating the high influence of anthropogenic effects. BFAST is shown to be a robust and applicable method for the monitoring of urban expansion, when carefully applied and focused only on anthropogenic activities using a long observation period centered on the target phenomenon.

Acknowledgments

This research was supported by the Research Institute for Humanity and Nature (project number D-04). The authors would like to thank the anonymous reviewers for their insight comments.

Conflict of Interest

The authors declare no conflict of interest.

References and Notes

  1. Department of Economic and Social Affairs of United Nations. World Urbanization Prospects, The 2011 Revision. 2012. Available online: http://esa.un.org/unpd/wup/index.htm (accessed on 3 July 2013).
  2. Angel, S.; Parent, J.; Civco, D.L.; Blei, A.; Potere, D. The dimensions of global urban expansion: Estimates and projections for all countries, 2000–2050. Prog. Plann. 2011, 75, 53–107. [Google Scholar] [CrossRef]
  3. Seto, K.C.; Güneralp, B.; Hutyra, L.R. Global forecasts of urban expansion to 2030 and direct impacts on biodiversity and carbon pools. Proc. Natl. Acad. Sci. USA 2012, 109, 16083–16088. [Google Scholar] [CrossRef]
  4. Seto, K.C.; Roberto, S.; Fragkias, M. The new geography of contemporary urbanization and the environment. Annu. Rev. Env. Resour. 2010, 35, 167–194. [Google Scholar] [CrossRef]
  5. Mcdonald, R.I.; Kareiva, P.; Forman, R.T.T. The implications of current and future urbanization for global protected areas and biodiversity conservation. Biol. Conserv. 2008, 141, 1695–1703. [Google Scholar] [CrossRef]
  6. Rojas, C.; Pino, J.; Basnou, C.; Vivanco, M. Assessing land-use and -cover changes in relation to geographic factors and urban planning in the metropolitan area of Concepción (Chile). Implications for biodiversity conservation. Appl. Geog. 2013, 39, 93–103. [Google Scholar] [CrossRef]
  7. Habibi, S.; Asadi, N. Causes, results and methods of controlling urban sprawl. Procedia. Eng. 2011, 21, 133–141. [Google Scholar] [CrossRef]
  8. Döös, B.R. Population growth and loss of arable land. Glob. Environ. Chang. 2002, 12, 303–311. [Google Scholar] [CrossRef]
  9. Hasse, J.E.; Lathrop, R.G. Land resource impact indicators of urban sprawl. Appl. Geog. 2003, 23, 159–175. [Google Scholar] [CrossRef]
  10. DeFries, R.S.; Rudel, T.; Uriarte, M.; Hansen, M. Deforestation driven by urban population growth and agricultural trade in the twenty-first century. Nat. Geosci. 2010, 3, 178–181. [Google Scholar] [CrossRef]
  11. Dubovyk, O.; Sliuzas, R.; Flacke, J. Spatio-temporal modelling of informal settlement development in Sancaktepe district, Istanbul, Turkey. ISPRS J. Photogramm.Remote Sens. 2011, 66, 235–246. [Google Scholar] [CrossRef]
  12. Augustijn-Beckers, E.-W.; Flacke, J.; Retsios, B. Simulating informal settlement growth in Dar es Salaam, Tanzania: An agent-based housing model. Comput. Environ. Urban. 2011, 35, 93–103. [Google Scholar] [CrossRef]
  13. Kamata, T.; Reichert, J.A.; Tsevegmid, T.; Kim, Y.; Sedgewick, B. Mongolia Enhancing Policies and Practices for Ger Area Development in Ulaanbaatar; The World Bank: Washington, DC, USA, 2010. [Google Scholar]
  14. Solongo, A. Growth of Internal and International Migration in Mongolia. In Proceedings of 8th International Conference of Asia Pacific Migration Research Network—Migration, Development and Poverty Reduction, Fuzhou, China, 25–29 May 2007.
  15. Byambadorj, T.; Amati, M.; Ruming, K.J. Twenty-first century nomadic city: Ger districts and barriers to the implementation of the Ulaanbaatar city master plan. Asia Pac. Viewp. 2011, 52, 165–177. [Google Scholar] [CrossRef]
  16. National Statistics Office of Mongolia, Mongolian Statistical Yearbook; National Statistics Office of Mongolia: Ulaanbaatar, Mongolia, 2011.
  17. UN-Habitat, UN-Habitat Planning for Disaster Risk Reduction in Ulaanbaatar—The Unur Community Action Plan Closing Workshop GUSIP Report; UN-Habitat Mongolia Office: Ulaanbaatar, Mongolia, 2010.
  18. Kamata, T.; Reichert, J.; Tsevegmid, T.; Kim, Y.; Sedgewick, B. Managing Urban Expansion in Mongolia: Best Practices in Scenario-Based Urban Planning; The World Bank: Washington, DC, USA, 2010. [Google Scholar]
  19. Asia Development Bank, Economic Update Mongolia; ADB: Manila, Philippine, 2003.
  20. Batbileg, C. Does Land Privatization Support the Development of Land Market? In Proceedings of International Workshop: Land Policies, Land Registration and Economic Development, Experiences in Central Asian Countries, Tashkent, Uzbekistan, 31 October–3 November 2007.
  21. Mongolia: Heating in Poor, Peri-Urban Ger areas of Ulaanbaatar; The World Bank: Washington, DC, USA, 2009.
  22. Tv, R.; Aithal, B.H.; Sanna, D.D. Insights to urban dynamics through landscape spatial pattern analysis. Int. J. Appl. Earth. Obs. 2012, 18, 329–343. [Google Scholar] [CrossRef]
  23. Verbesselt, J.; Hyndman, R.; Newnham, G.; Culvenor, D. Detecting trend and seasonal changes in satellite image time series. Remote Sens. Environ. 2010, 114, 106–115. [Google Scholar] [CrossRef]
  24. Running, S.W.; Loveland, T.R.; Pierce, L.L.; Nemani, R.R.; Hunt, E.R. Classification Logic for Global Land Cover Analysis. Remote Sens. Environ. 1995, 51, 39–48. [Google Scholar] [CrossRef]
  25. Lasaponara, R. On the use of principal component analysis (PCA) for evaluating interannual vegetation anomalies from SPOT/VEGETATION NDVI temporal series. Ecol. Model. 2006, 194, 429–434. [Google Scholar] [CrossRef]
  26. Galford, G.L.; Mustard, J.F.; Melillo, J.; Gendrin, A.; Cerri, C.C.; Cerri, C.E.P. Wavelet analysis of MODIS time series to detect expansion and intensification of row-crop agriculture in Brazil. Remote Sens. Environ. 2008, 112, 576–587. [Google Scholar] [CrossRef]
  27. Yu, X.J.; Ng, C.N. Spatial and temporal dynamics of urban sprawl along two urban–rural transects: A case study of Guangzhou, China. Landsc. Urban Plan. 2007, 79, 96–109. [Google Scholar] [CrossRef]
  28. Jat, M.K.; Garg, P.K.; Khare, D.; Jat, M. Monitoring and modelling of urban sprawl using remote sensing and GIS techniques. Int. J. Appl. Earth. Obs. 2008, 10, 26–43. [Google Scholar] [CrossRef]
  29. Alphan, H. Land-use change and urbanization of Adana, Turkey. Land Degrad. Dev. 2003, 14, 575–586. [Google Scholar] [CrossRef]
  30. Weber, C.; Puissant, A. Urbanization pressure and modeling of urban growth: example of the Tunis Metropolitan Area. Remote Sens. Environ. 2003, 86, 341–352. [Google Scholar] [CrossRef]
  31. Lu, D.; Mausel, P.; Brondízio, E.; Moran, E. Change detection techniques. Int. J. Remote Sens. 2003, 25, 2365–2407. [Google Scholar]
  32. Deng, J.S.; Wang, K.; Deng, Y.H.; Qi, G.J. PCA-based land-use change detection and analysis using multitemporal and multisensor satellite data. Int. J. Remote Sens. 2008, 29, 4823–4838. [Google Scholar] [CrossRef]
  33. Millward, A.A.; Piwowar, J.M.; Howarth, P.J. Time-series analysis of medium-resolution, multisensor satellite data for identifying landscape change. PE&RS 2006, 72, 653–663. [Google Scholar]
  34. Lunetta, R.S.; Knight, J.F.; Ediriwickrema, J.; Lyon, J.G.; Worthy, L.D. Land-cover change detection using multi-temporal MODIS NDVI data. Remote Sens. Environ. 2006, 105, 142–154. [Google Scholar] [CrossRef]
  35. Kleynhans, W.; Olivier, J.C.; Wessels, K.J.; Salmon, B.P.; van den Bergh, F.; Steenkamp, K. Detecting land cover change using an extended kalman filter on MODIS NDVI time-series data. IEEE Geosci. Remote Sens. Lett. 2011, 8, 507–511. [Google Scholar] [CrossRef]
  36. Verbesselt, J.; Hyndman, R.; Zeileis, A.; Culvenor, D. Phenological change detection while accounting for abrupt and gradual trends in satellite image time series. Remote Sens. Environ. 2010, 114, 2970–2980. [Google Scholar] [CrossRef]
  37. Buyantuyev, A.; Wu, J. Urbanization alters spatiotemporal patterns of ecosystem primary production: A case study of the Phoenix metropolitan region, USA. J. Arid Environ. 2009, 73, 512–520. [Google Scholar] [CrossRef]
  38. Buyantuyev, A.; Wu, J. Urbanization diversifies land surface phenology in arid environments: Interactions among vegetation, climatic variation, and land use pattern in the Phoenix metropolitan region, USA. Landsc. Urban Plan. 2012, 105, 149–159. [Google Scholar] [CrossRef]
  39. Badamdorj, C. Changes in the internal structure of Ulaanbaatar, Mongolia. Sci. Annu. Korea Mong.Econ. Assoc. 2004, 14, 39–59. [Google Scholar]
  40. Jong, R.; Verbesselt, J.; Schaepman, M.E.; Bruin, S. Trend changes in global greening and browning: contribution of short-term trends to longer-term change. Glob. Chang. Biol. 2012, 18, 642–655. [Google Scholar] [CrossRef]
  41. R Development Core Team, R: A Language and Environment for Statistical Computing; R Foundation for Statistical Computing: Vienna, Austria, 2011.
  42. Schucknecht, A.; Erasmi, S.; Niemeyer, I.; Matschullat, J. Assessing vegetation variability and trends in north-eastern Brazil using AVHRR and MODIS NDVI time series. Eur. J. Remote Sens. 2013, 46, 40–59. [Google Scholar]
  43. Vermote, E.F.; Kotchenova, S.Y.; Ray, J.P. MODIS Surface Reflectance User’s Guide Version 1.3. February 2011. Available online: http://modis-sr.ltdri.org/products/MOD09_UserGuide_v1_3.pdf (accessed on 15 May 2013).
  44. Jönsson, P.; Eklundh, L. TIMESAT—A program for analyzing time-series of satellite sensor data. Comput. Geosci. 2004, 30, 833–845. [Google Scholar] [CrossRef]
  45. Erasmi, S.; Bothe, M.; Petta, R.A. Enhanced Filtering of MODIS Time Series Data for the Analysis of Desertification Process in Northeast Brazil. In Proceedings of the ISPRS/ITC-Midterm Symposium—Remote Sensing: From Pixels to Processes, Enschede, The Netherlands, 8–11 May 2006; pp. 8–11.
  46. Fang, H.; Liang, S.; Townshend, J.; Dickinson, R. Spatially and temporally continuous LAI data sets based on an integrated filtering method: Examples from North America. Remote Sens. Environ. 2008, 112, 75–93. [Google Scholar] [CrossRef]
  47. Chen, J.; Jo, P.; Jonsson, P.; Tamura, M.; Gu, Z.; Matsushita, B.; Eklundh, L.; Jönsson, P. A simple method for reconstructing a high-quality NDVI time-series data set based on the Savitzky-Golay filter. Remote Sens. Environ. 2004, 91, 332–344. [Google Scholar] [CrossRef]
  48. Frelat, R.; Gerard, B. ndvits: NDVI Time Series Extraction and Analysis; R Package Version 1.0.1. Available online: http://cran.r-project.org/package=ndvits (accessed on 10 January 2013).
  49. Verbesselt, J.; Hyndman, R.; Newnham, G.; Culvenor, D. Detecting trend and seasonal changes in satellite image time series. Remote Sens. Environ. 2009, 114, 106–115. [Google Scholar]
  50. Irwin, E.G.; Bockstael, N.E.; Hg, O.; Puga, D.; Ma, T. The evolution of urban sprawl: Evidence of spatial heterogeneity and increasing land fragmentation. Proc. Natl. Acad. Sci. USA 2007, 104, 20672–20677. [Google Scholar] [CrossRef]
  51. Cheng, J.; Masser, I. Urban growth pattern modeling: A case study of Wuhan city, PR China. Landsc. Urban Plan. 2003, 62, 199–217. [Google Scholar] [CrossRef]
  52. Sexton, J.O.; Song, X.-P.; Huang, C.; Channan, S.; Baker, M.E.; Townshend, J.R. Urban growth of the Washington, D.C.–Baltimore, MD metropolitan region from 1984 to 2010 by annual, Landsat-based estimates of impervious cover. Remote Sens. Environ 2013, 129, 42–53. [Google Scholar] [CrossRef]
  53. Zanganeh, S.; Sauri, D.; Serra, P.; Modugno, S.; Seifolddini, F.; Pourahmad, A. Urban sprawl pattern and land-use change detection in Yazd , Iran. Habitat Int. 2011, 35, 521–528. [Google Scholar] [CrossRef]
  54. Gitas, I.Z.; Katagis, T.; Toukiloglou, P. Burned area mapping and post-fire monitoring of a Mediterranean forest using NDVI time-series of low resolution imagery and the BFAST method. Rev.Ambiência 2012, 8, 461–470. [Google Scholar] [CrossRef]
  55. Lambert, J.; Jacquin, A.; Denux, J.; Chéret, V. Comparison of Two Remote Sensing Time Series Analysis Methods for Monitoring Forest Decline. In Proceedings of the International Conference on Geographic Information Science (AGILE’2012), Avignon, France, 24–27 April 2012; pp. 93–96.
  56. Foody, G.M. Status of land cover classification accuracy assessment. Remote Sens. Environ. 2002, 80, 185–201. [Google Scholar] [CrossRef]

