Article

Evolution of Land Use in the Brazilian Amazon: From Frontier Expansion to Market Chain Dynamics

by
Luciana S. Soler
1,2,*,
Peter H. Verburg
3 and
Diógenes S. Alves
4
1
Land Dynamics Group, Wageningen University, PO Box 47, 6700 AA Wageningen, The Netherlands
2
National Early Warning and Monitoring Centre of Natural Disasters (Cemaden), Parque Tecnológico, Av. Dr. Altino Bondensan 500, São José dos Campos 12247, Brazil
3
Institute for Environmental Studies, VU University Amsterdam, De Boelelaan 1087, Amsterdam 1081 HV, The Netherlands
4
Image Processing Division, National Institute for Space Research (INPE), Av. dos Astronautas 1758, São José dos Campos 12227, Brazil
*
Author to whom correspondence should be addressed.
Land 2014, 3(3), 981-1014; https://doi.org/10.3390/land3030981
Submission received: 31 December 2013 / Revised: 30 July 2014 / Accepted: 7 August 2014 / Published: 19 August 2014

Abstract

:
Agricultural census data and fieldwork observations are used to analyze changes in land cover/use intensity across Rondônia and Mato Grosso states along the agricultural frontier in the Brazilian Amazon. Results show that the development of land use is strongly related to land distribution structure. While large farms have increased their share of annual and perennial crops, small and medium size farms have strongly contributed to the development of beef and milk market chains in both Rondônia and Mato Grosso. Land use intensification has occurred in the form of increased use of machinery, labor in agriculture and stocking rates of cattle herds. Regional and national demands have improved infrastructure and productivity. The data presented show that the distinct pathways of land use development are related to accessibility to markets and processing industry as well as to the agricultural colonization history of the region. The data analyzed do not provide any indication of frontier stagnation, i.e., the slowdown of agricultural expansion, in the Brazilian Amazon. Instead of frontier stagnation, the data analyzed indicate that intensification processes in consolidated areas as well as recent agricultural expansion into forest areas are able to explain the cycle of expansion and retraction of the agricultural frontier into the Amazon region. The evolution of land use is useful for scenario analysis of both land cover change and land use intensification and provides insights into the role of market development and policies on land use.

1. Introduction

Conversions of forest to cropland and cattle ranching are major causes of deforestation in the Brazilian Amazon, which is a core environmental concern [1,2,3,4,5]. Studies based on remote sensing data estimate that the cleared area in moist closed forests alone has increased from 100 thousand km2 in the 1970s to more than 730 thousands km2 in 2008 [6,7,8]. This rapid deforestation was triggered by federal policies established in the 1970s and 1980s such as the construction of road networks and government-assisted settlements/colonization programs. Spontaneous migration, land speculation and short-lived land productivity with poor land management practices suggest that productive agriculture in the Amazon would be only marginally viable, as land ownership has been dominated by large, unproductive latifundia [9,10,11,12].
In addition, discontinuities in crop production, low productivity rates and the relatively high occurrence of land abandonment observed in the region may corroborate the idea of the limited viability of agriculture in the Amazon [13]. These ideas reinforce the premise of the stagnation, i.e., the significant slowdown of the agricultural frontier. The stagnation of the agricultural frontier in the south of Brazil can be linked to migration of surplus population to northern areas, which has resulted in changes in the location of productive areas into portions of the Amazon with more fertile and better drained soils [10,11,14]. On the other hand, available literature suggests that a likely stagnation of the agricultural frontier in the Brazilian Amazon would be characterized by a specific combination of market development, accessibility to infrastructure and unequal land distribution that limit further evolution of land use systems [10,11,12,15,16].
Previous points of view have assumed that further frontier expansion is driven by the need for new land to ensure agricultural production [10]. At the same time, a number of studies have argued for the need to recognize geographical differences across the region and consider more complex processes to better understand how land use and human systems evolve after deforestation [2,6,17,18,19,20,21,22]. Alves [6] reported significant geographic differences in intensification of cattle ranching activities. Analyzing spatial and temporal changes of land abandonment, recent studies have observed a decrease in the fraction of abandoned land, especially in highly deforested areas, suggesting that land use intensification is more likely in areas with high deforestation levels [6,17,23,24].
The development of market chains and a number of specialized production systems have been argued to trigger economic processes that re-structure agriculture and cattle production. Faminow [2] argues that a major cause of the growth of cattle production in the Amazon was the considerable expansion of regional demand for food in the context of urban expansion and private investments in cattle ranching. Previous authors studied the many motivations for cattle ranching and intensification of pasture land, and concluded that this activity became lucrative and no longer dependent on subsidies due to increasing regional demand and the need for agricultural inputs only years after deforestation [25,26].
Also important is to notice that crop production has faced a number of changes. The increasing importance of soybean plantations in the Brazilian Amazon has been associated with high levels of mechanization and agricultural inputs. Historically, such productive agriculture is dominated by large farms [10,12,16,27]. At the same time, several authors have found viable family farming agriculture and agro-industrial systems coinciding with consolidated market chains; and have shown that the total production value of a group of small size farms can surpass the production value of a large farm [1,5,20,27,28]. In addition, Costa [29] has indicated that land use intensification can be the result of the evolution of existing land use systems and depend on the land distribution structure and market conditions.
Most of these studies conclude that it is required to consider the interactions of market accessibility, agro-pasture revenue and land productivity in analyzing the temporal dynamics and spatial distribution of land use types in recently deforested regions [5,30,31]. Other factors to be considered are land distribution per farm size, land tenure systems, technology and household life cycles [17,21,32,33,34]. Therefore, in order to understand the evolution of land use it is essential to comprehend the complex interactions among land use/cover change, market accessibility and land productivity that follow farm establishment after forest clearing [18,24,32].
Rondônia and Mato Grosso states have very different characteristics in terms of land distribution structure (i.e., the distribution in property size) and land use types [7,15,35,36,37], and a more similar development of market accessibility over the last decade [10,36,38]. Thus, their comparison can reveal how land use expansion and intensification are evolving in response to market accessibility and demand at local and regional scales.
In this paper, agricultural census data from Rondônia and Mato Grosso states at the municipal level and fieldwork observations from 2006 and 2008 are used to relate changes in the land distribution structure to spatial differences and temporal change in production systems. The spatial variation and temporal changes of land use/cover and agricultural intensification are analyzed in relation to the dynamics of market accessibility to better understand the evolution of land use in the region.

2. Land Cover and Land Use History in the Study Area

The distinct land use/cover history in the study area requires a detailed understanding of how land cover and land use evolved in the area during the last decades. Rondônia and Mato Grosso political territories occupy 237 and 903 thousand km2, respectively. The original land cover in these states is characterized by dense tropical forest, the Amazon biome, as well as by savannah vegetation types, the Cerrado biome. In Rondônia, the Amazon and the Cerrado biomes occupy respectively 99% and 1% of the territory. In Mato Grosso, the Amazon and the Cerrado biomes occupy 54% and 39%, respectively, of the territory [39,40]. It is important to notice that a substantial share of the Cerrado biome in Mato Grosso meets the biophysical definition of forest.
Rondônia was part of Mato Grosso and Amazonas States until 1943, with rubber extraction and extrativism of Brazilian nut being the main economic activities until the 1950s [41]. After the 1960s, Rondônia became an independent State where the federal government stimulated migration to dampen land conflicts in southern-central Brazil. Fiscal incentives were granted to agricultural companies, and distinct land ownership rights and subsidies were given to large and small farmers coming from the South and Central parts of Brazil. Conversely, the colonization in Mato Grosso was strongly linked to gold mining, but since the 50s when the government built the federal highway BR-364 connecting the region to Brasília, Mato Grosso has gradually been occupied by loggers, large farms specialized in cattle raising and more recently by grain producers [15,42,43,44,45,46,47]. Climate and soil fertility are more supportive of large scale ranching and agriculture in Mato Grosso, while in Rondônia, agrarian structure clashes among large, medium and small farmers creating a mosaic of land use/cover types.
Nowadays, the states of Mato Grosso and Rondônia are amongst the most deforested states in the Brazilian Amazon. Between 2012 and 2013, deforestation rates increased by 20% in Mato Grosso and 9% in Rondônia, while the total area of forest loss in 2013 was 43% in both states according to annual deforestation assessments done since 1998 using Landsat/TM imagery [7]. An additional governmental tool to assess monthly deforestation using Terra-Aqua/MODIS and CBERS/WFI imagery has ranked deforestation among all Amazonian states to be first and third highest in Mato Grosso and Rondônia, respectively, for both the years 2012 and 2013 [37]. Despite that, deforestation rates in 2013 have significantly decreased by around 62% in Mato Grosso and 36% in Rondônia compared to their average rates between 2000 and 2012 [7]. Important information on deforestation rates was provided by the DETER and PRODES projects on monitoring land cover change [7,37], which are core parts of the governmental effort PPCDAm, considered by the Federal government to be a landmark to encourage many actions to slow down deforestation [48].
Deforestation patterns have shown significant spatial variability determined by the proximity to major roads and by development zones defined by governmental policies, which has resulted in specialization of land use systems and landscape fragmentation [10,23,49,50,51]. Large, geometrically regular clearings are concentrated in medium to large farms and often correlate with areas of high forest conversion rates. Small farms are found in more fragmented landscapes; in areas of small farm colonization projects, they are also associated with high deforestation rates [17,24,35,52,53,54].
In Rondônia, the original vegetation is characterized by dense tropical rain forest on soils with low fertility, similar to the northern part of Mato Grosso. The Cerrado biome, with better drained and more fertile soils, is sparse in Rondônia and dominant in the center and south of Mato Grosso [55]. Whereas some parts of the Cerrado are indeed grassland, they are considered as natural pasture, also when privately held and used for grazing activities. In this sense, the term “natural pasture” is adopted by Instituto Brasileiro de Geografia e Estatística (IBGE) in census data, which confuses the description of the Mato Grosso natural pasture not as the native Cerrado biome, but rather as a planted pasture, which causes some miscalculations of the amount of these two land use categories.
Average annual precipitation of 2000 mm with 3 to 5 months of dry season in the middle of the year are typical for Rondônia [56], while Mato Grosso shows an average annual precipitation of 1500 mm/yr and a longer dry season [40].
Road accessibility to Mato Grosso and Rondônia has progressively improved from the 1970s as colonization projects, land concessions and development zones have been established [10,36]. Planted pasture is the predominant land cover, especially in older settlements, but small plots of cropland are also observed [52,57]. Figure 1 illustrates the study area location, major highways, main urban areas (municipality seats) and political borders of the state and municipalities.
Figure 1. Study area location indicating major highways, main urban areas (municipality seats) and political borders of municipalities in Rondônia and Mato Grosso states.
Land 03 00981 g001
Although private and governmental colonization projects intended for small-scale agriculture have been established in Mato Grosso in the last years, most of the occupied land consists of large farms. Case studies show that deforestation in this state has been caused by timber exploitation and cattle ranching at the initial stages of occupation, but evolved to include highly mechanized soybean cultivation in significant parts of the area [5,45,58,59]. Natural and planted pasture have covered most of the farmland in this state, but since the late 1980s mechanized agriculture, especially soybean cultivation, has significantly increased due to profits and local government incentives to large scale agriculture [1,5,57]. Rondônia’s occupied land is still dominated by a large number of governmental colonization projects intended for small farms, but some areas are dominated by medium and large farms [10,35,60,61]. Such distinct development histories between Rondônia and Mato Grosso are linked to a large variety of land use change trajectories, including the evolution of different types of farms, intensification, stagnation and/or land abandonment [29,34,60,62].

3. Data and Methods

The study was based on statistics from several Brazilian Agricultural Censuses and fieldwork observations from 2006 and 2008 in Rondônia and Mato Grosso states. Overall, the analysis comprised three major steps: (1) census data preparation to compare several years of surveys; (2) analysis of land use/cover changes and land use intensification indicators based on aggregated census data at the state level from 1970 to 2006 and at the municipality level from 1996 and 2006; (3) integration of fieldwork observations to compare and interpret the statistical data. The steps are described in the following section.

3.1. Census Data Preparation

Statistics from the agricultural census were obtained from the Brazilian Statistics Bureau, both in CD-Rom format and from the Bureau’s Portal [57] at the state and municipality levels, including data from the Agricultural Census from 1970, 1975, 1980, 1985, 1995, 1996, and 2006, comprising the period of accelerated agricultural expansion in the Brazilian Amazon.
Major data acquired for this study consisted of land use and land cover categories (“categorias de utilização das terras” according to IBGE), including the areas of perennial and temporary crops, planted and natural pasture, and forest. Also municipality and state level proxies for land use intensification were acquired. These include number and revenue of cattle head, milk production and revenue, number of tractors, harvested area and revenue of individual crops per total number of properties. Land use/cover categories given in the two last censuses (from 1996 and 2006) were reported for different categories of farm size. In total, five farm size categories were considered in the analysis at the municipality level: smaller than 100 ha, within 100–200 ha, 200–500 ha, 500–1000 ha, and larger than 1000 ha. In the cluster analysis step (see Section 3.2.3 and Section 4.2.2), these categories were merged into three groups (smaller than 200 ha, within 200–1000 ha, larger than 1000 ha) in order to facilitate the analysis of similar spatial trends of land use change and intensification.
Because of the frequent changes in the number of municipalities due to creation of new ones, the use of census data to track land use changes presents some limitations such as the lack of consistency between surveyed years. These inconsistencies make the development of inter-census comparisons difficult in terms of absolute values. Therefore, the analysis of the changes between the different censuses was done in terms of percent changes instead of absolute values [6,63]. It could be noticed in particular that the 2006 census data did not report data on unused productive land, limiting the possibilities of estimating changes in land productivity.
Data on land use/cover categories were calculated as the fraction of total and productive farm size represented by perennial and temporary crops, planted and natural pasture (aggregated in a single category named pasture land) and forest.

3.2. Analyses at the State and Municipal Levels

At the state level the fractions occupied by different land use types together with variables that proxy for land use intensification were retrieved for six distinct censuses since 1970 until 2006 [57,64,65,66,67,68]. Fractions of the area occupied by different land use types were computed for Rondônia and Mato Grosso relative to their total area. At the municipality level, fractions of land use types and variables that proxy for land use intensification were retrieved per farm size category for the censuses from 1996 and 2006 [57,68]. This is because most variables adopted as proxies were not available at this level of analysis in the census surveys from previous years. The number of municipalities is 40 in Rondônia and 117 in Mato Grosso when using the municipalities in 1996 as baseline.
The land distribution concentration was analyzed by calculating Gini coefficients of the Lorenz curves according to [69]. Lorentz curves were built representing the cumulative percent distribution of different characteristics of farms (i.e., land use types, cattle herd, milk production, number of tractors or labor force). The calculation of Gini coefficients was done using Equation (1):
G = 1 2 n 1 ( n i = 1 n i C n i = 1 n C n )
where n represents number of different categories of farm sizes (5; listed in Section 3.1), while C is the percentage value of each characteristic of farms calculated per farm size category.

3.2.1. Variables as Proxies of Land Use Intensification

To obtain variables that proxy for land use intensification at the state level, the total number of cattle was retrieved and compared, in relative terms, to the same figures in the Brazilian Amazon and in Brazil as a whole. Raw milk production, cattle per farm and the number of farms per tractor were also calculated at the state level. The lack of consistency among surveyed years of census data due to changes in the number of municipalities forced us to use fractions instead of absolute areas per land use type. The same limitation could bias the comparison between variables that proxy for land use intensification if they were calculated per total area of cultivated land. Despite these limitations, we also present the number of tractors as well as labor force per total area of cultivated land (perennial and annual crops) at the state level to give an indication of the quantities.
Land use intensification indicators at the municipal level were calculated per category of farm size and include the stocking rates as the total cattle herd per hectare of planted and natural pasture. Also, it includes the number of tractors computed as the number of farms per tractor, and labor force, computed as the number of workers belonging to the household (or temporarily/permanent hired) divided by the total number of farms. Labor force was considered only at the municipality level per category of farm size and not at the state level. Census data regarding the number of tractors per farm size category were available only for 2006, while for 1996 the same data were only available aggregated per municipality, i.e., with no information per farm size category. Therefore, estimates of the number of tractors per category of farm size for 1996 were done for each municipality using data from both years, according to Equation (1):
T r ̂ i 1996 = T r 1996 × T r i 2006
where T r ̂ i 1996 is the estimator of the number of tractor for farm size category i in 1996, which is then estimated by T r i 2006 , the given number of tractor for farm size category i in 2006, and Tr1996, the number of tractors per municipality in 1996. Once such estimates where obtained for each farm size category in each municipality, the final land use intensification indicator given as the number of farms per tractor could be assessed.
At the municipality level, milk production per area was retrieved as the total milk production in the year of analysis divided by the total area of planted pasture. In addition, milk revenue was given as the total milk revenue per total milk production. Cattle revenue was assessed by dividing the total revenue of cattle herd selling per area of pasture land (planted and natural pasture) in each municipality, where cattle herd selling refers to the sale of cattle for slaughter or to fattening operations.
The use of solely planted pasture or planted plus natural pasture to calculate the total revenue per unit area from milk production or cattle herd selling is sensitive to differences in land occupation history in natural pasture areas. These differences relate to the fact that natural pasture areas are historically occupied by cattle ranching and not milk production farms and—within the study area—natural pasture is highly concentrated in the center-south of Mato Grosso state [5,70].
Average revenue per type of crop was used as a land use intensification indicator considering the most common perennial and annual crops in both regions in terms of relative area, which represent 95% of crop production. In addition, the average revenue per crop was retrieved, even though only estimates per municipality were used due to data unavailability for different farm size categories. All these land use intensification indicators were retrieved from the censuses of 1996 and 2006 [57,68].

3.2.2. Market Accessibility at the Municipality Level

Market accessibility is a relevant driver of land use/cover change in the Brazilian Amazon at different scales [24,71] and possibly also an important driver of land use intensification in the region. Market accessibility was calculated as the travel time to dairy plants (milk storage and processing) or slaughterhouses accounting for road conditions [31,72].
The travel time is calculated as the cost distance between a point on the map and the reference location (i.e., slaughterhouses and dairy plants). Travel time was calculated using cost distance algorithms using weighted travel time based on fieldwork measurements [31,54,72]. Roads conditions are given as an average speed obtained during our field trips or reported by locals for highways, main and secondary roads (paved/not paved), river network, bays, dams, lakes and lagoons. Information from the Brazilian National Agencies of Terrestrial and Aquatic Transports (ANTT and ANTAQ) were useful to calibrate information obtained in the field. The algorithms used to calculate the market accessibility maps allow the use of higher weights in cells (i.e., the unit of analysis when calculating the accessibility measures) in which the number of dairy plants/slaughterhouses are two or more. This procedure results in a balanced average travel time to market facilities. Geographic data of road networks and locations of dairy plants and slaughterhouses, essential to calculate the accessibility measures, were retrieved from a state level governments’ database [40,73], and complemented by Landsat/TM images interpretation and fieldwork observations in 2006 and 2008.
Changes in travel time between 1996 and 2006 were calculated by subtracting the final travel time maps for 2006 from the maps for 1996. As a measure of change, percentage decrease in travel time between 1996 and 2006 was calculated relative to the 1996 travel time.

3.2.3. Cluster Analysis at the Municipality Level

To combine changes in land use and/or in land use intensification indicators a cluster analysis was made at municipality level. First, the relationships among land use types and the land use intensification indicators in Rondônia and Mato Grosso were quantified per category of farm size in 1996 and 2006 by using Spearman’s ranking correlation Equation (3).
ρ = i ( x i x ¯ ) ̂ ( y i y ¯ ) i ( x i x ¯ ) 2 i ( y i y ¯ ) 2
The Spearman correlation coefficient is defined as the simple Pearson correlation coefficient between the ranked variables (Xi and Yi), i.e., values of xi and yi are assigned a rank equal to the average of their positions in the ascending order of the values of variables Xi and Yi. Thus, for a sample of size n, the n raw scores Xi, Yi are converted to ranks xi, yi to compute ρ.
Spearman’s ranking was obtained for every pair of variables combined among area of land use types and land use intensification indicators per municipality and per farm size category (see Section 4.1). Finally, the variation of coefficient correlation in the 10-year period was calculated according to Equation (4), as follows:
Δρ06−96 = (ρ06 − ρ96) / (ρ06 + ρ96)
where ρ96 and ρ06 are the Spearman’s ranking correlations for every pair of variables (area of land use types and land use intensification indicators per municipality and per farm size category) respectively in 1996 and 2006. Non-parametric ranking correlation was chosen for its suitability regardless of the statistical distributions of the variables, and also because outliers, common in aggregated census data, have less effect on this type of correlation [7]. Farm size categories presenting variables with correlation values equal or higher than 0.60, were considered as having similar trends of change and intensification. Similar farm size categories were merged to facilitate the cluster analysis performed at the municipality level.
Once similar farm size categories were merged according to the procedure described above, we performed a k-means clustering method aiming to identify clusters of municipalities based on similarities in their evolution of land use and their land use intensification indicators. The k-means clustering method was applied to the changes (in %) between 1996 and 2006 of the variables listed in Section 4.1. These variables were all given by farm size category as follows: smaller than 100 ha, between 100 and 200 ha, between 200 and 1000 ha and larger than 1000 ha. Four cluster analyses were run separately for each farm size category using the above-mentioned variables, and all runs also included percent changes of some variables at municipality level only (i.e., not split into farm size categories). These additional variables included deforestation rates, milk and cattle revenue, average revenue of either annual or perennial crops, and travel time to dairy plants or slaughterhouses. Travel time to such facilities, calculated in raster format at 250 m resolution, was aggregated to municipality level by taking the average value of the pixel values inside the boundaries of each municipality. In each clustering, an exploratory analysis was adopted to select the best combination of variables and number of clusters that maximized the differences or similarities between/within clusters of municipalities.
The results of cluster analysis at the municipality level were used to discuss the spatial patterns of evolution of land use systems in the study area (see Section 5.3). The discussion was supported by the calculation of changes to each land use type based on the combination of clusters (as described in Section 4.2.2) with similar temporal land dynamics.

3.3. Fieldwork Data

Data from two fieldwork campaigns performed in 2006 and 2008 were used in this paper. During these fieldwork campaigns, 30 municipalities were visited in Rondônia and 10 in Mato Grosso in order to interview key informants of market and small landholders inside official settlements (also named agrarian projects). The key informants consisted of representatives of local civil organization of farmers, rural extension organizations, municipality governments, research organizations (e.g., local headquarters of EMBRAPA, INCRA, IBGE, CPRM among others), non-governmental organizations, cooperatives, community organizations, milk dairies, slaughterhouses, agro-pasture regulation agencies and local commerce of agro-pasture inputs. The interviews consisted of standard questions, which were adapted to fit the role of the informant during the interviews. Questions aimed to capture the functioning of market chains and document stakeholder observations on land intensification for either milk or beef production.
With small landholders, a total of 86 interviews were conducted in 20 municipalities in Rondônia to record land-use histories in official settlements with different years of establishment. The results obtained in these interviews reflect the overall evolution of land use systems among small landholders and were compared to remote sensing assessments of deforestation [54]. The results were useful to better understand the spatial structure of land use, indicating a dominance of pasture land among small landholders with crops (usually perennial crops) occurring in areas far from roads.
These results of fieldwork campaigns were used to parameterize the calculation of accessibility measures, as described in Section 3.2.2 and to hypothesize and interpret the changes in the land distribution structure in relation to spatial differences and temporal changes in production systems. The outcomes from interviews with key informants and small landholders were used to develop a strategy of analysis of census data in order to understand how changes in land use could be related to market chains. Thus, fieldwork observations mainly supported the analysis and interpretation of the statistical data used in this article.

4. Results

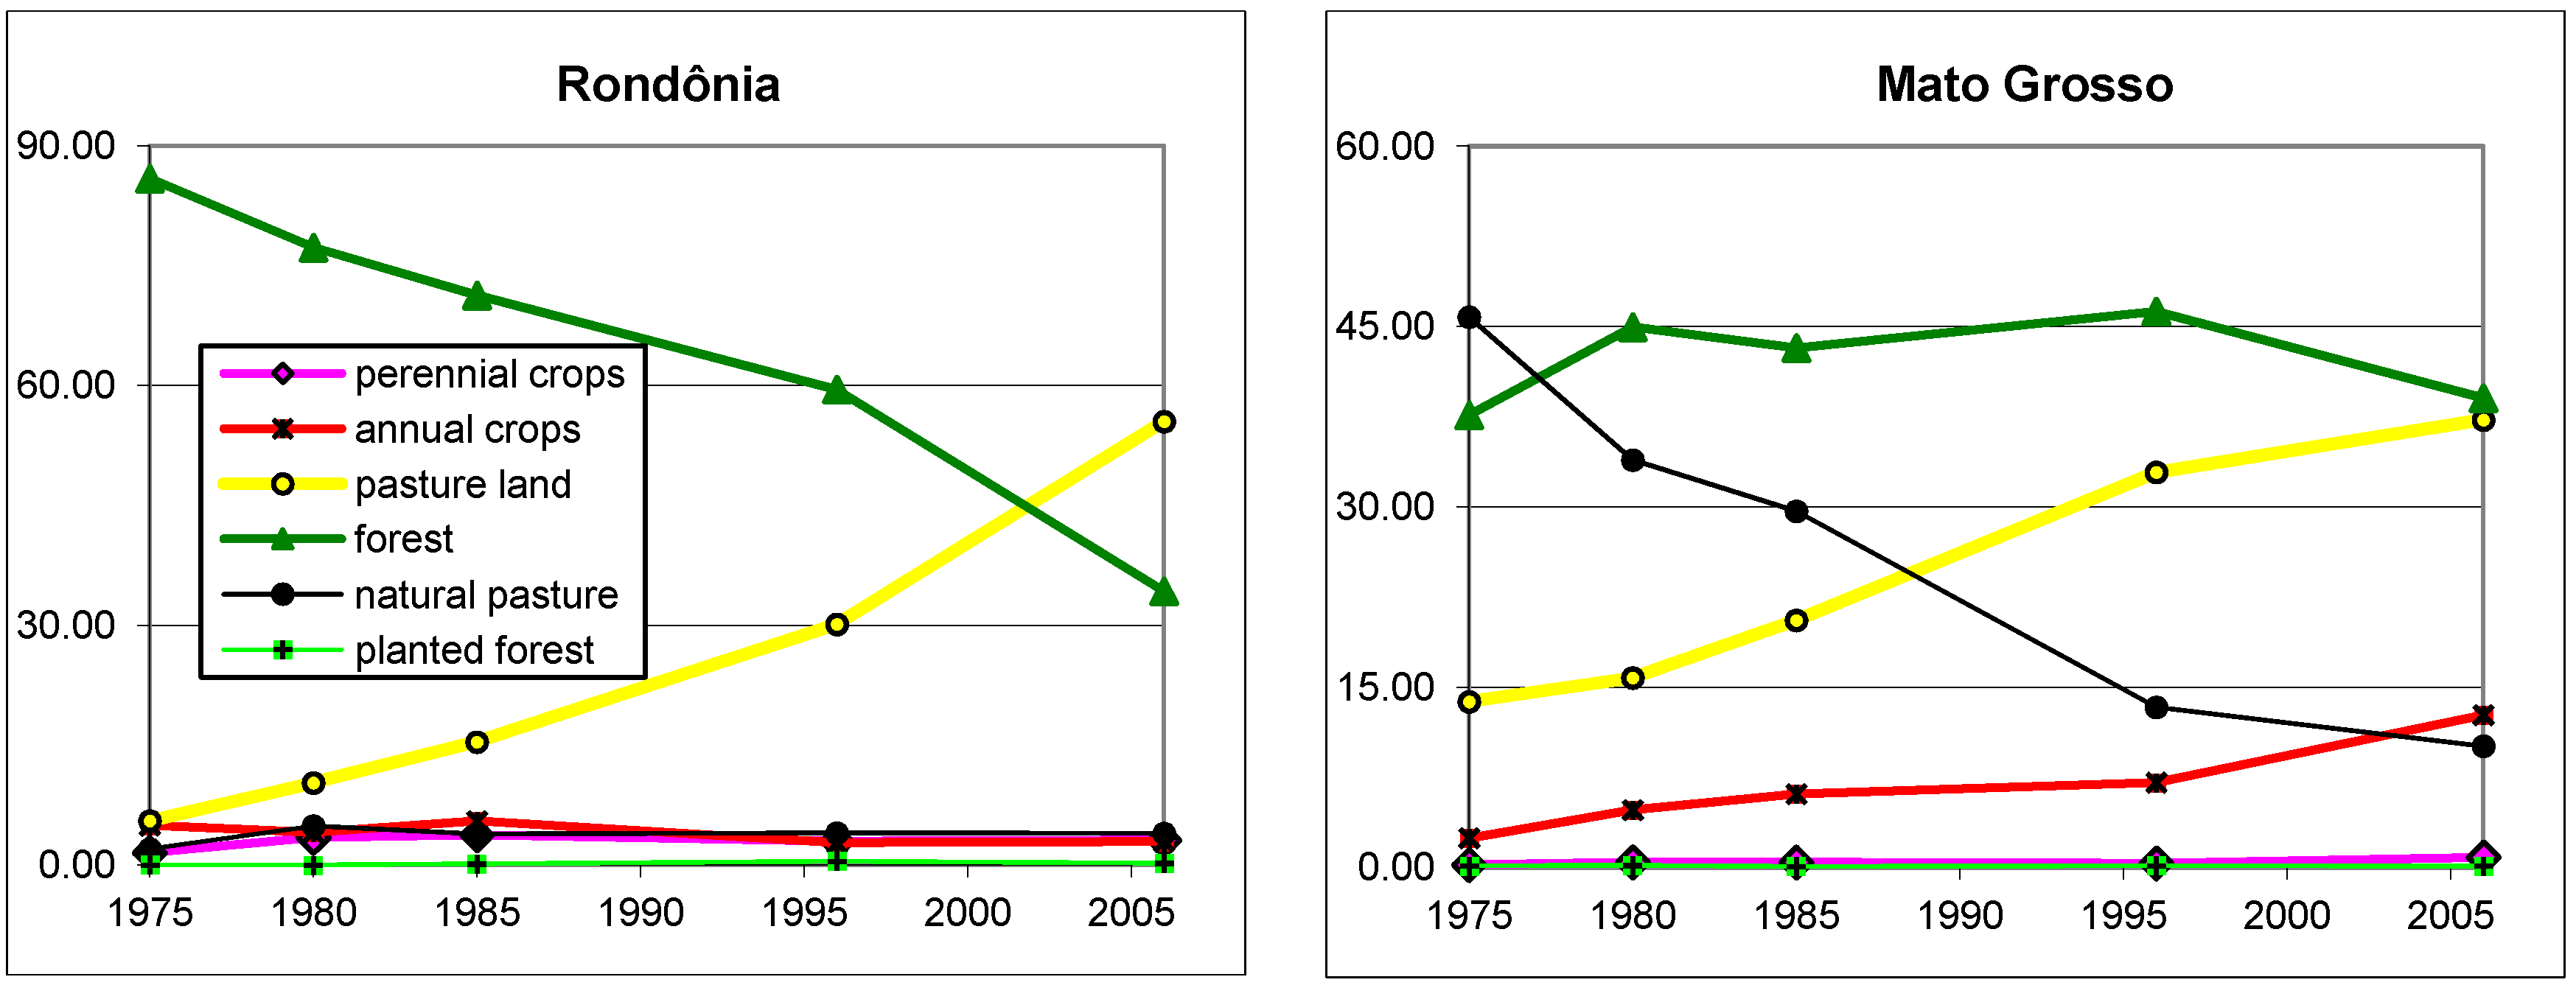
4.1. State Level Land Use Changes during the 1970–2006 Period

Aggregate land-use statistics at the state level during the period 1970–2006 are shown in Table 1 and Table 2. They expose the continuous changes in the region’s landscapes following the expansion of the agricultural frontier into Mato Grosso and Rondônia [10], where the forest area declined as farm land occupied a larger portion of each state with increasing crop and pasture areas.
Considering that the states of Mato Grosso and Mato Grosso do Sul were a single federal unit in 1970, statistics for this year is unreliable, as IBGE does not provide separate data for these two states. Mato Grosso has kept 71% of its original territory, but the more accessible areas at the time were left to Mato Grosso do Sul. Thus, regarding Mato Grosso our analysis relies on statistical data only from 1975 onward, but considers both years for Rondônia. Pasture land occupied more farm land than crops in Rondônia in 1970 and 1975, as well as in Mato Grosso in 1975. In Mato Grosso pasture covered the largest part of the total farm area in 1975, while in Rondônia, forests still covered the majority of the total farm area in 1970 and 1975 (Table 1). At this time, the difference in the relative importance of pasture land between the two states is due to the large predominance of savannah areas (cerrado) in Mato Grosso, which are mostly used as rangeland for extensive cattle production. Yet, stocking rates and tractor use are low everywhere, as well as milk production despite higher values in Mato Grosso than Rondônia in 1975, (see Table 2), indicating low input levels in agriculture that characterize an expanding frontier.
Table 1. Fractions of farm area under different land use types in Mato Grosso and Rondônia states based on Brazilian Agricultural Censuses from 1970, 1975, 1980, 1985, 1996 and 2006.
% of Total Farm Area per Land Use Type
Years1970197519801985199620061970 *19751980198519962006
Land Use TypesRondôniaMato Grosso
Forest86.4285.9277.2771.2959.5134.2621.0537.6344.9543.2246.2539.05
perennial crops0.991.543.433.772.973.120.150.220.440.420.350.84
annual crops2.614.974.105.522.792.951.692.434.786.107.0612.68
pasture land **9.947.5615.1919.2834.1959.4777.0859.5949.6650.1946.2047.32
planted forest0.040.010.000.140.480.230.040.120.170.080.150.12
% total farm area/State area0.050.090.150.170.250.230.190.240.380.420.550.53
Note: * Exceptionally statistics for 1970 in Mato Grosso are officially reported together with statistics for Mato Grosso do Sul state, thus not considered in our analysis; ** pasture land represents the total planted and natural pasture land use types.
In the census data for 1975, annual and perennial crops occupy a smaller fraction of the total farm land area in Mato Grosso as compared to Rondônia, where small farm settlements with more crop production are predominant. In terms of crop production, a large increase in the relative area of annual crops is seen in Mato Grosso between 1985 and 2006, but not in Rondônia (Table 1). The fraction of perennial crops remains smaller than that of annuals, particularly in Mato Grosso where it never represents more than 1% of total farm area. It can be noticed that stocking rates and average milk production increase in both states (Table 2). Tractors per farm or per total area of crops also increase in both States. However, between 1996 and 2006 tractors per total area of crops decrease significantly in Rondônia and especially in Mato Grosso. These results are further explored in the discussion section.
Statistics of land use in the census data for 1980 and 1985 suggest both the concentration of agricultural production in areas of pioneer occupation as well as expansion into new areas. In Rondônia, where farm land has been concentrated in colonization projects along the BR-364 highway [10,17,35], older colonization areas tend to concentrate farm land and forest loss [17,35].
Between 1970 and 1996, the fraction of forest in farmland increased in Mato Grosso, likely because of the stronger effect of the frontier expansion into new areas still under original vegetation, and lower importance of forest loss in existing farms. However, the decline of forest inside properties between 1996 and 2006 might not reflect solely a slowdown of the frontier expansion, but also land intensification. In addition, recent law enforcement over deforestation practices also influenced rates of forest conversion inside properties, especially after 2005 [7,74]. According to Morton and colleagues [5], direct conversion of forest to cropland occurred in large areas during 2001–2004 in Mato Grosso, contributing to historical forest losses that reached 23% in 2003. Their observations show that cropland deforestation averaged twice the size of clearings for pasture, with 90% of clearings for cropland being planted soon after deforestation, which counteracts the argument that agricultural intensification does not lead to new deforestation.
Table 2. Cattle herd, milk and tractor statistics in Mato Grosso and Rondônia based on census data from 1970, 1975, 1980, 1985, 1996, 2006.
Years197019751980198519962006197019751980198519962006
RondôniaMato Grosso
Total cattle herd (thousands)235525177139388491942931105243654614,43819,807
Stocking rates (cattle/ha)0.190.250.330.701.351.750.300.280.350.400.670.90
% Cattle herd relative to the Legal Amazon0.211.062.724.9712.4116.6084.6859.3656.7942.2045.5238.73
% Cattle herd relative to Brazil0.030.050.210.602.574.9512.003.064.445.119.4311.54
Number of cattle per farm325105198205558384183175
Raw milk per farm (100 L/yr)1.161.273.775.8644.5771.7332.606.9714.4415.7747.6645.78
Raw milk per total area of pasture land (100 L/ha)0.671.442.424.2911.7412.860.480.350.620.751.752.34
Pasture land per farm17916143856685200233211272196
Farms per tractor1363758569251510215323
Tractors per total area of perennial and annual crops (tractors/100 ha)0.040.150.220.621.170.580.530.720.920.950.670.04
Note: Exceptionally statistics for 1970 in Mato Grosso are officially reported together with statistics for Mato Grosso do Sul state.
In Mato Grosso, the changes in the fractions of forest, annuals and pasture land (Table 1) indicate that deforestation was most closely correlated with the expansion of annual crops, and somewhat to pasture conversion. However, remote sensing assessments showed that expansion of annual crops over forest and pasture land has decreased considerably in the following years after 2006 [75]. In addition, the authors indicate that soybean production has occurred rather to yield increases and expansion over already cleared land, which reinforces the idea of land use intensification. The decrease of total farm land area, and increases in pasture land per farm, number of cattle per farm and stocking rates (see Table 1 and Table 2) indicate pasture intensification for cattle ranching mostly between 1996 and 2006. Pasture intensification can explain the peak of stocking rates in a region where pasture land and cattle per farm have decreased as well as total farm land area. Therefore, pasture intensification and the usual practices of extensive cattle raising in savannah areas can explain the slower decline in the fraction of forest in Mato Grosso as compared to Rondônia.
Table 3. Total occupied land area and fractions of the total occupied area used by different land use types, stocking rates, labor force, number of farms per tractor and milk production per farm in Rondônia and Mato Grosso states in 1996 and 2006.
Farm Size CategoriesSmall FarmsMedium FarmsLarge Farms
<100 ha100–200 ha200–500 ha500–1000 ha>1000 ha
Rondônia State
% Land Use Types1996200619962006199620061996200619962006
perennial crops74.3473.6517.3613.675.474.930.990.851.846.90
annual crops62.3334.5719.8011.837.1813.262.2413.038.4427.31
pasture land24.9429.8917.0516.5914.6716.309.3610.6933.9926.53
forest14.5820.9811.1613.778.9315.076.2011.8759.1338.31
planted forest27.3037.9620.5214.2710.768.672.470.2038.9538.90
stocking rate (#cattle/ha)1.752.091.581.941.421.801.301.620.921.38
labor force3.730.674.470.514.571.054.961.5510.063.51
# farms per tractor62.4339.3920.6310.616.214.132.521.951.320.90
Milk production per pasture land (L/yr/ha)2702971941658472292464
% of occupied land21.2928.5513.6515.4410.7515.447.0010.8147.3229.76
Total occupied land (104 ha)18.1921.9616.6411.8813.4711.878.718.3250.3722.90
Number of farms61,19970,80010,59198553389408189412498811092
Farm Size CategoriesSmall FarmsMedium FarmsLarge Farms
<100 ha100–200 ha200–500 ha500–1000 ha>1000 ha
Mato Grosso State
% Land Use Types1996200619962006199620061996200619962006
perennial crops37.7422.2211.687.359.6512.255.2410.7035.6947.48
annual crops4.881.902.421.227.594.0811.408.5673.7084.23
pasture land3.927.973.484.487.128.557.798.7977.7070.21
forest2.163.692.162.483.624.234.095.7087.9683.89
planted forest0.395.710.271.521.095.981.629.1096.6377.69
stocking rate (# cattle/ha)1.511.491.151.321.011.150.841.070.560.76
labor force3.291.363.440.343.901.104.461.4510.596.98
# farms per tractor15.7120.546.065.452.201.900.930.860.420.36
Milk production per pasture land (L/yr/ha)19618385784232191532
% of occupied land3.295.622.823.315.536.326.327.5682.0577.18
Total occupied land (104 ha)23.6643.1820.5424.9740.9547.6746.0353.86547.63507.30
Number of farms46,87777,11610,73311,067869093124438505180108519
Note: The term occupied land stands for effective occupied land by farms and not the total state areas.
The importance of cattle ranching increased throughout the study area according to the statistics from 1996 and 2006. Whereas the increase in pasture land was accompanied by increases in stocking rates and milk production; the relative increase in cattle in the study area was remarkable compared to the total cattle herd in Brazil or in the Legal Amazon (see Table 2). In general, stocking rates have remained higher in Rondônia than in Mato Grosso, suggesting that extensive cattle ranching tended to be more important in the latter. These changes have been associated with the development of beef and dairy market chains, at the regional, national and even international levels, which have contributed to the strengthening of the cattle ranching activity [2,4,76]. Also, an important characteristic that contributes to explain the gradual increase of the total number of cattle and milk production per farm since the 1980s is the dual-purpose of milk/beef production (see Table 2) usually employed by small farms, which can be connected to the economic strategies of individual farms [19,34,77,78]. Despite that, aggregated data at the state level per farm must be interpreted with care, as the numbers of small, medium and large farms diverge significantly in Mato Grosso and Rondônia (see Table 3).
Statistics of the Brazilian agricultural censuses from 1996 and 2006 indicate changes in crop production that suggest major shifts in land use, which have an important influence on land distribution structure, as shown in the next section. The continuous increase in stocking rates and raw milk production in both Rondônia and Mato Grosso also indicate important changes in these sectors’ productivity, which is further analyzed considering farm size for 1996 and 2006.

4.2. Land Use Changes at the Municipality Level between 1996 and 2006

4.2.1. Changes in Agrarian Structure and Land Use

Differences in the evolution of perennial and annual crops between Rondônia and Mato Grosso can be linked to the distinct land distribution structure as a response of historical differences in their land tenure systems. Table 3 shows the fractions of land use types and the total land area occupied per category of farm size in Rondônia and Mato Grosso states in 1996 and 2006. Also, statistics in Table 3 show that only farms smaller than 100 ha increased their total occupied land area between 1996 and 2006, while in Mato Grosso all farm size categories increase their total land area, except farms larger than 1000 ha. In Rondônia, perennial crops are concentrated in small farms, especially those smaller than 100 ha. Whereas small farms decreased their share on perennial crops by 4% in Rondônia and 20% in Mato Grosso, large farms increased this share by 5% and 12%, respectively. In Rondônia, annual crops were concentrated in small farms in 1996. Annual crops in small farms had a decrease in area by 35% in 2006, while in the same period increases of annual crops by 17% in medium farms and 18% in large farms were observed. In Mato Grosso large farms concentrated more than 70% of annual crops and increased their share by 10% in the period of analysis.
In Rondônia, half of the pasture land was concentrated in small farms in 2006, while in Mato Grosso more than 70% was found in large farms. Milk production in Rondônia state increased more than 50% between 1996 and 2006, with the bulk production concentrated in farms ranging from 100 to 500 ha, but with farms smaller than 100 ha presenting the highest milk production per hectare. In Mato Grosso stocking rates were higher in farms up to 500 ha, while milk production was more significant among farms smaller than 200 ha. The higher concentration of milk production in Rondônia reflects the increasing milk production among small farms, which goes along with significant increases of cattle herd for dual-purpose in small farms. Decreases in labor force per farm between 1996 and 2006 were smaller in Mato Grosso than in Rondônia, especially among farms smaller than 100 ha or larger than 1000 ha.
Gini coefficients estimated for land use types adopting the municipality level indicate there is an association between changes in land use and agrarian structure (Table 4). In Rondônia, results from Gini coefficients for perennial and annual crops indicate a lesser importance of such land use types among smaller farms. When analyzed together with results from Table 3 (discussed above) increase on pasture land in Rondônia is shown as the reason for the increasing importance of the total land area occupied by these farmers. The increase in occupied area by small farms is also related to a decrease in forest area, and Gini coefficients indicate a more equal distribution among different farm sizes, with changes occurring especially in Mato Grosso. These results indicate a change in the relative importance of most land use types especially among small and large farms in the last decade.
The changes in fractions of milk production, stocking rates together with Gini coefficients for milk production and cattle herd in Rondônia indicate that the increase of milk production among small farms was accompanied by land intensification. This farm size category had played an important role in the strengthening of dairy market chains (as shown next). In Mato Grosso, despite the fact that bulk of milk production decreased between 1996 and 2006 (Table 2 and Table 3), Gini indexes and fractions per farm size category for milk production indicate a concentrated production among small farmers. The changes in Gini coefficients for milk production and cattle herd in Mato Grosso can be attributed to differences in the dual-purpose use of cattle herds, especially among small and medium sized farms.
Table 4. Gini coefficients of land distribution per land use type, milk production, cattle herd and labor force using five categories of farm size.
Gini CoefficientsRondôniaMato Grosso
1996200619962006
perennial crops0.810.730.050.27
annual crops0.630.070.730.86
pasture land0.050.060.760.64
forest0.420.160.870.82
planted forest0.030.240.970.76
milk production0.680.760.340.62
cattle herd0.150.190.580.48
tractors0.130.130.540.54
labor force0.790.720.240.23
Despite constant Gini coefficients for available tractors per farm, the use of machinery showed an overall increase among small and medium farms in Rondônia (as seen in Table 3). Also, the small changes in the Gini coefficient for labor force in both states indicate that large farms have a slightly higher concentration of available work in the large scale agriculture of annual crops in Mato Grosso than in Rondônia.

4.2.2. Changes in the Spatial Distribution of Major Production Systems

Changes in road accessibility to dairy plants and slaughterhouses between 1996 and 2006 are shown in Figure 2. The census data from 1996 to 2006 shows that most agricultural production in Rondônia and Mato Grosso has been focused on a relatively small number of crops compared to other states with a long-term tradition of agricultural production in Brazil, such as São Paulo, Paraná and Rio Grande do Sul [57,64,65,66,67,68]. In Rondônia and Mato Grosso only eight different crops accounted for nearly 95% of all harvested areas for annual and seven for perennial crops (Figure 3a,b). While in Mato Grosso the bulk annual agricultural production is a result of soybean and cotton crops in 2006, Rondônia shows a greater degree of crop diversity including beans, corn and rice. It is important to notice that soybean made up more than 90% of the harvested area of annual crops and more than 50% of revenue from the total cropped area in the same year. In Mato Grosso state the perennial crops rubber, coffee and coconut showed large increases, whereas in Rondônia, cocoa showed the most relevant increase in the harvested area between 1996 and 2006. Despite that, coffee still represents around 80% of the perennial cropped area.
Figure 3a shows that the soybean area increased significantly in both states between 1996 and 2006. The differences between Rondônia and Mato Grosso regarding soybean expansion are illustrated in Figure 3a,c,d. These graphics clearly show that the increase in cropped areas for soybean in Rondônia is linked to the increase of both revenue per total cropped area and average revenue. Also, Figure 3a,d indicate a slightly better average revenue of soybeans in Mato Grosso, where a 10% increase in the fraction of harvested area can be observed between 1996 and 2006. It important to note that already in 1996, the soybean harvested area in Mato Grosso represented 4% of the total harvested area in Brazil. Also, the average revenue of soybean in Mato Grosso represented more than 4% of the total revenue from crops in Brazil. Even with a 29% negative decline of international soybean prices between 1996 and 2006, soybean crops in Mato Grosso still represented more than 11% of the harvested area and more than 6% of the total revenue relative to all annual crops in the country in 2006 [57].
Other crops also showed increases in average revenue, in particular cotton and coconut presented increases in both area and revenue. Even though harvested areas of corn decreased, revenue increased in both states (Figure 3a,c,d). This suggests that corn production might have been influenced by changes in international market associated with corn-ethanol production [79].
The cluster analysis identified clusters of municipalities with similarities in land use changes and intensification indicators between 1996 and 2006. The values of land use/cover types and land use intensification indicators in each cluster are listed in Table 5. The spatial distribution of the clusters are presented in Figure 4a–d according to the different farm size categories included in the analysis: farms smaller than 100 ha (Cluster A), farms between 100 and 200 ha (Cluster B), farms between 200 and 1000 ha (Cluster C) and farms larger than 1000 ha (Cluster D). In the figures the clusters are characterized by the variables that are most typical for the changes in the particular cluster. Also other variables are different between the clusters, as shown in Table 5.
Figure 2. Changes in travel time to: (a) dairy plants; (b) slaughterhouses, given as the percentage decrease in travel time to market facilities between 1996 and 2006 relative to the 1996 travel time. Changes are calculated separately for Rondônia and Mato Grosso and illustrated at the same scale.
Land 03 00981 g002
Figure 3. (a,b) Census statistics from 1996 and 2006 considering the 95% most significant crops in terms of total cropped area per type of crop (annual of perennial) in Rondônia and Mato Grosso; (cf) The fraction of revenue and the average revenue of relevant annual or perennial crops that accounted for 95% of total harvested area in both census surveys.
Land 03 00981 g003
Note: Average revenue shown here are not normalized by the observed inflation, which amounted 78% over the studied period from 1996 to 2006 (see INPC-Extended National Consumer Price Index at [57]).
Figure 4. Clusters of municipalities based on changes in land use and land use intensification indicators for different categories of farm size in Rondônia and Mato Grosso between 1996 and 2006. (a) Cluster A: farms smaller than 100 ha; (b) Cluster B: farms between 100 and 200 ha; (c) Cluster C: farms between 200 and 1000 ha; (d) Cluster D: farms larger than 1000 ha.
Land 03 00981 g004
Table 5. Results of k-means clustering based on land use/cover changes and intensification indicators at the municipality level.
Final Clusters of Municipality Considering the Percent Variation of Changes between 1996 and 2006
Clusters of MunicipalitiesNDeforestation RatePerennial CropsAnnual CropsPasture LandForestStocking RatesLabor ForceNumber of TractorsMilk ProductionMilk RevenueCattle RevenueAverage RevenueTravel Time to
Perennial CropsAnnual cropsDairy PlantsSlaughter Houses
AA.167n/s2425n/s49−5−68n/s63307557n/s−5n/s
A.290n/s−35−53n/s−1412−90n/s48296630n/s−6n/s
BB.1792134n/s2313n/sn/sn/s65n/s69n/sn/sn/sn/s
B.27813−64n/s4−20n/sn/sn/s48n/s52n/sn/sn/sn/s
CC.1551847−3118n/s11−5417403672n/s54−7−1
C.23123−25922n/s8−3723253971n/s47−7−3
C.34712−65−646n/s11−6411222967n/s40−6−2
C.42415−8632−4n/s2−5512−350444n/s39−22
DD.117n/s38−7813−220−3220n/sn/s762832n/sn/s
D.227n/s−74−80−34−727−605n/sn/s−233846n/sn/s
D.363n/s−95−214−716−2718n/sn/s653445n/sn/s
D.450n/s4846−4−911−1620n/sn/s565653n/sn/s
n/s—Non-significant variables discarded in an automatic k-means clustering procedure.
The results of cluster analysis (Table 5) show that municipalities with farms between 100 and 200 ha were split by k-means method into two clusters (A.1 and A.2), the temporal differences of which are due to spatial concentration of annual and perennial crops, larger fractions of forest inside properties, higher milk production and higher revenue from perennial crops in Cluster A1 as compared to Cluster A.2. Cluster A.2 shows that a significant number of municipalities holds farms between 100 and 200 ha with higher stocking rates, significant lower fractions of forest area, perennial and annual crops and lower revenue from cattle and milk production than Cluster A.1. Similarly, municipalities with farms between 200 and 500 ha were divided into two clusters (B.1 and B2). As compared to Cluster B.2, Cluster B.1 has higher fractions of deforestation, perennial crops, pasture land as well as milk production and cattle revenue.
The results of clustering analysis of municipalities regarding larger farms show that the k-means method divided both farm size categories (500–1000 and >1000 ha) into four clusters. Clusters of municipalities based on the characteristics of farms between 500 and 1000 ha are differentiated mostly due to fractions of perennial and annual crops, pasture land and milk production. Conversely, clusters of municipalities for farms larger than 1000 ha are differentiated especially by annual crops and labor force, while milk production had no significant influence on the differentiation of the clusters. It is important to note that the revenue from annual crops and the number of tractors had a significant influence on the differentiation of the clusters considering larger farms only.

5. Discussion

5.1. Evolution of Land Use

Analysis of land use dynamics at the regional level indicated that Rondônia and Mato Grosso had a distinct evolution of annual and perennial crops between 1970 and 2006, with pasture land development differing between the two states especially after 1996. Annual crops have increased in importance relative to other land uses in Mato Grosso, where increased mechanization shown by increased tractor use can be explained by the significant growth in commercial agriculture, mostly for soybean cultivation. Experts indicate that amongst the most important reasons for the growth in commercial agriculture for soybean cultivation are international demand and globalization, large profits from recent peaks in soybeans prices allowing for more land purchase, land and profits speculation, regional integration, rapid technological change and improvement of infrastructure supported by from Mato Grosso’s government [27,80]. The results on the spatial dynamics of annual crops and pasture land between 1996 and 2006 agree with de Espindola et al. [81] who integrated PRODES data [7] with the same census data adopted in this article. The decrease in tractors per farm and per total crop area (Table 1) in both states in 2006 is a result of frontier expansion into new areas, particularly in Mato Grosso, as well as the increasing number of smaller size farms, especially in Rondônia.
Since 1996, pasture land has become the dominant land use in both states. Especially in Rondônia the increase of at least 50% in cattle herd, stocking rates, milk production and tractors per farm/total cropped area can be argued to characterize the evolution of land use systems in this state. During fieldwork interviews, milk production has been reported as representing 30% to 50% of total income for farms smaller than 200 ha, the most common farm size category in Rondônia. Milk production is strongly correlated with high stocking rates and increases in planted pasture, as well as with the maintenance of perennial crops among farms smaller than 100 ha in Rondônia at both levels of analysis.
Rondônia and Mato Grosso were amongst the six Brazilian states with the largest contribution to national milk production in 2006. Even though milk production per farm in Rondônia and Mato Grosso was much higher than the national average in 2006, the spatial scale dependence of milk prices explains that the average milk revenues in these states are 35% and 4%, respectively, lower than the national average. The intensification of milk production in small farms, particularly in Rondônia, has been pushed by an increase in regional and national milk demand [2,76]. Such increases in demand indicate higher milk consumption by local and national markets and suggest a vertical integration of regional milk production, also reported by key informants during fieldwork interviews in 2008, including milk industrialization with UHT (ultra-high-temperature) processing. In addition, the production of some specialized types of cheese has been stimulated by the increasing consumption markets located in Manaus and also at important national markets such as São Paulo and Rio de Janeiro.
If the progress of mechanized agriculture can be seen as an important trait of developments in Mato Grosso, pasture use intensification is the major characteristic of land use development in Rondônia. Results from the TerraClass project based on remote sensing data [82,83] confirm the trends in mechanized agriculture in Mato Grosso where temporal changes identified by land use classification using Landsat/TM imagery show that annual crops (mostly soybean) increased by 4.9% between 2006 and 2008. TerraClass data also confirm our analysis of intensification in pasture land in Rondônia, where land total pasture land decreased by 1.5% between 2006 and 2008, but at the same time the cattle herd increased by 13% between 2006 and 2008 [84]. Indications of pasture intensification at both levels of analysis, also observed in fieldwork interviews in 2008, show that small and medium farmers have chosen to specialize in milk production activities in response to household socioeconomic differentiation and regional milk market improvement [24,30,34,54,85,86,87,88,89,90].
Mato Grosso reached the largest cattle herd among all Brazilian states, pushing the largest part of the national herd to the Legal Amazon. The census data suggest that pasture intensification in Rondônia is associated with higher stocking rates and milk production. On the other hand, in Mato Grosso, changes in the cattle industry are linked, to some degree, with intensification in cattle ranching, especially in the cerrado areas where better-drained and more fertile soils provide a higher suitability for extensive cattle breeding.
Despite the fact that stocking rates augmented, it is important to note that they remained relatively modest ranging from 0.34 to 2.09 heads per hectare throughout the study area. It is also relevant that the low level of land management in cattle ranching activities cannot guarantee long-term intensification or sustainability of this industry [20,91].
Of particular interest are changes in the distribution of land use between smaller and larger farm size categories. Changes in Gini coefficients suggest that smaller farms have increased their share in pasture land, while in larger farm sizes perennial and annual crops have become more significant, with the notable relevance of annual crops in Mato Grosso. However, this shift in pasture land to smaller farm sizes should not be seen as evidence of changes in land inequality. Instead, it is indicative of a more effective participation of smaller farms in milk and beef markets. These findings are related to recent observations for the Northern Amazon [30].

5.2. Spatial Distribution of Land Use

The changes in travel time to dairy plants (Figure 2a) show spatial correlation with the clusters of municipalities with significant changes in perennial crops and milk production among farms smaller than 100 ha (Cluster A.1, Figure 4a). This is an indication that improvements of accessibility to dairy plants are related to positive change in perennial crops among farms smaller than 100 ha. Municipalities in Cluster A.1 enclose 37% of official settlements (or agrarian projects) in Rondônia and 57% of those in Mato Grosso, especially the ones established after 1980 where accessibility is usually poorer than in older settlements, and thus are more affected during the rainy season [24,54]. These results suggest that milk markets expansion has led small farms located in more accessible areas to choose for milk production rather than for crop production. On the other hand, small farms in less accessible areas tend to keep using perennial crops as a survival strategy when milk market profitability is affected (e.g., due to dirty roads in the rainy season and/or impoverished pasture in the dry season). Also, the choice of crops over pasture is more common in recently occupied properties as profits from crops tend to be faster and labor force availability is higher due to the initial stages of household life cycles related to these properties [34,49,92]. Deeper understanding of the role of life cycles on the evolution of land use is required through case studies in the area [49].
These results suggest that accessibility costs to milk markets can determine small farmers’ strategies at initial stages of colonization [89]. As survival strategy to keep their land, these farmers persist with subsidized, labor intensive crops, such as coffee and cocoa [60]. This can also be linked to better profit margins of perennial crops, compared to average revenue from annual crops (see Figure 3), while milk production is not well established. As infrastructure is improved and planted pasture is consolidated, milk production increases while at the same time forest remnants are removed. These observations are in agreement with household level studies in Rondônia and Pará that explain land use dynamics among small farms by average revenue and required labor force [19,34,77,78].
Clusters B and C (Figure 4b,c) indicate the expansion of pasture into a number of municipalities distant from the main roads, especially in Mato Grosso. The improvement of accessibility to slaughterhouses has been concentrated in the northern portions of both States, between 1996 and 2006 (Figure 2b), where the increase in pasture land was determined by farms between 100 and 1000 ha. Revenue from milk production and cattle have played an important role in land use system evolution of farms between 100 and 1000 ha, especially farms located in areas of recent pasture expansion and improved accessibility to slaughterhouses (Clusters B.1 and C.1).
Stocking rates among farms between 200 and 1000 ha followed similar trends of milk production, milk and cattle revenue, as well as improved accessibility to milk market facilities during 1996 to 2006 (see Table 5). In areas where stocking rates were higher (Clusters C.1 and C.3) annual crops decreased together with pasture land, while available tractors per farm increased significantly in areas of annual crop intensification (Clusters C.2 and C.4). This suggests that some land use systems that supply milk and beef demands might be under high risk of degradation as overgrazing with low technological levels persists over long term planted pasture areas.
Cluster D (Figure 4d) indicates that annual crops in Rondônia have increased their spatial distribution among farms larger than 1000 ha to the southern and north-northeastern areas in 2006. In Mato Grosso, large farms not only increased their fraction of annual crops, but also their spatial concentration in the center and central-western portions of the state, i.e., close to the major roads. Average revenue of annual crops was higher in Cluster D.4, which suggests better crop productivity in areas where large-scale agriculture is spatially concentrated and better consolidated. This is strongly linked to a high number of tractors and a more concentrated labor force per farm. However, land use intensification inferences based on forest change and number of tractors cannot only be attributed to annual crops, as pasture land expansion among large farms presented similar cluster centers for these indicators. Further analysis is needed in which deforestation rates are tackled separated by farm size category and not per municipality as given in the source data.

5.3. Frontier Expansion

A deeper comprehension of the distinct evolution of land use linked to farm size categories, as shown in this study, can help land use studies to incorporate regionalized, heterogeneous land use pathways taking place in the Brazilian Amazon frontier [15,29,71]. Census estimates of changes in forest at the state level are not consistent with data on increases in deforestation during the period of study [6,7]. Despite that, our results at the municipality level agree with recent remote sensing based land use mapping in the Brazilian Amazon as well as with spatial land use trends revealed by remote sensing based deforestation data combined with the same census data used here [81,82,83]. Municipality level data indicate that the frontier of expansion is still active, in particular, among small and mid-sized farms. The analysis of such data can help regionalize scenario analysis of frontier development.
Figure 5 summarizes changes in forest, planted pasture, natural pasture, annual and perennial crops based on census data at the state level from 1970 to 1996, and at the municipality level between 1996 and 2006. The calculation of changes to each land use type was based on the combination of the municipalities of the following clusters: A.1, B.1, C.1, D.1 and D.4 for perennial crops; C.2, C.4 and D.4 for annual crops; B.1, C.1, C.2 and D.12 for pasture land. Figure 5 indicates similarities in the frontier of expansion between Rondônia and Mato Grosso regarding historical land use changes of pasture land increase over forest areas, but with distinct evolution of annual crops, natural pasture and somewhat of perennial crops.
Figure 5. Changes of land use/cover change based on regionalized historical census data in Rondônia and Mato Grosso from 1970 to 2006, where the land use changes on perennial crops, annual crops or planted pasture were based on municipalities of clusters, taking into account the increase of the target land use type between 1996 and 2006.
Land 03 00981 g005
The present analysis disagrees with the premise of frontier stagnation in the Brazilian Amazon that has been suggested in the past by some authors [13], who focus on environmental legislation to explain frontier expansion into new productive areas. The results obtained here indicate that pasture and agricultural expansion are continuing in already deforested areas. At the same time land use intensification can diminish significant frontier expansion further north in the Amazon. Not surprisingly, our analysis has shown that intensification processes in consolidated areas of agricultural production are a result of technological improvement, market accessibility and unequal land distribution, which the same factors are supposed to explain the cycle of expansion and retraction of the Brazilian frontier into the Amazon. As a result, there are no clear insights about possible retraction of the agricultural frontier, so any conclusion regarding the agricultural expansion frontier should not make simplistic assumptions about low productivity and the need to incorporate new areas to guarantee food demands in the future [13]. Instead, consistent and plausible scenarios of sustainable development to the Amazon region shall consider the influence of recent and unpredictable factors resulting from the capitalist expansion such as the increase on wage labor near cities, poor land availability, land prices, environmental constraints or law enforcement [6,93,94].
Gini indexes indicate the continuation of a very unequal structure of land distribution with large farms gradually increasing their areas of annual and perennial crops, especially in Mato Grosso. The stagnant land inequality has been reinforced by rural policies benefiting cattle ranching and grain farmers [95,96], who have been identified by a number of studies as important contributors to the deforestation in the Amazonian scale [61,62,97,98,99] . However, changes in Gini indexes show that small farm size categories have significantly increased their contribution especially to milk production at regional and national markets. This could be a result of land redistribution programs and better opportunities to sustain farming among small farmers [61,62,97,98,99]. At the same time, one should not forget that these policies have promoted concentrated deforestation in pioneer settlements and fast forest removal in recent settlements [54].
The analyses suggest that accessibility to milk markets has facilitated planted pasture consolidation among small farms in Rondônia and Mato Grosso as well as in other states in the Brazilian Amazon as indicated by other authors [100]. Milk market chains determined the shift from informal/small scale milk commercialization to industrial organization levels, characterizing the vertical markets integration. This new market structure promotes reduced risks, standardized milk quality and guaranteed income to small milk producers, but might become a threat to rural development by controlling prices and overruling regional markets [101]. Therefore, vertical market integration needs regulation as it may have negative impact on land use choices among small producers. This is because land use intensification and better land productivity do not necessary improve farmers’ quality of life.
Further analysis is needed regarding low levels of land management and the threats of pasture degradation, especially among small and mid-sized farms that are the largest contributors to milk production. Sustainable practices of pasture land in the region might strongly depend on appropriate rural extension, accessibility to technology through machinery and promotion of social organization allowing knowledge exchange and resource sharing.
The spatial distribution of land use types shows that medium farms (200–1000 ha) specialized in cattle raising and large soybean producers influence the frontier differently. Cattle farms tend to expand cattle raising in areas close to the forest fringes where small milk producers are also established. Soybean plantations are concentrated in inner areas and their expansion occurs through land consolidation followed by intensification with high levels of technology [1,5,15]. The evolution of land use systems in space and time is determined by land distribution inequality and accessibility to markets, as local changes in basic infrastructure conditions can promote land use intensification by facilitating production and speeding up land consolidation.
Despite data limitations, our analyses indicate regional and intra-regional differences among small, medium and large farms, as well as similarities within these groups regarding the evolution of land use systems and the land use intensification indicators. The general trends of the frontier of expansion indicate that the usual deforestation and degradation cycle has been gradually substituted by land use intensification, especially regarding large scale agriculture of annual crops or perennial crops in long term established settlements. At last, the reader must take into account that the results obtained in this study do not imply that further deforestation cycles shall follow similar intensification dynamics. Thus, governmental and non-governmental actions combined to local community efforts must take into account the spatial and temporal variations in development trajectories of land use systems in response to the local and regional socio-economic and biophysical context.

6. Conclusions

It is concluded that Rondônia has a very different evolution of land use compared to Mato Grosso between 1970 and 2006, which is closely related to differences in land distribution structure as a result of differences in the agricultural colonization history between these two states. While in Mato Grosso a number of better-capitalized large farms increased annual crops over pasture or forest, smaller farms increased pasture for milk production over forest, keeping perennial crops as a survival strategy in Rondônia. The dominance of pasture land in both states is similarly dependent on land distribution, driven by the current socioeconomic differentiation and land management among farm size categories. Differential pathways of land use development are determined by accessibility to markets as well as by the land distribution structure. Improvement of accessibility to milk markets has determined land use evolution among small and medium farms as well as the deforestation frontier in the study area. The improvement of accessibility to beef markets has determined the spatial concentration of cattle ranching farms as well as local decisions to increase stocking rates, land use change from annual crops to pasture and deforestation. Major roads have determined the increase of annual crops among large farms, which has promoted a significant increase in labor force and machinery that might be linked to better productivity and land intensification processes. However, further analyses are needed to conclude how recent deforestation rates can be attributed to either annual crops or pasture land.
The data analyzed do not provide a strong indication of frontier stagnation in the Brazilian Amazon. Instead, there are hints that intensification processes in consolidated areas are able to explain the cycle of expansion and retraction of the agricultural frontier into the Amazon region. The analysis confirms that a governance of these processes may have benefits for slowing down deforestation. Further research should, therefore, test whether the current occupied land in Brazil can be properly managed to increase productivity and guarantee food demands in the future while slowing down rates of deforestation.

Acknowledgments

This research was funded by the Dutch National Science Foundation (NWO-WOTRO) project “Vulnerability and resilience of the Brazilian Amazon forests and human environment to changes in land use and climate”. Financial contribution was also received from ERC Grant Agreement N. 311819 (GLOLAND). The authors would like to thank technicians from several institutions including the National Institute of Colonization and Land Reform (INCRA), national rural extension services (EMATER, CEPLAC), Sanitation State Agencies (IDARON/RO, INDEA/MT), Brazilian Agricultural Research Corporation (EMBRAPA), Brazilian Federal Inspection Service (SIF) as well as managers of several dairy plants and slaughterhouses interviewed during a fieldwork campaign in 2008 in Mato Grosso and Rondônia states. Thank you for sharing relevant information and specific knowledge essential for the development of this research.

Author Contributions

Luciana S. Soler was mainly responsible for all parts of the manuscript including conception and design, data acquisition, analysis and interpretation of data, coherence and intellectual relevance of content, draft, review and submission. Peter H. Verburg made substantial contributions to conception and design, data interpretation, language coherence, draft and critical review for important intellectual content. Diógenes S. Alves made substantial contributions to conception and design, data acquisition, data analysis and interpretation, draft and critical review for important intellectual content.

Conflicts of Interest

The authors declare no conflict of interest.

References

  1. Barona, E.; Ramankutty, N.; Hyman, G.; Coomes, O.T. The role of pasture and soybean in deforestation of the Brazilian Amazon. Environ. Res. Lett. 2010, 5. [Google Scholar] [CrossRef]
  2. Faminow, M.D. Cattle, Deforestation and Development in the Amazon; CAB International: New York, NY, USA, 1998. [Google Scholar]
  3. Fearnside, P.M. Amazon forest maintenance as a source of environmental services. An. Acad. Bras. Cienc. 2008, 80, 101–114. [Google Scholar] [CrossRef] [PubMed]
  4. Margulis, S. Causes of Deforestation in the Brazilian Amazon; World Bank: Washington, DC, USA, 2004; Volume 22. [Google Scholar]
  5. Morton, D.C.; DeFries, R.S.; Shimabukuro, Y.E.; Anderson, L.O.; Arai, E.; del Bon Espirito-Santo, F.; Freitas, R.; Morisette, J. Cropland expansion changes deforestation dynamics in the southern Brazilian Amazon. Proc. Natl. Acad. Sci. USA 2006, 103, 14637–14641. [Google Scholar] [CrossRef] [PubMed]
  6. Alves, D.S. Cenários de cobertura e uso da terra e dimensões humanas no LBA. In Dimensões Humanas da Biosfera-Atmosfera na Amazônia; Costa, W.M., Becker, B.K., Alves, D.S., Eds.; Editora da Universidade de São Paulo (EDUSP): São Paulo, Brazil, 2007; pp. 39–63. [Google Scholar]
  7. Instituto Nacional de Pesquisas Espaciais (INPE). PRODES—Monitoring the Brazilian Amazonian Forest by Satellite Images; INPE: São José dos Campos, Brazil, 2013. [Google Scholar]
  8. Tardin, A.T.; Lee, D.C.L.; Santos, R.J.R.; Assis, O.R.; Barbosa, M.P.S.; Moreira, M.T.; Silva, D.; Santos Filho, C.P. Subprojeto Desmatamento. Convênio IBDF/CNPq–INPE; National Institute for Space Research (INPE): São José dos Campos, Brazil, 1980. [Google Scholar]
  9. Hecht, S.B. Environment, development and politics: Capital accumulation and the livestock sector in Eastern Amazonia. World Dev. 1985, 13, 663–684. [Google Scholar] [CrossRef]
  10. Machado, L. A fronteira agrícola na Amazônia. In Geografia e Meio Ambiente no Brasil, 2nd ed.; Cia das Letras: São Paulo, Brazil, 1998; pp. 181–217. [Google Scholar]
  11. Sawyer, D. Frontier expansion and retraction in Brazil. In Frontier Expansion in Amazonia; Schmink, M., Wood, C., Eds.; University Press of Florida: Gainesville, FL, USA, 1984; pp. 180–203. [Google Scholar]
  12. Velho, O.G. Capitalismo Autoritário e Campesinato; DIFEL: São Paulo, Brazil, 1976. [Google Scholar]
  13. Miranda, E.E.; Oshiro, O.T.; Victoria, D.C.; Torressan, F.E.; Carvalho, C.A. O alcance da legislação ambiental e territorial. Fund. Getúlio Vargas 2009, 28, 25–31. [Google Scholar]
  14. Waibel, L. Capítulos de Geografia Tropical e do Brasil, 2nd ed.; Instituto Brasileiro de Geografia e Estatística (IBGE): Rio de Janeiro, Brazil, 1979; p. 328. [Google Scholar]
  15. Becker, B. Amazônia: Geopolítica na Virada do III Milênio; Garamond: Rio de Janeiro, Brazil, 2004; p. 172. [Google Scholar]
  16. Foweraker, J. The Struggle for Land: A Political Economy of the Pioneer Frontier in Brazil from 1930 to the Present Day; Cambrigde University Press: Cambridge, MA, USA, 1981. [Google Scholar]
  17. Alves, D.S.; Escada, M.I.S.; Pereira, J.L.G.; Linhares, C.D. Land use intensification and abandonment in Rondonia, Brazilian Amazonia. Int. J. Remote Sens. 2003, 24, 899–903. [Google Scholar] [CrossRef]
  18. Alves, D.S.; Morton, D.C.; Batistella, M.; Roberts, D.A.; Souza, C., Jr. The changing rates and patterns of deforestation and land use in Brazilian Amazonia. In Amazonia and Global Change; Keller, M., Bustamante, M., Gash, J., Dias, P.S., Eds.; American Geophysical Union: Washington, DC, USA, 2009; Volume 186, pp. 11–23. [Google Scholar]
  19. Browder, J.O.; Pedlowski, M.A.; Walker, R.; Wynne, R.H.; Summers, P.M.; Abad, A.; Becerra-Cordoba, N.; Mil-Homens, J. Revisiting theories of frontier expansion in the Brazilian Amazon: A survey of the colonist farming population in Rondonia’s post-frontier, 1992–2002. World Dev. 2008, 36, 1469–1492. [Google Scholar] [CrossRef]
  20. Chomitz, K.M.; Thomas, T.S. Geographic Patterns of Land Use and Land Intensity in the Brazilian Amazon; World Bank Policy Research Working Paper No. 2687; The World Bank: Washington, DC, USA, 2001. [Google Scholar]
  21. Muchagata, M.; Brown, K. Cows, colonists and trees: Rethinking cattle and environmental degradation in Brazilian Amazonia. Agric. Syst. 2003, 76, 797–816. [Google Scholar] [CrossRef]
  22. Rodrigues, A.S.L.; Ewers, R.M.; Parry, L.; Souza, C.; Verissimo, A.; Balmford, A. Boom-and-bust development patterns across the Amazon deforestation frontier. Science 2009, 324, 1435–1437. [Google Scholar] [CrossRef] [PubMed]
  23. Mello, A.Y.I.; Alves, D.S. Secondary vegetation dynamics in the Brazilian Amazon based on thematic mapper imagery. Remote Sens. Lett. 2011, 2, 189–194. [Google Scholar] [CrossRef]
  24. Soler, L.S.; Escada, M.I.S.; Verburg, P.H. Quantifying deforestation and secondary forest determinants for different spatial extents in an Amazonian colonization frontier (Rondonia). Appl. Geogr. 2009, 29, 182–193. [Google Scholar] [CrossRef]
  25. Andersen, L.E.; Granger, W.J.; Reis, E.J.; Weinhold, D.; Wunder, S. The Economics of Deforestation: Dynamic Modeling of Amazonia; Cambridge University Press: Cambridge, UK, 2002. [Google Scholar]
  26. Faminow, M.D. Spatial economics of local demand for cattle products in Amazon development. Agric. Ecosyst. Environ. 1997, 62, 1–11. [Google Scholar] [CrossRef]
  27. Hecht, S.B. Soybeans, development and conservation on the Amazon frontier. Dev. Chang. 2005, 36, 375–404. [Google Scholar] [CrossRef]
  28. Brown, J.C.; Koeppe, M.; Coles, B.; Price, K.P. Soybean production and conversion of tropical forest in the Brazilian Amazon: The case of Vilhena, Rondônia. AMBIO J. Hum. Environ. 2005, 34, 462–469. [Google Scholar]
  29. Costa, F.A. Market and production of lands in Amazon: Evaluation referred to technological trajectories. Bol. Mus. Para. Emílio Goeldi Ciênc. Hum. 2010, 5, 25–39. [Google Scholar]
  30. Costa, W.M. Tendências recentes na Amazônia: Os sistemas produtivos emergentes. In Dimensões Humanas da Biosfera-Atmosfera na Amazônia; Becker, B., Alves, D.S., Costa, W.M., Eds.; Editora da Universidade de São Paulo (EDUSP): São Paulo, Brazil, 2007; pp. 81–112. [Google Scholar]
  31. Verburg, P.H.; Overmars, K.P.; Witte, N. Accessibility and land-use patterns at the forest fringe in the northeastern part of the Philippines. Geogr. J. 2004, 170, 238–255. [Google Scholar] [CrossRef]
  32. Costa, F.A. Trajetórias tecnológicas como objeto de política de conhecimento para a Amazônia: Uma metodologia de delineamento. Rev. Bras. Inov. 2009, 8, 35–86. [Google Scholar]
  33. Futema, C.; Brondizio, E. Land reform and land-use changes in the lower Amazon: Implications for agricultural intensification. Hum. Ecol. 2003, 31, 369–402. [Google Scholar] [CrossRef]
  34. Moran, E.F.; Siqueira, A.; Brondizio, E.S. Household demographic structure and its relationship to deforestation in the Amazon Basin. In People and the Environment Approaches for Linking Household and Community Surveys to Remote Sensing and GIS; Fox, J., Rindfuss, R.R., Walsh, S.J., Mishra, V., Eds.; Kluwer Academic Publishers: Dordrecht, The Netherlands, 2003; pp. 61–89. [Google Scholar]
  35. Alves, D.S. Space-time dynamics of deforestation in Brazilian Amazonia. Int. J. Remote Sens. 2002, 23, 2903–2908. [Google Scholar] [CrossRef]
  36. Becker, B. Geopolítica da Amazônia. Estud. Av. 2005, 19, 71–86. [Google Scholar] [CrossRef]
  37. Instituto Nacional de Pesquisas Espaciais (INPE). DETER–Near Real Time Deforestation Detection System; INPE: São José dos Campos, Brazil, 2013. [Google Scholar]
  38. Pfaff, A.; Robalino, J.; Walker, R.; Aldrich, S.; Caldas, M.; Reis, E.; Perz, S.; Bohrer, C.; Arima, E.; Laurance, W.; et al. Roads and deforestation in the Brazilian Amazon. J. Reg. Sci. 2007, 47, 109–123. [Google Scholar] [CrossRef]
  39. Instituto Brasileiro de Geografia e Estatística (IBGE). Mapa de Biomas e de Vegetação; IBGE: Rio de Janeiro, Brazil, 2004. [Google Scholar]
  40. Secretaria de Estado do Desenvolvimento Ambiental (SEDAM). Zoneamento Socioeconômico-Ecológico; [CD-Rom]; Governo de Rondônia: Cuiabá, Brazil, 2002; Volumes 10, 12 and 20.
  41. Pedlowski, M.; Dale, V.; Matricardi, E.A.T. A criação de áreas protegidas e os limites da conservação ambiental em Rondônia. Ambient. Soc. 1999, Volume 5, 93–107. [Google Scholar]
  42. Barreto, P.; Souza, C., Jr.; Anderson, A.; Salomão, R.; Wiles, J.; Noguerón, R. Human Pressure in the Brazilian Amazon; Instituto do Homem e Meio Ambiente da Amazônia (IMAZON): Belém, Brazil, 2005; p. 6. [Google Scholar]
  43. Brazilian Federal Government. I Plano Nacional de Desenvolvimento; Presidência da República: Brasília, Brazil, 1971; p. 7.
  44. Browder, J.O. Public policy and deforestation in the Brazilian Amazon. In Public Policies and the Misuse of Forest Resources; Repetto, R., Gillis, M., Eds.; Cambridge University Press: Cambridge, MA, USA, 1988; pp. 247–283. [Google Scholar]
  45. Fearnside, P.M. Deforestation in Brazilian Amazonia: History, rates, and consequences. Conserv. Biol. 2005, 19, 680–688. [Google Scholar] [CrossRef]
  46. Pinto, E.P. Rondônia, Evolução Histórica, A Criação do T. F.G Fator de Integração Nacional; Expressão e Cultura: Rio de Janeiro, Brazil, 1993. [Google Scholar]
  47. Secretaria de Estado do Desenvolvimento Ambiental (SEDAM). Zoneamento Socioeconômico-Ecológico ( Resumo); Governo de Rondônia: Porto Velho, Brazil, 2000; p. 18.
  48. Brazilian Federal Government. Plan of Action for the Protection and Control of Deforestation in the Amazon Region–PPCDAm; Ministério do Meio Ambiente, dos Rescursos Hidricos e da Amazônia Legal (MMA): Brasília, Brazil, 2012.
  49. Brondizio, E.S.; McCracken, S.D.; Moran, E.F.; Siqueira, A.D.; Nelson, D.R.; Rodrigues-Pedraza, C. The colonist footprint: Toward a conceptual framework of deforestation trajectories among small farmers in frontier Amazônia. In Deforestation and Land Use in the Amazon; Wood, C., Porros, R., Eds.; Florida University Press: Gainesville, FL, USA, 2002; pp. 133–161. [Google Scholar]
  50. Ferraz, S.F.D.; Vettorazzi, C.A.; Theobald, D.M.; Ballester, M.V.R. Landscape dynamics of Amazonian deforestation between 1984 and 2002 in central Rondonia, Brazil: Assessment and future scenarios. For. Ecol. Manag. 2005, 204, 67–83. [Google Scholar]
  51. Walker, R.; Perz, S.; Caldas, M.; Silva, L.G.T. Land use and land cover change in forest frontiers: The role of household life cycles. Int. Reg. Sci. Rev. 2002, 25, 169–199. [Google Scholar] [CrossRef]
  52. Batistella, M. Landscape Change and Land-Use/Land-Cover Dynamics in Rondônia, Brazilian Amazon; Indiana University: Bloomington, IN, USA, 2001. [Google Scholar]
  53. Browder, J.O.; Pedlowski, M.A.; Summers, P.M. Land use patterns in the Brazilian Amazon: Comparative farm-level evidence from Rondonia. Hum. Ecol. 2004, 32, 197–224. [Google Scholar] [CrossRef]
  54. Soler, L.D.S.; Verburg, P.H. Combining remote sensing and household level data for regional scale analysis of land cover change in the Brazilian Amazon. Reg. Environ. Chang. 2010, 10, 371–386. [Google Scholar] [CrossRef]
  55. Instituto Brasileiro de Geografia e Estatística (IBGE) and Embrapa Solos. Soil Map of Brazil–1:5.000.000; Embrapa: Rio de Janeiro, Brazil, 2001. [Google Scholar]
  56. Secretaria de Estado de Planejamento e Coordenação Geral (SEPLAN). Boletim Climatológico de Rondônia ano 2004; Governo do Estado de Rondônia: Porto Velho, Brazil, 2004.
  57. Instituto Brasileiro de Geografia e Estatística (IBGE). Censo Agropecuário 2006; [CD-ROM]; IBGE: Rio de Janeiro, Brazil, 2006. Available online: http://www.ibge.gov.br (accessed on 13 December 2013).
  58. Fearnside, P.M. Soybean cultivation as a threat to the environment in Brazil. Environ. Conserv. 2001, 28, 23–38. [Google Scholar]
  59. Matricardi, E.A.T.; Skole, D.L.; Cochrane, M.A.; Pedlowski, M.; Chomentowski, W. Multi-temporal assessment of selective logging in the Brazilian Amazon using Landsat data. Int. J. Remote Sens. 2007, 28, 63–82. [Google Scholar] [CrossRef]
  60. Browder, J.O. Surviving in Rondonia—The dynamics of colonist farming strategies in Brazil Northwest Frontier. Stud. Comp. Int. Dev. 1994, 29, 45–69. [Google Scholar] [CrossRef]
  61. Pedlowski, M.A.; Dale, V.H.; Matricardi, E.A.T.; da Silva, E.P. Patterns and impacts of deforestation in Rondonia, Brazil. Landsc. Urban Plan. 1997, 38, 149–157. [Google Scholar] [CrossRef]
  62. Fearnside, P.M. The roles and movements of actors in the deforestation of Brazilian Amazonia. Ecol. Soc. 2008, 13, 23. [Google Scholar]
  63. Helfand, S.M.; Brunstein, L.F. The changing structure of the Brazilian agricultural sector and the limitations of the 1995/96 agricultural census. Rev. Econ. Soc. Rural 2001, 39, 41–66. [Google Scholar]
  64. Instituto Brasileiro de Geografia e Estatística (IBGE). Censo Agropecuário 1970; IBGE: Rio de Janeiro, Brazil, 1970. [Google Scholar]
  65. Instituto Brasileiro de Geografia e Estatística (IBGE). Censo Agropecuário 1975; IBGE: Rio de Janeiro, Brazil, 1975. [Google Scholar]
  66. Instituto Brasileiro de Geografia e Estatística (IBGE). Censo Agropecuário 1980; IBGE: Rio de Janeiro, Brazil, 1980. [Google Scholar]
  67. Instituto Brasileiro de Geografia e Estatística (IBGE). Censo Agropecuário 1985; IBGE: Rio de Janeiro, Brazil, 1985. [Google Scholar]
  68. Instituto Brasileiro de Geografia e Estatística (IBGE). Censo Agropecuário 1996; IBGE: Rio de Janeiro, Brazil, 1996. [Google Scholar]
  69. Gastwirth, J.L. The estimation of the Lorenz Curve and Gini Index. Rev. Econ. Stat. MIT Press 1972, 54, 306–316. [Google Scholar] [CrossRef]
  70. Morton, D.C.; DeFries, R.S.; Shimabukuro, Y.E. Cropland expansion in cerrado and transition forest ecosystems: Quantifying habitat loss from satellite-based vegetation phenology. In Cerrado Land Use and Conservation: Assessing Trade-Offs Between Human and Ecological Needs; Klink, C.A., Ed.; Conservation International: Washington, DC, USA, 2009; in press. [Google Scholar]
  71. Aguiar, A.P.D.; Câmara, G.; Escada, M.I.S. Spatial statistical analysis of land-use determinants in the Brazilian Amazonia: Exploring intra-regional heterogeneity. Ecol. Model. 2007, 209, 169–188. [Google Scholar] [CrossRef]
  72. Geurs, K.T.; Ritsema van Eck, J.R. Accessibility Measures: Review and Applications. Evaluation of Accessibility Impacts of Land-Use Transport Scenarios, and Related Social and Economic Impacts; No. 408505006; National Institute of Public Health and the Environment: Bilthoven, The Netherlands, 2001; p. 265. [Google Scholar]
  73. Witcover, J.; Vosti, S.A.; Carpentier, C.L.; Gomes, T.C.D.A. Impacts of soil quality differences on deforestation, use of cleared land, and farm income. Environ. Dev. Econ. 2006, 11, 343–370. [Google Scholar] [CrossRef]
  74. Brazilian Federal Government. Brazilian National Plan on Climate Change; Vol. Decree N° 6.263; 21 November 2007; Brazilian Federal Government: Brasília, Brazil, 2008; p. 154.
  75. Macedo, M.N.; DeFries, R.S.; Morton, D.C.; Stickler, C.M.; Galford, G.L.; Shimabukuro, Y.E. Decoupling of deforestation and soy production in the southern Amazon during the late 2000s. Proc. Natl. Acad. Sci. USA 2012, 109, 1341–1346. [Google Scholar] [CrossRef] [PubMed]
  76. Veiga, J.B.Z.; Tourrand, J.F.; Piketty, M.G.; Poccard-Chapuis, R.; Alves, A.M.; Thales, M. Expansão e Trajetórias da Pecuaria na Amazônia: Pará,Brasil; Universidade de Brasília: Brasília, Brazil, 2004. [Google Scholar]
  77. Evans, T.P.; Manire, A.; de Castro, F.; Brondizio, E.; McCracken, S. A dynamic model of household decision-making and parcel level landcover change in the eastern Amazon. Ecol. Model. 2001, 143, 95–113. [Google Scholar] [CrossRef]
  78. Perz, S.G. The effects of household asset endowments on agricultural diversity among frontier colonists in the Amazon. Agrofor. Syst. 2005, 63, 263–279. [Google Scholar] [CrossRef]
  79. Gallagher, P.; Schamel, G.; Shapouri, H.; Brubaker, H. The international competitiveness of the U.S. corn-ethanol industry: A comparison with sugar-ethanol processing in Brazil. Agribusiness 2006, 22, 109–134. [Google Scholar]
  80. Mueller, C.C. Expansion and Modernization of Agriculture in the Cerrado—The Case of Soybeans in Brazil’s Center-West; Departament of Economics, University of Brasília: Brasília, Brazil, 2003; p. 28. [Google Scholar]
  81. De Espindola, G.M.; de Aguiar, A.P.D.; Pebesma, E.; Câmara, G.; Fonseca, L. Agricultural land use dynamics in the Brazilian Amazon based on remote sensing and census data. Appl. Geogr. 2012, 32, 240–252. [Google Scholar]
  82. Instituto Nacional de Pesquisas Espaciais (INPE)/ Empresa Brasileira de Pesquisa Agropecuária (EMBRAPA). TerraClass 2008—Levantamento das Informações de uso e Cobertura da Terra na Amazônia; INPE: Belém, Brazil, 2011. [Google Scholar]
  83. Instituto Nacional de Pesquisas Espaciais (INPE)/ Empresa Brasileira de Pesquisa Agropecuária (EMBRAPA). TerraClass 2010—Levantamento das Informações de uso e Cobertura da Terra na Amazônia; INPE: Belém, Brazil, 2013. [Google Scholar]
  84. Instituto Brasileiro de Geografia e Estatística (IBGE). Banco de Dados Agregados—Pesquisas Municipais Pecuária, Agrícola e Industrial; IBGE: Rio de Janeiro, Brasil, 2008. [Google Scholar]
  85. Coy, M. Rondônia: Frente pioneira e o programa polonoroeste. O processo de diferenciação sócioeconômica na periferia e os limites do planejamento público. Tubinguen Geogr. Stud. 1987, 95, 253–270. [Google Scholar]
  86. Hecht, S.B. Factories, forests, fields and family: Gender and neoliberalism in extractive reserves. J. Agrar. Chang. 2007, 7, 316–347. [Google Scholar] [CrossRef]
  87. Perz, S.G.; Skole, D.L. Social determinants of secondary forests in the Brazilian Amazon. Soc. Sci. Res. 2003, 32, 25–60. [Google Scholar] [CrossRef]
  88. Perz, S.G.; Walker, R.T. Household life cycles and secondary forest cover among small farm colonists in the Amazon. World Dev. 2002, 30, 1009–1027. [Google Scholar] [CrossRef]
  89. Santana, A.C. Descrição e análise da cadeia produtiva de leite no Estado de Rondônia. Movendo Idéias 2003, 8, 24–36. [Google Scholar]
  90. Veiga, J.B.D.; Piketty, M.G.; Tourrand, J.F.; Alves, A.M.; Poccard-Chapuis, R.; Thales, M. Determinantes da expansão da pecuaria na Amazônia oriental: Conseqüências para as politicas publica. In Cadernos de Ciência de Tecnologia; Embrapa: Brasília, Brazil, 2005; Volume 22, pp. 221–234. [Google Scholar]
  91. Alves, D.S. Science and technology and sustainable development in Brazilian Amazon. In Stability of Tropical Rainforest Margins; Springer Berlin Heidelberg: Berlin, Germany, 2007; pp. 491–510. [Google Scholar]
  92. Perz, S.G. Household demographic factors as life cycle determinants of land use in the Amazon. Popul. Res. Policy Rev. 2001, 20, 159–186. [Google Scholar] [CrossRef]
  93. Sills, E.O.; Caviglia-Harris, J.L. Evolution of the Amazonian frontier: Land values in Rondônia, Brazil. Land Use Policy 2009, 26, 55–67. [Google Scholar] [CrossRef]
  94. Cleary, D. After the frontier: Problems with political economy in the modern Brazilian Amazon. J. Lat. Am. Stud. 1993, 25, 331–349. [Google Scholar] [CrossRef]
  95. Brazilian Federal Government. Provisional Measure (MP) 458/09; Diário Oficial da União: Brasília, Brasil, 2009; Volume 458, p. 14.
  96. Metzger, J.P. O Código Florestal tem base científica? Nat. Conserv. 2010, 8, 1–5. [Google Scholar] [CrossRef]
  97. Kaimowitz, D.; Smith, J. Soybean technology and the loss of natural vegetation in Brazil and Bolivia. In Agricultural Technologies and Tropical Deforestation; Angelsen, A., Kaimowitz, D., Eds.; CABI Publishing: Wallingford, UK, 2001; pp. 195–211. [Google Scholar]
  98. Moran, E.F. Deforestation and land-use in the Brazilian Amazon. Hum. Ecol. 1993, 21, 1–21. [Google Scholar] [CrossRef]
  99. Pacheco, P. Agrarian reform in the Brazilian Amazon: Its implications for land distribution and deforestation. World Dev. 2009, 37, 1337–1347. [Google Scholar] [CrossRef]
  100. Siegmund-Schultze, M.; Rischkowsky, B.; da Veiga, J.B.; King, J.M. Valuing cattle on mixed smallholdings in the eastern Amazon. Ecol. Econ. 2010, 69, 857–867. [Google Scholar]
  101. Bialoskorski Neto, S. Virtual cooperatives in Brazil and the globalization process. J. Rural Coop. 2001, 29, 153–165. [Google Scholar]

