Article

Transitions in Land Use Architecture under Multiple Human Driving Forces in a Semi-Arid Zone

1
World Agroforestry Centre (ICRAF), United Nations Avenue, Gigiri, PO Box 30677, 00100 Nairobi, Kenya
2
Centre for International Forestry Research (CIFOR), 06 B.P. 9478, Ouagadougou 06, Burkina Faso
*
Author to whom correspondence should be addressed.
Land 2015, 4(3), 560-577; https://doi.org/10.3390/land4030560
Submission received: 28 May 2015 / Revised: 25 June 2015 / Accepted: 2 July 2015 / Published: 9 July 2015

Abstract

:
The present study aimed to detect the main shifts in land-use architecture and assess the factors behind the changes in typical tropical semi-arid land in Burkina Faso. Three sets of time-series LANDSAT data over a 23-year period were used to detect land use changes and their underpinning drivers in multifunctional but vulnerable ecologies. Group discussions in selected villages were organized for mapping output interpretation and collection of essential drivers of change as perceived by local populations. Results revealed profound changes and transitions during the study period. During the last decade, shrub and wood savannahs exhibited high net changes (39% and −37% respectively) with a weak net positive change for cropland (only 2%,) while cropland and shrub savannah exhibited high swap (8% and 16%). This suggests that the area of cropland remained almost unchanged but was subject to relocation, wood savannah decreased drastically, and shrub savannah increased exponentially. Cropland exhibited a null net persistence while shrub and wood savannahs exhibited positive and negative net persistence (1.91 and −10.24), respectively, indicating that there is movement toward agricultural intensification and wood savannah tended to disappear to the benefit of shrub savannah. Local people are aware of the changes that have occurred and support the idea that illegal wood cutting and farming are inappropriate farming practices associated with immigration; absence of alternative cash generation sources, overgrazing and increasing demand for wood energy are driving the changes in their ecosystems. Policies that integrate restoration and conservation of natural ecosystems and promote sustainable agroforestry practices in the study zone are highly recommended.

1. Introduction

There is increasing demand for context-specific information on land transition processes and forest resource dynamics following complex and multifaceted land use changes [1,2,3]. Quantifying and qualifying land use shifts requires data and models that document states and dynamics of resources and space uses. Because of localized and unique features of land patterns, assessing generalized land use architecture is a challenging task [4]. Yet, understanding the cross-scale factors driving the changes is ultimately important for identifying strategies towards sustainable ecosystem management and land resource allocation. There are intrinsic links between human and natural systems in shaping these changes. The nature of these links is often simplified in vicious linear cycles, and Rasmussen et al. [5] highlighted that the functioning and directions are very complex and require considerations of recovery and adaptation (system adjustments) combined with significant feedback on most degradation processes in semi-arid ecosystems [6,7]. Importance of the local land use and its implication for wider regional- and global-scale climate has been recognized in the IPCC AR5 report [8], but little evidence has been given on the epistemic categories of land architecture (the significance of spatial configurations) and their transition due to multiple overlapping drivers.
Many studies have pointed out several local drivers of land use change, but the connection with global drivers has been limited, so far, to the influence of teleconnections on impacts from climate change on local resources and economic drivers such as markets, demand and supply of ecosystem services, etc. Little has been done to study the influence of multiple land architectures in relation to various transitions such as increased population growth, land abandonment, increased agribusiness, revamped irrigation schemes, new commodity agriculture, etc. [1,4,9,10,11,12]. Many indicators of the physical and biophysical drivers of land use change are systematically quantifiable because they are static or change little over space and time (topography, climate, soil, etc.). The human factors at local levels, however, are difficult to control because the change is most often sudden and abrupt (e.g., changing behavior, livelihood, population density, market, needs).
In semi-arid ecosystems in Africa, land cover is constantly changing with different patterns and magnitudes. The conversion of grasslands, woodlands and forests into croplands and pastures has risen dramatically during the last few decades. Tropical dry forests, for instance, have been severely fragmented and disturbed and have tended to disappear [13,14,15]. The main drivers behind these changes combine population growth, rising demand for agricultural products, dietary changes, agricultural trade and adjustment, dependence on wood energy, recurrent bush fires, etc. [16,17,18].
Southern Burkina Faso has experienced a rapid population increase since the 1980s resulting from a positive natural growth and more importantly from a large immigration of farmers from drought-affected areas of the northern and central regions of the country [19,20,21,22]. Prior to immigration, the southern provinces, namely Sissili, Ziro and Nahouri, were less populated and were naturally endowed with a significant stock of dry forest [23]. Furthermore, there was a peaceful co-existence between ethnic groups and sound agricultural practices with less impact on the environment [23]. Several research activities carried out in southern Burkina Faso (e.g., [20,21,22,24,25,26,27,28,29,30]) revealed that forest and land have been degraded and this could be linked to the rapid population growth. However, research that combines detection of significant change of land use accounting for swaps (magnitude of the relocation for each use class) and persistence (proportion of a cover class that remains unchanged) between land use classes, and capturing local people’s perception of the driving forces that led to changes in their environment, needs improvement across ecologies and livelihood systems.
The objective of this paper is to detect the significant land use changes and to identify the driving forces of the changes as perceived by the local population in a common land system architecture characterized by a mosaic of connected land user/cover units [4]. We specifically respond to three key questions: (i) what are the prominent signals of land use transitions in the study site? (ii) Which use types are vulnerable to transition to other classes? (iii) What are the driving forces of the land use shifts according to local people?

2. Materials and Methods
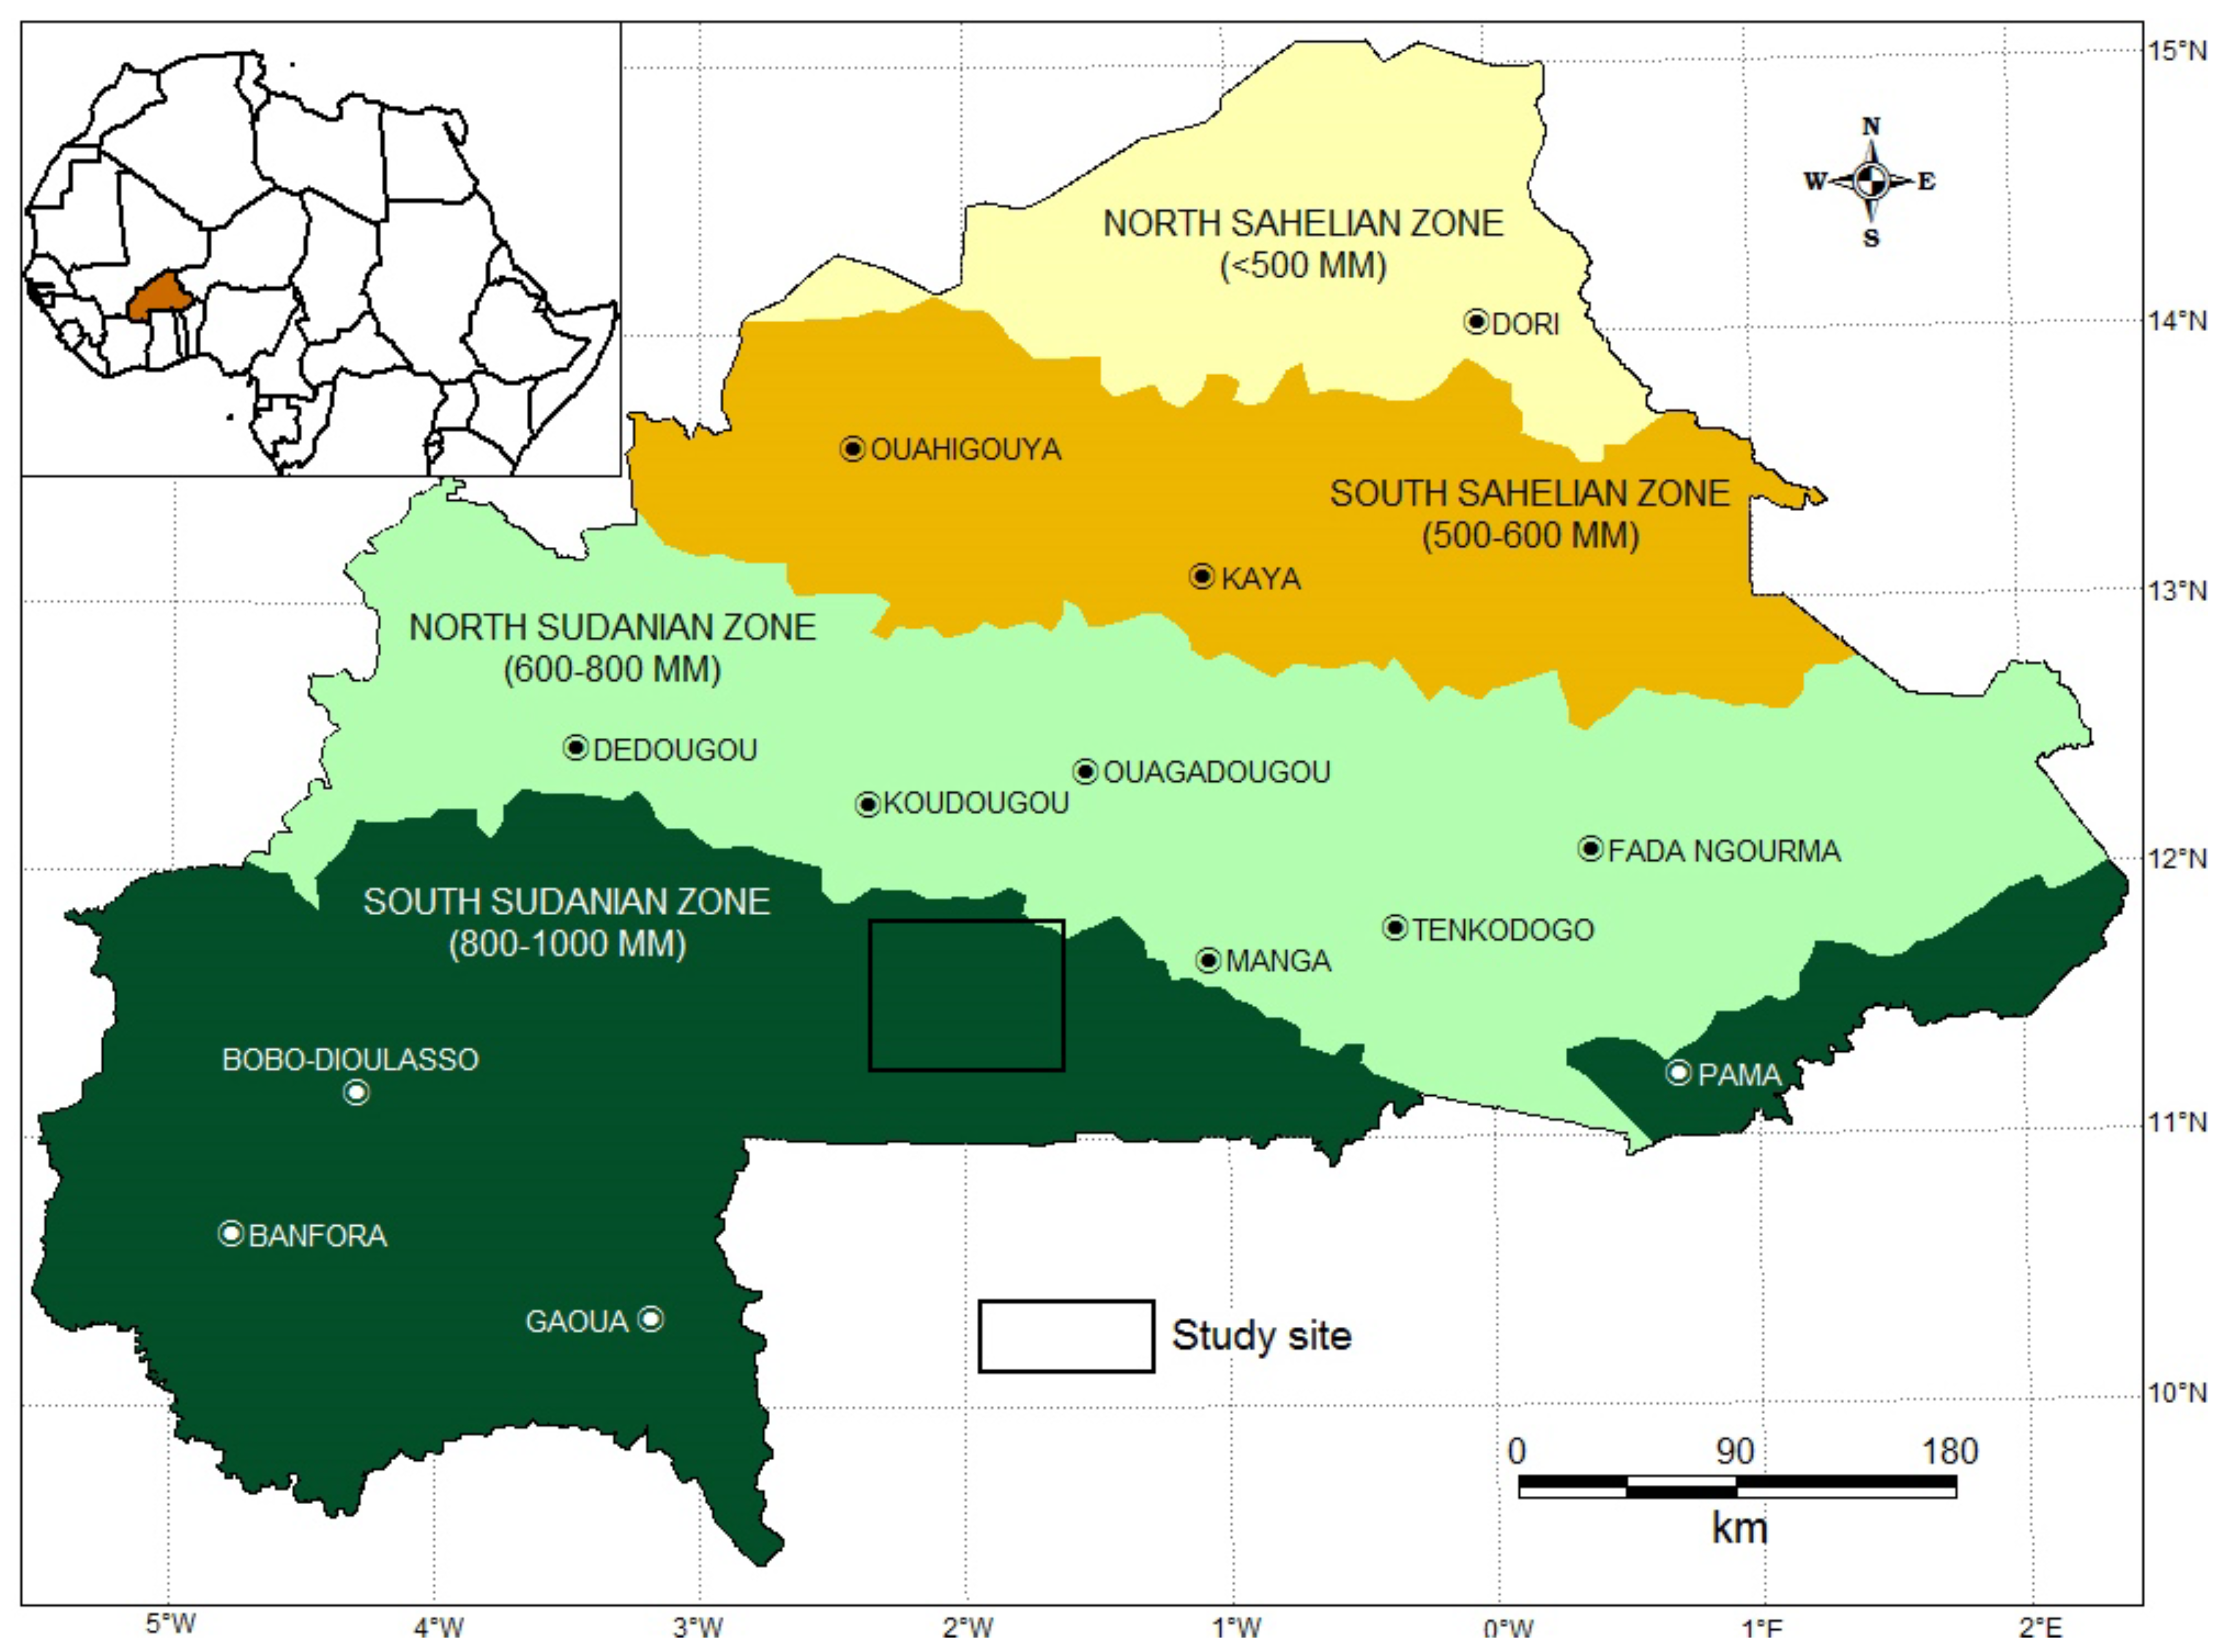
2.1. Study Area

The study was carried out in Cassou District, located in Ziro Province (11°16’N to 11°45’N and −2°10’W to −1°48’W), southern Burkina Faso (Figure 1). The district covers 1175 km² and is characterized by low altitudes with an average elevation of 300 m a.s.l. Cassou lays within the south-Sudanian ecological zone [31] and receives between 900 to 1200 mm rainfall annually. The unimodal rainy season lasts for about six months, from May to October. The natural vegetation comprises a mixture of mostly dry forest and tree savannah types. In 1985, multiple forest management units were created for local communities in Cassou to contribute to sustainable wood energy supply in the capital city, Ouagadougou [25,32] while diversifying the income generation sources for local population. According to the FAO’s soil classification system [33], the most frequently encountered soil type in southern Burkina Faso is Lixisol (tropical ferruginous soils), which is poorly to fully leached, overlying sandy, clayey-sandy and sandy-clayey material.
The population density in Cassou is 34.7 inhabitants/km2 (for an average of 30 hbts/km2 in the Ziro province) [34] distributed among 30 villages. This density is among the highest observed in rural areas in the country. The district was originally populated by the Nuni ethnic group, but due to the occurrence of the severe droughts in the 80s, the district has been facing considerable immigration of Mossi and Fulani farmers from the drought-affected zones in northern and central regions of the country [19,21,23,27,29].
The dominant farming system in the study area is traditional cultivation of cereals (such as sorghum, millet and maize) and tubers (yam and sweet potatoes), and animal husbandry. Over the last decade, there has been an intense competition between the traditional farming system and more lucrative production systems, involving cash crop production (cotton and cashew nut) and ranching [24,29]. Trees are also cut by the local people for commercial fuelwood and construction poles. The district provides nearby cities (Ouagadougou and Koudougou) with fuelwood and charcoal.
The choice of Cassou district is dictated by the presence of a community-managed forest for wood energy extraction and the continuous demand for arable lands by the rapidly growing population in in the area. This has exacerbated the competition for land resources which in turn may have created a specific land use architecture. Understanding of the transition process in Cassou will contribute to the development of policies for sustainable ecosystem management in tropical semi-arid zones.
Figure 1. Study area.
Land 04 00560 g001

2.2. Image Processing

Three Landsat images of the district spanning 23 years (1990, 2000 and 2013) were used to detect land cover change. The year 1990 corresponds to the period when the intensive small-scale cotton production process was initiated in southern Burkina Faso. In the 2000s, the agri-business system was introduced in the area with a focus on cashew tree plantation and maize and cotton production. The 2013 image highlights the current state of the land use architecture in the study area. The USGS level 1B products have been used to bypass many preprocessing steps such as geometry and radiometry corrections [35]. The tasseled cap orthogonal transformation was used to register the original bands in each image into three new dimensional spaces, corresponding to soil brightness, green vegetation and moisture indices, respectively [36]. Apart from enabling selection of relevant input (training data) for land-cover classification, the transformation also improved visual discrimination of land-cover types.
The classification was performed using the maximum likelihood classifier [37] to assign pixels to land use classes. This required an intensive ground truthing procedure in the district from January to June 2014. Training samples (42) of each cover class as well as sample reference points were taken from the ground as the basis for the first supervised classification. Information recorded during the ground control samples were soil types, tree species composition, tree height and coverage and type of crop when it is farming land. Further random sampling points were taken from the classified map for the ground checks to fine-tune the classification and minimize the confusion between classes. In total, seven cover schemes were used for the classification (Table 1): settlement, cropland, grass savannah, shrub savannah, wood savannah, and gallery forest and water body.
Table 1. Cassou land cover schemes.
Cover Scheme Symbols Description
Settlement BA Built up area
Cropland CL Farm land, harvested agricultural land and young fallows
Tree species: Vitelaria paradoxa, Detarium microcarpum, Terminalia macroptera, Piliostigma reticulatum, Combretum glutinosum, Acacia macrostachya
Gallery forest GF Dense forest along river side
Tree species: Mitragyna inermis, Anogeissus leiocarpus, Acacia macrostachya, Mimosa pigra, Acacia nilotica, Lanea acida, Piliostigma thonningii, Terminalia macroptera, Combretum glutinosum
Grass savanna GS Grassland with very sparse shrubs
Shrub savanna SS Land covered by shrub, bushes and young broadleaf plants (<50 trees/ha)
Tree species: Detarium microcarpum, Piliostigma thonningii, Terminalia macroptera, Bombax costatum, Vitelaria paradoxa, Acacia macrostachya, Diospyros mespiliformis, Afzelia africana, Crosopterix febrifuga, Isoberlinia doka, Parkia biglobosa, Ximenia Americana
Water body WB Dams, small reservoirs or flooded river
Wood savanna WS Open woodland with an upper layer comprised of deciduous medium trees. Their crowns are more or less touching above a sparse woody stratum. The ground layer consists of undergrowth of shrubs and grasses (75 – 150 trees/ha)
Tree species: Vitelaria paradoxa, Anogeissus leiocarpus, Terminalia macroptera, Pterocarpus erinaceus, Ximenia americana, Gardenia SP, Isoberlinia doka, Guiera senegalensis, Grewia flavescens, Crossopteryx febrifuga, Strychnos pinosa, Bombax costatum

2.3. Land Use Dynamics

The proportions of all land cover types were computed for each time period. Changes in land cover were determined by computing the difference in land-cover statistics over two time periods (1990–2000 and 2000–2013). The gain, loss, net changes and swap were computed for each period. The net change represents the difference between the gains and losses for each class during the periods 1990–2000 and 2000–2013 while the swap provides information concerning the simultaneous gain and loss of a given land use type in different locations during the periods [38]. The amount of swap (magnitude of relocation) for each category represents two times the minimum of the gain and the loss of this category [38,39]. Each grid cell that experiences gains is paired with a grid cell that experiences losses to create a pair of grid cells that swap. The amount of swap of land class j, Sj, is calculated using Equation (1) (Table 2). A high value of swap for a given class means high relocation process for this class.

2.4. Transition and Vulnerability to Transition

The three maps were used to examine the land cover transition in the district by constructing the transition matrix table (Table 3) for comparing maps using the methodology developed by Pontius et al. [39]. In this table, the rows display the proportions of the seven classification schemes in time 1 (T1), whereas the columns display the proportions in time 2 (T2).
Equation (2) is used to compute the proportion of the district that experienced a gross loss of class i from T1 to T2, whereas Equation (3) is used to compute the proportion of the district that experienced a gross gain in class j between T1 and T2.
The vulnerability of each land cover class to transition is computed using the gain-to-persistence ratio (Equation (4)), the loss-to-persistence ratio (Equation (5)), and the net change to persistence (Equation (6)). Values of Gp and Lp exceeding 1 indicate that the land cover class under consideration has a higher tendency to gain from or lose to other land classes than to persist [28,38], and negative values of Np indicate that the land class has a higher tendency to lose area to other cover types than to gain from them.
Table 2. Transition and vulnerability tests.
AbbreviationNameEquationInterpretation
Eq.1 S j Swap 2 m i n ( C j + C j j , C + j C j j ) The distance over which change occurs
Eq.2 C i + C i i   o r   g Gross loss i = 1 n C i j C i i The magnitude of loss for the class
Eq.3 C + j C j j   o r   l Gross gain j = 1 n C i j C j j The magnitude of gain for the class
Eq.4 G p Gain to persistence G p = g * p 1 G p   exceeding 1 indicate that the land cover class under consideration has a higher tendency to gain from other land classes than persist
Eq.5 L p Loss to persistence L p = l * p 1 L p exceeding 1 indicates that the land cover class under consideration has a higher tendency to lose to other land classes than persist
Eq.6 N p Net persistence N p = G p L p N p negative indicates that the land class has a higher tendency to lose area to other cover types, than to gain from them.
The notation C i j , ( i j ) indicates the proportion of the district that experienced a transition from class i   to class j between T1 and T2. The main diagonal entry C j j indicates the proportions of land classes that showed persistence of class j . C i + and C + j indicate the proportions of the district that are occupied by class i and class j , respectively. n is the total number of classes. The subscripts g, p and l represent gain, persistence and loss, respectively.
Table 3. A 7 × 7 land cover matrix (C is any conversion from one cover class to another).
T1T2
BACLGFGSSSWBWSTotal T1Loss
BAC11C12C13C14C15C16C17C1+ C 1 + C 11
CLC21C22C23C24C25C26C27C2+ C 2 + C 22
GFC31C32C33C34C35C36C37C3+ C 3 + C 33
GSC41C42C43C44C45C46C47C4+ C 4 + C 44
SSC51C52C53C54C55C56C57C5+ C 5 + C 55
WBC61C62C63C64C65C66C67C6+ C 6 + C 66
WSC71C72C73C74C75C76C77C7+ C 7 + C 77
Total T2C+1C+2C+3C+4C+5C+6C+71
Gain C + 1 C 11 C + 2 C 22 C + 1 C 11 C + 3 C 33 C + 4 C 44 C + 5 C 55 C + 6 C 66

2.5. Drivers of Land Cover Change in Cassou

Data to assess the driving forces of land use change in Cassou was collected using focus group discussions (FGD) and a method developed in previous projects and based on community interpretation of the land cover map and assigning drivers to different observed changes. The discussions took place in five different villages of the district in June 2014. In each village, ten to twelve gender-balanced farmers (men and women, native and migrant, young and adult) were gathered for four hours of discussion. The maps showing the district land cover change in 1990, 2000 and 2013 were shown to them to illustrate the dynamics of their own environment. The participants were then asked to say whether or not the maps look realistic in terms of their changing environment. In all villages, farmers said they are aware of the rapid degradation of their ecosystems but they have never had an opportunity to pictorially see the space of change (community-based map validation in addition to thematic validation by the authors). After this short presentation, the discussion on the main driving forces of the changes begins. The main focus group questions included the local perception of land cover change: the main drivers of change, local expectation for rebuilding functional ecosystems, etc. A list of potential drivers is made by the participants, after which they are asked to explain each of the drivers in depth and rank them using a score from one to five, with one being the highest score and five the lowest score.

3. Results

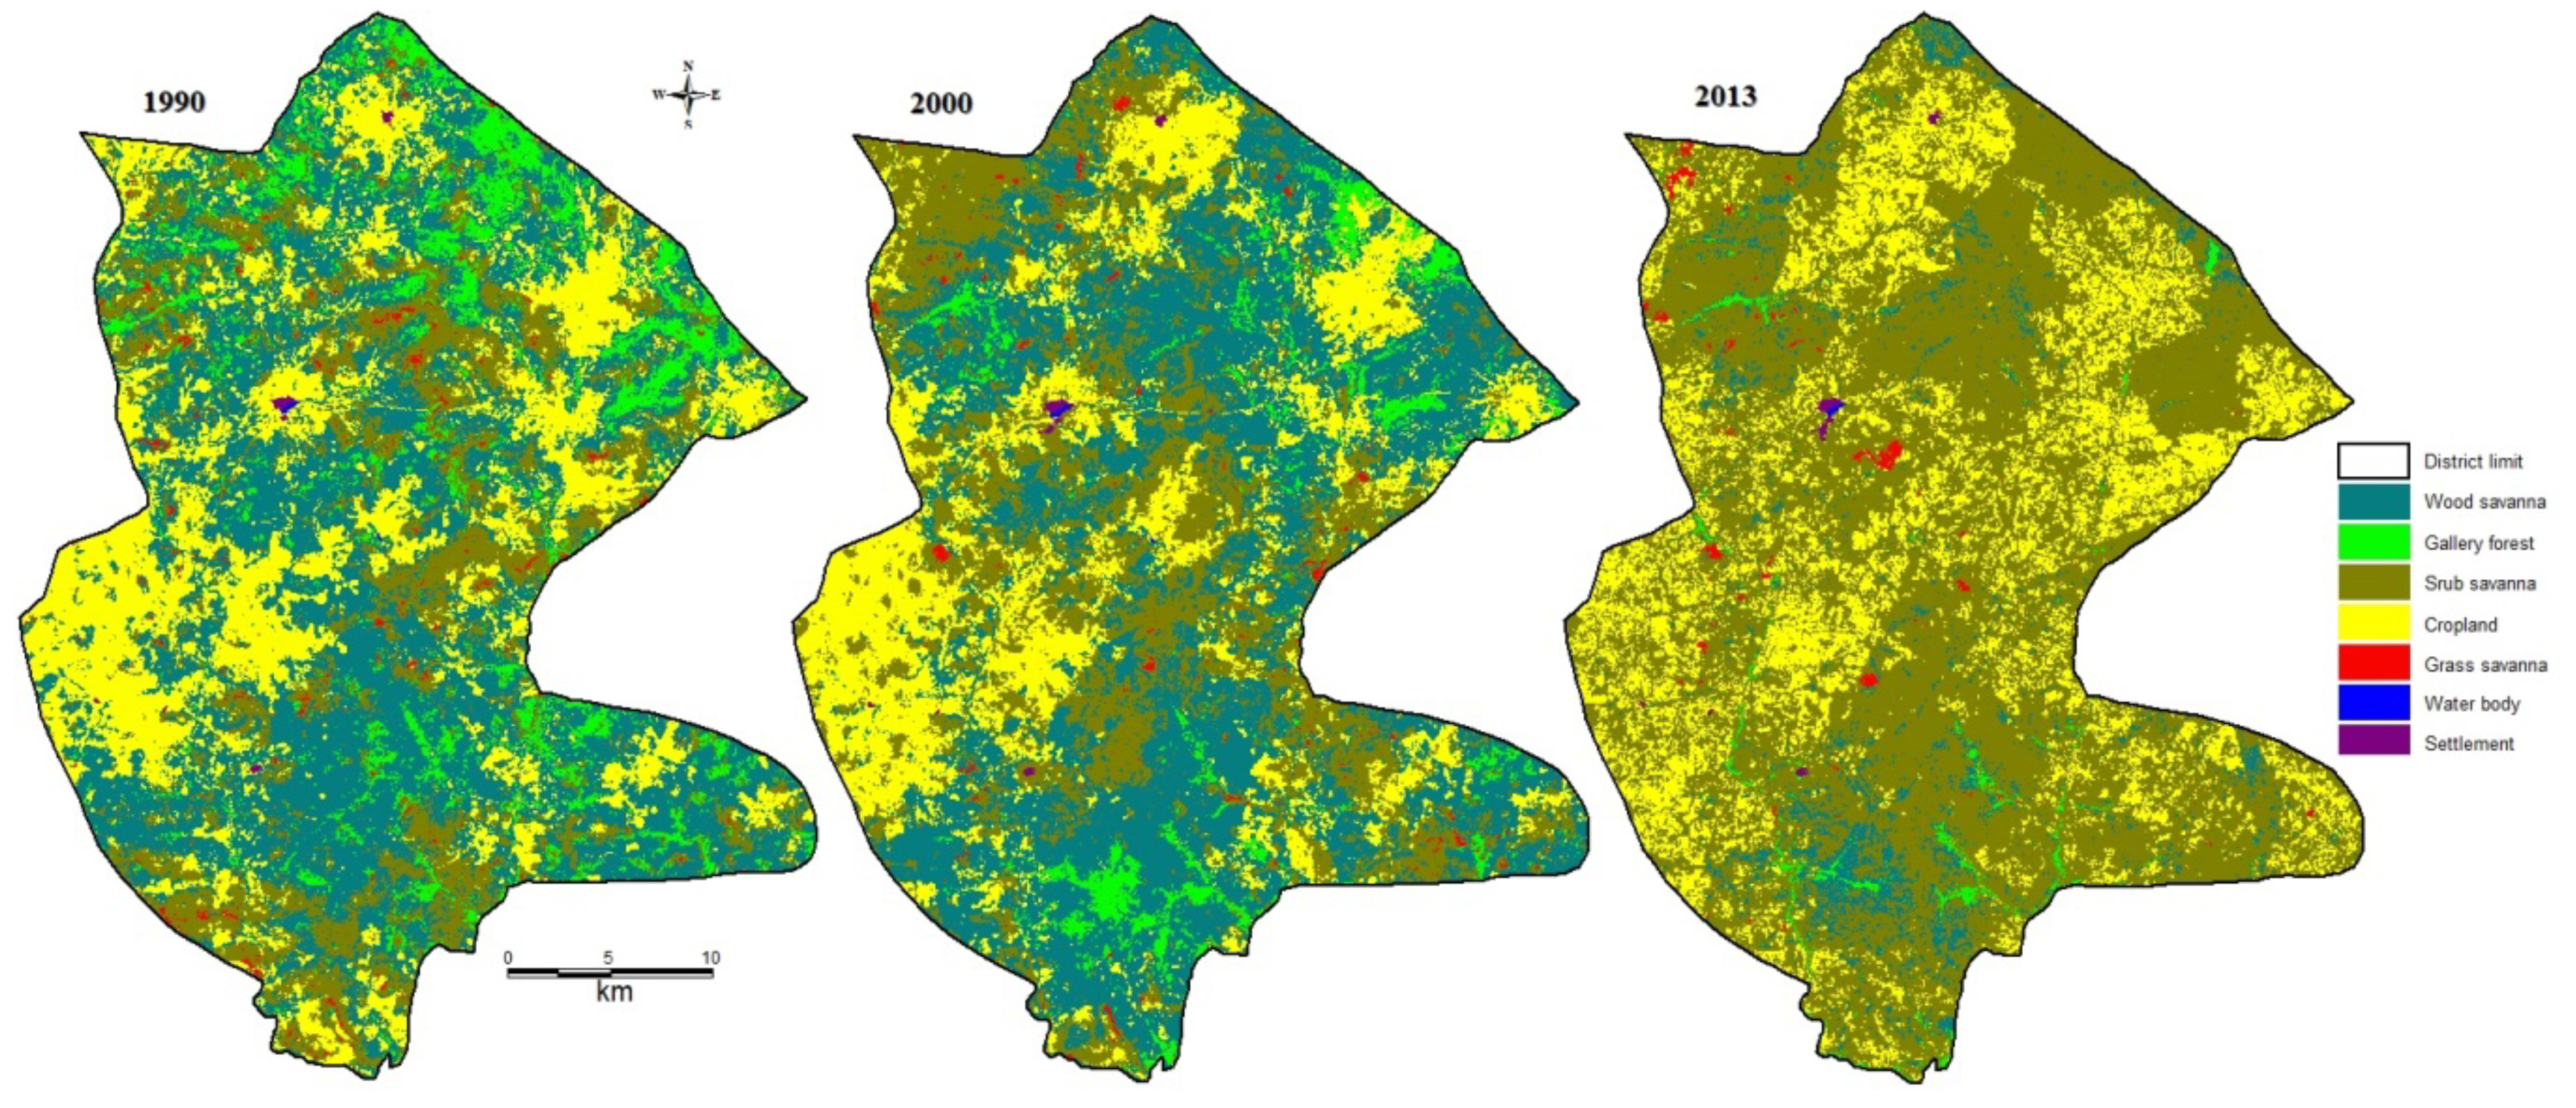
3.1. Land Cover Dynamics in Cassou

In general, over the 23-year period, Cassou has undergone changes in its ecosystems (Figure 2). The proportion of change, net change and swap are shown in Table 4. The areas of cropland and grass savannah have nearly remained unchanged while the areas of gallery forest dropped from 9% in 1990 to 1% in 2013. Shrub savannah, whose area represented 20% of the total district cover in 1990, increased to 29% in 2000 and to 68% in 2013. The area of wood savannah remained the same (43%) between 1990 and 2000 but dropped to 5% in 2013.
The net change in area of cropland was high and negative between 1990 and 2000. It was negative and almost stable for gallery forest. The highest net change was observed between 2000 and 2013 for shrub savannah (39%) and wood savannah (−38%). Settlement and water bodies experienced zero swaps during the study period. Cropland has a high swap in the period of 1990–2000, but it dropped by half in 2000–2013. Wood savannah had the highest swap in 1990–2000 and dropped by 10 times in the period 2000–2013.
Table 4. Proportions of landscape cover change (%) in Cassou between 1990 and 2013.
Cover schemesSymbolsCover Change Net Change SWAP
199020002013 1990–20002000–2013 1990–20002000–2013
Built up areaBA0.100.110.12 0.020.01 0.000.00
croplandCL26.2423.0525.03 −3.191.98 15.848.08
Gallery forestGF8.874.541.11 −4.33−3.42 5.631.24
Grass savannahGS0.750.550.51 −0.20−0.04 1.010.93
Shrub savannahSS20.1928.6567.71 8.4639.06 23.9216.40
Water bodyWB0.020.030.02 0.00−0.01 0.000.00
Wood savannahWS43.8443.075.49 −0.76−37.59 39.553.64
Figure 2. Land cover change in Cassou.
Land 04 00560 g002

3.2. Land Cover Transition and Vulnerability to Transition

Table 5 and Table 6 show the inter category transitions between the periods 1990–2000 and 2000–2013. In the first period, new croplands were created systematically from wood savannah (6%) and when cropland lost in area, it lost to shrub and wood savannahs (5% each). In the period 2000–2013, however, cropland systematically lost to shrub savannah (12%) and gained from both shrub and wood savannah (7% each). Shrub savannah largely transitioned to and gained from wood savannah (10% and 12%, respectively) during the period 1990–2000. However, in the period 2000–2013, when shrub savannah lost, it significantly lost to cropland and systematically gained from wood savannah, 7% and 32%, respectively. Wood savannah systematically lost to shrub savannah (32%) and did not gain from any other class category.
The vulnerability to transit within categories is shown in Table 7, in terms of persistence, gain to persistence (Gp), loss to persistence (Lp) and net persistence (Np). Cropland experienced high persistence during the two periods. The persistence in area of shrub savannah was high in 2000–2013 while the highest persistence was observed for wood savannah in 1990–2000 (23%), which dropped to only 4% in 2000–2013. The net to persistence is greater than 1 for shrub savannah and negative for wood, shrub and grass savannahs, as well as cropland.
Table 5. Land cover change (%) matrix 1990–2000 in Cassou.
19902000
BACLGFGSSSWBWSTotal 1990Loss
BA0.100.000.000.000.000.000.000.100.00
CL0.0215.130.210.065.570.005.2426.2411.11
GF0.000.301.720.102.040.004.718.877.15
GS0.000.010.000.050.600.000.080.750.70
SS0.001.560.460.208.230.009.7420.1911.96
WB0.000.000.000.000.000.020.000.020.00
WS0.006.062.150.1412.200.0023.3043.8420.54
Total 20000.1123.054.540.5528.650.0343.07100.0051.45
Gain0.027.922.820.5020.410.0019.7851.45
Table 6. Land cover change (%) matrix 2000–2013 in Cassou.
20002013
BACLGFGSSSWBWSTotal 2000Loss
BA0.110.000.000.000.000.000.000.110.00
CL0.0010.680.030.0212.060.000.2723.0512.37
GF0.000.380.490.002.560.021.094.544.04
GS0.000.060.020.050.410.000.010.550.50
SS0.017.310.120.3220.450.000.4428.658.20
WB0.000.000.000.000.010.020.000.030.01
WS0.006.600.460.1332.220.003.6743.0739.40
Total 20130.1225.031.110.5167.710.025.49100.0064.53
Gain0.0114.350.620.4647.260.001.8264.53
Table 7. Gain-to-persistence (Gp), loss-to-persistence (Lp), and net change-to-persistence (Np) ratios of the land cover classes in Cassou district between 1990 and 2013.
Persistence Gain Loss Gain to Persistence Loss to Persistence Net persistence
1990 to 20002000 to 2013 1990 to 20002000 to 2013 1990 to 20002000 to 2013 1990 to 20002000 to 2013 1990 to 20002000 to 2013 1990 To 20002000 To 2013
BA0.100.11 0.020.01 0.000.00 0.170.08 0.000.00 0.170.08
CL15.1310.68 7.9214.35 11.1112.37 0.521.34 0.731.16 −0.210.19
GF1.720.49 2.820.62 7.154.04 1.641.26 4.158.18 −2.52−6.93
GS0.050.05 0.500.46 0.700.50 10.459.10 14.509.85 −4.06−0.74
SS8.2320.45 20.4147.26 11.968.20 2.482.31 1.450.40 1.031.91
WB0.020.02 0.000.00 0.000.01 0.180.02 0.000.33 0.18−0.31
WS23.303.67 19.781.82 20.5439.40 0.850.50 0.8810.74 −0.03−10.24

3.3. Drivers of Change

The participants in the FGD have produced a list of changes and challenges that their environment has experienced, and for each change, they provided the potential factors and explanations leading to the change (Table 8 and Table 9). The main changes they observed were expansion of agricultural lands, deforestation and forest degradation, population increase, decreased rainfall intensity, increasing crop prices and increasing living cost. Drivers to these changes are linked. Change in cropland area is due to population growth (immigration mostly), inappropriate farming practices, emerging individualism within households, insufficient rainfall, unsecured land tenure system, large-scale farming initiatives and lack of alternative source of income generation.
Table 8. Farmers’ perception of drivers of land cover change: change in cropland size.
Drivers Description
  • Population growth (***)
  • The population has increased both from immigration and natural growth. This implies increased demand for food, hence increasing cropland size
2.
Farming practices (*)
2.
Farming systems made improvements with use of tractors, animal traction, use of herbicides/pesticides and organic/chemical fertilizers
3.
Soil fertility (**)
3.
Under poor soil productivity, farmers have to increase the size of their farmland to meet the need for food
4.
Individualism (**)
4.
Individualism: In the past, each farmland belonged to a household; today, it belongs to individuals within households
5.
Livelihood cost (**)
5.
Need for more cash: To face education and health costs and meet the need for mobile phones, motorcycles, housing, …, farmers are forced to expand their farmlands
6.
Rainfall (*)
6.
Farmers have shifted to short-cycle crop varieties because the duration of the rainy season is shortening and the rainfall intensity has reduced in time and space with pronounced dry spells
7.
Land tenure (***)
7.
Land is lent forever to new-comers with no condition; land holders ignore that the land has a limit; there is no control over the size of the land being attributed to migrants by land holders; migrants do not respect the size of land or farming rules
8.
Crop prices (*)
8.
There high demand for food at the national and regional levels and the price of cereals is rising, encouraging farmers to expand their farmlands
9.
Agri-business activities (**)
9.
There is a growing agribusiness activity involving ministries and director of societies. They use improved agricultural technologies and casual labor large scale farming
10.
Income generation (**)
10.
Farming remains the main source of income generation and the whole population in the district is farmers.
(*) means important; (**): medium importance; (***): very important
Table 9. Farmers’ perception of drivers of land cover change: deforestation, population, rainfall, crop price and living cost.
Drivers Description
Increased deforestation and forest degradation(***)
  • Shifting cultivation
  • Slash and burn farming practices still prevail
2.
Population increase
2.
Population grows mostly from immigration of farmers
3.
High demand for wood energy
3.
Cassou provides the big cities (Ouagadougou and Koudougou) with wood and charcoal
4.
Illegal cutting and farming
4.
There is no respect for wood cutting techniques or for limits provided by the foresters
5.
Bush fires
5.
Bush fires occurs 2 to 3 times in the year
6.
Grazing
6.
In addition to local domestic animals, there is a transhumance all time
7.
Plantation
7.
There are no tree plantation initiatives from local farmers
8.
Cash
8.
There is permanent need for cash, and alternative sources of cash besides farming and wood cutting are limited
Increased population size (***)
  • Immigration
  • Major immigration from the crowded central and northern regions of the country in search of farming and grazing lands
2.
Aridity in pushing zones
2.
There is an increasing aridity in the pushing zones north and centre of the country
3.
Land tenure in pulling zones
3.
There is easy access to land in Cassou and this encourages farmers to come
4.
Natural population growth
4.
The natural population growth rates in Ziro and Sissli are perceived to be among the highest in the country
Decreased rainfall (**)
  • Deforestation and forest degradation
  • Reduction in forest cover has an impact on rainfall
2.
Culture
2.
Under modernization, people to do not meet the cultural needs to satisfy our ancestors who ply the intermediary role between us and God
Increased crop price (*)
  • Food demand
  • There is a high demand for food with the increasing population
2.
Industry
2.
Transformation industries are emerging in the country
3.
Market
3.
There is easy access to local and international markets
4.
urbanization
4.
Increasing urbanization in the country with increasing demand for food in cities
Increasing living cost (**)
  • Education
  • We pay for the education of our children
2.
Health
2.
We go to the modern medical centre when a family member is sick and this has a cost
3.
Housing
3.
We must build more secure houses with metal and cement which are costly
4.
Transport and communication
4.
We need motorcycles and mobile phones and we face the cost for maintenance
(*) means important; (**): medium important; (***): very important
Deforestation and forest degradation are caused by the prevailing shifting cultivation, significant in-migration of farmers from drought-affected zones, increased demand for wood energy in the capital city, illegal wood cutting and farming in the forest, repetitive bush fires, overgrazing and absence of alternative source of cash generation. High immigration and natural growth rates, increasing aridity in northern and central zones of the country and easy access to land in Cassou are believed to control rapid population growth there. As for climate variability, the participants support that it is driven by deforestation and non-respect for the traditional ritual practices which, according to them, enable abundant rainfalls. Increasing demand for food under rapid population growth and urbanization, emerging transformation industries in the country, and easy access to markets both national and international have contributed to rising crop prices. Participants revealed that the living cost has risen greatly since they aspire to luxury as a spinoff of a new consumerism and market economy. They have to meet the new living standards in terms of education, health, housing (metal and cement), transport and communication (motorcycles and mobile phones).

4. Discussion

Classic land cover driver detection uses heavy questionnaires and long interview guides (e.g., [40,41,42,43]) to assess the drivers using quantitative methods. These methods sometimes fail to capture the actual grounded drivers. The method we used in this paper shows how supporting materials such as land use change maps can trigger targeted discussion with farmers in order to be specific about change in land cover classes and their respective drivers.
Vegetation cover in general (gallery forest and wood and shrub savannah) remained stable during the study period (70% approximately) but within each vegetation cover type, there has been pronounced land use changes. This suggests that vegetation cover in Cassou has experienced both conversion and modification. Modification is a change of conditions within a cover type (forest degradation), while conversion is a change from one cover type to another, such as deforestation to create cropland [44]. Similar studies in southern Burkina Faso have found comparable vegetation covers [24,29], while at the national level, the vegetation cover (forest and other wooded lands) was estimated at 39% [45] and 44% [2] for the year 2010. This indicates that despite the importance of the farmer’s migration to southern Burkina Faso with its subsequent land clearing for agriculture [20,21], southern Burkina Faso still possesses a large proportion of vegetation cover in the country [23].
The conversion/modification from wood savannah to cropland and shrub savannah was simultaneously paired with conversion/modification from shrub savannah, gallery forest and cropland to wood savannah. This could partly be explained by the positive effects of the forest resource management regime for fuel wood extraction in the district. Created in 1985 to supply fuel wood in Ouagadougou (capital city), the Cassou forest was split into 12 management units with 15 plots each. A selective cut is applied to each plot for a 15-year rotation [32]. Such management has contributed to converting cut areas (shrub savannah) into wood savannah before the next cut season. Further, during 1990–2000, there was a very little pressure on forest outside the management units as pointed out by participants during the FGD. This could be referred to as positive land use competition between two functional landscapes: food versus energy/biodiversity requirement. Land use competition is a systematic phenomenon characterized by a complex feedback process between human and biophysical components in the land systems [4]. Without the forest management activities in the area, all the forested area may have been transformed into croplands.
From 2000 to 2013, however, wood savannah decreased dramatically (5%) with negligible persistence and swap. Wood savannah was significantly converted to shrub savannah (32%). This implies that big trees have been removed both inside and outside managed forests. According to the local population, the root cause of the decrease in area of wood savannah within managed forest is non-respect for the wood cutting techniques and non-respect of the limits of the managed forest. The 15-year rotation is not respected and there are illegal croplands inside the management units. Furthermore, the rotation period seems to be short and may not allow trees to grow to maturity before the next cut. Bellefontaine et al. [46] pointed out that in tropical dry forest, the suitable rotation period should be above 15 years to allow tree species in cut areas to grow to maturity for the next cutting season. Outside managed forest, there are multiple reasons for the change, including the prevailing slash and burn farming practices, the massive immigration of farmers and the increasing demand for fuel wood and charcoal in nearby cities (Table 7). Slash and burning farming techniques are common to farmers in tropical savannah [47] and specifically to farmers in central Plateau for the case of Burkina Faso. Migration to southern Burkina Faso increased during the 2000s and most of the migrants came from central plateau [21]. In addition to their unfriendly farming practices [23], the migrants usually cut trees for charcoal production to secure their revenue during the first years of settlement [20,21]. Raw wood and sub-products (charcoal) are sent to Ouagadougou and Koudougou by tens of tracks per day as main household energy preferences for cooking in urban areas [26,48]. The area of gallery forest decreased similarly to the area of wood savannah. Between 1990 and 2000, a large proportion of gallery forest was degraded to wood savannah, but in the period 2000–2013, gallery forest was directly converted to shrub savannah without passing through an intermediate stage. This indicates that the selective cutting system that was in force in the period 1990–2000 was not respected in 2000–2013, or there may have been a recut that occurred without regard for the rotation period being set.
Shrub savannah is the only forest unit whose area steadily increased throughout the two periods. The increase in cover of shrub savannah is a result of wood forest degradation (12% from 1990–2000, and 32% from 2000–2013) and cropland abandonment (6% and 12%). In addition to the above-cited reason for change, climate variability and overgrazing may have contributed to the change. This study did not assess the decline in tree species diversity but it is evident that climate variability has negative effects on species diversity in southern Burkina Faso and specifically in humid southern regions as pointed by Heubes et al. [49] and Salvati et al. [11]. Regarding fodder richness, this part of the country is well populated with cattle and small ruminant preferred tree species (ex. Afzelia africana and Pterocarpus erinaceus) which are usually cut to feed domestic animals [50].
Among all cover classes, cropland is the one whose area stabilized during the study period, although the recent land cover map (2013) reveals fragmented croplands with small patches as compared with the 1990 and 2000 maps. This fragmentation highlights the emerging individualism in the farming system as indicated by the local farmers during the FGD. A close examination of the matrix tables (Table 4 and Table 6) reveals that during 1990–2000, 80% of new croplands were created from wood savannah and 50% of loss in area of cropland went to wood savannah, while in 2000–2013, 51% of new cropland was created from shrub savannah and 97% of loss in area of cropland went to shrub savannah. This indicates two major regime shifts in the study area: (i) there were some types of crops previously used on wood savannah with little disturbance to trees, allowing cropland to quickly return to wood savannah as soon as it was abandoned. During the FGD, it was noted that in the past, the native people used to crop yams under dense trees because yams need shade and host trees to grow up, but with the climate variability and deforestation, yams are no longer planted in the area. Yam cultivation under dense forest was observed in Sissili province by Ouedraogo et al. [28], in localities next to Cassou where dense forests still exist. (ii) The previous farming system preserved many trees in the farmlands and when the farmland is abandoned, it quickly recovers and become wood savannah. However, currently, under agricultural mechanization/intensification, forest is clear-cut to make space for farming and when left, the farmland takes a very long time to recover and can no longer be reconverted to wood savannah, but rather to shrub savannah. The changes within land cover classes show that wood savannah, cropland, and shrub savannah are the most influent structural elements of the study area. Wood savannahs are suitable for wood extraction and cropland extension, while shrub lands are mostly used for grazing and cropland as well.
In contrast with studies that relate population growth to agricultural land increase in southern Burkina Faso and in dryland ecosystems in general [24,29,51,52], the case of Cassou remarkably shows a stagnating cropland size under increased population. The population density in Cassou has shifted from 23.2 inhabitants/km2 in 1996 to 34.7 inhabitants/km2 in 2006 [34,53]. During the group discussion, the farmers agreed that they have reached the limits of the arable land that the district can provide and there is no possibility to create new cropland within the forest because the remaining forest is either the Cassou managed forest or the village forest they have preserved. They tend to intensify the farming system by using improved tools and inputs (fertilizer, herbicide, pesticide, animal manure, new crop varieties, ploughs and tractors) to improve soil productivity in the same croplands. This is evidenced by the low swap for cropland (8%) in 2000–2013 as compared with the high swap in 1990–2000 (16%). Newcomers in search of farming lands have to borrow portions of cropland from land owners, or else they will have to illegally cut forest to create their croplands and be under repression from the population and/or foresters. It was reported from the 2014 Landsat image processing that 2198 hectares accounting for illegal farming belonging to migrants were found in the Cassou managed forest alone (personal communication). This finding is in line with similar studies in the north of Burkina Faso [54], in the Sahel region [55,56], and in the Ethiopian highlands [57,58], which found that increased population density has not necessarily systematically led to cropland increases. Such trends occurred because land has become a limiting factor to agricultural land expansion, farmers have easy access to national and international markets, price of agricultural products is rising and farmers have alternative sources of income generation (animal raising, wood and charcoal sales).
With regards to vulnerability, gallery forest and wood savannah have a high tendency to lose to other land cover types as they show negative and high net persistence, while shrub savannah has a potential to gain from the other cover classes. Cropland, however, has nearly a zero net persistence, indicating that this cover type will remain stable in the near future if the same conditions prevail in the area.

5. Conclusion

Remotely-sensed data, coupled with field data collection and group discussions, were used to detect land cover transition and vulnerability to transition, and to understand the reasons that govern the change processes as perceived by the local population in southern Burkina Faso. Within the 23-year period, notable land cover transitions were detected of which local populations are aware and for which they know the core drivers that have led to changes. The overlapping influence of multiple drivers renders impossible any detangling efforts among them. The complex situation makes it difficult to design clear-cut planning toolkits for managing tradeoffs. Additionally, to address these drivers one needs to be aware of barriers or organizational hurdles to convening comprehensive and inclusive negotiations for sustainable land practices. Four main premises can be derived from the empirical findings of this study: (i) gallery forest and wood savannah are highly exposed to transition to shrub savannah, mostly due to illegal farming and wood removal inside forest management zones. This calls for measures to protect forests and to promote tree plantation to recover the degraded areas. (ii) A fifteen-year wood cutting rotation inside managed areas seems to be too short for the natural regeneration of the forest. The rotation cycle needs to be extended and this will be facilitated if alternative sources of energy such as gas and electricity could be subsidized in the main cities. (iii) The stabilization of cultivated lands is a tendency toward agricultural intensification, but it is fragile as it is a function of the resilience of the system to the increasing population pressure, climate variability and farming inputs prices. (iv) The increasing in-migration calls for the limitation of the migration process. This could be addressed through setting rules/regulations in pulling zones to discourage candidates and also improve crop productivity in pushing zones to maintain candidates in their land or origin. Therefore, policies that target conservation and restoration of the natural ecosystem, as well as promoting agroforestry practices and reduction of immigration, are recommended for environmental sustainability and socio-economic well-being in the area. The present outputs provide a good base of geospatial information for such policy formulation. Future research needs to assess the vulnerability of the system to climate variability, the magnitude, and the reasons to migrate to Cassou and where migrants originate from. Further research could focus on the impacts of land cover changes on ecosystem services such as carbon storage.

Acknowledgements

This work was funded by the Finnish Ministry of Foreign Affaire through the World Agroforestry Centre under the BIODEV Project (Building Biocarbon and Rural Development in West Africa). We thank Jules Sansan Da and Luc Nignan for their assistance during the fieldwork and the reviewers for their valuable contribution to the paper.

Author Contributions

Issa Ouedrago and Cheikh Mbow conceived the paper rational and carried out data collection. Issa Ouedraogo did the satellite data interpretation and designed the method. He wrote the general draft and Cheikh Mbow, Michael Balinga and Henry Neufeldt edited and contributed to the interpretation of results and discussion. All authors participated in the final draft

Conflicts of Interest

The authors declare no conflict of interest.

References

  1. Promper, C.; Puissant, A.; Malet, J.P.; Glade, T. Analysis of land cover changes in the past and the future as contribution to landslide risk scenarios. Appl. Geogr. 2014, 53, 11–19. [Google Scholar] [CrossRef]
  2. Fischer, C.; Kleinn, C.; Fehrmann, L.; Fuchs, H.; Panferov, O. A national level forest resource assessment for Burkina Faso—A field based forest inventory in a semiarid environment combining small sample size with large observation plots. Forest Ecol. Manage. 2011, 262, 1532–1540. [Google Scholar] [CrossRef]
  3. Were, K.O.; Dick, Ø.B.; Singh, B.R. Remotely sensing the spatial and temporal land cover changes in Eastern Mau forest reserve and Lake Nakuru drainage basin, Kenya. Appl. Geogr. 2013, 41, 75–86. [Google Scholar] [CrossRef]
  4. Haberl, H.; Mbow, C.; Deng, X.; Irwin, E. G.; Kerr, S.; Kuemmerle, T.; Mertz, O.; Meyfroidt, P.; Turner, B.L., II. Finite Land Resources and Competition. In Rethinking Global Land Use in an Urban Era; Seto, K.S., Reenberg, A., Eds.; The MIT Press: Cambridge, MA, USA, 2014; Volume 14, pp. 35–69. [Google Scholar]
  5. Rasmussen, L.V.; Rasmussen, K.; Reenberg, A.; Proud, S. A system dynamics approach to land use changes in agro-pastoral systems on the desert margins of Sahel. Agr. Syst. 2012, 107, 56–64. [Google Scholar] [CrossRef]
  6. Ramankutty, N.; Graumlich, L.; Achard, F.; Alves, D.; Chhabra, A.; DeFries, R.; Foley, J.; Geist, H.; Houghton, R.; Goldewijk, K.; et al. Global Land-Cover Change: Recent Progress, Remaining Challenges. In Land-Use and Land-Cover Change; Lambin, E., Geist, H., Eds.; Springer: Berlin, Germany, 2006; pp. 9–39. [Google Scholar]
  7. Bonan, G.B. Forests and climate change: Forcings, feedbacks, and the climate benefits of forests. Science 2008, 320, 1444–1449. [Google Scholar] [CrossRef] [PubMed]
  8. Stocker, T.; Qin, D.; Plattner, G. K.; Tignor, M.; Allen, S. K.; Boschung, J.; Nauels, A.; Xia, Y.; Bex, V.; Midgley, P. M. Climate Change 2013: The Physical Science Basis. Contribution of Working Group I to the Fifth Assessment Report of the Intergovernmental Panel on Climate Change; Cambridge University Press: Cambridge, UK and New York, NY, USA, 2013. [Google Scholar]
  9. Lambin, E.F.; Geist, H.J.; Lepers, E. Dynamics of land use and land cover change in tropical regions. Ann. Rev. Environ. Resour. 2003, 28, 205–241. [Google Scholar] [CrossRef]
  10. Lindner, M.; Maroschek, M.; Netherer, S.; Kremer, A.; Barbati, A.; Garcia-Gonzalo, J.; Seidl, R.; Delzon, S.; Corona, P.; et al. Climate change impacts, adaptive capacity, and vulnerability of European forest ecosystems. C. Forest Ecol. Manage. 2010, 259, 698–709. [Google Scholar] [CrossRef]
  11. Salvati, L.; Sateriano, A.; Zitti, M. Long-term land cover changes and climate variations—A country-scale approach for a new policy target. Land Use Policy 2013, 30, 401–407. [Google Scholar] [CrossRef]
  12. Lambin, E.F.; Meyfroidt, P. Trends in Global Land-Use Competition. In Rethinking Global Land Use in an Urban Era; Seto, K.C., Reenberg, A., Eds.; The MIT Press: Cambridge, MA, USA, 2014. [Google Scholar]
  13. Hartter, J.; Lucas, C.; Gaughan, A.E.; Aranda, L.L. Detecting tropical dry forest succession in a shifting cultivation mosaic of the Yucatan Peninsula, Mexico. Appl. Geogr. 2008, 28, 134–149. [Google Scholar] [CrossRef]
  14. Mayaux, P.; Holmgren, P.; Achard, F.; Eva, H.; Stibig, H.; Branthomme, A. Tropical forest cover change in the 1990s and options for future monitoring. Phil. Trans. R. Soc. B-Biol. Sci. 2005, 360, 373–384. [Google Scholar] [CrossRef] [PubMed]
  15. Mbow, C.; Fensholt, R.; Rasmussen, K.; Diop, D. Can vegetation productivity be derived from greenness in a semi-arid environment? Evidence from ground-based measurements. J. Arid Environ. 2013, 97, 56–65. [Google Scholar] [CrossRef]
  16. Geist, H.; McConnell, W.; Lambin, E.F.; Moran, E.; Alves, D.; Rudel, T. Causes and trajectories of land-use/cover change. In Land-Use and Land-Cover Change: Local Processes and Global Impacts; Lambin, E.F., Geist, H.J., Eds.; Springer-Verlag: Berlin/Heidelberg, Germany, 2006; pp. 41–70. [Google Scholar]
  17. Geist, H.J.; Lambin, E.F. What Drives Tropical Deforestation? A Meta-Analysis of Proximate and Underlying Causes of Deforestation Based on Subnational Case Study Evidence; LUCC International Project Office: Brussels, Belgium, 2001. [Google Scholar]
  18. Gutiérrez Angonese, J.; Grau, H.R. Assessment of swaps and persistence in land cover changes in a subtropical periurban region, NW Argentina. Landsc. Urban Plan. 2014, 127, 83–93. [Google Scholar] [CrossRef]
  19. Henry, S.; Boyle, P.; Lambin, E.F. Modelling inter-provincial migration in Burkina Faso, West Africa: the role of socio-demographic and environmental factors. Appl. Geogr. 2003, 23, 115–136. [Google Scholar] [CrossRef]
  20. Ouedraogo, I.; Ouattara, K.; Kaboré/Sawadogo, S.; Paré, S.; Barron, J. Permanent internal migration as response to food shortage: implication to ecosystem services in southern Burkina Faso. In Food Production: Approaches, Challenges and Tasks; Aladjadjiyan, A., Ed.; InTech: Rijeka, Croatia, 2012; pp. 41–54. [Google Scholar]
  21. Ouedraogo, I.; Savadogo, P.; Tigabu, M.; Cole, R.; Odén, P.C.; Ouadba, J.M. Is rural migration a threat to environmental sustainability in Southern Burkina Faso? Land Degrad. Develop. 2009, 20, 217–230. [Google Scholar] [CrossRef]
  22. Ouedraogo, I. Land Use Dynamics and Demographic Change in Southern Burkina Faso. Ph.D. Thesis, Southern Swedish Forest Research Centre, Swedish University of Agricultural Sciences, Alnarp, Sweden, 2010; p. 143. [Google Scholar]
  23. Howorth, C.; O'Keefe, P. Farmers do it better: Local management of change in southern Burkina Faso. Land Degrad. Develop. 1999, 10, 93–109. [Google Scholar] [CrossRef]
  24. Paré, S.; Söderberg, U.; Sandewall, M.; Ouadba, J.M. Land use analysis from spatial and field data capture in southern Burkina Faso, West Africa. Agric. Ecosyst. Environ. 2008, 127, 277–285. [Google Scholar] [CrossRef]
  25. Coulibaly-Lingani, P.; Savadogo, P.; Tigabu, M.; Oden, P. C. Factors influencing people’s participation in the forest management program in Burkina Faso, West Africa. Forest Policy Econ. 2011, 13, 292–302. [Google Scholar] [CrossRef]
  26. Ouedraogo, B. Household energy preferences for cooking in urban Ouagadougou, Burkina Faso. Energy Policy 2006, 34, 3787–3795. [Google Scholar] [CrossRef]
  27. Ouedraogo, I.; Savadogo, P.; Tigabu, M.; Cole, R.; Oden, P. C.; Ouadba, J. M. Trajectory analysis of forest cover change in the tropical dry forest of Burkina Faso, West Africa. Landsc. Res. 2011, 36, 303–320. [Google Scholar] [CrossRef]
  28. Ouedraogo, I.; Savadogo, P.; Tigabu, M.; Dayamba, S.D.; Odén, P. Systematic and Random Transitions of land cover types in Burkina Faso, West Africa. Int. J. Remote Sens. 2011, 32, 5229–5245. [Google Scholar] [CrossRef]
  29. Ouedraogo, I.; Tigabu, M.; Savadogo, P.; Compaoré, H.; Oden, P.C.; Ouadba, J.M. Land cover change and its relation with population dynamics in Burkina Faso, West Africa. Land Degrad. Develop. 2010. [Google Scholar] [CrossRef]
  30. Ouedraogo, M. New Stakeholders and the Promotion of Agro-Silvo-Oastoral Activities in Southern Burkina Faso: False Start or Inexperience; IIED: London, UK, 2003. [Google Scholar]
  31. Fontes, J.; Guinko, S. Carte de végétation et de l'occupation du sol du Burkina Faso; Projet Campus, UPS, ICIV Toulouse: France, 1995. [Google Scholar]
  32. Thieba, D. La gestion des ressources forestières à Cassou au Burkina Faso: enseignements pour la gestion des ressources en concession; GRAF: Ouagadougou, Burkina Faso, 2003. [Google Scholar]
  33. Driessen, P.; Deckers, J.; Spaargaren, O. Lectures notes on the major soils of the world (No. 94); Food and Agriculture Organization (FAO): Rome, Italy, 2001. [Google Scholar]
  34. INSD. Résultats préliminaires du recensement général de la population et de l'habitat de 2006; Institut National des Statistiques et de la Démographie (INSD), Direction de la Démographie: Ouagadougou, Burkina Faso, 2007. [Google Scholar]
  35. Hall, F.G.; Strebel, D.E.; Nickeson, J.E.; Goetz, S.J. Radiometric rectification-toward a common radiometric response among multidate, multisensor images. Remote Sens. Environ. 1991, 35, 11–27. [Google Scholar] [CrossRef]
  36. Crist, E.P.; Cicone, R.C. Application of the tasseled cap concept to simulated thematic mapper data. Photogramm. Eng. Remote Sens. 1984, 50, 343–352. [Google Scholar]
  37. Lillesand, T.M.; Kiefer, R.W.; Chipman, J.W. Remote Sensing and Image Interpretation, 6th ed.; John Wiley & Sons: Danvers, MA, USA, 2008. [Google Scholar]
  38. Braimoh, A.K. Random and systematic land-cover transitions in northern Ghana. Agric. Ecosyst. Environ. 2006, 113, 254–263. [Google Scholar] [CrossRef]
  39. Pontius, R.G.; Shusas, E.; McEachern, M. Detecting important categorical land changes while accounting for persistence. Agric. Ecosyst. Environ. 2004, 101, 251–268. [Google Scholar] [CrossRef]
  40. Mottet, A.; Ladet, S.; Coqué, N.; Gibon, A. Agricultural land-use change and its drivers in mountain landscapes: A case study in the Pyrenees. Agric. Ecosyst. Environ. 2006, 114, 296–310. [Google Scholar] [CrossRef]
  41. Cattarino, L.; McAlpine, C.A.; Rhodes, J.R. Land-use drivers of forest fragmentation vary with spatial scale. Glob. Ecol. Biogeogr. 2014, 23, 1215–1224. [Google Scholar] [CrossRef]
  42. Zak, M.R.; Cabido, M.; Caceres, D.; Diaz, S. What drives accelerated land cover change in central Argentina? Synergistic consequences of climatic, socioeconomic, and technological factors. Environ. Manage. 2008, 42, 181–189. [Google Scholar] [CrossRef] [PubMed]
  43. Braimoh, A.K.; Vlek, P.L.G. Land-cover change trajectories in Northern Ghana. Environ. Manage. 2005, 36, 356–373. [Google Scholar] [CrossRef] [PubMed]
  44. Riebsame, W.E.; Meyer, W.B.; Turner, B.L. Modeling land-use and cover as part of global environmental-change. Climatic Change 1994, 28, 45–64. [Google Scholar] [CrossRef]
  45. FAO. Global Forest Resource Assessment 2010; FAO: Rome, Italy, 2010. [Google Scholar]
  46. Bellefontaine, R.; Gaston, A.; Petrucci, Y. Management of natural forests of dry tropical zones, in FAO Conservation Guide; Food and Agriculture Organization of the United Nations: Rome, Italy, 2000. [Google Scholar]
  47. Höhn, A.; Neumann, K. Shifting cultivation and the development of a cultural landscape during the Iron Age (0–1500 AD) in the northern Sahel of Burkina Faso, West Africa: Insights from archaeological charcoal. Quatern. Int. 2012, 249, 72–83. [Google Scholar] [CrossRef]
  48. Mohammed, Y.S.; Bashir, N.; Mustafa, M.W. Overuse of wood-based bioenergy in selected sub-Saharan Africa countries: review of unconstructive challenges and suggestions. J. Cleaner Production 2014, 96, 501–519. [Google Scholar] [CrossRef]
  49. Heubes, J.; Schmidt, M.; Stuch, B.; García Márquez, J.R.; Wittig, R.; Zizka, G.; Thiombiano, A.; Sinsin, B.; Schaldach, R.; et al. The projected impact of climate and land use change on plant diversity: An example from West Africa. J. Arid Environ. 2013, 96, 48–54. [Google Scholar] [CrossRef]
  50. Zampaligré, N.; Dossa, L.H.; Schlecht, E. Contribution of browse to ruminant nutrition across three agro-ecological zones of Burkina Faso. J. Arid Environ. 2013, 95, 55–64. [Google Scholar] [CrossRef]
  51. Reynolds, J.F.; Smith, D.M.S.; Lambin, E.F.; Turner, B.L.; Mortimore, M.; Batterbury, S.P.J.; Downing, T.E.; Dowlatabadi, H.; Fernández, R.J.; et al. Global Desertification: Building a Science for Dryland Development. Science 2007, 316, 847–851. [Google Scholar] [CrossRef]
  52. Ningal, T.; Hartemink, A.E.; Bregt, A.K. Land use change and population growth in the Morobe province of Papua New Guinea between 1975 and 2000. J. Environ. Manage. 2008, 87, 117–124. [Google Scholar] [CrossRef]
  53. INSD. Résultats définitifs Recensement général de la population et de l'habitat du Burkina Faso: du 10 au 20 Dec. 1996; Institut National des Statistiques et de la Démographie (INSD), Direction de la Démographie: Ouagadougou, Burkina Faso, 1998. [Google Scholar]
  54. Rasmussen, L.V.; Reenberg, A. Land use rationales in desert fringe agriculture. Appl. Geogr. 2012, 34, 595–605. [Google Scholar] [CrossRef]
  55. van Vliet, N.; Reenberg, A.; Rasmussen, L.V. Scientific documentation of crop land changes in the Sahel: A half empty box of knowledge to support policy? J. Arid Environ. 2013, 95, 1–13. [Google Scholar] [CrossRef]
  56. Reenberg, A. Embedded flexibility in couple human-environmental systems in the Sahel: Talking about resilience. In The Question of Resilience. Social Response to Climate Change; Hastrup, K., Ed.; Det Kongelige Danske Videnskabernes Selskab: Copenhagen, Denmark, 2009. [Google Scholar]
  57. Headey, D.; Dereje, M.; Taffesse, A.S. Land constraints and agricultural intensification in Ethiopia: A village-level analysis of high-potential areas. Food Policy 2014, 48, 129–141. [Google Scholar] [CrossRef]
  58. Josephson, A.L.; Ricker-Gilbert, J.; Florax, R.J.G.M. How does population density influence agricultural intensification and productivity? Evidence from Ethiopia. Food Policy 2014, 48, 142–152. [Google Scholar] [CrossRef]

