Article

Addressing the Externalities from Genetically Modified Pollen Drift on a Heterogeneous Landscape

1
Department of Geography, Strand Campus, King’s College London, London WC2R 2LS, UK
2
Department of Agricultural Economics and Agribusiness, 217 Agriculture Building, University of Arkansas, Fayetteville, AR 72701, USA
*
Author to whom correspondence should be addressed.
Submission received: 10 August 2016 / Revised: 24 September 2016 / Accepted: 12 October 2016 / Published: 17 October 2016

Abstract

:
Genetically modified (GM) crops have single or multiple genes introduced to obtain crop characteristics that cannot be obtained through conventional breeding. Pollen mediated gene flow from GM to non-GM crops causes some crops planted as non-GM to become GM, and this imposes economic losses on farmers who planted a non-GM crop but then have to sell the harvest on a GM market. The economic losses that result when both crops are grown together depend on the institutional arrangements and the type of property rights in place. We analyze how the spatial heterogeneity of a farmer’s fields affects the land allocation between buffers, the GM, and the non-GM crop based on cross-pollination and initial assignment of property rights. Greater spatial heterogeneity reduces the possibility of coexistence of crops on the landscape and increases the economic losses. Buffer zones enforced to reduce cross-pollination result in less coexistence on heterogeneous landscapes.

1. Introduction

Pollen drift between crops and the lack of post-harvest segregation cause undesired genetically modified (GM) genes to enter conventional crops, and this limits the ability of producers to harvest the crop they planted to optimize their profitability [1]. The general reluctance of consumers toward the introduction of genetically modified organisms and the consequent propensity for market segregation [2,3,4,5], coupled with the regulatory requirements for managing separate supply chains may result in costs to prevent and limit cross-contamination of crops. These prevention costs through the creation of isolation buffers, borne by GM or non-GM producers on the basis of the property right assignments (i.e., right to cross-contaminate neighbors for GM producer, or right not to be cross-contaminated for non-GM producers), can generate economic losses substantial enough that the coexistence of GM and non-GM crops on the same landscape is not feasible. The spatial heterogeneity of a farmer’s fields with regard to field size, shape, and aggregation of the same field types affects the size of buffers needed to prevent cross-pollination to threshold levels. These buffers are isolation distances that may be the primary crop planted but harvested differently, a different crop, or no crop at all. Since buffers typically represent an economic loss, the profitability of farmers changes across fields because buffers differ to meet the cross-pollination thresholds. Regardless of whether GM or the non-GM producers are required to make buffers, the crop grown in the fields with the buffer must be sufficiently more profitable than the crop grown in the fields without buffers for both crops to coexist on the landscape.
Pollen-mediated gene flow is an example of an externality where the assignment of property rights, transaction costs, and initial spatial configuration of GM and non-GM crops affect the adoption of pollen abatement strategies, the final spatial configuration of crops, and firm profits [1]. According to the precautionary principle, the property right system adopted in the European Union (EU) grants the right not to be polluted to non-GM farmers, whereas in the US the legal framework is not as well defined, and cross-pollination can be considered a case of trespass in some jurisdictions [6]. Regardless of the initial assignment of property rights, the allocation of land between GM and non-GM crops will be efficient if there are no obstacles limiting the possibility for the parties to bargain.
However, there are numerous obstacles to bargaining. These obstacles include the regulatory framework developed for hosting two existing markets of GM and non-GM crops, costs of “fencing”, that is costs for implementing measures aimed at reducing the magnitude of pollen flow, the costs of establishing, handling, monitoring, and segregating GM and non-GM production systems [7], and transaction costs (i.e., costs for the parties to reach and enforce agreements), as well as costs of using the court system [8] and social pressures [9]. More generally, the market demand for separate markets is known as identity preservation, and there are segregation costs across the GM and non-GM product supply chains [10,11,12,13]. Coordination between actors through cooperation [14], within-farm crop re-arrangement patterns [15], or other mechanisms, such as insurances or compensation funds [16], can reduce the magnitude of the obstacles previously listed. A simplified system commonly assumes for the absence of transaction costs and a costless switch from one production system to another.
The value of an agricultural landscape with both GM and non-GM crops is the sum of the profits from the GM and non-GM crops grown minus damages and the costs associated with complying with the regulatory framework. The damages from pollination come from selling the portion of the crop grown in the buffer area for a potentially lower GM market price, while incurring the typically higher costs of growing a non-GM crop. GM and non-GM rents are heterogeneous because local variability in yield explains the relative competitive advantage (i.e., the ability to generate greater value) that some groups of farmers can have in the production of respectively non-GM or GM crops [17]. Local variability in soil fertility, for example, could give a farmer that grows a non-GM crop an advantage because her farm has a higher content of organic matter than another in which the neighboring farmer grows the isogenic GM crop. For this reason, the global value of coexistence on a landscape is higher than the value of uniform adoption of either GM or non-GM crops on the landscape [18].
The damages that occur from cross-pollination depend on the social and bio-physical aspects of the landscape (e.g., the number of GM and non-GM farms on the landscape, type of crop, wind direction, and the form and size of fields). The institutional arrangements include property rights assignment, regulatory thresholds for allowed cross-pollination, ex-ante regulations and ex-post liabilities that affect the prevention efforts, and the costs of segregation occurring for the whole storage and processing chain [19]. Benefits and costs of governance structures depend strongly on the definition of the thresholds for cross-pollination that are typically determined after strong political debate. A lower threshold means the likelihood of cross-pollination increases the probability that either GM or non-GM crops are planted exclusively on the landscape [18].
Although the initial spatial configuration of land is known to affect the degree of cross-pollination between GM and non-GM crops [20], no theoretical spatial analysis has been carried out to investigate how variability in field size, shape, and aggregation of fields within farms influences the possibility for GM and non-GM crops to coexist. We evaluate the economic consequences that farmers have to bear in order to avoid cross-pollination between GM and non-GM crops, taking into account alternative property rights. To do so, we create through simulation a heterogeneous landscape in terms of sizes and shapes of fields and we reallocate land from an initial random allocation to GM and non-GM crops using an optimization model that simulates pollen dispersal dynamics. This is used to identify spatial patterns of producer fields on the landscape where coexistence occurs and evaluate the size of the economic losses that arise.
Research on the coexistence of GM and non-GM crops with a focus on spatial analysis has grown. Munro [21] creates a spatial optimization model to identify potential external effects based on patterns of planting, welfare losses in case of unregulated transgenic technology, and policy implications of coexistence regulations. The spatial analysis focuses on a rectangular-shaped spatial landscape where only the non-GM and GM varieties of the same crop can be grown, and whose area is normalized to 1. The main finding is that the area planted with the GM variety results in a spatial externality that is not linear and whose magnitude is proportional to the square of the GM area. However, there is no focus on the alternative assignment of property rights and Munro does not model the use of buffers to protect against the pollen externality. Ceddia and colleagues [22] create a spatial profit maximization model in which the land is allocated between conventional oilseed rape, GM oilseed rape, wheat, and buffer zones. In the case of property rights assigned to GM farmers, non-GM growers protect themselves by creating buffers and clusters of non-GM fields away from the GM ones. When property rights are assigned to non-GM farmers, the model identifies the first best option as the spatial aggregation of fields of the same type and the second best option as the creation of buffers.
Belcher and colleagues [23] develop an agent based model in which speed or stability of GM crop expansion are simulated over a 50-year time frame using a cellular automaton assuming the institutional arrangement in which property rights are assigned to polluters. The simulation examines the rate at which cross-pollination expands over time and the final spatial outcomes. They find cases of spatial configurations that result in a landscape not cross-pollinated over 50 years. Perry [24] develops a model focusing on separation distances (distances between fields used to create buffer zones) to identify the relative maximum proportion of the two types of crop that can coexist on the landscape based on varying separation distances. The only scenario where coexistence is possible is where the proportion of the non-GM land is 0.03% and separation distances are up to 3000 m, which is larger than the separation distances currently applied in the United Kingdom.
A disadvantage of the earlier models is that landscapes are assumed to be homogeneous. None of the studies analyzes the impact of aggregation of fields within farms. The constraints in the allocation of land that come from spatial distribution and aggregation of plots within single farms operating on the landscape have not been modeled so far. We use heterogeneity in order to identify how much spatial variability of field size and shape across a landscape affects the possibility for GM and non-GM crops to coexist.
The next section describes the methods for evaluating whether spatial heterogeneity of fields influences coexistence. This is followed by a description of the data used for the model and then an explanation of the results from the optimization model scenarios. The conclusion highlights the key findings, relates them to the findings of previous work in a similar vein, and discusses model limitations and extensions.

2. Methods and Data

2.1. Landscape and Cross-Pollination Dynamics

The dynamics of cross-pollination and the transition of land types are modeled using a grid of equally sized square cells i that overlap polygons representing the farmer’s fields. Each polygon is composed of a subset of the grid of cells based on the amount of surface that the polygon and the square cells share. The polygons constrain the choice of whether GM or non-GM crops are grown within the cells.
The model keeps track of the total amount of land in three alternative possible states l (GM corn, non-GM corn, and buffer) for each cell i. Only one possible state is allowed for any cell i, and each of the three states is indicated through a binary variable (presence = 1, absence = 0). Buffer zones are created in order to prevent cross-pollination from GM corn to non-GM corn. The buffers are non-GM corn, with non-GM productions costs and yields, that can only be sold in the lower price GM market due to cross-pollination.
Any land use l can be chosen so long as the cumulative amount of land Lli for each cell i at the end of the optimization equals the original amount of land Lli0 for each cell i0 (Equation (1)).
l = 1 m i = 1 n L l i = l = 1 m i 0 = 1 n L l i 0
Cross pollination between GM-corn and non-GM corn for each cell i from all the surrounding cells j is modeled using a negative exponential function based on distance δij between cells (Equation (2)),
g i ( δ ) = j = 1 n G M j * K α 2 2 π e α δ i j * N G M i
where g i ( δ ) is the percentage of cross-pollination in cell i from source cell j, GMi, NGMi, GMj, and NGMj are respectively the binary variables defining the land state (GM and non-GM) in cell i and j, and α and K are constants. The first term accounts for the presence of the GM crop for all cells j surrounding cell i, and the second term indicates the effect of distance from each cell j to cell i on the degree of cross-pollination. The third term accounts for the land state in cell i. If cell i is buffer or GM, the term will be 0, indicating that cross-pollination only affects non-GM cells. The α indicates how rapidly pollen density dissipates with distance from the GM source and K magnifies the density of the GM pollen at any given distance from the source. This model of pollen dispersal does not take into account weather patterns and other factors that could result in spatially variable magnitude of pollen dispersal.

2.2. Property Rights and the Regulatory Threshold for Cross-Pollination

Property rights to GM producers mean buffers can only be created on non-GM land. This simulates the case in which non-GM farmers need to protect themselves from cross-pollination by GM pollen coming from neighboring farms (Equation (3)).
i = 1 n N G M i = i 0 = 1 n N G M i 0 i = 1 n B i
The final amount of non-GM land NGMi for each cell i at the end of the optimization process is equal to the initial amount of non-GM land NGMi0 for each cell i minus the amount of land reallocated into buffers Bi for avoiding cross-pollination to exceed the set threshold. Alternatively, buffers can only be created on GM land to simulate the case in which non-GM producers have the right not to be polluted, and therefore the responsibility for preventing cross-pollination lies with GM farmers (e.g., Europe, Equation (4)).
i = 1 n G M i = i 0 = 1 n G M i 0 i = 1 n B i
The final amount of GM land GMi for each cell i at the end of the optimization process is equal to the initial amount of GM land GMi0 for each cell i minus the amount of land reallocated into buffers Bi for avoiding cross-pollination to exceed the set threshold. Due to the potential of cross-pollination, farmers will switch to buffer or GM based on whether or not the projected level of cross-pollination gi as a proportion of the entire field will exceed the regulatory threshold hf of cross-pollination defined as a proportion of each field f composed of subsets of cell fi based on the following rule (Equation (5)):
f i = 1 m j = 1 n G M j * K α 2 2 π e α δ f i j * N G M f i f i = 1 m N G M f 1 h f  
This means that the overall proportion of any non-GM field f cross-pollinated cannot be higher than the threshold hf. The overall proportion of a non-GM field cross-pollinated is the arithmetic average of the proportion of the subset of cells fi cross-pollinated. In other words, all non-GM cells in each field f are harvested together. Buffers will be created on the edges between non-GM and GM fields for two reasons. First, this increases the distance between subsets of non-GM cells in one field and subsets of GM cells in the neighboring fields, and second, this reduces the overall cross-pollination in a non-GM field by taking out non-GM harvest cells that are too cross-pollinated for the non-GM field to meet the regulatory cross-pollination threshold.

2.3. Economic Objective

The producer’s profit motive guides the transitions that occur among land states. Farm profits of the crop production are maximized subject to the regulatory threshold of cross-pollination, potentially allowing coexistence of genetically modified and conventional crops on the same landscape. The economic parameters needed to describe the profit objective are the price per ton of corn crop pl, assuming that different markets for GM and non-GM corn exist, and that corn produced in buffer areas can only be sold in the GM corn market. The cost for producing one hectare of crop l is expressed by cl. The yield for each crop is expressed with the parameter yl in tons per hectare, and is assumed to depend on the production system l, where for simplicity buffers have the same yield as non-GM corn. The resulting objective function (Equation (6)) is
max G M f i , N G M f i , B f i :   i = 1 m l = 1 n ( p l y l c l )   for   all   types   of   land  
subject to the equation for the cross-pollination (5), the dynamics of land use (1, 3, and 4), and the non-negativity constraints for areas of each land use and the initial condition of the variables. This is a mixed integer non-linear problem solved using the SCIP (Solving Constraint Integer Programs) algorithm with the Generalized Algebraic Modeling System (GAMS) 23.5.1. The non-linear constraints are in Equation (5) for the threshold of cross-pollination in terms of the negative exponential dispersal function.

2.4. Modeling Approach

Unobservable elements that contribute to spatial heterogeneity include the variability in soil fertility, depth and permeability, land exposure, availability of water, amount of organic matter, carbon to nitrogen ratio, variability in soil acidity, types of crops previously grown, and the agricultural practices. Farmers can have a local competitive advantage in comparison to their neighbors even in the event that they grow a crop that is less profitable according to the observed yields and costs. To observe the less profitable crop grown, and have coexistence on the landscape, the unobserved competitive advantage must be at least equal to the gap between the most profitable and the least profitable crop. Supposing an unobserved competitive advantage, the optimization model requires GM acreage to be grown on an unconstrained homogeneous landscape and a heterogeneous landscape.
The first model is performed on a landscape characterized by size s and by the presence of only two fields (one GM and one non-GM) that vary in their relative size in t hectare cells. No constraints on the position and shape of the two fields are set to allow for the identification of the most efficient relative positions of the fields in terms of reduction of cross-pollination. For the GM and non-GM property right arrangements, two profitability levels are analyzed at the baseline threshold of cross-pollination and with the baseline dispersal function. A second model of 15 heterogeneous fields, and the profitability of each field, is computed to study how the final ratio between buffer and the planted GM or non-GM crop in each field depends on the position of the field on the landscape, land use for the neighboring fields, and the size of each field.
Sensitivity analyses for the heterogeneous landscape are conducted with regard to who has the property rights and the relative profitability of the GM and non-GM crop based on 5% increments between −15% and +30%. Thresholds of cross-pollination directly affect the amount of land that is needed to create effective buffers. Sensitivities have been performed with the following threshold levels: 5%, 2%, 1%, 0.9%, 0.5%, 0.25%, and 0.1% of maximum cross-pollination permitted to still classify a crop for the market as non-GM. The value of 0.9% is the baseline since it is the current legislative threshold of cross-pollination in the European Union.
Profitability of buffers depends on GM prices and non-GM costs and yields, due to the fact that buffers are constructed with the characteristics of the non-GM crop in terms of agricultural yields and production costs, but need to be sold into the GM market as a consequence of cross pollination. In the case in which non-GM producers have the right not to be polluted, the variation in relative profitability for the GM to the non-GM crop also results in a variation in profitability for buffers because of the increase in the market price for buffers. The model has been set up so that the maximum profitability for buffers cannot exceed the profitability for the non-GM crop. In the opposite property right scenario, what varies is the non-GM profits, meaning that the relative profitability between GM and the buffer also changes. The model has been set up so that the relative profitability between non-GM and the buffer remains constant (buffer randomly selected to be 30% less profitable than non-GM to represent a significant economic loss).

2.5. Data

Two different sets of data have been created and used in order to run the model and perform the sensitivity analyses. The common elements of all models are described in Table 1.
Given that most of the regulation adopted for coexistence in the EU requires buffers that are 50 m wide [1], a 25-m landscape resolution allows representation of the magnitude of cross-pollination and the creation of buffers in an adequate way for keeping manageable the number of iterations needed for the optimization. The negative exponential form of the dispersal curve has been taken from Lavigne and colleagues [25] and its parameter K has been modified to have a drop from 100% to 4% cross-pollination in the first 25 m, based on the estimated 98th percentile of the dispersal function for corn developed in Weeks et al. [20] and based on the minimum 25 m spatial resolution that computational complexity allows for reasonable solving times of our model. The 0.9% cross-pollination that corresponds with regulatory threshold occurs at 39 m. This modified dispersal function describes a type of pollen dispersal that could be attributed to a cross-pollinating crop such as corn. The dispersal function described by a coefficient K = 1 and α = 0.375 has been used by Lavigne [25] to model pollen dispersal of oilseed rape.
The values for corn prices, yields, and production costs were obtained from the 2014 Crop Production Budgets for Farm Planning for its thoroughness in eliciting all production costs [26]. The baseline for profitability considers GM corn, non-GM corn, and corn grown in the buffer areas as being equally profitable, meaning there is no economic incentive to switch from one production system to another, and that cross-pollination does not result in any economic damage. This is a starting point to compare economic outcomes for the alternative property right arrangements when the relative profitability between production systems varies.

2.5.1. Homogeneous and Unconstrained Landscape

The baseline for the unconstrained landscape is a square grid of 225 cells, or 14 hectares, that constitutes two fields, one GM and the other non-GM (Table 2). This size has been deemed adequate to balance computational complexity and representativeness.
The shape and the position of the two fields is not constrained in space, which means that the model will create the two fields based on the two subsets of cells that minimize cross-pollination by changing their position in space and their shapes. This model allows us to identify a reference in terms of the magnitude of the economic losses and the percentage of land allocated into buffers when the most efficient spatial allocation of land is reached.

2.5.2. Heterogeneous and Constrained Landscape Analysis

The analysis of coexistence in the case of spatial heterogeneity has been carried out on a square 900 cell grid whose area is 56 hectares. The selection of this size has been dictated by computational complexity. The parameters that define the initial spatial configuration used as the baseline of the analysis are in Table 3.
The particular landscape chosen for the analysis, as well as the position of GM versus non-GM fields, comes from a randomly selected Voronoi diagram (Figure 1).
A Voronoi diagram is a geometrical construct defined by a set of randomly scattered points on a landscape that generate a series of polygons (i.e., the fields on the landscape), where any edge between two polygons is equidistant to two points and each vertex is equidistant to at least three of the points. Figure 1 shows the spatial allocation of non-GM fields and GM fields (white and black polygons, respectively). Fields are numbered and area ranges from 1.00 hectare (field 7) to 7.56 hectares (field 14). The average size of fields is 3.75 hectares. Each field is cultivated by a different farmer.
The parameter values for the heterogeneous landscape are chosen so that the buffer zones in the fields are spatially variable in thickness, and the percentage of the overall area in buffer changes with the threshold for cross-pollination. Alternative heterogeneous landscapes would change these findings, but the focus in this paper is comparing the buffer in the homogeneous unconstrained landscape and the heterogeneous constrained landscape.

3. Results and Discussion

The first set of results is for the unconstrained and homogeneous landscape when first the property rights belong to the GM producers and the second for when the property rights belong to the non-GM producers. The second set of results are for the heterogeneous landscape.

3.1. The Homogeneous and Unconstrained Landscape

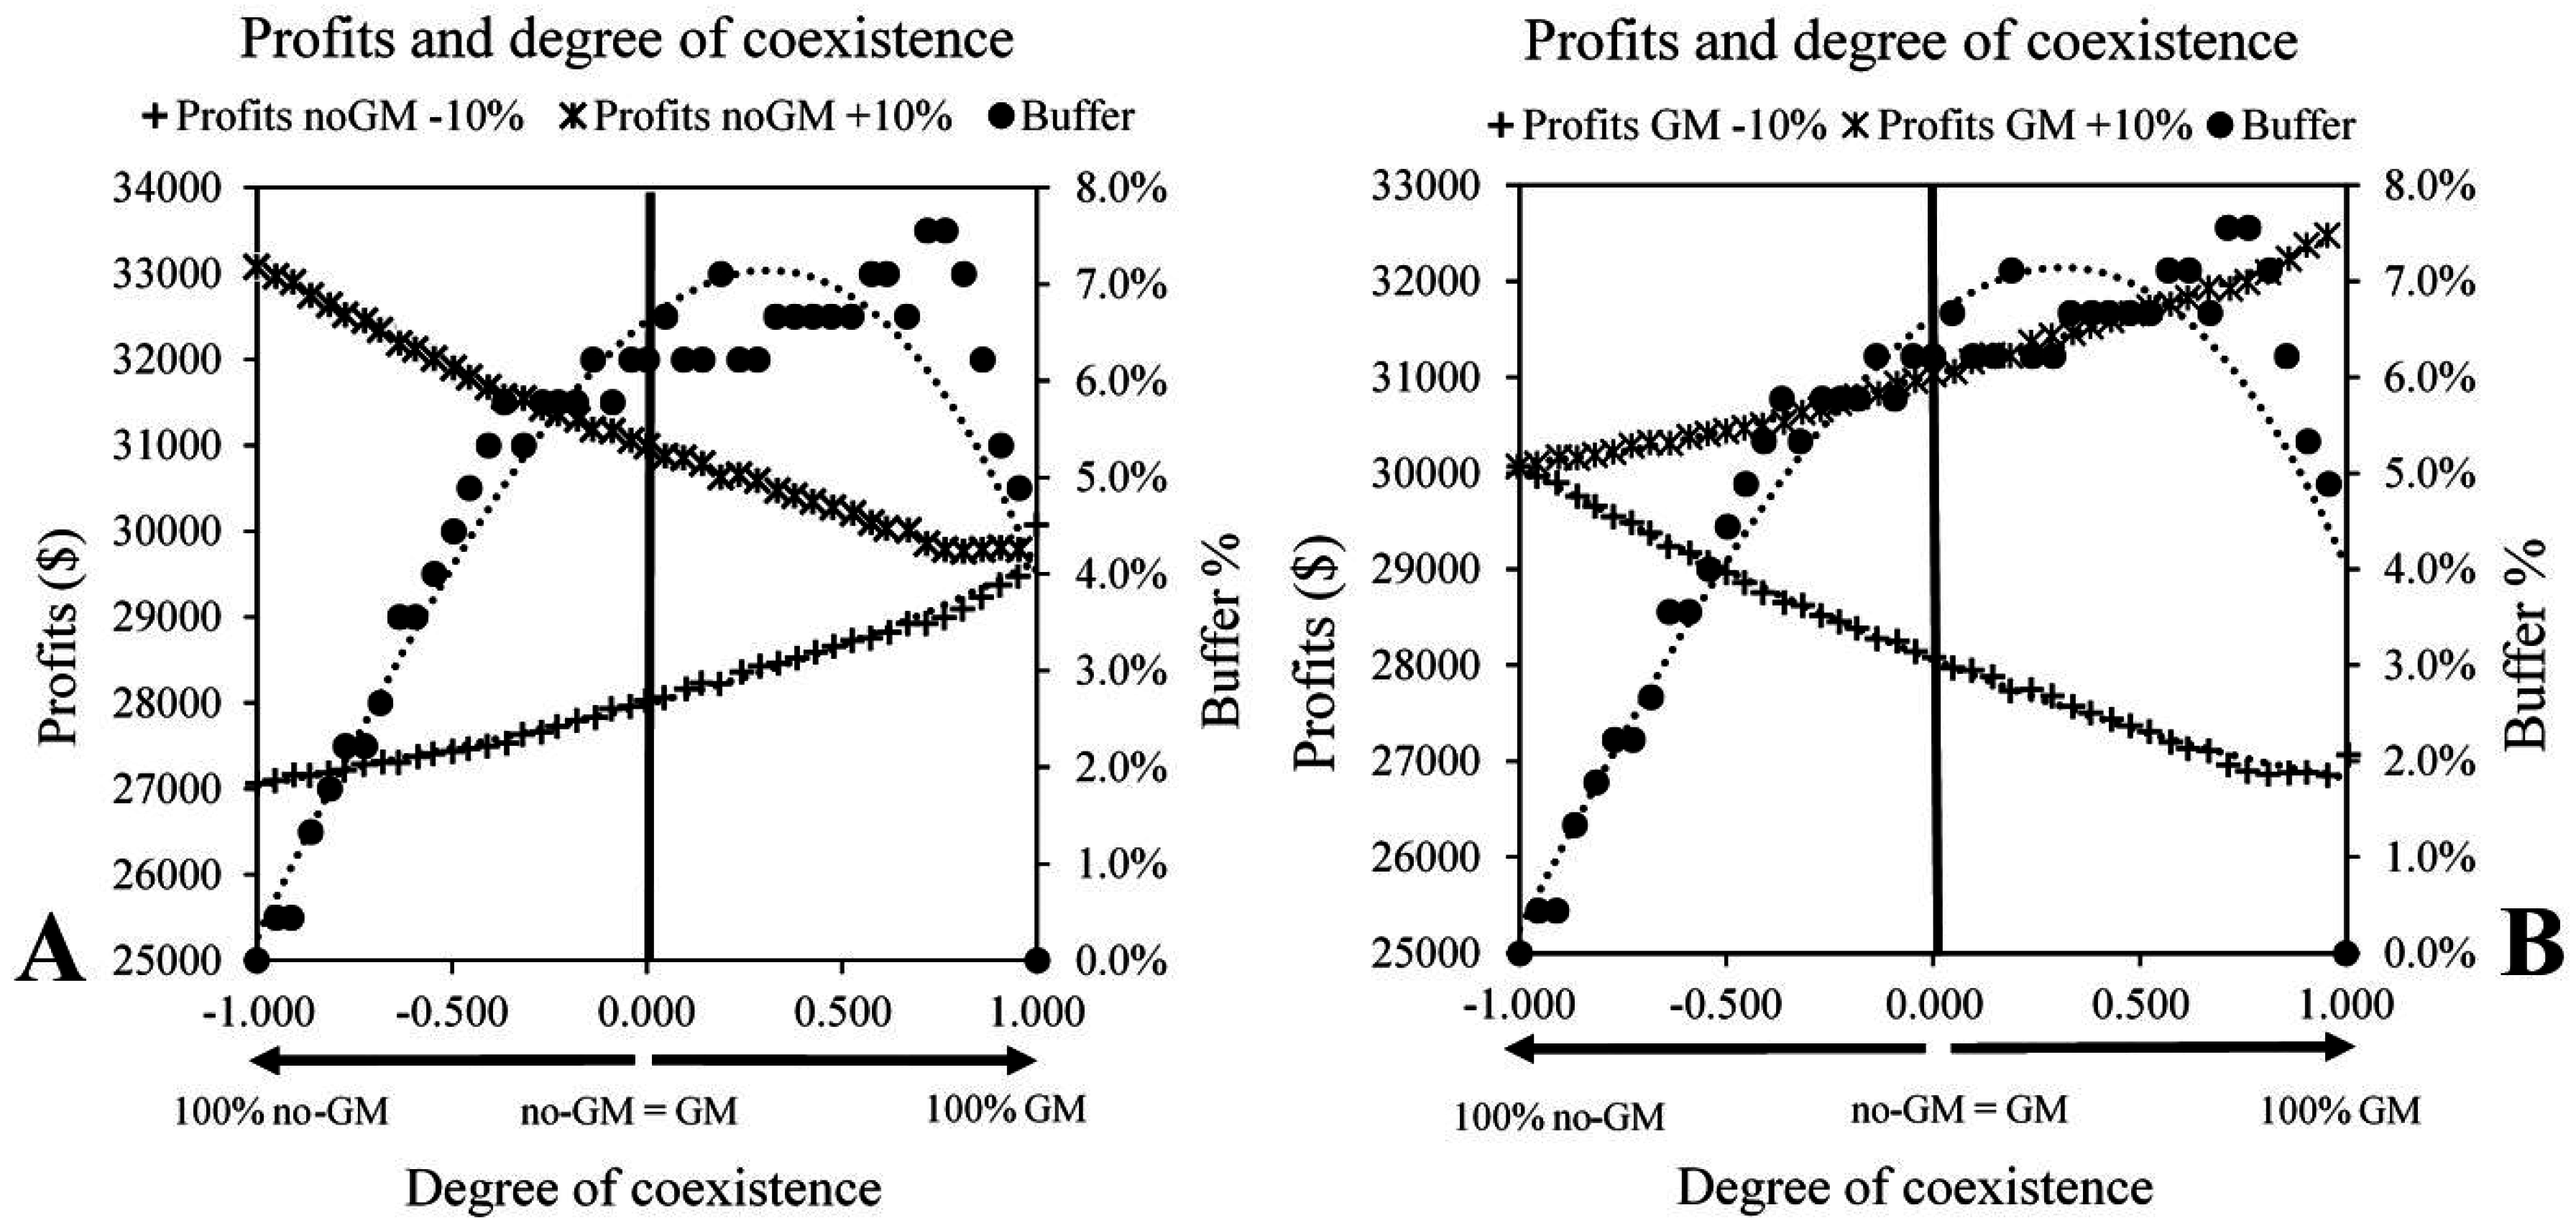
Figure 2 shows in the graph to the left the amount of the profits for the entire landscape and the amount of buffer needed for the non-GM portion of the landscape to be cross-pollinated below the 0.9% threshold when GM producers have the property rights. Represented in the graph are all the intermediate situations between a landscape grown with only the GM crop, or only the non-GM crop.
It can be observed that the percentage of buffer varies from a minimum of 0% (in case of no coexistence in place) to a maximum of 7.8% of the entire landscape. For the situation in which the amount of GM crop equals the amount of non-GM crop (maximum coexistence), the buffer needed to prevent cross-pollination to the threshold level is around 6% of the whole landscape surface. The amount of buffers starts to decline when the GM crop covers around 75% of the landscape due to increasing saturation. The reduction in the surface of the non-GM crop results in a reduction on the length of the edge delimiting the two crops, which translates into a decrease in the surface needed to reduce cross-pollination. The non-GM crop cannot be grown on the landscape when the GM crop covers about 93% of the available surface. The amount of buffer needed to prevent cross-pollination is unrelated to the profitability levels of the crops, and only depends on the specific maximum level of cross-pollination allowed.
With regard to the profits for the entire landscape, when non-GM profitability is 10% higher than GM, an increase in the GM surface causes a reduction in profits whose maximum value is $33,000. When there is the maximum degree of coexistence, which is the value of 0 on the horizontal axis at the center of the graph, profits for the landscape are about $31k, or $2,000 below the profits in the case of full adoption of the non-GM crop. When non-GM profitability is 10% lower than GM profitability, the economic value of the crops on the landscape varies from about $27k to about $30k. When there is the maximum degree of coexistence, the value of both crops on the landscape at $28k is about $1,900 lower than in the case of full adoption of the GM crop on the entire landscape at $29.9k.
Figure 2 also illustrates in the graph to the right the buffer areas in relation to the coexistence between the GM and the non-GM crop on the landscape, and the profits at the landscape level when the GM crop is 10% less or more profitable than the non-GM crop when the non-GM producers have the property rights. The amount of buffer needed for avoiding cross-pollination greater than the 0.9% threshold is not influenced by either the property right assignment or the profitability levels of GM and non-GM crops. The model minimizes the amount of buffer to minimize the economic losses that the buffers cause. Since the profitability of buffers is always modeled as lower than both the GM and the non-GM crop, buffers will always be minimized.
As for the economic returns at the landscape level, they vary from a value of around $30k (100% no-GM) to a maximum of a little under $33 k (100% GM in case of GM 10% more profitable than non-GM), and to a minimum of about $26.9k (100% GM in case of GM 10% less profitable than non-GM). The landscape profits when the maximum degree of coexistence is observed (GM area = non-GM area) vary from a little above $28k to a little below $31k based on the relative profitability between the GM and the non-GM crop.
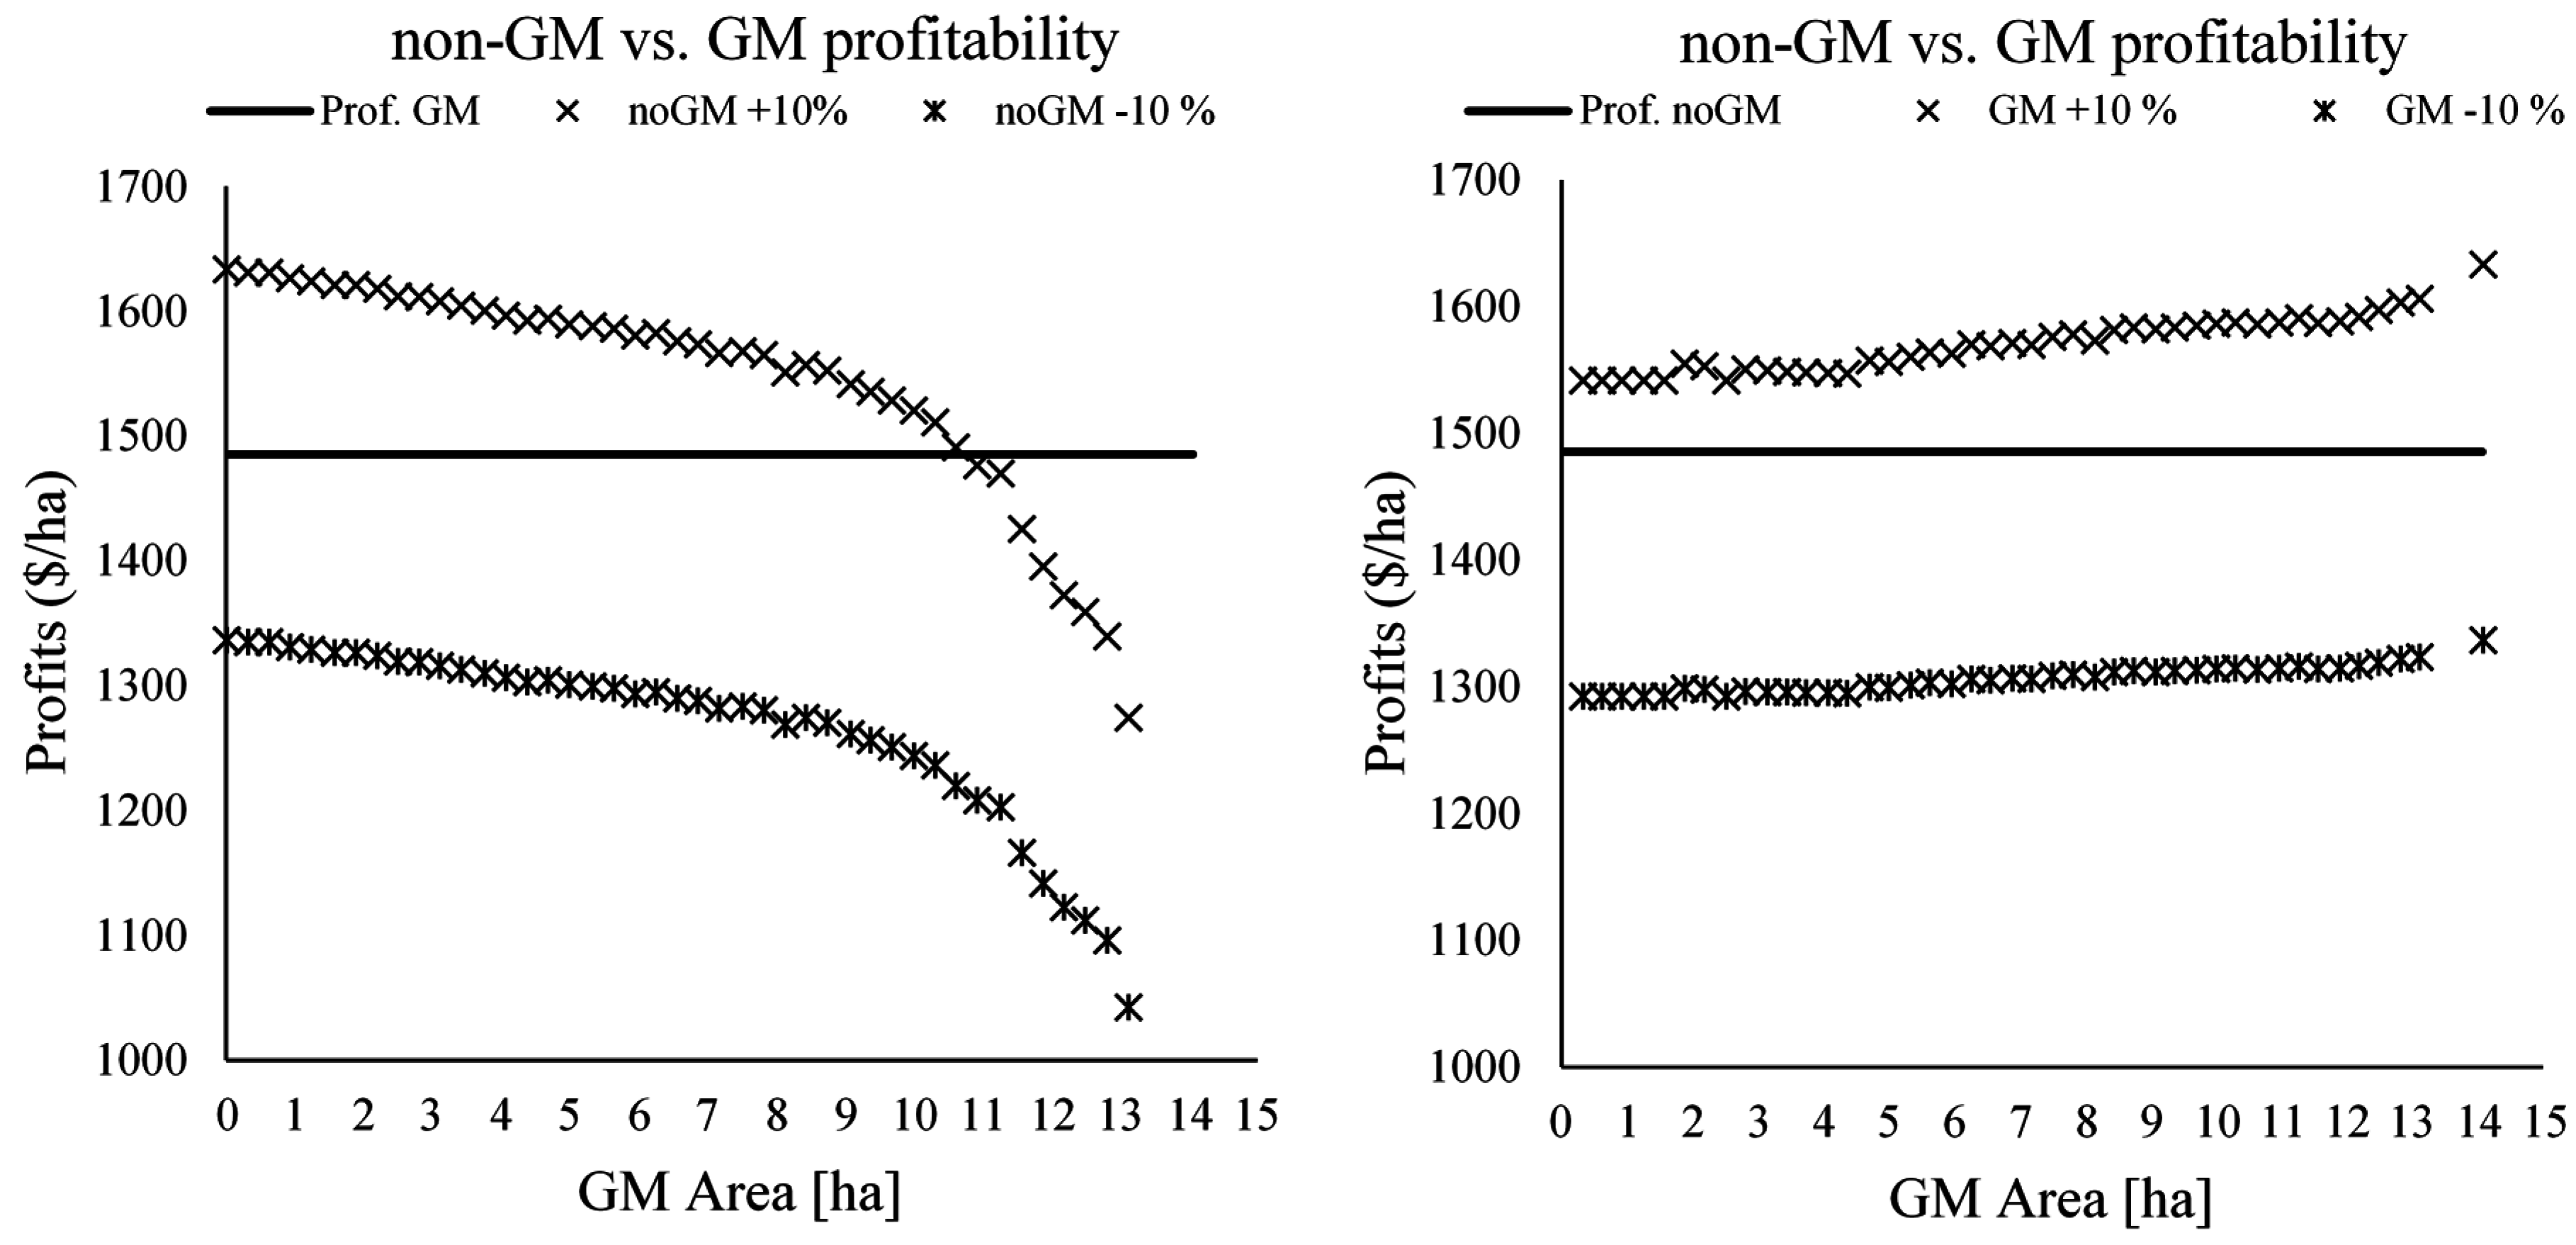
Figure 3 indicates that when the non-GM crop is 10% more profitable than the GM crop, there is an economic incentive to grow the non-GM crop until the GM area equals around 11 hectares. For bigger GM areas the higher non-GM profitability does not allow for covering the costs of creating buffers. The horizontal line is the $1485 per hectare that indicates the baseline economic profit obtained from growing only one type of crop on the landscape. In the −10% profitability scenario for the non-GM crop, coexistence is observed if the competitive advantage for non-GM producers is between $150/ha (or $1485–$1335) to about $360/ha (or $1485–$1125) depending on the amount of GM land on the landscape.
Figure 3 also shows in the graph to the right the per hectare profit of the GM crop in comparison to the non-GM crop taking into account the costs for meeting the 0.9% cross-pollination threshold and as a function of the GM area on the landscape when non-GM producers have the property rights. Since GM producers have to bear the costs of preventing cross-pollination and buffers vary as the GM area varies, GM profitability also changes, while the non-GM profitability remains constant. GM profitability increases as the GM area increases, and the magnitude of the increase is about $60/ha in the case where GM is 10% more profitable than non-GM (from $1,550/ha to $1,610/ha), and about $30/ha in the case where GM is 10% less profitable than non-GM (from $1,300/ha to $1,330/ha). In the case where coexistence is observed and GM is 10% more profitable than non-GM, non-GM producers have a competitive unobserved advantage that varies from $50/ha (or $1,535–$1,485) to about $110/ha (or $1,595–$1,485) based on the amount of the GM crop on the landscape. On the other hand, when GM is 10% less profitable than non-GM and coexistence is observed, GM farmers have a competitive advantage that varies from $180 (or $1,485–$1,305) to $200/ha (or $1,485–$1,285) based on the amount of GM land, with the more GM land on the landscape the less the competitive advantage.

3.2. The Heterogeneous Landscape

Table 4 shows the profits and losses at the landscape level as a function of increasing profitability for the non-GM crop in comparison to the GM crop and thresholds of cross-pollination when GM producers have the property rights.
GM land is constrained so that fields do not switch into a more profitable non-GM crop. One explanation for the constraint that the GM crop is grown despite lower profits may be unobserved competitive advantage for those fields to remain in GM production. Stricter thresholds result in greater economic losses. A threshold of 0.1% implies that there is no economic incentive for growing the non-GM crop even in the event that it is 25% more profitable than the non-GM. For the legislative threshold adopted in the European Union, coexistence becomes profitable when the non-GM crop is between 15% and 20% more profitable than the GM one. When the non-GM crop is 5% more profitable than the GM crop, a threshold of 5% still results in coexistence on the landscape which is less profitable than the baseline. It is possible to quantify what competitive advantage non-GM farms need to have in order to keep growing the non-GM crop. In the case where the non-GM crop is 15% more profitable than the GM one and a 0.10% threshold is in place, coexistence is only possible if non-GM farms have a competitive advantage that is at least sufficient to balance the 4.1% loss. If coexistence is observed on the landscape for all positive values in Table 4, GM farmers have a competitive advantage in relation to non-GM farmers.
Table 4 also shows the percentage deviation from the baseline of overall economic returns on the landscape in the case where property rights are assigned to non-GM producers, and buffers are created into GM fields. As in the alternative property right scenario, tighter thresholds result in increasing economic losses. At the 0.9% threshold coexistence becomes profitable when the GM crop is between 10% and 15% more profitable than non-GM crops, and at the 0.1% threshold coexistence becomes profitable when the GM crop is between 20% and 25% more profitable than the non-GM crop. For allowing economic coexistence, a threshold higher than 5% should be in place when the non-GM crop is 5% more profitable than the alternative non-GM crop. For all combinations characterized by negative values, a competitive advantage for GM farms is assumed to be in place if coexistence exists on the landscape.
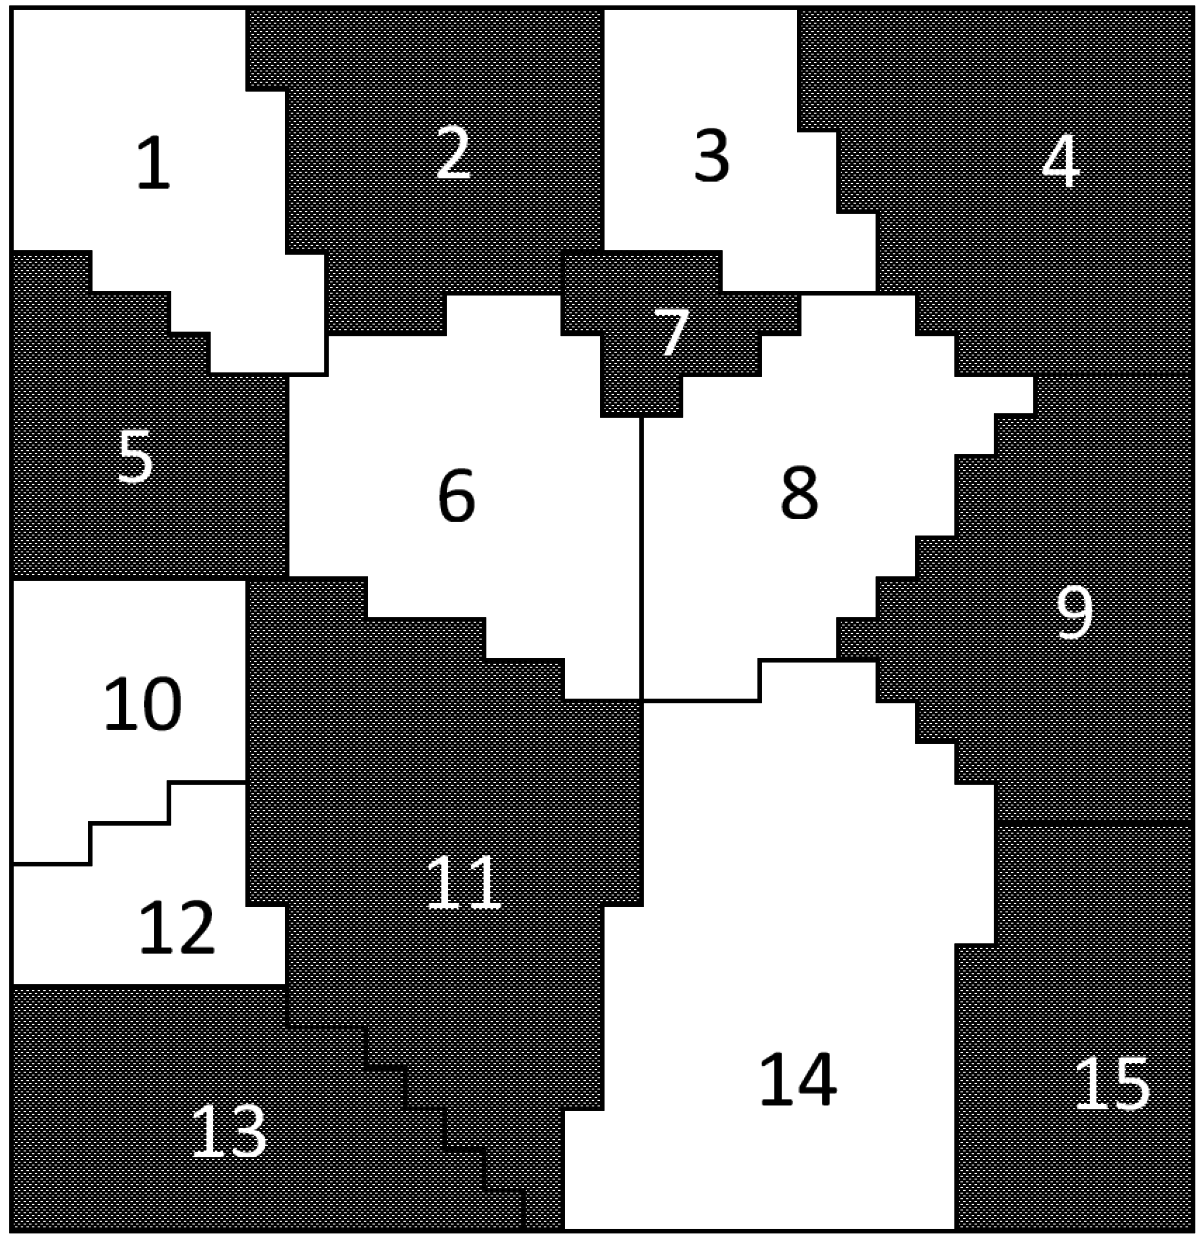
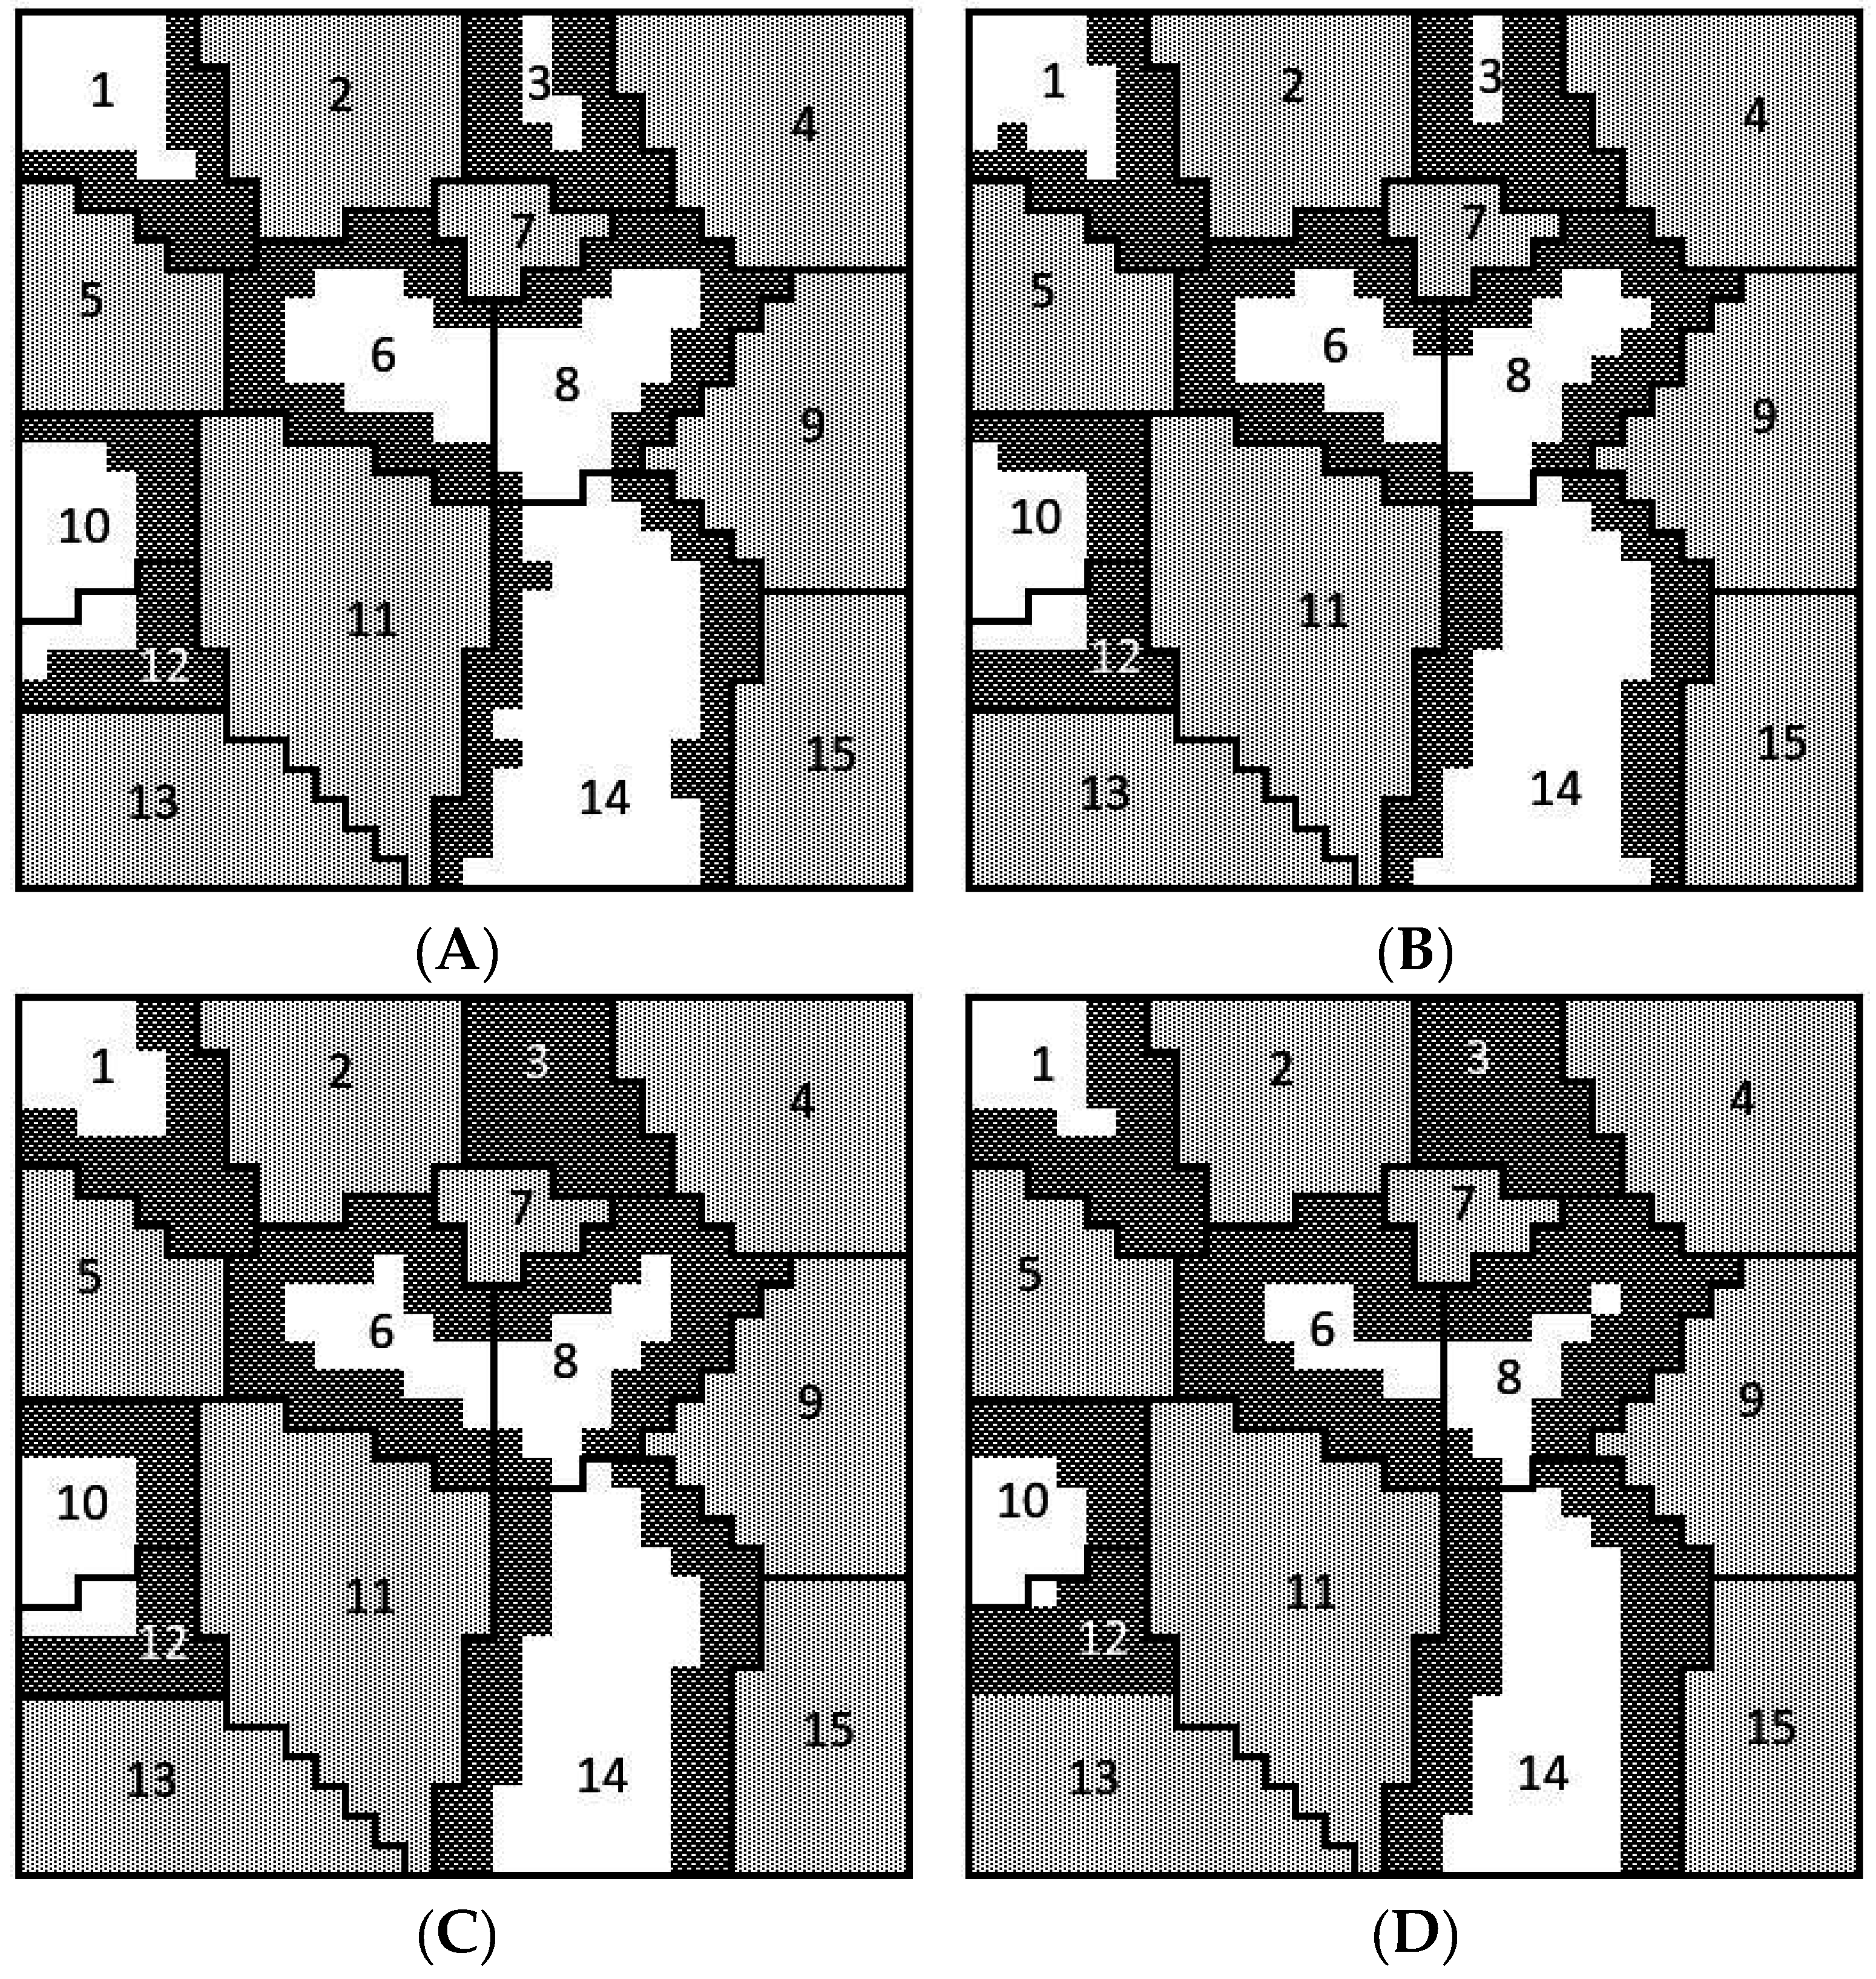
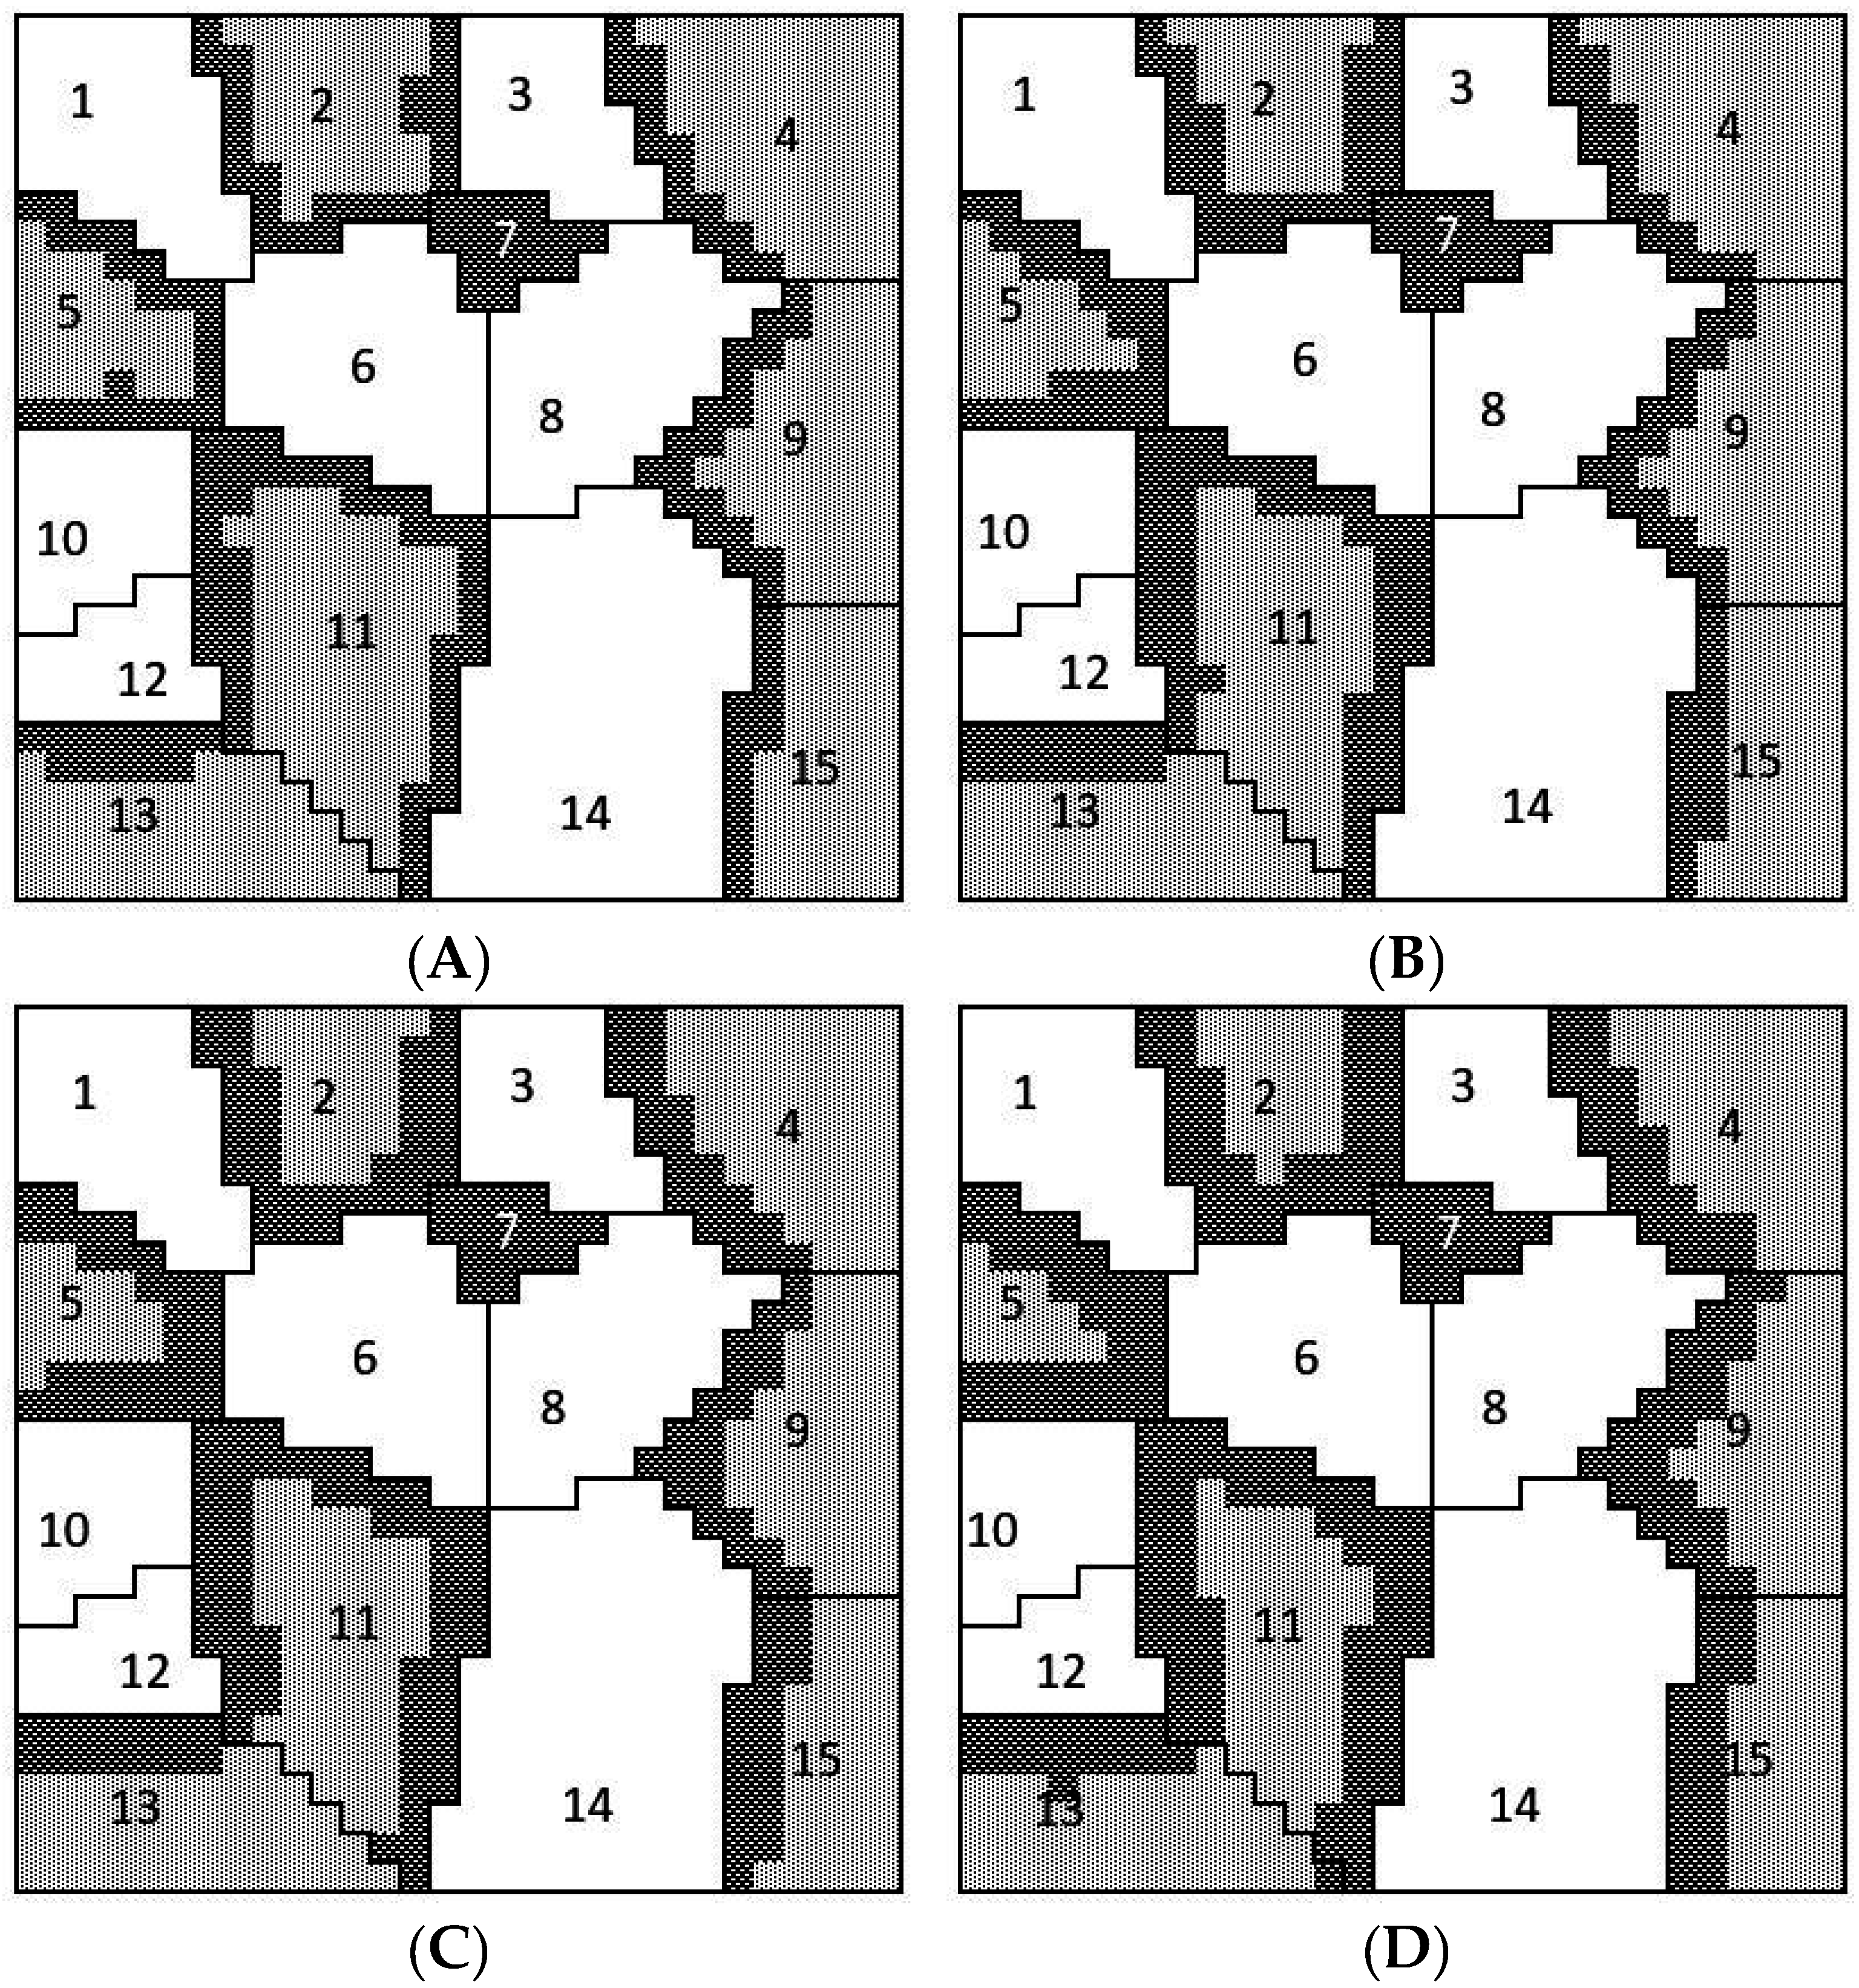
Figure 4 shows the spatial configurations of GM, non-GM, and buffer areas resulting from the model runs for the 5%, 1.5%, 0.9%, and 0.25% thresholds.
Buffers are created inside the non-GM fields because GM producers have the property rights, and increasing buffers result from stricter thresholds of cross-pollination. It is worth noting that buffers do not represent uniformly wide areas that separate GM from non-GM fields, but they are areas that, due to their particular position, and degree of reduced cross-pollination as a function of their position, determine an overall cross-pollination in all the remaining non-GM area lower than the set thresholds of cross-pollination. The buffers absorb most of the pollen that drifts from the nearby GM fields, and this allows the non-buffer portion of the non-GM field to meet the regulatory threshold. This is why thicker buffers are needed when the regulatory threshold is more stringent.
Figure 5 shows the spatial configurations of GM, non-GM, and buffer areas as resulting from the model runs for the 5%, 1.5%, 0.9%, and 0.25% thresholds.
Buffers are in this case created inside GM fields. As in the previous case, the most efficient configurations result in buffers that are not homogeneous in their width. The overall amount of buffer areas increases as a consequence of increasingly strict thresholds of cross-pollination. When GM producers hold the property rights, a buffer area of 11.4% of the total landscape is needed at the least stringent threshold of 5%, and these numbers increase to 30.5% in the case of the most stringent threshold of 0.25%. At the 0.1% threshold the amount of land that can be considered non-GM is lower than the amount of buffer to prevent excessive cross-pollination in the non-GM area. At the 0.9% threshold there is an almost equal amount of non-GM and buffer land. In the case where non-GM producers have the property rights, again the amount of buffer needed to prevent cross-pollination increases the more stringent the thresholds become. In particular, buffers range from 9.5% of the landscape surface at the 5% threshold to 25.4% of the landscape surface in case of a 0.1% threshold of cross-pollination. The differences in percentages of buffers for the two alternative property right assignments arise from the particular landscape configuration, the relative size between GM and non-GM fields, and the overall GM area vs. non-GM area on the landscape.
Table 5 shows the percentage profits relative to the baseline as a function of thresholds of cross-pollination and relative profitability between the GM and the non-GM crop at the field level. This allows for the identification of spatial differences in economic returns from heterogeneity of the fields on the landscape based on field shape, size, and position in space. Due to the property right arrangements, it is assumed that GM fields have homogeneous profitability that is not affected by space, whereas heterogeneity is expected for non-GM fields because buffers are made in the non-GM fields to meet the regulatory threshold of cross-pollination.
Due to computational complexity of the model, it is only possible to elicit when a field is suitable or not for non-GM crops, and all the negative values (represented with dashes in the table) only indicate the spatial economic unsuitability for the non-GM crop. In fact, due to spatial inter-relations of pollen dispersal between fields, it is impossible to derive that, whenever a field is not suitable for the non-GM crop, it is economically better for the GM alternative. This is because switching a field from non-GM to GM will affect the profitability of all neighboring non-GM fields that will require additional buffers that were not required before. A switch of one field from non-GM to GM could even result in the consequential disappearance of all non-GM fields on the landscape.
The results show that fields 14 and 10 are the most suitable for coexistence, whereas field 3 is the least suitable. In particular, field 14 is the largest among the non-GM fields, whereas field 10 borders with one GM field and with the edge of the area created. It therefore receives cross-pollination only from two edges. For field 3, the costs of creating buffers can be compensated only in the event that profitability for non-GM crops is 20% higher than the profitability for GM crops, and with a cross-pollination threshold higher than 5%. The legal threshold of 0.9% can be economically sustainable when non-GM is 15% more profitable than GM only for fields 10 and 14, and six out of the seven non-GM fields are economically sustainable at the 0.9% threshold when the non-GM crop is 30% more profitable than the GM crop.
Table 6 shows the deviation from the baseline in terms of profitability at the field level when non-GM producers have the property rights.
Fields 13, 9, and 4 are the most suitable for growing GM crop and for preventing GM pollen dispersal through buffers. When GM crop profitability is 5% higher than non-GM crops, growing the GM crop in fields 13, 9, and 4 is from 0.2% to 1.5% more profitable than growing the non-GM crop. Field 7 is never profitable for growing the GM crop at the profitability levels analyzed. This is because the GM field 7 is small and nearly completely surrounded by non-GM fields. With the exclusion of field 7, all fields allow for coexistence on the landscape at the 0.9% threshold when GM profitability is 20% higher than the non-GM profitability.
In general, the study shows that pollen dispersal affects the profitability of the crop whose producers do not have the property right. Those farmers without the property rights face buffer creation costs, whereas those with property rights (who do not have the obligation to create buffers) have profitability unaffected as a consequence of pollen dispersal. At the field level, the profitability of the crop whose producers do not have property rights varies according to the area of the particular field in which the crop is grown (e.g., field 14 vs. field 3 in Table 5).
A second reason for the variation in net returns at the field level is the position of fields in relation to those in which the alternative crop is grown with larger fields more easily preventing contamination. However, the data show that small fields (for instance field 10, Table 5) can sustain profitable coexistence when there are few surrounding adjacent fields that are grown with the alternative crop. Consequently, a way to reduce the economic harms of cross-contamination would be the spatial aggregation of all fields of the same type, if viable.
Size and position of fields are characteristics that influence the allocation of buffers. Even though there might be better spatial configurations that reduce cross-contamination, the field boundaries are fixed and maximum spatial efficiency cannot be achieved because fields cannot be modified in their sizes and shapes. This study shows that a constrained landscape results in lower profitability values for the crop whose farmers are not entitled with property rights compared to the situation in which the position of GM and non-GM crops is fully adjustable due to the increased requirement for buffers.
In economic terms, coexistence can only be in place when there are no incentives to switch from a production system to the other, so the spatial configuration represents an equilibrium situation in terms of net returns for both crops. However, the heterogeneity in profitability means that, when only comparing average profitability and taking into account spatially determined costs for creating buffers, there is always an incentive for some farmers to switch production system to the most profitable one. When coexistence is observed, the reasons why this does not happen can be either high costs for switching production systems, or spatially specific reasons that give farmers differential competitive advantages in the production of the GM or the non-GM crop not expressed by average market prices and average yields/production costs. While difficult to measure directly, the necessary competitive advantage can be elicited indirectly by knowing the spatial configuration of fields, the types of crops grown in each field, and average market prices, production costs, and yields for the region examined.
Reasoning in terms of equilibria, the value of the competitive advantage to prevent switching from one production system to the most profitable on average terms should equal the incentive to switch production system. At the field level, smaller fields must have a higher competitive advantage in comparison to bigger fields due to the larger incidence of the buffer cost. However, if the local competitive advantage for a field is lower than the incentive to switch to the most profitable production system, as a consequence of the switch, all the neighboring fields would be affected, potentially resulting in a domino effect leading to the disappearance of the less profitable production system on average terms.

4. Conclusions

This study relies on the assumption that the value of coexistence on a landscape is higher than the value of the uniform adoption of either GM or non-GM crops. This allows us to elicit the competitive advantage that balances the incentive to switch to the alternative crop for those required to enforce buffers.
We find that the unconstrained and homogeneous landscape requires a maximum buffer area of about 8% because buffer, non-GM, and GM areas can be moved about freely given a required amount of GM crop on the landscape. However, the constrained and heterogeneous landscape must have double digit percentages of buffer to meet the regulatory guidelines for the cross-pollination of the non-GM fields. This suggests that deviation from a homogeneous and unconstrained spatial configuration toward a heterogeneous landscape makes coexistence more difficult because there is greater economic harm to whomever is obliged to take action to prevent cross-pollination at the set threshold level. Though unrealistic, the validity of the unconstrained model lies in the fact that it can describe a case in which farmers can perfectly coordinate to reallocate their land based on the crops they grow in the most efficient way (for instance, agreeing on clustering fields of the same type in the same areas). Low or absent degrees of coordination (for example, due to high transaction costs or information asymmetries), lead to landscapes in which the degree of fragmentation is fixed (the heterogeneous unconstrained landscape in our model), and for which the land allocation is suboptimal compared to a theoretical case where coordination is promoted.
The assignment of property rights does not influence the percentage of buffer in the unconstrained and homogeneous landscape because field locations can be rearranged without cost on the landscape. However, the assignment of property rights does influence the buffer percentage on the heterogeneous landscape. In particular, the size and the position of the GM and non-GM fields influence how much buffer has to be made into the non-GM or GM fields, respectively, when the GM or non-GM producers have the property rights. When deciding on the assignment of the property rights, the spatial characteristics on the fields have consequences for the economic efficiency of the landscape.
Many important extensions to these analyses can be performed. One extension is to enlarge the landscape and look at a fewer number of fields, which may better represent the agricultural landscape in Europe. This is likely to change the magnitude of the result, but not the underlying trends. Furthermore, one approach is to identify an adequate set of indicators capable of making heterogeneity quantifiable, such as, for instance, the perimeter/area ratio or an aggregation index. Rotation of crops, maturity groups of crop varieties used, sowing time, and all the agricultural practices that have potential effects on flowering dates also have an impact on cross-contamination rates and therefore on the possibility of coexistence between GM and non-GM crops, but have not been taken into account in the simulation model which assumes these parameters are fixed to sharpen the focus on spatial variability.
The model proposed does not simulate interactions between farmers, and interactions and collective action can increase the rate of coexistence due to agreements that allow farmers to better coordinate with each other. In this perspective, the introduction of bargaining between farmers on the basis of their competitive advantage would allow for the additional exploration of the types of agreements that spatial heterogeneity would allow. The time frame is one season, and this does not allow us to consider irreversibility and potential domino effects arising from farmers switching to the alternative crop.

Acknowledgments

Financial support for the research was from personal funds and from the Division of Agriculture in the University of Arkansas.

Author Contributions

Mattia Mancini and Kent Kovacs conceived, designed, carried out the research, and wrote the manuscript; Eric Wailes and Jennie Popp contributed to the revisions and critical reviews from the draft to the final stages of the paper.

Conflicts of Interest

The authors declare no conflict of interest.

References

  1. Beckmann, V.; Soregaroli, C.; Wesseler, J. Coexistence rules and regulations in the European Union. Am. J. Agric. Econ. 2006, 88, 1193–1199. [Google Scholar] [CrossRef]
  2. Lusk, J.L.; Jamal, M.; Kurlander, L.; Roucan, M.; Taulman, L. A meta-analysis of genetically modified food valuation studies. J. Agric. Res. Econ. 2005, 30, 28–44. [Google Scholar]
  3. Costa-Font, M.; Gil, J.M.; Traill, W.B. Consumer acceptance, valuation of and attitudes towards genetically modified food: Review and implications for food policy. Food Policy 2008, 33, 99–111. [Google Scholar] [CrossRef]
  4. Fotopoulos, C.; Krystallis, A. Organic product avoidance: Reasons for rejection and potential buyers’ identification in a countrywide survey. Br. Food J. 2002, 104, 233–260. [Google Scholar] [CrossRef]
  5. Magnusson, M.K.; Arvola, A.; Hursti, U.K.; Åberg, L.; Sjödén, P. Choice of organic foods is related to perceived consequences for human health and to environmentally friendly behaviour. Appetite 2003, 40, 109–117. [Google Scholar] [CrossRef]
  6. Flood, C. Pollen drift and potential causes of action. J. Corp. Law 2002, 28, 473–497. [Google Scholar]
  7. Schenkelaars, P.; Wesseler, J. Farm-level GM Coexistence Policies in the EU: Context, Concepts, and Developments. EuroChoices 2016, 15, 5–11. [Google Scholar] [CrossRef]
  8. Beckmann, V.; Soregaroli, C.; Wesseler, J. Coexistence of genetically modified (GM) and non-modified (non GM) crops: Are the two main property rights regimes equivalent with respect to the coexistence value? In Genetically Modified Food and Global Welfare; Colin, C., Moschini, G., Sheldon, I., Eds.; Emerald Group Publishing: Bingley, UK, 2011; Volume 10, pp. 201–224. [Google Scholar]
  9. Consmüller, N.; Beckmann, V.; Petrick, M. An econometric analysis of regional adoption patterns of Bt maize in Germany. Agric. Econ. 2010, 41, 275–284. [Google Scholar] [CrossRef]
  10. Venus, T.; Punt, M.; Wesseler, J. Labelling genetically modified-free products—A case study of dairy companies in Germany. EuroChoices 2016, 15, 45–51. [Google Scholar]
  11. Quedas, F.M.; Ponte, J.; Trinidade, C.; Punt, M.; Wesseler, J. A question of segregation: ‘GM-free’ maize bread in Portugal. EuroChoices 2016, 15, 59–63. [Google Scholar] [CrossRef]
  12. Varacca, A.; Soregaroli, C. Identity preservation in international feed supply chains. EuroChoices 2016, 15, 38–43. [Google Scholar] [CrossRef]
  13. Wesseler, J. Biotechnologies and agrifood strategies: Opportunities, threads and economic implications. Bio-Based Appl. Econ. 2014, 3, 187–204. [Google Scholar]
  14. Skevas, T.; Fevereiro, P.; Wesseler, J. Coexistence regulations & agriculture production: A case study of five Bt maize producers in Portugal. Ecol. Econ. 2010, 69, 2402–2408. [Google Scholar]
  15. Groeneveld, R.; Wesseler, J.; Berentsen, P. Dominos in the dairy: An analysis of transgenic maize in Dutch dairy farming. Ecol. Econ. 2013, 86, 107–116. [Google Scholar] [CrossRef]
  16. Venus, T.; Punt, M; Dillen, K.; Wesseler, J. The costs of coexistence measures for genetically modified maize in Germany. J. Agric. Econ. 2016. [Google Scholar] [CrossRef]
  17. Demont, M.; Dillen, K.; Daems, W.; Sausse, C.; Tollens, E.; Mathijs, E. On the proportionality of EU spatial ex ante coexistence regulations. Food Policy 2009, 34, 508–518. [Google Scholar] [CrossRef]
  18. Beckmann, V.; Wesseler, J. Spatial dimension of externalities and the Coase theorem: Implications for co-existence of transgenic crops. In Regional Externalities; Heijman, W., Ed.; Springer: Berlin/Heidelberg, Germany, 2007; pp. 223–242. [Google Scholar]
  19. Wesseler, J.; Beckmann, V.; Soregaroli, C. Coexistence of GM and non-GM supply chains in the EU: Policy framework and economic aspects. In Proceedings of the International Workshop on Socioeconomic Impacts of Genetically Modified Crops, Seville, Spain, 23–24 November 2011; pp. 75–79.
  20. Weekes, R.; Allnutt, T.; Boffey, C.; Morgan, S.; Bilton, M.; Daniels, R.; Henry, C. A study of crop-to-crop gene flow using farm scale sites of fodder maize (Zea mays L.) in the UK. Transgenic Res. 2007, 16, 203–211. [Google Scholar] [CrossRef] [PubMed]
  21. Munro, A. The spatial impact of genetically modified crops. Ecol. Econ. 2008, 67, 658–666. [Google Scholar] [CrossRef] [Green Version]
  22. Ceddia, M.G.; Bartlett, M.; de Lucia, C.; Perrings, C. On the regulation of spatial externalities: Coexistence between GM and conventional crops in the EU and the ‘newcomer principle’. Aust. J. Agric. Resour. Econ. 2011, 55, 126–143. [Google Scholar] [CrossRef]
  23. Belcher, K.; Nolan, J.; Phillips, P.W. Genetically modified crops and agricultural landscapes: Spatial patterns of contamination. Ecol. Econ. 2005, 53, 387–401. [Google Scholar] [CrossRef]
  24. Perry, J.N. Sensitive dependencies and separation distances for genetically modified herbicide-tolerant crops. Proc. Biol. Soc. 2002, 269, 1173–1176. [Google Scholar] [CrossRef] [PubMed]
  25. Lavigne, C.; Klein, E.; Vallée, P.; Pierre, J.; Godelle, B.; Renard, M. A pollen-dispersal experiment with transgenic oilseed rape. Estimation of the average pollen dispersal of an individual plant within a field. Theor. Appl. Genet. 1998, 96, 886–896. [Google Scholar] [CrossRef]
  26. University of Arkansas Division of Agriculture Research and Extension. 2014 Crop Enterprise Budgets for Arkansas Field Crops Planted in 2014. December 2013. Available online: http://www.uaex.edu/farm-ranch/economics-marketing/docs/Budgets%202014_C.pdf (accessed on 9 August 2016).
Figure 1. Spatial representation of fields from the Voronoi segmentation.
Land 05 00033 g001
Figure 2. Amount of buffer and landscape profit for +10% and −10% non-GM per acre profitability compared to GM when GM has the property rights (A) and for +10% and −10% GM per acre profitability compared to non-GM when non-GM has the property rights (B).
Land 05 00033 g002
Figure 3. +10% and −10% non-GM profitability compared to GM when GM has the property rights (graph on the left) and +10% and −10% GM profitability compared to non-GM when non-GM has the property rights (graph on the right).
Land 05 00033 g003
Figure 4. GM, non-GM fields, and buffers. GM producers have the property rights, and buffers are created in the non-GM fields. From top to bottom and from left to right are the 5% (A), 1.5% (B), 0.9% (C), and 0.25% (D) thresholds. GM fields are represented with the light grey patterns, buffers are the dark-grey patterned areas, and white areas are the non-GM fields.
Land 05 00033 g004
Figure 5. GM, non-GM fields, and buffers. Non-GM producers have the property rights, and buffers are created in the GM fields. From top to bottom and from left to right are the 5% (A), 1.5% (B), 0.9% (C), and 0.25% (D) thresholds. GM fields are represented with the light grey patterns, buffers are the dark-grey patterned areas, and white areas are the non-GM fields.
Land 05 00033 g005
Table 1. Parameters defining the spatial baseline of analysis. (GM, genetically modified.)
ParameterValue
Cell side length (m)25
Cell size (m2)625
Dispersal parameter K455
Dispersal parameter α0.125
Threshold of cross-pollination (%)0.9
Baseline economic parameters for GM, Non-GM, and Buffer
Corn price ($/t)271.25
Corn yield (t/ha)11
Corn production costs ($/ha)1,498.78
Profit ($/ha)1,484.97
Table 2. Parameters defining the homogeneous and unconstrained landscape.
ParameterValue
Number of cells s225
Total surface t (ha)14
Number of fields2
Number of GM fields1
Number of no-GM fields1
Table 3. Parameters defining the heterogeneous landscape.
ParameterValue
Number of cells900
Total surface (ha)56
Number of fields15
Number of GM fields8
GM area (%)55%
Number of no-GM fields7
No-GM area (%)45%
Table 4. Percentage variation in profits for the landscape relative to the baseline for alternative thresholds of cross-pollination when GM producers have the property rights and when the non-GM producers have the property rights. The European Union (EU) regulatory threshold of cross-pollination is 0.9%.
GM with Property Rights
Profitability Non-GMThresholds of Cross-Pollination (%)
5.00%2.00%1.50%1.00%0.90%0.50%0.2%0.10%
0.0%0.0%0.0%0.0%0.0%0.0%0.0%0.0%0.0%
5.0%−1.9%−3.3%−3.8%−4.6%−4.8%−5.7%−6.5%−7.6%
10.0%0.2%−1.3%−1.8%−2.7%−2.9%−3.8%−4.7%−5.8%
15.0%2.2%0.6%0.1%−0.8%−1.0%−2.0%−2.9%−4.1%
20.0%4.3%2.6%2.1%1.2%1.0%0.0%−1.0%−2.2%
25.0%6.3%4.6%4.0%3.0%2.8%1.8%0.7%−0.5%
30.0%8.4%6.6%6.0%5.0%4.8%3.7%2.6%1.3%
Non-GM with Property Rights
Profitability GMThresholds of Cross-Pollination (%)
5.00%2.00%1.50%1.00%0.90%0.50%0.25%0.10%
0.0%0.0%0.0%0.0%0.0%0.0%0.0%0.0%0.0%
5.0%−1.3%−2.2%−2.7%−3.3%−3.4%−4.4%−5.3%−6.2%
10.0%1.2%0.2%−0.4%−1.0%−1.1%−2.2%−3.2%−4.3%
15.0%3.5%2.5%1.9%1.2%1.1%−0.1%−1.1%−2.3%
20.0%5.9%4.8%4.1%3.4%3.3%2.0%0.9%−0.4%
25.0%8.3%7.1%6.4%5.6%5.5%4.1%2.9%1.6%
30.0%10.7%9.4%8.7%7.8%7.7%6.2%4.9%3.5%
Table 5. Percentage profits relative to the baseline non-GM crop profits at the field level as a function of increasing profitability for the non-GM crop in comparison to the GM crop and thresholds of cross-pollination when GM producers have the property rights. There is heterogeneity in the profits of non-GM fields because heterogeneous amounts of buffer are created in the non-GM fields. The non-GM fields include 1, 3, 6, 8, 10, 12, and 14. The economic unsuitability of a field for the non-GM crop (i.e., losses due to the buffer) is represented by dashes in the table.
Non-GM ProfitabilityThreshold of Cross-PollinationField
1368101214
10.0%5.00%0.7%----1.6%1.8%--3.5%
2.00%--------1.2%--1.7%
1.50%------------1.0%
1.00%------------1.0%
0.90%--------------
0.50%--------------
0.25%--------------
0.10%--------------
15.0%5.00%5.2%--3.6%6.2%6.4%0.4%8.2%
2.00%1.0%--0.1%1.9%5.9%--6.3%
1.50%0.7%----0.7%4.4%--5.6%
1.00%0.7%----0.7%4.4%--5.6%
0.90%--------0.6%--3.2%
0.50%------------0.9%
0.25%--------------
0.10%--------------
20.0%5.00%9.8%1.1%8.1%10.9%11.0%4.8%12.9%
2.00%5.4%--4.4%6.3%10.5%--10.9%
1.50%5.0%--2.8%5.1%9.0%--10.2%
1.00%5.0%--2.8%5.1%9.0%--10.2%
0.90%2.3%----3.5%5.0%--7.6%
0.50%------0.5%3.0%--5.3%
0.25%--------2.5%--3.3%
0.10%--------1.0%--1.0%
25.0%5.00%14.4%5.3%12.6%15.5%15.7%9.1%17.6%
2.00%9.8%--8.8%10.7%15.1%2.0%15.5%
1.50%9.4%--7.1%9.5%13.5%--14.8%
1.00%9.4%--7.1%9.5%13.5%--14.8%
0.90%6.6%--3.7%7.8%9.3%--12.1%
0.50%3.8%--2.1%4.7%7.3%--9.6%
0.25%2.0%----1.2%6.7%--7.6%
0.10%0.3%------5.2%--5.2%
30.0%5.00%19.0%9.5%17.2%20.1%20.3%13.5%22.3%
2.00%14.2%1.3%13.2%15.2%19.7%6.1%20.2%
1.50%13.8%--11.4%13.9%18.0%3.8%19.4%
1.00%13.8%--11.4%13.9%18.0%3.8%19.4%
0.90%10.9%--7.8%12.1%13.7%1.5%16.6%
0.50%7.9%--6.2%8.9%11.6%0.1%14.0%
0.25%6.1%--2.6%5.3%11.0%0.1%11.9%
0.10%4.3%----1.5%9.4%--9.4%
Table 6. Percentage profits relative to the baseline GM crop profits at the field level as a function of increasing profitability for the GM crop in comparison to the non-GM crop and thresholds of cross-pollination when non-GM producers have the property rights. There is heterogeneity in the profits of GM fields because heterogeneous amounts of buffer are created in the GM fields. The GM fields include 2, 4, 5, 7, 9, 11, 13, and 15. The economic unsuitability of a field for the GM crop (i.e., losses due to the buffer) is represented by dashes in the table.
GM ProfitabilityThreshold of Cross-PollinationField
24579111315
10.0%5.00%--6.1%----4.7%0.7%5.8%4.2%
2.00%--3.8%----3.7%--5.8%3.7%
1.50%--3.4%----1.6%--4.0%3.7%
1.00%--3.4%----1.6%--4.0%3.7%
0.90%--3.0%----0.1%--2.8%3.1%
0.50%--1.8%----0.1%--1.6%--
0.25%------------1.6%--
0.10%----------------
15.0%5.00%2.7%10.8%1.9%--9.3%4.9%10.4%8.7%
2.00%0.7%8.2%----8.2%2.5%10.4%8.2%
1.50%--7.9%----6.0%1.3%8.5%8.2%
1.00%--7.9%----6.0%1.3%8.5%8.2%
0.90%--7.4%----4.2%--7.2%7.5%
0.50%--6.2%----4.2%--5.9%3.7%
0.25%--4.1%----2.5%--5.9%1.9%
0.10%--2.5%--------3.7%0.9%
20.0%5.00%6.8%15.5%5.9%--13.9%9.2%15.1%13.2%
2.00%4.7%12.7%3.0%--12.7%6.5%15.1%12.7%
1.50%3.8%12.3%2.1%--10.3%5.2%13.0%12.7%
1.00%3.8%12.3%2.1%--10.3%5.2%13.0%12.7%
0.90%2.4%11.8%1.2%--8.4%2.4%11.6%12.0%
0.50%--10.5%----8.4%--10.2%7.9%
0.25%--8.2%----6.6%--10.2%5.9%
0.10%--6.5%----3.0%--7.9%4.8%
25.0%5.00%10.8%20.2%9.9%--18.4%13.4%19.8%17.7%
2.00%8.6%17.2%6.8%--17.2%10.6%19.8%17.2%
1.50%7.7%16.8%5.9%--14.6%9.2%17.5%17.2%
1.00%7.7%16.8%5.9%--14.6%9.2%17.5%17.2%
0.90%6.2%16.2%4.9%--12.6%6.1%16.1%16.4%
0.50%1.4%14.8%----12.6%3.1%14.5%12.0%
0.25%--12.4%----10.6%0.6%14.5%9.9%
0.10%--10.6%----6.8%--12.0%8.7%
30.0%5.00%14.9%24.9%13.9%--23.0%17.6%24.4%22.2%
2.00%12.5%21.7%10.6%--21.7%14.6%24.4%21.6%
1.50%11.5%21.2%9.6%--18.9%13.1%22.0%21.6%
1.00%11.5%21.2%9.6%--18.9%13.1%22.0%21.6%
0.90%9.9%20.6%8.6%--16.8%9.9%20.5%20.8%
0.50%4.8%19.1%2.8%--16.8%6.7%18.8%16.1%
0.25%2.4%16.6%----14.7%4.0%18.8%13.9%
0.10%--14.6%----10.5%1.2%16.2%12.7%

