Article

The Effect of Landscape Composition on the Abundance of Laodelphax striatellus Fallén in Fragmented Agricultural Landscapes

1
Institute of Remote Sensing and Earth Science, Hangzhou Normal University, Hangzhou 311121, China
2
State Key Laboratory of Rice Biology/Institute of Insect Sciences, Zhejiang University, Hangzhou 310058, China
3
Center for Global Change and Earth Observation, Michigan State University, East Lansing, MI 48823, USA
*
Authors to whom correspondence should be addressed.
Submission received: 27 June 2016 / Revised: 12 September 2016 / Accepted: 18 October 2016 / Published: 28 October 2016

Abstract

:
The spatial distribution of crop and non-crop habitats over segmented agricultural landscapes could be used as a means to reduce insect pest populations. Seven land cover categories such as wheat, rapeseed, vegetable, water, built-up, paved road, and unsurfaced road were extracted from GeoEye satellite images dating from late May to late June of 2010. Three diversity metrics and three evenness metrics were estimated from the abovementioned land cover categories for quantifying the effect of landscape composition on nymphal and adult Laodelphax striatellus Fallén. The degree of correlation between the proportion of crop cover and adjacent spatial scales (r: 0.651–0.983) was higher than the correlation between the proportion of crop cover and nonadjacent spatial scales (r: −0.255–0.896). While the degree of correlation between diversity indices and abundance of L. striatellus decreased gradually when the spatial scales varied from large (>100 m radius buffer) to small (<100 m). Our study suggests that when using natural biological pest control and ecological engineering practices in the rural-urban fringes, the crop field’s width should be less than 200 m and increasing vegetation diversity within such a scale will be helpful to regulate the insect pests under a certain density.

1. Introduction

Human activities have modified landscape characteristics (e.g., land cover types and spatial configurations) through swift urbanization and farming practices across the world [1,2,3]. Studies concerning these changes, however, have been conducted mostly in developed and industrialized countries, since post-industrial age governments pay more attention to ecological and environmental issues in the developed countries than those from the developing countries. Additionally, human activities affect landscape characteristics at a faster rate in prosperous developing countries than in developed countries. For example, landscape heterogeneity is more diverse in the rural-urban fringe region than in a homogenized, agricultural field and urban area due to different biotic and abiotic factors [4]. More so, a heterogeneous and fragmented agricultural landscape can affect forms of species richness and abundance in developing countries as well as developed ones. In this study, we investigate what effects that landscape composition—specifically fragmented agricultural landscape in Asia—have on the insect species Laodelphax striatellus Fallén (small brown planthopper) during its two stages: nymph and adult.
Intensified agricultural landscapes consist of a mosaic of habitat patches, which are characterized by heterogeneity and fragmentation [5,6]. This matrix plays a key role in the flux of materials, energy, and species through abiotic (i.e., wind, water, soil) and biotic (viz., mobile animals, host plants, and human beings) media. While landscape heterogeneity affects both non-crop habitats and crop habitats in ecologically, many studies have solely investigated non-crop habitats such as fields, woods, hedgerows, permanent grasslands, and others in Europe or North America [3,7,8], and have only considered these effects on larger herbaceous insects (e.g., butterfly, spider). In contrast, there are few studies that have focused on the effects that landscape heterogeneity has had on smaller-sized herbaceous insects in Asian high-intensity agricultural landscapes. Because of the many differences in evolutionary history, meteorology, geology, and intensive human-land conflicts [4], the local species richness of many organisms vary between Asia and other regions. Overall, species richness of global croplands is under tremendous threat from nearly 60 percent of the global population (i.e., 7.4 billion in 2005 year) due to limited food supplies. Also, according to a current study [4], forms of species richness and abundance across scales may be quite different in fragmented and heterogeneous agricultural landscapes.
Insects are particularly sensitive to environmental changes and are among the first to indicate environmental change in their population, making them prime subjects to study landscape effects on species composition. Then local habitat composition determines local species composition and the succession of life [9]. Furthermore, insects have a variety of life cycles in which the various stages are adapted for different purposes, whether for utilizing a different food source or even different habitats. Unfortunately, current studies have narrowed their focus to one stage of a species when discussing the effect and role of landscapes in its population dynamics. Insects, for example, are strongly affected by habitat compositions and have a variety of life cycles and stages that are adapted for different purposes, whether for food sources or even different habitats, yet studies still narrow their focus to one stage. Overgaard et al. [10] concluded that water velocity was the most important factor explaining the density of nymphal An. minimus, while in another research project Overgaard et al. [11] investigated the effect of landscape structure on the density and diversity of the anopheline mosquito adult in northern Thailand. This lack of research exemplifies the need to concentrate on the interaction between a landscape and an insect species at multiple stages.
Among all the Delphacidae species present in Asian rice crops (Oryza sativa L.), only the L. striatellus can overwinter in subtropical and temperate regions [12]. L. striatellus feeds by inserting its stylet into the vascular tissue of leaf blades and sheath to ingest the sap, which results in crop yield loss and quality reduction. In addition, this insect also transmits multiple viral diseases, including the rice stripe virus (RSV), rice black-streaked dwarf virus (RBSDV), wheat rosette stunt virus (WRSV), and maize rough dwarf virus (MRDV) [13]. As an herbivorous insect, it feeds many plants such as both the Gramineae family and the Cruciferae family, the former includes rice (O. sativa), wheat (Triticum aestivum L.), barley (Hordeum vulgare L.), Amur foxtail (Alopecurus aequalis), Barnyardgrass (Echinochloa crus-galli), and club head cutgrass (Leersia hexandra); and the latter includes rapeseed (Brassica napus) [14]. These crops are widely popular in Asia, especially in southern and eastern China; and since the major host of L. striatellus is O. sativa in summer, diseases are easily transferred to other crops and grasses when autumn comes [14]. Moreover, trophic and mating behaviors of L. striatellus can only be performed in its host.
Like other Delphacidae species, L. striatellus is dimorphic, with a fully winged macropterous form and a truncate-winged brachypterous form. The macropterous L. striatellus are potentially migratory, capable of colonizing new habitats while searching for food, while the latter is flightless [15]. Generally speaking, macropters L. striatellus routinely fly within one small patch or habitat, and daily express behaviors such as foraging, evading predators, mating, etc. [15]. In order to search for adequate host plants across a large area, the long migration of the L. striatellus relies on wind streams, as its flying ability is weak [15]. Moreover, there are three stages the life cycle of L. striatellus: egg, nymph, and adult. The insect at the latter two stages can harm host plants by puncturing it and consuming its sap. While previous studies have shown that there is a correlation between the choice of plants L. striatellus utilizes and the density of eggs laid and hatched, few studies have concentrated on how the structure and composition of agricultural landscapes affect the abundance of nymph and adults.
In numerous literatures of agricultural landscape pattern analysis, the diversity metrics always were extracted to measure and quantify the effect of landscape heterogeneity on insect abundance at landscape or class level [16,17,18]. For example, Shannon’s diversity index (SHDI) was used to compare different landscapes or the same landscape at different sampling dates in the literature of Grilli [19] which quantified the role of landscape structure on the abundance of a disease vector planthopper. Simpson’s diversity index (SIDI) is another popular diversity measuring tool like SHDI, but the current research indicated that SIDI was less sensitive to rare landscape types than SHDI [19]. Furthermore, the modified Simpson’s diversity index (MSIDI) was developed to eliminate the intuitive interpretation of SIDI and increase SIDI sensitivity to rare landscape types [20]. The other aspect of landscape diversity is measured to assess landscape composition by evenness: the distributions of area among patch types [20]. Those are Shannon’s evenness index (SHEI), Simpson’s evenness index (SIEI), and modified Simpson’s evenness index (MSIEI).
In this study, we describe the structural composition of 77 total sampling plots—which were distributed across five study sites—through GeoEye satellite images and then assess the different land-cover types (e.g., crop habitat vs. non-crop habitat) at four spatial scales: 50 m, 100 m, 150 m, and 200 m radii buffer zones from the center of the sampling plots. The variation in L. striatellus’ population at these two stages—nymph and adult—were collected in each sampling plot are analyzed in relation to land-cover types. Six diversity metrics (SHDI, SIDI, MSIDI, SHEI, SIEI, and MSIEI) were calculated from land use and land cover map which was extracted from satellite images. The goal of this study was that to apply these indices for examining whether the abundance of nymphal and adult L. striatellus are similarly influenced by landscape elements at different spatial scales across a segmented agricultural area.

2. Materials and Methods
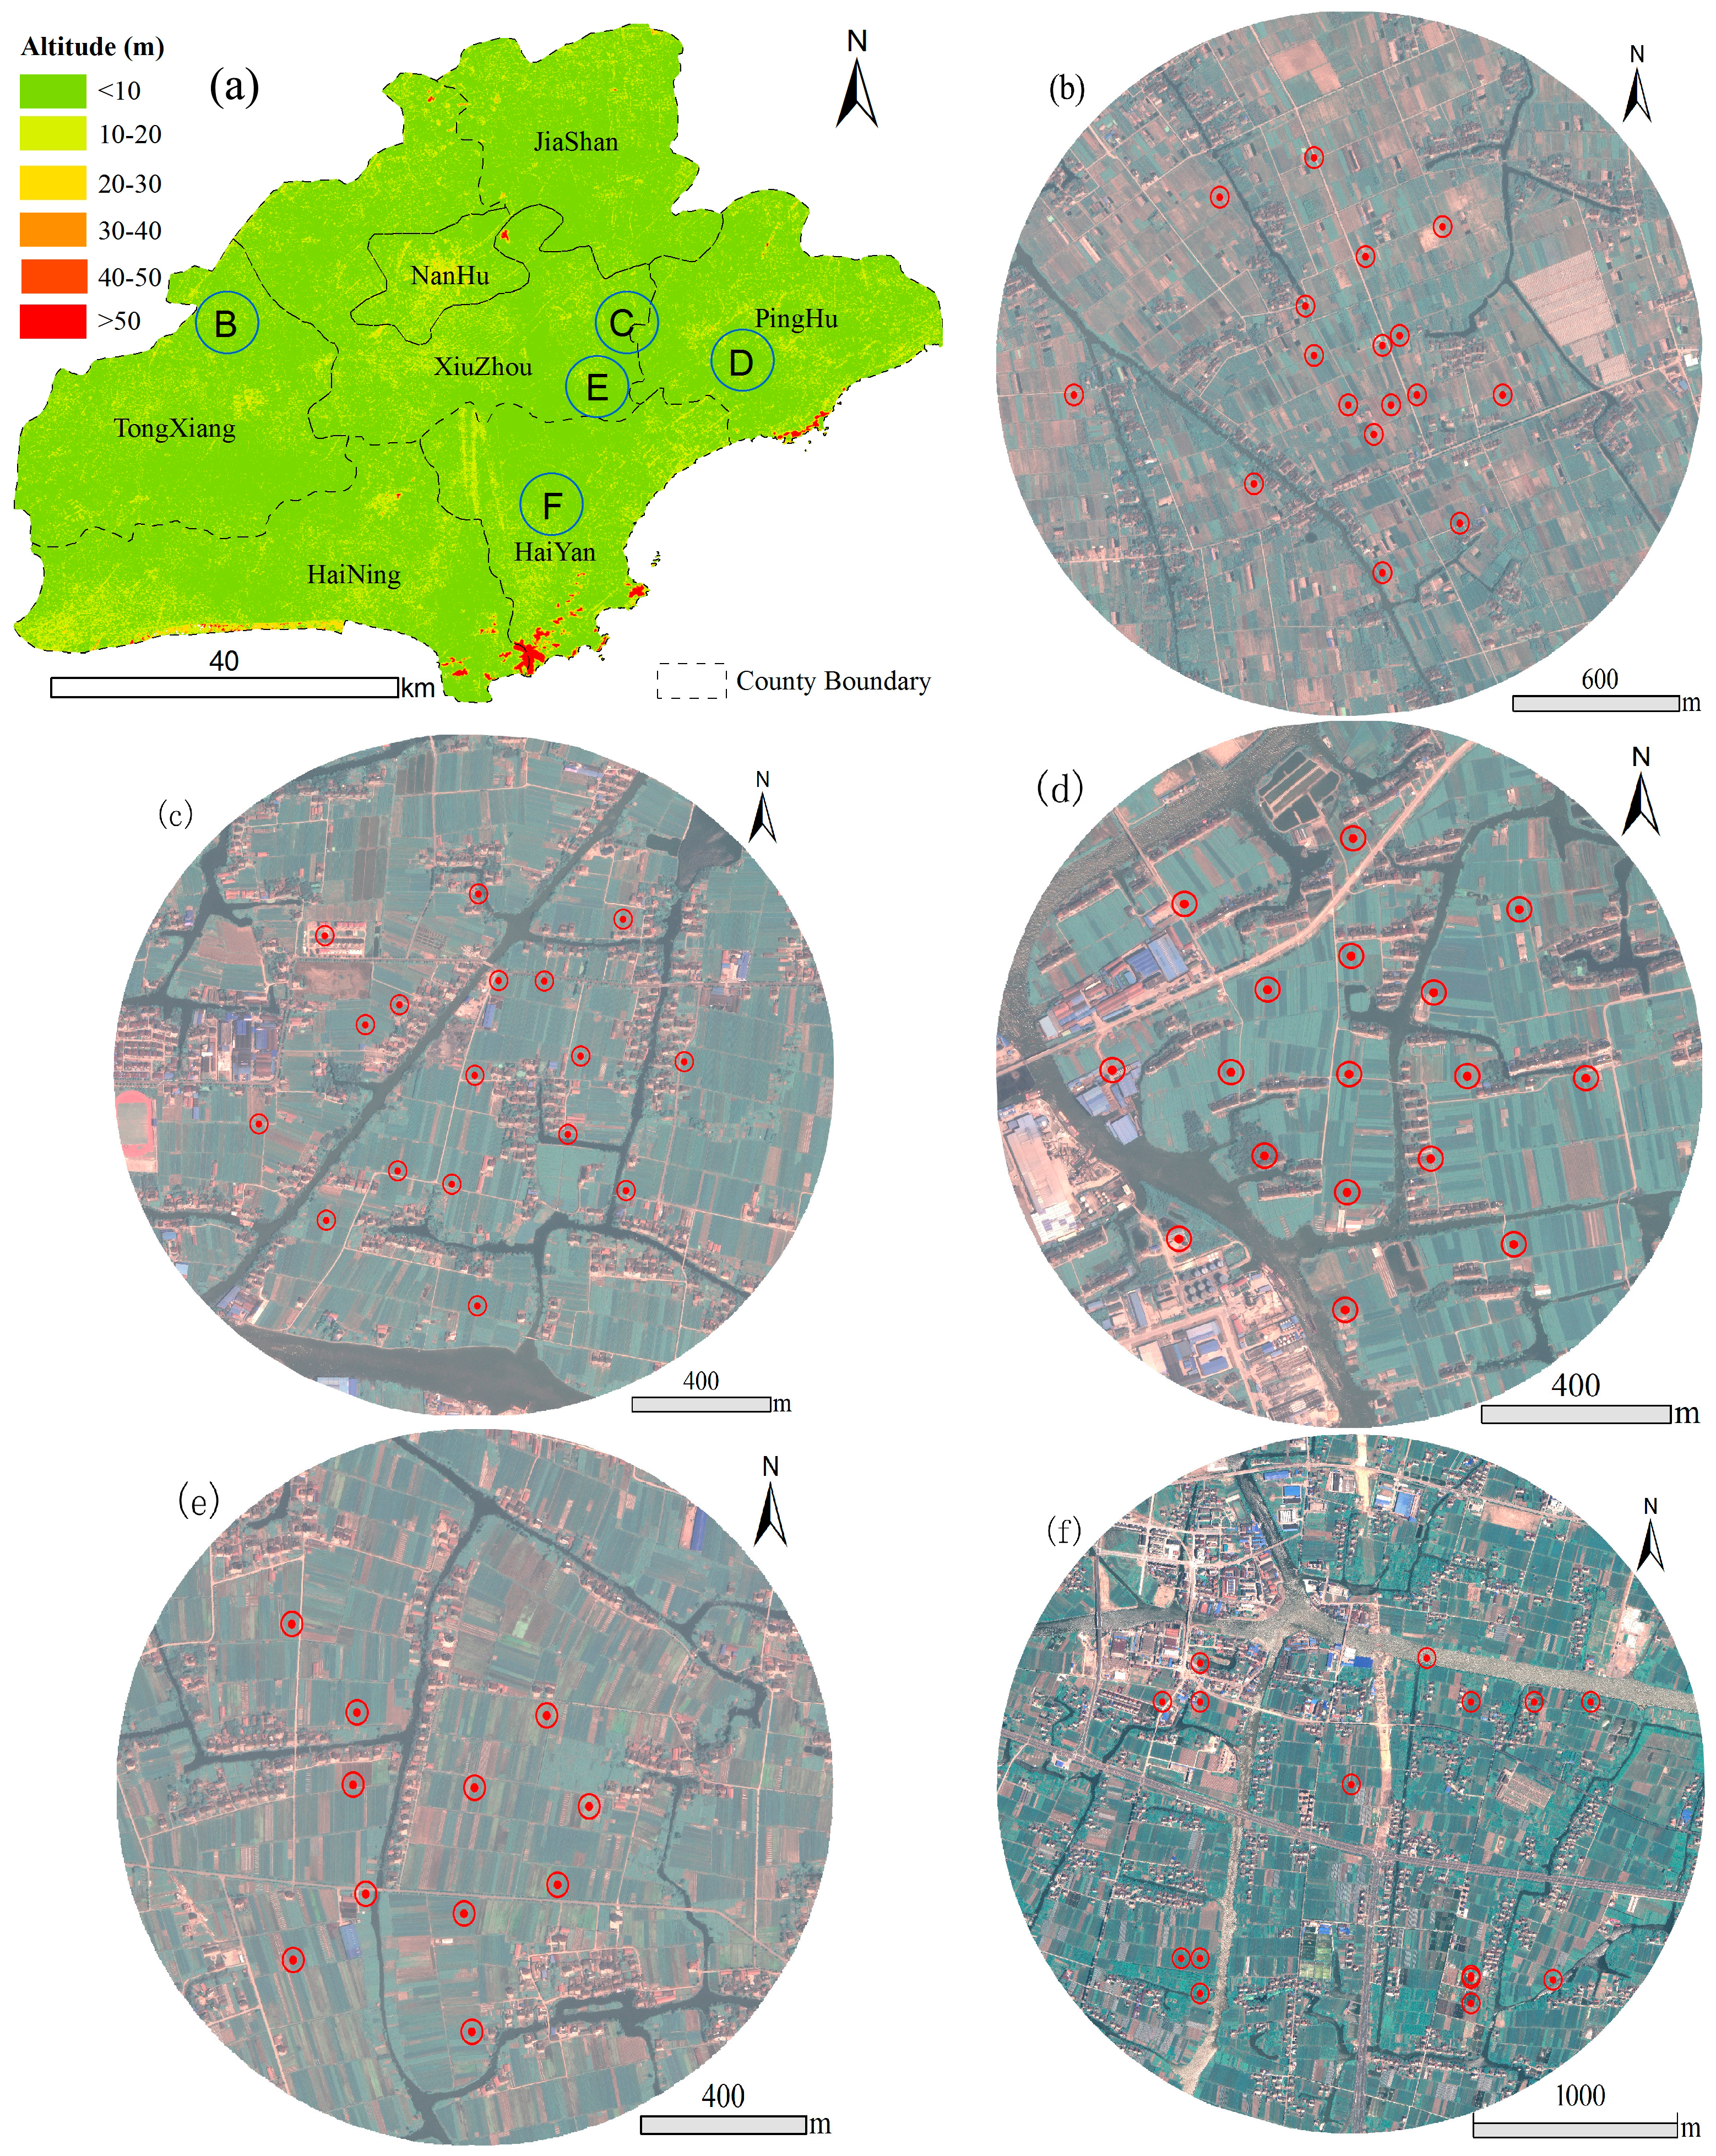
2.1. Study Site

The study was conducted within a rural-urban fringe in the Jiaxing Prefecture, Zhejiang Province, East China (30°21′–31°2′ N and 120°18′–121°16′ E). The study area’s topography is relatively flat with an average elevation of 8 m above sea level (Figure 1). This region has a subtropical monsoon climate, with rainfall season falling between mid-May and late September and with an annual precipitation of 1170 mm. The monthly mean temperature varies between 4 °C and 28 °C, according to the prefecture’s official meteorological website [21]. The warm weather allows L. striatellus to over winter in litters, stables, and straw stacks and survives throughout the whole year, even in particularly cold winters. In this region, they have no need to migrate for survival.
Diverse land use including residential, industrial, roads, streams and canals, and groves and cropland characterize the landscape. In addition, the landscape has a complex, hybrid characterization of spatial fragmentation and a functional heterogeneity in size and configuration. An important part in the agricultural routine of a landscape is crop rotation. In the winter-spring season, crops include barley (Hordeum vulgare L.), wheat (Triticum aestivum L.), rapeseed (Brassica napus), and commercial vegetables (e.g., Brassica oleracea, Lilium candidum). In the summer-autumn season, the crop previously grown is rotated with rice (Oryza sativa L.). Among these crops, barley, wheat, rapeseed, and rice are the main plants for L. striatellus. However, a great deal of agricultural land has been converted into residential and industrial after undergoing rapid urbanization for nearly 40 years [22], resulting in small and fragmented landscapes.
We were permitted to conduct research in all study locations that did not include endangered or protected species by local government officers Xueming Zhong and Jinliang Zhu without further limitations. Collaborative efforts were made between these officers and the first and last two authors to conduct the experiment.

2.2. Survey of Laodelphax striatellus

Two out of three insect stages of the L. striatellus were collected: nymph and adult. It is at two stages that the L. striatellus is capable of either jumping or flying around adjacent host plants. Moreover, their limited movement influences them to choose food within the agricultural landscape [12]. We did not directly measure their ability to move, but instead calculated the agricultural landscape metrics to assess the movement ability difference. Individuals were collected in five study sites (Figure 1) from late May to late June 2010. There was one insect pest observing state which was located in the center of each study site. The original plan was that there were 17 sampling plots for each study site. In fact, however, there were 15 and 11 sampling plots for XinHuang and HaiYan, respectively. No pesticide was applied in all the five study sites.
Insect sampling was performed on plot by using an enamel plate (measuring 33 cm wide by 45 cm long). L. striatellus individuals were put into plastic tubes with hydrous ethanol (about 95% ethanol and 5% water) and transported to the laboratory where they were identified referred to by Cheng et al. [23]. There were five sample points taken from each of the 77 total plots. One point was located in the center of each plot. The other four points were around the center position in different spatial orientation: due north, east, south, and west. The sample points were at least 1 m away from field edge to avoid any potential edge effect [3], which was distributed within a circular shape with 10 m or less distance between each sampling point. The collections were then divided into nymph and adult in order to explore how the respective fragmented agricultural landscape affected them individually. The sum of nymphal L. striatellus in each sampling plot was counted together, and the same was true for adults.

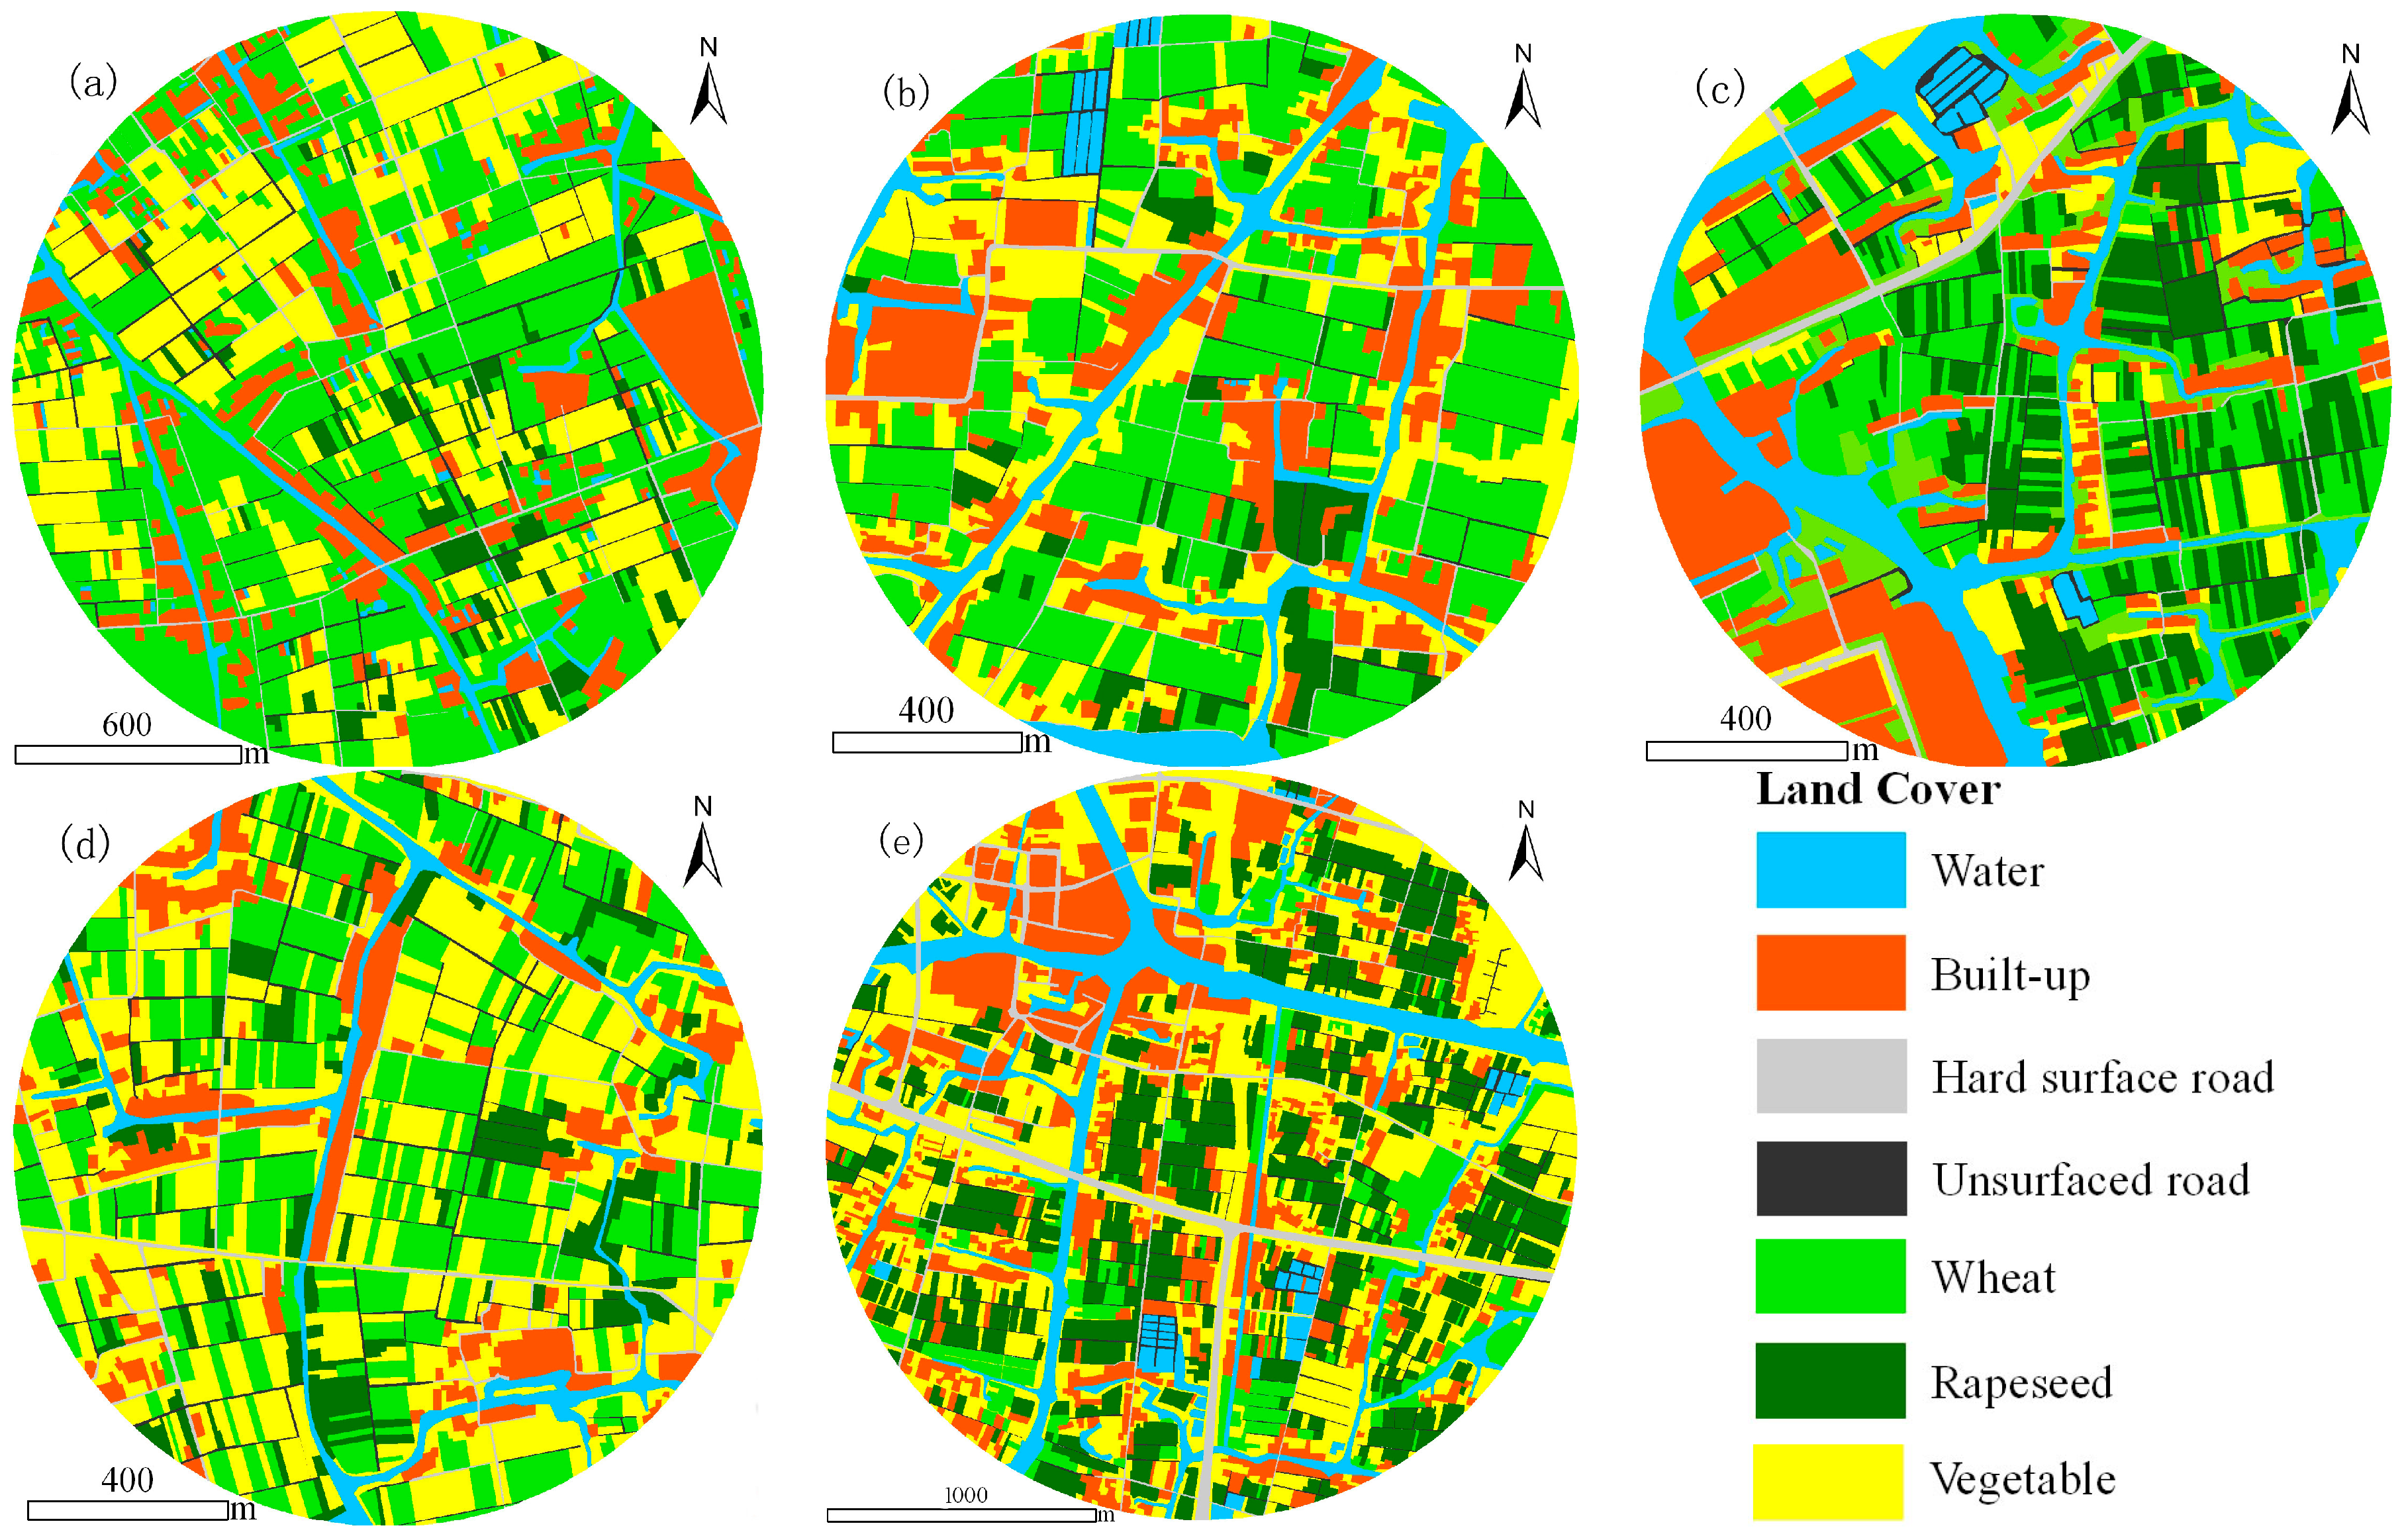
2.3. Assessment of Host Patches

The spatial position of the sampling points was recorded using a conventional GPS receiver with a horizontal resolution of 2 m. The geometrical center of the five sampling points for each plot was calculated in ArcGIS 10.0 software (ESRI, Redlands, CA, USA, 2010). The geometrical center of each study site was also calculated to create a vector map and clip satellite images before further analysis. The distance between each sampling plot and the boundary of the vector map is not less than 250 m.
The GeoEye-1 satellite has a panchromatic band (450–900 nm) with a 41 cm spatial resolution and four multispectral bands with a 1.65 m spatial resolution at nadir: blue (450–520 nm), green (520–600 nm), red (625–695 nm), and near-infrared (760–900 nm). In this study, the imaging date of the GeoEye-1 images for Site 5 of HaiYan County is 12 May 2010; the rest of four sites (i.e., PingHu, TongXiang, XinFeng, and XinHuang) were taken on 1 May 2010. Among these five study sites, Site 2 and Site 4 were located in the same scene of GeoEye-1. A total of four GeoEye-1 scenes were applied to estimate the agricultural landscape elements, as referred to in the U.S. Geological Survey land use/land-cover classification systems, for use with remote sensor data [24]. We obtained the elements of the agricultural landscapes based on the following four steps.
First, all four GeoEye-1 image was georeferenced with the latitude/longitude reference system and then atmospherically and radiometrically corrected. Eastman [25] referred to the detailed image correction procedures. Second, each GeoEye-1 scene was cut via the corresponding vector map of the five study sites. Third, the true color composition from the three multispectral bands (red, green, and blue) was merged with a panchromatic band using the Brovey sharpening technique to create a higher resolution, color normalized, and sharpened image with pixels at 41 cm × 41 cm. The nearest neighbor resampling method was chosen during the image sharpening process. The pan-sharpened multispectral images have better quality and more detail than raw panchromatic and multispectral images. Finally, based on intensive field inspections, we manually digitalized the pan-sharpened multispectral images through a visual interpretation technique based on a series of fundamental interpretation elements such as location situation, tone and color, size, shape, texture, pattern, and association [26]. Seven general land cover types were interpreted, including: wheat, rapeseed, other vegetables (e.g., Allium sativum), water, paved road (made by cement or asphalt), unsurfaced road (made by soil), and built-up (Figure 2). Additionally, in order to analyze the spatial distribution of L. striatellus in a fragmented agricultural landscape, the seven land cover types were simplified into two categories: crop and non-crop habitats. The former was the host of L. striatellus, which was composed of wheat, rapeseed, other vegetables, and unsurfaced road. The latter is none of the host of L. striatellus, which included water, paved road, and built-up. The first three steps were performed using ENVI (Version 5.1) and the last by using ArcGIS 10.0 (ESRI, Redlands, CA, USA, 2010).

2.4. Landscape Metrics

Each of the agricultural plots, which corresponded to the five sampling fields, was identified on the map of land cover types using geographic coordinates from a GPS receiver. Landscape metrics were calculated in concentric ring buffers with a center radius of 50, 100, 150, and 200 m in each sampling plot using ArcGIS 10.0 (ESRI, 2010). The maximal radius was set at 200 m to avoid artificially large correlations due to overlapping buffers [27]. Landscape composition and configuration can affect planthopper dynamics independently and interactively [19,28,29,30,31], the measures of landscape composition and configuration would be calculated in this study.
Six landscape indices were calculated based on the land-use land cover maps for measuring landscape composition, configuration and diversity in this study (Figure 2). They were SHDI, SIDI, MSIDI, SHEI, SIEI, and MSIEI. All the landscape metrics were estimated using FRAGSTATS 4.2 software; their computational formulae are referenced the literature of McGarigal et al. [20].

2.5. Data Analysis

To determine whether there is a significant difference between a nymph and an adult, a paired sample t-test was used in this study. We kept in mind that the flying capability of an adult is greater than that of nymph, so their population could be different on a small scale.
To test the significant differences between proportions of agricultural land and the total buffer area among different spatial scales (i.e., radii of buffer zone), we ran a one-way ANOVA test. Moreover, a Pearson's correlation was made to test how strongly the relationship between proportion of agricultural land sand total buffer area among different spatial scales and the relationship between proportion of agricultural lands and landscape composition of a segmented agricultural landscape have on the abundance of L. striatellus. All the statistical analyses were implemented in the Statistical Package for the Social Sciences (SPSS 18.0).

3. Results

3.1. Density of Laodelphax striatellus

A total of 3127 nymphal and 1211 adult individuals were collected in 2010 at five study sites (Table 1). However, the density of L. striatellus in nymphal or adult stage varied by study site. The total nymphs at the five study sites were 2.58 times as many as the total adult population, and their ratios were over 2 except in the site of XinHuang. Consequently, results presented in this study show significant differences in mean densities between nymph and adults (Sig. value < 0.05, Table 1). It cannot be concluded that the nymph population will be high if the adult populations is high in small segmented agricultural landscapes.

3.2. Statistical Measures of Crop-Habitat

Estimations from GeoEye-1 satellite images showed that there was a large variation in most of the digitalized land-use and crop cover variables among the rural-urban fringe region investigated (Table 2; Figure 2). The crop cover varied from 4.2% to 100% at the 50 m radius buffer zone in the site of XinFeng. Moreover, the proportions of crop cover obviously decreased with the increase of the spatial scale (Table 2). When taking the 15 sampling plots from the site of HaiYan County as an example, the average proportion of crop cover was 73.1% at the local scale (with 50 m radius buffer), 70.3% at 100 m, 66.5% at 150 m, and only 65.6% at 200 m radii buffers (Table 2).
All five study sites were located in the rural-urban fringe regions, and their characteristics are segmented and heterogeneous. There were notably stronger positive relationships (ρ < 0.001) between the proportions of crop cover at 50 m radius buffer and 100 m radius buffer for all five study sites being the exceptions. There were also strong positive relationships (ρ < 0.01) between the proportions of crop cover at 50 m radius buffer and 150 m radius buffer for XinFeng, PingHu, and HaiYan, but not in TongXiang and XinHuang. Lastly, there were weak relationships (ρ > 0.05) between the proportions of crop cover at 50 m radius buffer and 200 m buffer for TongXiang and XinHuang. Similar trends existed in the other adjacent spatial scales (Table 3).

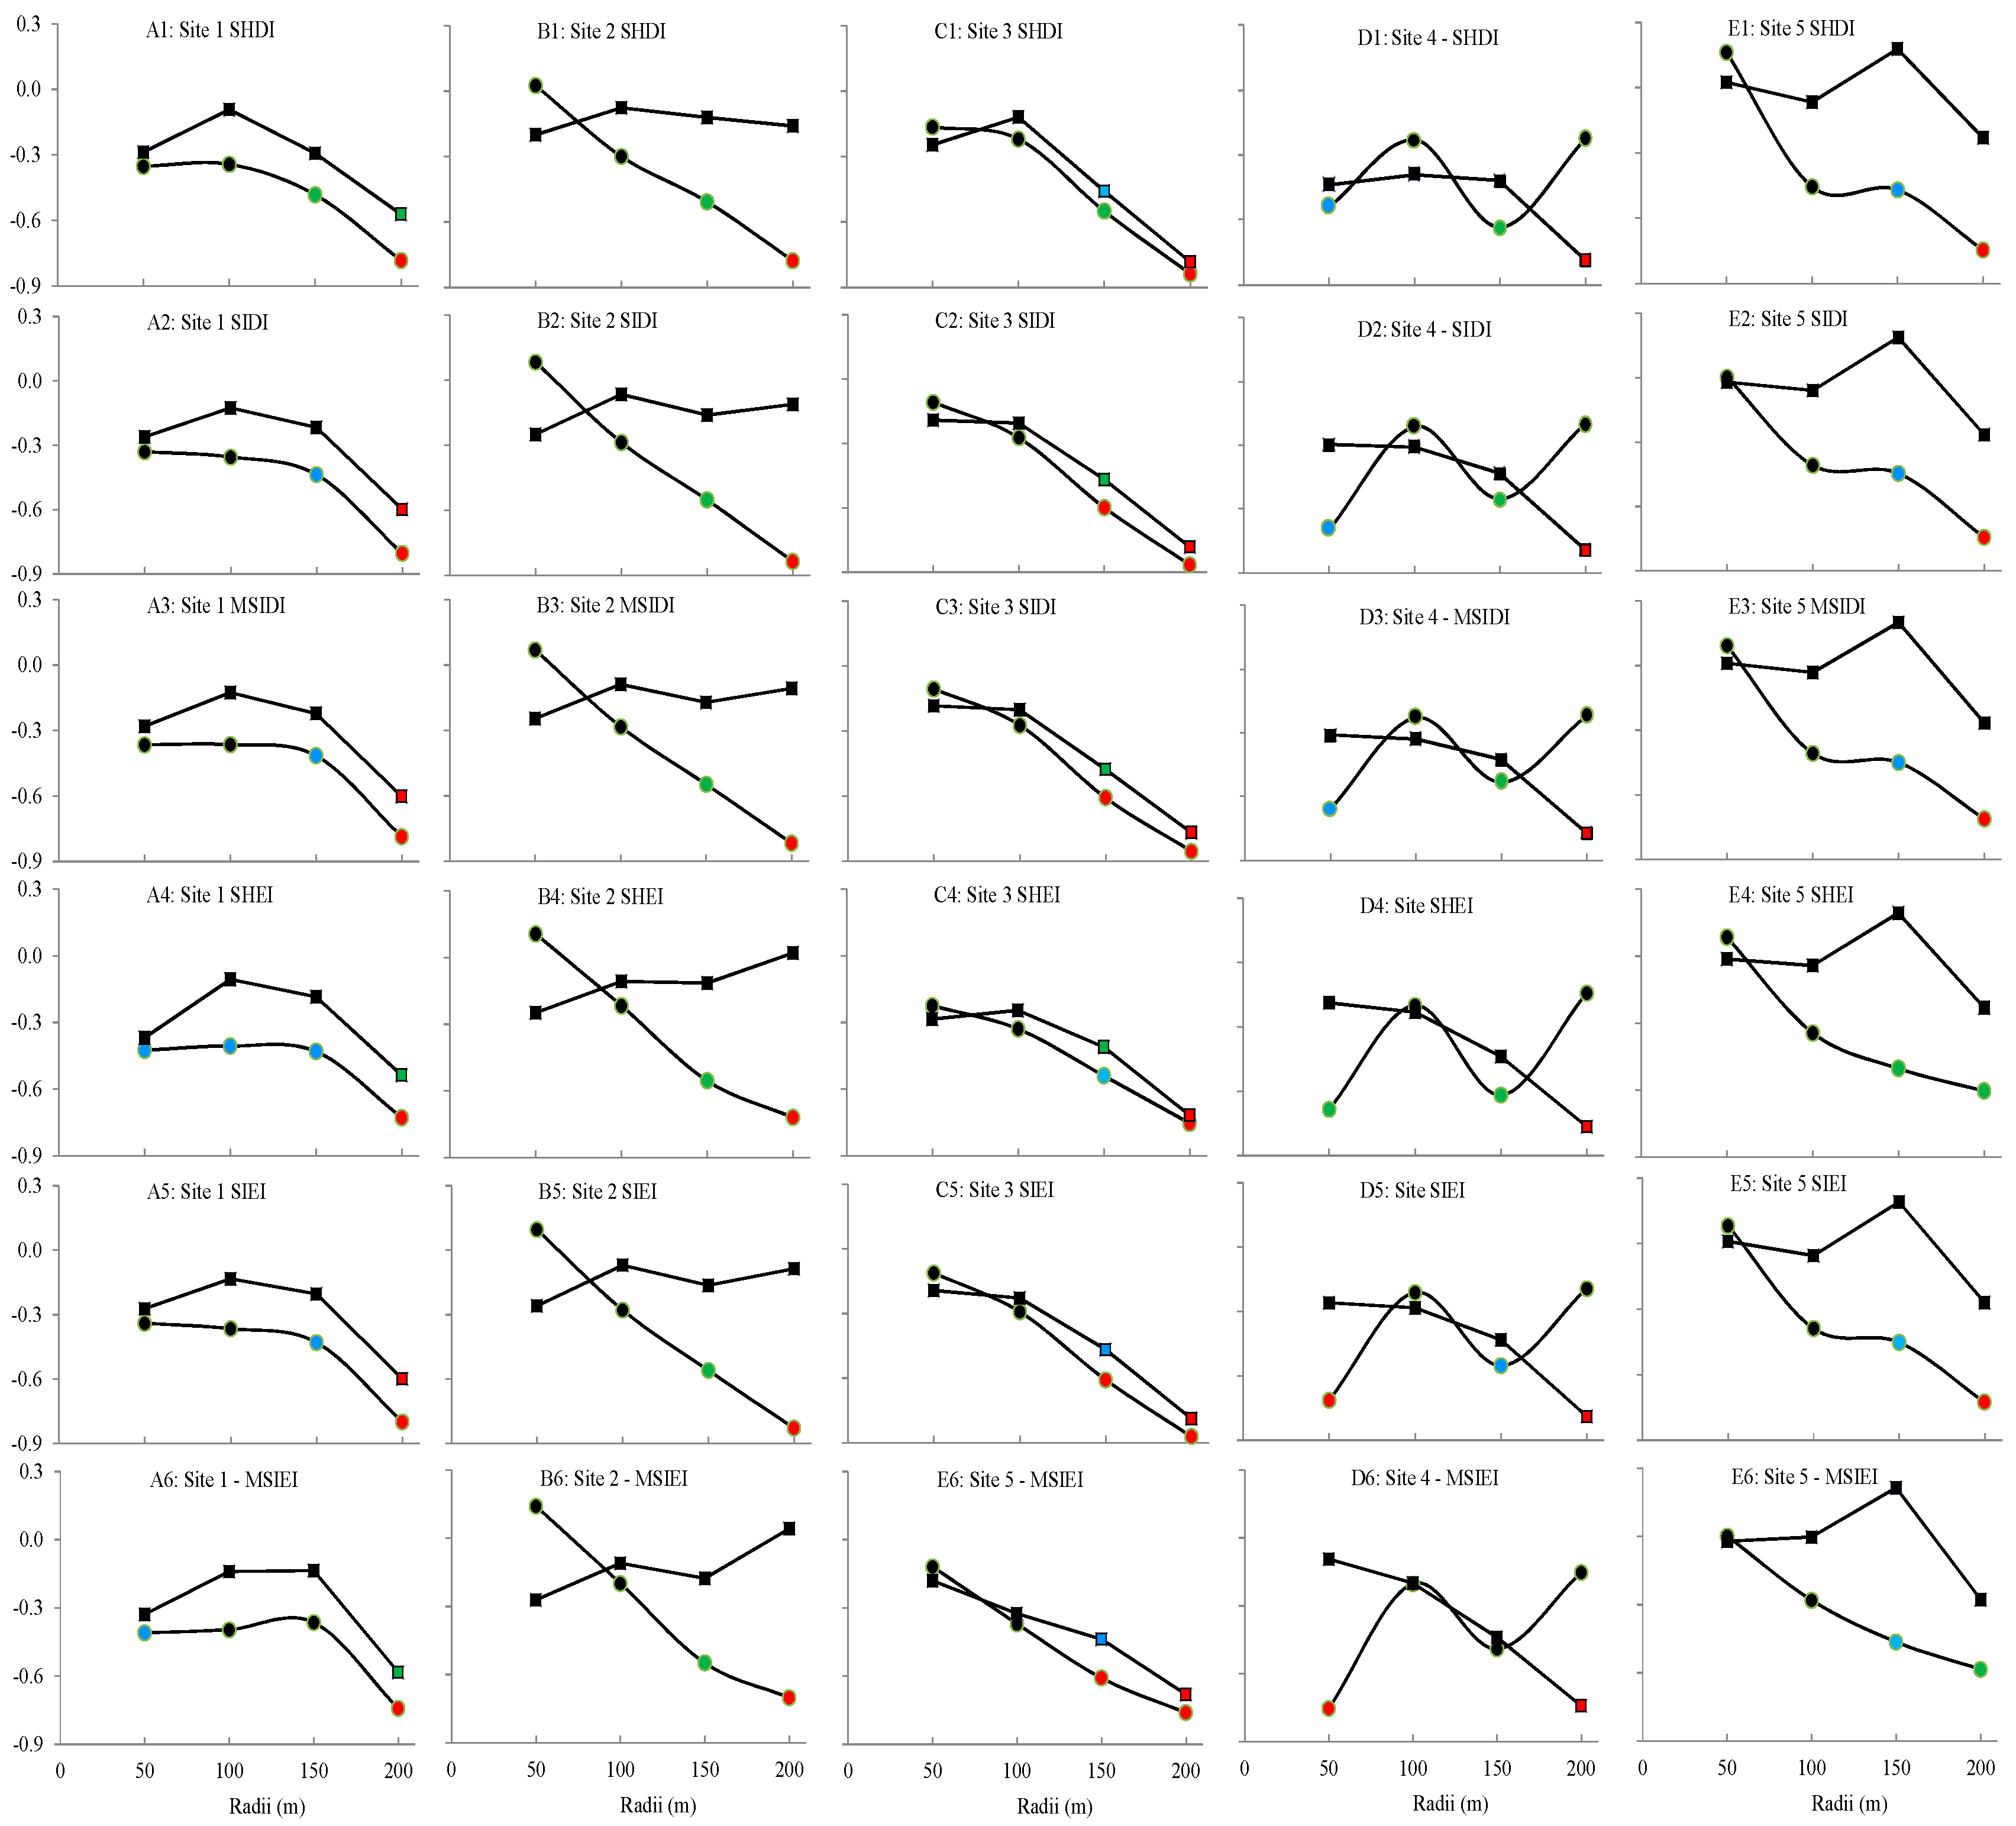
3.3. Correlation between Landscape Metrics and L. striatellus Population

At the large scale 200 m radius buffer zone, the density of nymphal L. striatellus had strong negative relationships (ρ < 0.01) with indexes SHDI, SIDI, MSIDI, SHEI, SIDI, and MSIDI in TongXiang, XinFeng, PingHu, and HaiYan sites (Figure 3). SHEI and MSIEI were exceptions in the HaiYan site. However, the same trend did not happen at the XinHuang site. At the large scale, 150 m radius buffer zone, the density of nymphal L. striatellus had moderate and strong negative relationships (ρ < 0.05) with the six diversity metrics in XinFeng and PingHu sites. In the other three study sites at the large scale—150 m radius—there were weak negative relationships (ρ < 0.10) between the density of nymphal L. striatellus and the six diversity indices. At the small scale, 50 m and 100 m radii, there were weak and even negligible relationships (ρ > 0.10) between the density of nymphal L. striatellus and the six diversity indices in all the five study sites except for XinHuang. Such results showed that for nymphal L. striatellus, there were negative correlations between its density and diversity indices at the small and large scales, and that their relationships increased with the increase of the spatial scale.
For adult L. striatellus, its density had strong (ρ < 0.01) or moderate (ρ < 0.05) negative relationships with the diversity metrics only in TongXiang, PingHu, and XinHuang sites at the large scale 200 m radius. There were weak (ρ < 0.10) or negligible (ρ > 0.10) relationships between the density of adult L. striatellus and the diversity indices in all five study sites at the landscape scale from 50 m to 150 m radii and even at the large scale 200 m radius in the XinFeng and HaiYan sites (Figure 3). The correlations between the density of adult L. striatellus and the diversity metrics were not very strong, but such correlation degrees gradually decreased with the decrease of spatial scales. Hence, these patterns show that spatial scales have significant effects on diversity indices and that the higher the diversity of landscape components is, the lower the abundance of L. striatellus is in a segmented and heterogeneous agricultural landscape.

4. Discussion

The study area is a typical rural-urban fringe region with segmentation and heterogeneity (Figure 1). We found that between five study sites in 2010, there was a significant difference in the amount of L. striatellus between nymphal and adult stages. However, the nymph amount was twice as much adult among the five study sites, except in XinHuang (Table 1). This is because the sampling date (i.e., late June of 2010) of L. striatellus in XinHuang was later than other sites; here, the host had already been transferred from winter-spring crops (e.g., wheat, rapeseed, and other edible vegetable) into summer-autumn crops (i.e., rice, which is the best food for L. striatellus). Our findings confirmed once more that crop rotation could change the population structure of herbivorous insects in agricultural landscapes [14].
Landscape spatial structure and composition have an effect on the abundance and distribution of species in way densities [19,32,33,34]. For particular herbivorous insects that feed on crop plants in agricultural landscapes, host habitats will be presented in host patches (i.e., crop fields) of different sizes (i.e., length, width, perimeter, and area) and shapes (i.e., triangle, rectangle, square, circle, and amorphousness) at varying distances from each other among adjacent geographical units [19,33,35,36]. Our study tested how agricultural landscape characteristics affected the forms of species richness and abundance. We analyzed the landscape composition of fragmented agricultural landscapes at small (50 m and 100 m radii buffers) and large (150 m and 200 m radii buffers) scales (Table 2; Figure 2). Because this study was performed in typical rural-urban fringe regions, the proportion of crop covers in a total landscape area has a large variation from minimum of 4.2% to a maximum of 100% in all sampling plots. The average proportion of crop habitat to total landscape area in each site has an obvious decrease when the landscape scale gradually expands from a 50 m to a 200 m radius buffer. Such a result is contrary to a recent study in southwest Ethiopia [4], which showed that the proportion of annual crop cover decreased when the landscape scale varied from 100 m to 200 m and 500 m radii buffers spatial scales. This difference may be because the research in Ethiopia was conducted in an open agricultural landscape [4], while our research was in a rural-urban fringe landscape.
Moreover, the degree of correlation between the proportions of crop cover and adjacent spatial scales was higher than that of nonadjacent spatial scales (Table 3). For instance, the proportions of crop cover at the 50 m radius buffer had strong positive relationships (ρ < 0.01) with the 100 m radius buffer in four of five study sites except in XinHuang. At the TongXiang and XinHuang sites, however, the proportions of crop cover at the 50 m radius buffer had no relationships (ρ < 0.01) with the 200 m radius buffer. Additionally, the maximum total area is only 12.56 ha for a centered sampling plot of L. striatellus, even at the 200 m radius buffer zone. In comparison with our study, previous studies were mostly conducted at larger spatial scales [4,27], because their research subjects had stronger flying or moving capabilities than L. striatellus. Even though the research subject belongs to the same family of Delphacidae (Delphacodes kuscheli) like our study, the spatial scale at the agricultural landscape had over 2000 m for a radius buffer [19,28,29,30,31]. Our result showed that for L. striatellus, its host habitat’s composition in the study region was extremely segmented and heterogeneous.
Although the composition of a landscape has an effect on the abundance and the distribution of species, it is difficult to directly compare one region’s landscape composition with another. This problem could be solved through diversity metrics such as SHDI, SIDI, MSIDI, SHEI, SIEI, and MSIEI [19]. These were used to quantify the effect of landscape composition on the abundance and distribution of L. striatellus at various spatial scales. The abundance of nymphal and adult individuals is negatively correlated with the three diversity indices (SHDI, SIDI, and MSIDI) and three evenness indices (SHEI, SIEI, and MSIEI) (Figure 3). Generally speaking, both nymphal and adult L. striatellus abundance had a negative correlation with the diversity metrics in this study. The Pearson correlation coefficients of diversity metrics and abundance of L. striatellus decreased gradually when the spatial scales varied from large (200 m and 150 m radii buffers) to small (100 m and 50 m radii buffers). Such phenomena were opposite to the average proportion of crop covers, which increased from small to large scales (Table 2). This means that the abundance of L. striatellus is driven by the surrounding landscape, especially in a small and segmented agricultural landscape. It is consistent with the recent report by Grilli [30] who concluded that the proximity of other host patches had an effect on the abundance of the dispersive fraction of the population of D. Kuscheli in Argentina’s central plain.
There were negligible relationships between landscape diversity metrics and the abundance of adult L. striatellus in the XinFeng site (B1-B6 in Figure 3), and the abundance of nymphal L. striatellus in the XinHuang site (D1-D6 in Figure 3). The reason may be that in the XinFeng site had wheat as the main host (Figure 2b), which is a better host than other crops in the winter-spring season [14]. The post-mating female insect dies after laying eggs, which quickly hatch into nymph in the wheat field [37]. Then the proportion of nymph to adults is higher in the XinFeng site and the HaiYan site (Table 1). This could be because the XinHuang site grew rice; this was not demonstrated in Figure 2d because the imaging date of the GeoEye-1 satellite imagery was earlier (1 May 2010) than the sampling date of L. striatellus (late June 2010). Rice crop is the most appropriate food for L. striatellus in the summer-autumn season, so there were more adults in the XinHuang site (Table 1). These results showed that the landscape composition, which is determined by crop type and crop rotation practices, has an effect on the abundance and population structure of L. striatellus.
The numerous studies, published over the past 30 years, presented that the use of landscape metrics has been widely studied. However, there has been less attention on integrating small-scale landscape elements into land use/cover [38]. We focused on investigating the correlation between abundance of L. striatellus and landscape elements and compositions at small-scale level from 50 m to 200 m radii buffer zones in segmented agricultural landscapes. This study could make a little progress in the research about small-scale landscape metrics, which could benefit from high-spatial resolution satellite sensors. Furthermore, geospatial analysis may be a good procedure to investigate the relationship between landscape composition and insect abundance in the fragmented rural-urban fringe regions in future research.

5. Conclusions

In general, there are lots of abiotic (e.g., micro-climate temperature, relative humidity, soil pH, water content), agronomical (e.g., fertilization, spraying insecticide), and biotic (e.g., composition of natural enemy assemblage, species gender, wing morphs, host types) factors affecting the abundance and population structures of the planthoppers in the family Delphacidae [39]. The fertilizer used in a crop field changes the health status of crop plants, and consequently, affect the insect’s choice of host and feeding behavior [39]. Insecticide could kill insects and directly decrease their abundance on the host plants [40]. Moreover, the female and male, and the macropters and brachypters, have different flying abilities; the dispersal and movement of insect individuals is therefore different. This, in turn, affects the survey results of insect individuals. More detailed studies are needed to clarify how the abiotic and biotic factors affect the abundance and population structure of planthopper species at small and large scales in segmented agricultural landscapes. These investigations could provide biologically-based solutions to natural pest control. Many studies already exist and demonstrate that different land-use types, when used at different scales, can interact to create variations in biodiversity across an agricultural landscape [41,42,43]. Our study shows that, when using augmented biological control agents such as arthropod predators and parasitoids through vegetation regulation and ecological engineering practices, the width of a homogenous crop field needs to be no more than 200 m and to increase vegetation diversity within such a scale as much as possible will be helpful to regulate agricultural insect pests such as L. striatellus under a certain density in winter-spring crops.

Acknowledgments

This work is mainly sponsored by National Natural Science Foundation of China (31371935, 41301483 and 41671437) and National Key Basic Research Program of China (973 Program; 2010CB126200). We are very grateful for Xue-Ming Zhong and Jin-Liang Zhu from Jiaxing Plant Protection Station, Jiaxing, Zhejaing, 314050, China; Shi-Qun Li and Xiao-Jin Han from Pinghu Plant Protection, Pinghu, Zhejiang, 314200, China; Xiao-Qun Zhu from Haiyan Plant Protection Station, Yi Chen and Li-Ming Zhu from Tongxiang Plant Protection, Tongxiang, Zhejiang, 314500; China; Jin-Xiang Feng from Nanhu District Crop Station, Nanhu, Jiaxing, Zhejiang, 314000, China for field sampling. We thank Gabriela Shirkey for editing the language of the manuscript.

Author Contributions

Conceived and designed the experiments: Zengrong Zhu, Zhanyu Liu, and Jiaan Cheng. Performed the experiments: Zhanyu Liu, Zengrong Zhu. Analyzed the data: Zhanyu Liu, Hongfeng Wu. Contributed reagents/materials/analysis tools: Jiquan Chen, Jiaguo Qi, and Ranjeet John. Wrote the paper: Zhanyu Liu and Zengrong Zhu.

Conflicts of Interest

The authors declare no conflict of interest.

References

  1. Burel, F.; Baudry, J. Landscape Ecology: Concepts, Methods, and Applications; Science Publishers: Enfield, UK, 2003. [Google Scholar]
  2. Fahrig, L.; Baudry, J.; Brotons, L.; Burel, F.G.; Crist, T.O.; Fuller, R.J.; Sirami, C.; Siriwardena, G.M.; Martin, J.L. Functional landscape heterogeneity and animal biodiversity in agricultural landscapes. Ecol. Lett. 2011, 14, 101–112. [Google Scholar] [CrossRef] [PubMed]
  3. Puech, C.; Poggi, S.; Baudry, J.; Aviron, S. Do farming practices affect natural enemies at the landscape scale? Landsc. Ecol. 2015, 30, 125–140. [Google Scholar] [CrossRef]
  4. Lemessa, D.; Hambäck, P.A.; Hylander, K. The effect of local and landscape level land-use composition on predatory arthropods in a tropical agricultural landscape. Landsc. Ecol. 2015, 30, 167–180. [Google Scholar] [CrossRef]
  5. Bennett, A.F.; Radford, J.Q.; Haslem, A. Properties of land mosaics: Implications for nature conservation in agricultural environments. Biol. Conserv. 2006, 133, 250–264. [Google Scholar] [CrossRef]
  6. Loos, J.; Kuussaari, M.; Ekroos, J.; Hanspach, J.; Fust, P.; Jackson, L.; Fischer, J. Changes in butterfly movements along a gradient of land use in farmlands of Transylvania (Romania). Landsc. Ecol. 2015, 30, 625–635. [Google Scholar] [CrossRef]
  7. Duelli, P.; Obrist, M.K. Regional biodiversity in an agricultural landscape: The contribution of seminatural habitat islands. Basic Appl. Ecol. 2003, 4, 129–138. [Google Scholar] [CrossRef]
  8. Bianchi, F.J.J.A.; Booij, C.J.H.; Tscharntke, T. Sustainable pest regulation in agricultural landscapes: A review on landscape composition, biodiversity and natural pest control. Proc. R. Soc. B Biol. Sci. 2006, 273, 1715–1727. [Google Scholar] [CrossRef] [PubMed]
  9. Yazdani, S.S.; Agarwal, M.L. Elements of Insect Ecology; Narosa Publishing House: London, UK, 1997. [Google Scholar]
  10. Overgaard, H.J.; Tsuda, Y.; Suwonkerd, W.; Takagi, M. Characteristics of Anopheles minimus (Diptera: Culicidae) larval habitats in northern Thailand. Environ. Entomol. 2002, 31, 134–141. [Google Scholar] [CrossRef]
  11. Overgaard, H.J.; Ekbom, B.; Suwonkerd, W.; Takagi, M. Effect of landscape structure on anopheline mosquito density and diversity in northern Thailand: Implications for malaria transmission and control. Landsc. Ecol. 2003, 18, 605–619. [Google Scholar] [CrossRef]
  12. Cheng, J.A. Rice planthopper problems and relevant causes in China. In Planthoppers: New Threats to the Sustainability of Intensive Rice Production Systems in Asia; Heong, K.L., Hardy, B., Eds.; International Rice Research Institute: Los Baños, The Philippines, 2009; pp. 157–178. [Google Scholar]
  13. Bottrell, D.G.; Schoenly, K.G. Resurrecting the ghost of green revolution past: The brown planthopper as a recurring threat to high-yielding rice production in tropical Asia. J. Asia Pac. Entomol. 2012, 15, 122–140. [Google Scholar] [CrossRef]
  14. Cheng, J.A. Rice planthoppers in the past half century in China. In Rice Planthoppers: Ecology, Management, Social Economics and Policy; Heong, K.L., Cheng, J.A., Escalada, M.M., Eds.; Zhejiang University Press: Hangzhou, China, 2014; pp. 1–32. [Google Scholar]
  15. Sogawa, K. Planthopper outbreaks in different paddy ecosystems in Asia: Man-made hopper plagues that threatened the Green Revolution in rice. In Rice Planthoppers: Ecology, Management, Social Economics and Policy; Heong, K.L., Cheng, J.A., Escalada, M.M., Eds.; Zhejiang University Press: Hangzhou, China, 2014; pp. 33–64. [Google Scholar]
  16. Li, H.; Reynolds, J.F. A simulation experiment to quantify spatial heterogeneity in categorical map. Ecology 2015, 75, 2446–2455. [Google Scholar] [CrossRef]
  17. Riitters, K.H.; O’Neil, R.V.; Hunsaker, C.T.; Wickham, J.D.; Yankee, D.H.; Timmins, S.P.; Jones, K.B.; Jackson, B.L. A factor analysis of landscape pattern and structure metrics. Landsc. Ecol. 1995, 10, 23–39. [Google Scholar] [CrossRef]
  18. Hargis, C.D.; Bissonette, H.A.; David, J.L. The behavior of landscape metrics commonly used in the study of habitat fragmentation. Landsc. Ecol. 1998, 13, 167–186. [Google Scholar] [CrossRef]
  19. Grilli, M.P. The role of landscape structure on the abundance of a disease vector planthopper: A quantitative approach. Landsc. Ecol. 2010, 25, 383–394. [Google Scholar] [CrossRef]
  20. McGarigal, K.; Cushman, S.; Ene, E. FRAGSTATS V4: Spatial Pattern Analysis Program for Categorical and Continuous Maps; University of Massachusetts: Amherst, MA, USA, 2012. [Google Scholar]
  21. Jiaxing Weather. Available online: http://www.jxqx.net/weather (accessed on 15 January 2011).
  22. Huang, J.K.; Deng, X.Z.; Rozelle, S. Cultivated land conversion and bioproductivity in China. Proc. SPIE 2004, 5544. [Google Scholar] [CrossRef]
  23. Cheng, X.N.; Wu, J.C.; Ma, F. Brown Planthopper: Occurrence and Control; Chinese Agriculture Press: Beijing, China, 2003. [Google Scholar]
  24. Anderson, J.R.; Hardy, E.E.; Roach, J.T.; Witmer, R.E. A Land-Use and Land-Cover Classification System for Use with Remote Sensor Data; USGS paper #964; The United States Geological Survey: Washington, DC, USA, 1976; p. 28. [Google Scholar]
  25. Eastman, R.J. IDRISI Andes Guide to GIS and Image Processing; Clark Labs Clark University: Worcester, MA, USA, 2006. [Google Scholar]
  26. Jensen, J.R. Introductory Digital Image Processing: A Remote Sensing Perspective, 3rd ed.; Pearson Prentice Hall: Upper Saddle River, NJ, USA, 2011. [Google Scholar]
  27. Ricci, B.; Franck, P.; Toubon, J.F.; Bouvier, J.C.; Sauphanor, B.; Lavigne, C. The influence of landscape on insect pest dynamics: A case study in southeastern France. Landsc. Ecol. 2009, 24, 337–349. [Google Scholar] [CrossRef]
  28. Grilli, M.; Gorla, D. The spatio-temporal pattern of Delphacodes kuscheli (Homoptera: Delphacidae) abundance in central Argentina. Bull. Entomol. Res. 1997, 87, 45–53. [Google Scholar] [CrossRef]
  29. Grilli, M.P. Effect of local land use on populations of a disease vector planthopper. Environ. Entomol. 2006, 35, 1254–1263. [Google Scholar] [CrossRef]
  30. Grilli, M.P.; Bruno, M.A. Regional abundance of a planthopper pest: The effect of host patch area and configuration. Entomol. Exp. Appl. 2007, 122, 133–143. [Google Scholar] [CrossRef]
  31. Grilli, M.P. Spatial synchrony of planthopper species with contrasting outbreak behavior. Agric. For. Entomol. 2008, 10, 307–314. [Google Scholar] [CrossRef]
  32. Forman, R.T.T.; Godron, M. Landscape Ecology; Wiley: New York, NY, USA, 1986. [Google Scholar]
  33. Hanski, I.; Gilpin, M.E. Metapopulation Biology. Ecology, Genetics, and Evolution; Academic Press: San Diego, CA, USA, 1997. [Google Scholar]
  34. Chefaoui, R.M. Landscape metrics as indicators of coastal morphology: A multi-scale approach. Ecol. Indic. 2014, 45, 139–147. [Google Scholar] [CrossRef]
  35. Fahrig, L.; Jonsen, I. Effect of habitat patch characteristics on abundance and diversity of insects in an agricultural landscape. Ecosystems 1998, 1, 197–205. [Google Scholar] [CrossRef]
  36. Jackson, C.R.; Marnewick, K.; Lindsey, P.A.; Roskaft, E.; Robertson, M.P. Evaluating habitat connectivity methodologies: A case study with endangered African wild dogs in South Africa. Landsc. Ecol. 2016, 31, 1433–1447. [Google Scholar] [CrossRef]
  37. Lou, Y.G.; Hu, L.F.; Li, J.C. Herbivore-induced defenses in dice and their potential application in rice planthopper management. In Rice Planthoppers: Ecology, Management, Social Economics and Policy; Heong, K.L., Cheng, J.A., Escalada, M.M., Eds.; Zhejiang University Press: Hangzhou, China, 2014; pp. 91–116. [Google Scholar]
  38. Mõisja, K.; Uuemaa, E.; Oja, T. Integrating small-scale landscape elements into land use/cover: The impact on landscape metrics’ values. Ecol. Indic. 2014, 67, 714–722. [Google Scholar] [CrossRef]
  39. Heong, K.L.; Wong, L.; Reyes, J.H.D. Addressing planthopper threats to Asian rice farming and food security: Fixing insecticide misuse. In Rice Planthoppers: Ecology, Management, Social Economics and Policy; Heong, K.L., Cheng, J.A., Escalada, M.M., Eds.; Zhejiang University Press: Hangzhou, China, 2014; pp. 65–76. [Google Scholar]
  40. Liu, Z.W.; Wu, J.C.; Zhang, Y.X.; Liu, F.; Xu, J.X.; Bao, H.B. Mechanisms of Rice Planthopper Resistance to Insecticides. In Rice Planthoppers: Ecology, Management, Social Economics and Policy; Heong, K.L., Cheng, J.A., Escalada, M.M., Eds.; Zhejiang University Press: Hangzhou, China, 2014; pp. 117–142. [Google Scholar]
  41. Maisonhaute, J.É.; Peres-Neto, P.; Lucas, É. Influence of agronomic practices, local environment and landscape structure on predatory beetle assemblage. Agric. Ecosyst. Environ. 2010, 139, 500–507. [Google Scholar] [CrossRef]
  42. Schmidt, M.H.; Thies, C.; Nentwig, W.; Tscharntke, T. Contrasting responses of arable spiders to the landscape matrix at different spatial scales. J. Biogeogr. 2008, 35, 157–166. [Google Scholar] [CrossRef]
  43. Karp, D.S.; Mendenhall, C.D.; Sand, R.F.; Chaumont, N.; Ehrlich, P.R.; Hadly, E.A.; Daily, G.C. Forest bolsters bird abundance, pest control and coffee yield. Ecol. Lett. 2013, 16, 1339–1347. [Google Scholar] [CrossRef] [PubMed]
Figure 1. Map of the study area in the Jiaxing Prefecture of East China where (a) Is showing the positions of the five study sites identified by a density within the circles (bf); respectively indicate the landscape structures of five study sites with pan-sharpened multispectral (Red: Green: Blue) GeoEye-1 satellite imageries including TongXiang, XinFeng, PingHu, XinHuang, and HaiYan. The dashed line indicates the district administrative level boundary in (a). The red circles show the sampling plots of Laodelphax striatellus in (bf).
Land 05 00036 g001
Figure 2. Land cover map of these five study sites. (ae) Indicate study sites TongXiang XinFeng, PingHu, XinHuang, and HaiYan, respectively.
Land 05 00036 g002
Figure 3. Scatterplots of correlation coefficients (R in the vertical axis) between the abundance of Laodelphax striatellus and the diversity indices of agricultural landscapes at four radii patterns (in the horizontal axis). The circle and square represent the nymphal and adult insect stages, respectively. The red, green, and blue colors display the significance of the Pearson’s test at the 0.01, 0.05, and 0.10 levels, respectively. The column represents five study sites from left to right: TongXiang, XinFeng, PingHu, XinHuang, and HaiYan, and the row shows the six diversity metrics from top to bottom: SHDI, SIDI, MSIDI, SHEI, SIEI, and MSIEI.
Land 05 00036 g003
Table 1. Statistical description of nymph and adult densities of Laodelphax striatellus *.
Study SiteTongXiang (17)XinFeng (17)PingHu (17)XinHuang (11)HaiYan (15)
Life cycleNymphAdultNymphAdultNymphAdultNymphAdultNymphAdult
Min00200001400
Max13628381997543182924
Mean4.82.276.41.654.924.20.465.553.90.9
SD3.72.280.12.560.526.41.288.473.51.4
Sum8238129928933411472080914
Sig. value0.003 0.001 0.004 0.035 0.014
* Displayed are minimum (Min), maximum (Max), mean, standard deviation (SD), sum, and sig. (two-tailed) values conducted by a paired sample t-test with a 95% confidence interval. Numbers in brackets indicates the amount of sampling plot of Laodelphax striatellus collected in each study site.
Table 2. Mean percentage of agricultural land to the total landscape area in the five study sites *.
Study SiteRadii (m)50 m100 m150 m200 m
TongXiang (17)Min58.766.066.367.4
Max97.091.392.090.3
Mean83.7d82.5b82.7b81.2a
SD10.28.47.97.2
XinFeng (17)Min4.242.951.257.8
Max100.090.685.977.6
Mean73.2d71.7c68.1b65.8a
SD26.416.09.75.2
PingHu (17)Min39.247.531.031.7
Max96.783.882.681.0
Mean76.5d69.3c62.4a62.9b
SD15.710.916.415.5
XinHuang (11)Min57.566.564.367.6
Max97.094.991.990.3
Mean89.0d85.3c82.3b80.4a
SD11.28.98.77.0
HaiYan (15)Min14.429.921.823.3
Max97.595.192.787.4
Mean73.1d70.3c66.5b65.6a
SD24.920.920.818.3
* Means followed by the same letter are not significantly different from each other according to the Duncan test at alpha = 0.05. Numbers in brackets indicates the amount of sampling plot of Laodelphax striatellus collected in each study site.
Table 3. Correlation coefficients between proportions of agricultural land to the buffer zone area at four radii.
Study SiteRadii50 m100 m150 m200 m
TongXiang (17)50 m1
100 m0.651 **1
150 m0.3590.875 ***1
200 m0.1470.633 **0.884 ***1
XinFeng (17)50 m1
100 m0.878 ***1
150 m0.758 ***0.905 ***1
200 m0.508 *0.674 **0.762 ***1
PingHu (17)50 m1
100 m0.779 ***1
150 m0.665 **0.755 ***1
200 m0.634 **0.755 ***0.810 ***1
XinHuang (11)50 m1
100 m0.661 *1
150 m0.1080.774 **1
200 m−0.2550.4760.895 ***1
HaiYan (15)50 m1
100 m0.857 ***1
150 m0.687 **0.945 ***1
200 m0.625 **0.896 ***0.983 ***1
Notes: Displayed are significance levels: *ρ < 0.05; **ρ < 0.01; ***ρ < 0.001. Numbers in brackets indicate the amount of sampling plot of Laodelphax striatellus collected in each study site.

