The Potential for Enhanced Water Decoupling in the Jordan Basin through Regional Agricultural Best Practice
by
 ,
,
Michael Gilmont
1,*, 
Lara Nassar
2,
Steve Rayner
1,
Nadav Tal
3,
Erica Harper
2 and
Hilmi S. Salem
4 1
Institute for Science, Innovation and Society, University of Oxford, 64 Banbury Road, Oxford OX2 6PN, UK
2
West Asia North Africa (WANA) Institute, Royal Scientific Society, P.O. Box 1438, Ahmad Al-Tarawneh Street 70, Jubeiha, Amman 11941, Jordan
3
EcoPeace Middle East, 90 Begin Rd, Tel Aviv 67138, Israel
4
(formerly of) Louise Building, Ras Al Tahouneh St, Al Bireh, Palestine
*
Author to whom correspondence should be addressed.
Land 2018, 7(2), 63; https://doi.org/10.3390/land7020063
Submission received: 15 March 2018
/
Revised: 7 May 2018
/
Accepted: 9 May 2018
/
Published: 13 May 2018
(This article belongs to the Special Issue Arid Land Systems: Sciences and Societies)
Abstract
:This paper examines the differences in agricultural water application per crop ton output in semi-arid jurisdictions in the Jordan Basin, focusing on Israel and Jordan, with some analysis relevant to Palestine. In order to understand differences in water application, it delivers a nationally averaged assessment of applied water application for 14 key regional crops, with most cases suggesting Israeli best practice in water application per unit crop. The paper draws on a secondary assessment of agricultural water intensity and primary data from farmer interviews to demonstrate differences in applied water productivity and agricultural context. The analysis suggests a conservative estimate that a difference of 168 Million Cubic Meters (MCM)/yr (33% of agriculture and 18% of national total) exists in terms of water application for a given crop production in Jordan when compared with Israel. The paper then proposes further work required to establish how differences in water application might translate into differences in agricultural water productivity, and thereby potential water savings that might enable growth of production within current agricultural allocations, allowing new future resources to be allocated to other economic and social needs. The paper also delivers a preliminary analysis of the political and institutional landscape for implementation, assessing the challenges of institutional silos and overlap that some policy stakeholders see as hindering cross-sectoral progress. The paper concludes by examining the limitations of the analysis, and it proposes future work to deepen the robustness of results and examines some of the challenges facing improved agricultural water productivity and changing farm behaviour in the region.
1. Introduction
Jordan, Israel, and Palestine are three of the most water-scarce jurisdictions in the world. All three have seen significant growth in recent decades in both population and economic activity, despite their limited water resources. These trends have been achieved through multiple mechanisms to circumvent their water limits, with the effect of ‘decoupling’ growth from national water needs (Gilmont, 2014) [1]. Israel in particular has demonstrated that four mechanisms, comprising diversification, food imports, agricultural water productivity, and non-natural water supplies (desalination and wastewater reuse), have enabled it to experience significant economic, population, and agricultural growth, while recently starting to redress decline in the environmental condition of freshwater resources. This paper focuses on agricultural water productivity as a mechanism for decoupling, and seeks to take a first step in understanding the potential savings that could be achieved in the region if agricultural best practice is targeted. For most examined crops, it is suggested that savings might accrue to Jordan if it moved towards Israeli levels of agricultural water productivity, although two key instances are highlighted for further research where the opposite might be true. This paper takes a first step towards understanding differences in water productivity, by looking at water application and yield. It deploys both a national secondary data assessment of agricultural water application, and farm-level primary interviews to understand farm-level detail on water application and yield on both sides of the Jordan River, including insights into the differences in the socio-economic context of agriculture. An initial assessment of the volumetric differences in water application between Israel and Jordan is made. The paper then briefly examines similarities and differences within basin jurisdictions in an agricultural context, before focusing on the institutional and political landscape of how improved water productivity might be deployed in Jordan, highlighting a number of policy barriers and some stakeholder-proposed solutions. The final section of the paper evaluates the methodology, and proposes future research to deepen both the understanding and robustness around the potential for enhanced agricultural decoupling through the assessment of differences in water consumption and the likely issues of return flows, as well as to contribute to the institutional challenges highlighted.
Context and Need
Israel is regarded as having one of the most water productive agricultural sectors in the world, owing to both water and crop technologies, cropping patterns, and crop choice (World Bank 2006) [2]. As a result of its limited available freshwater resources and growing population, over time, water has been allocated away from agriculture to other sectors, especially domestic uses (Teschner and Negev, 2013) [3]. This reallocation has occurred both steadily over time, and more dramatically during drought years, where agriculture has been cut faster and more severely than other sectors. Despite receiving less water following a peak in agricultural allocation in 1985, and with an increasing proportion of allocation comprised of treated wastewater, agricultural output tonnage has increased steadily (Figure 1).
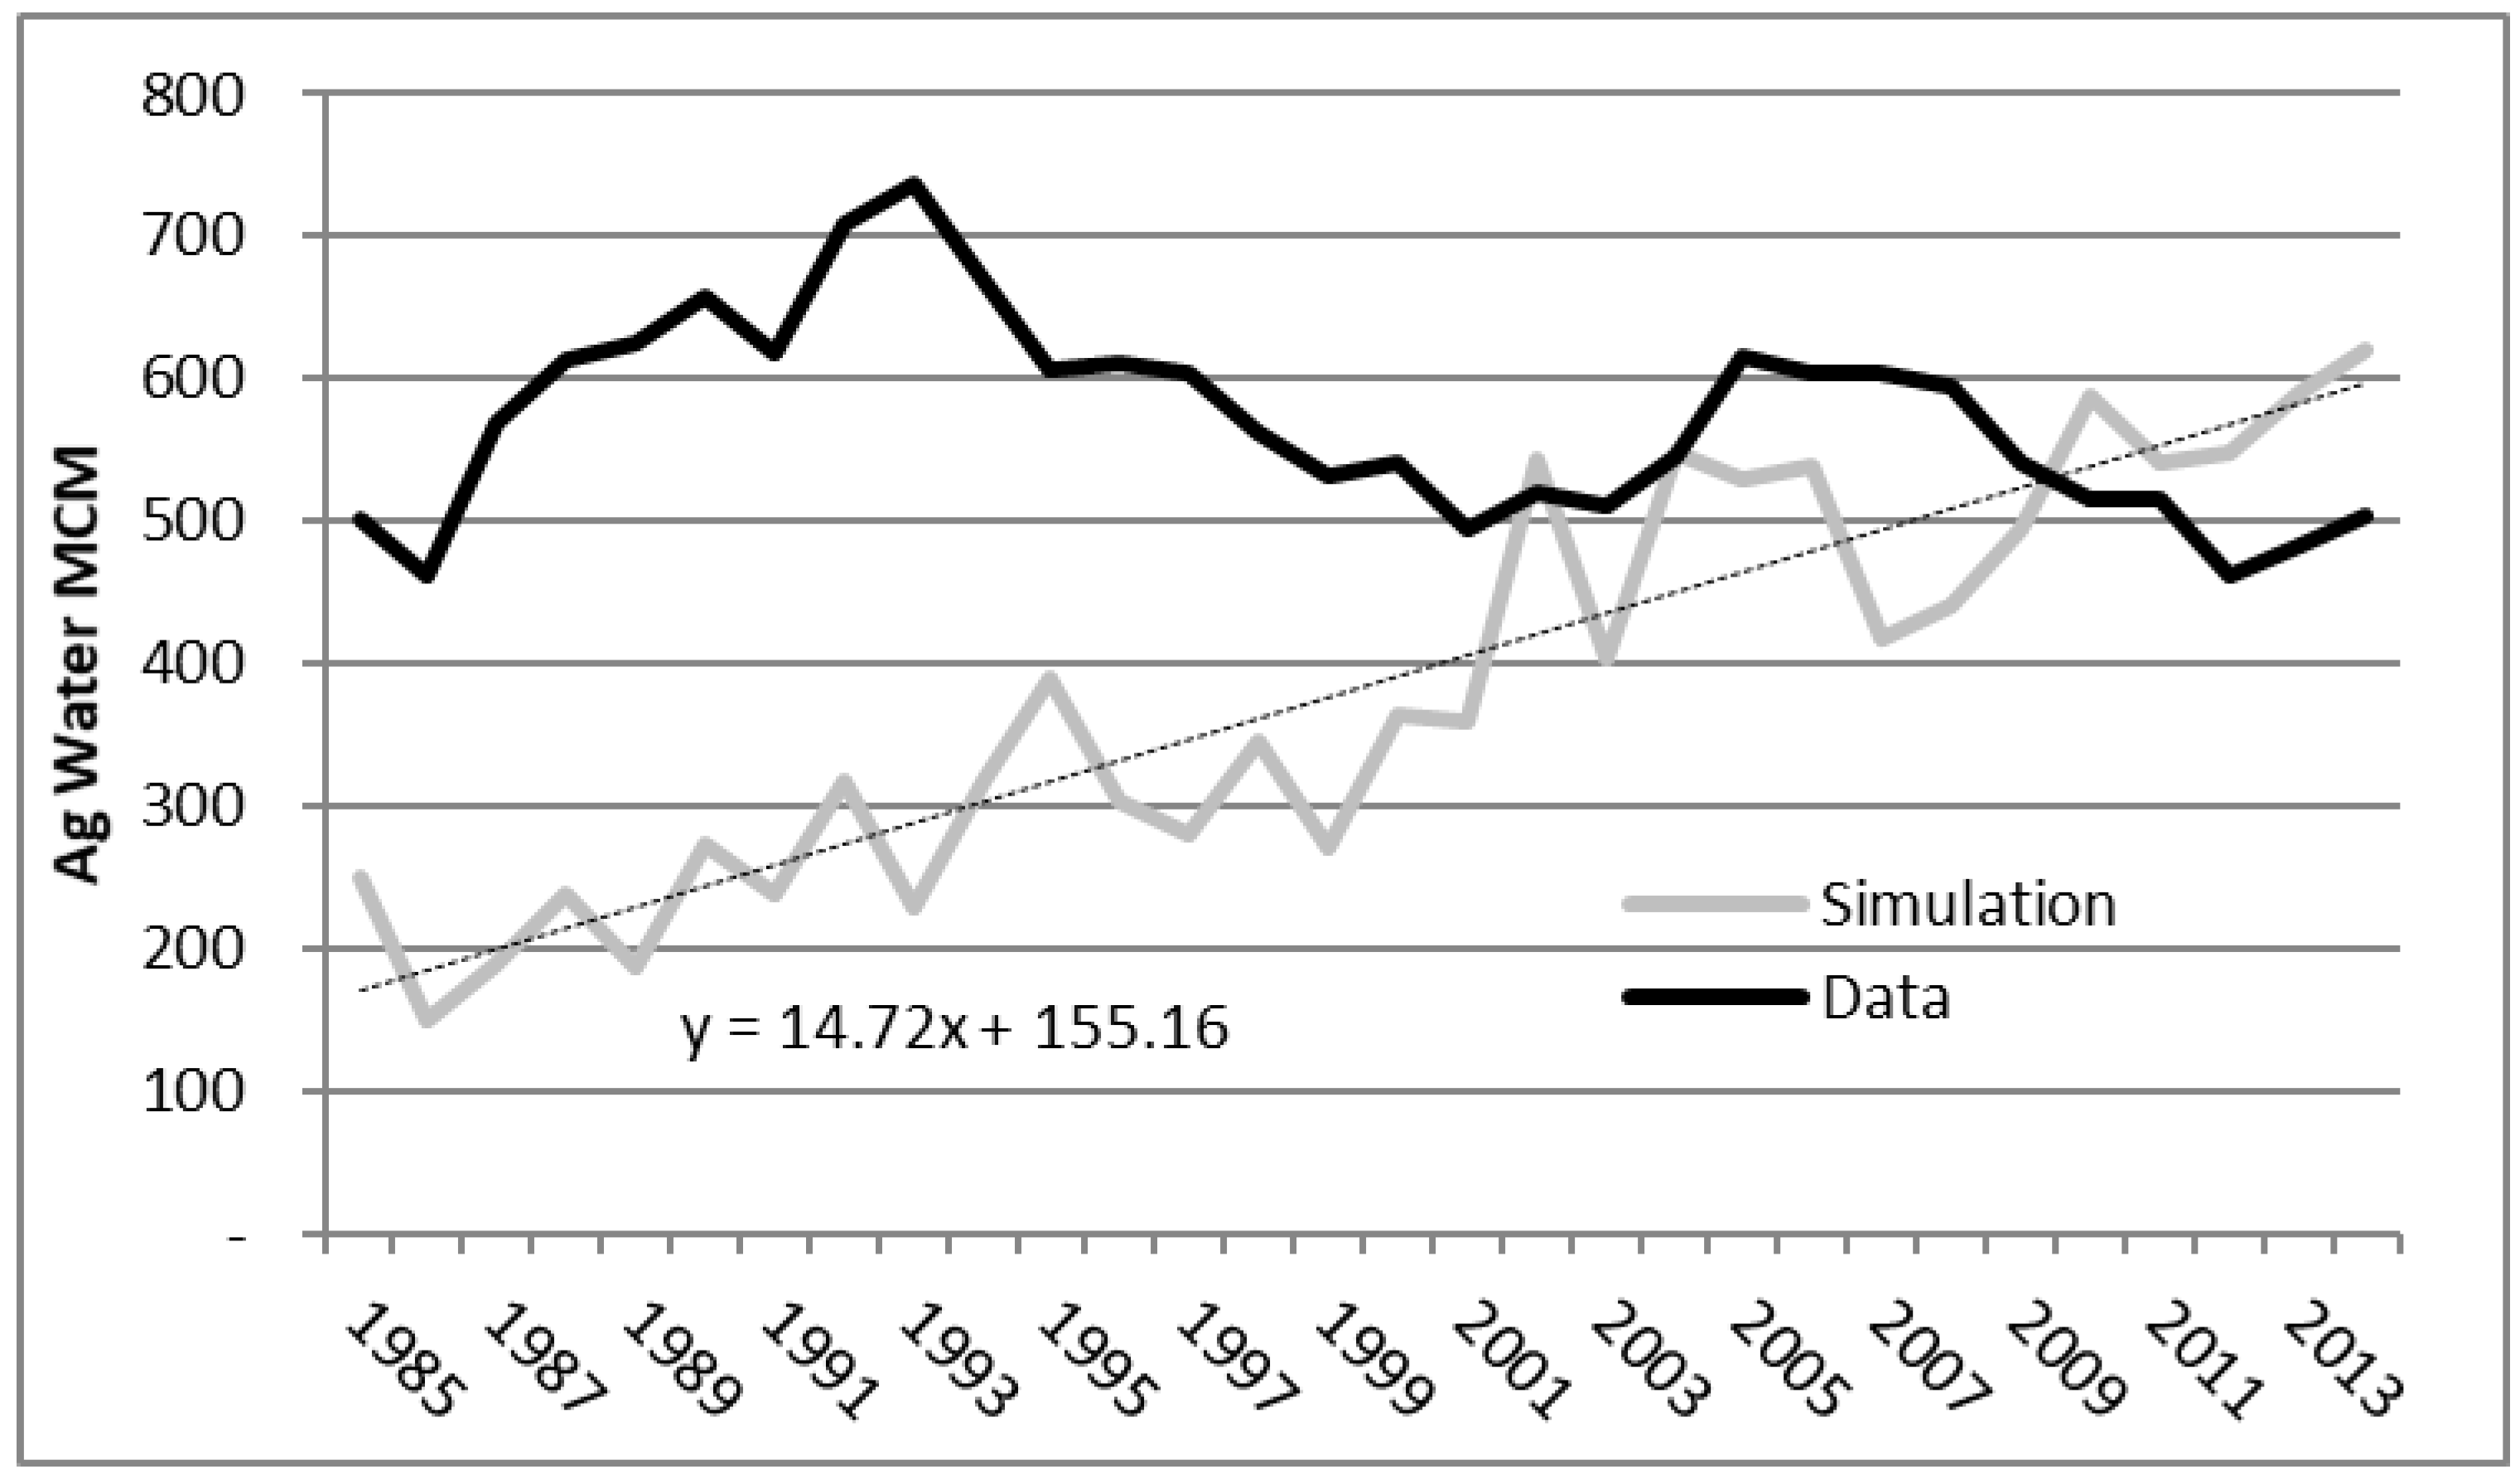
Jordan has not undertaken the same level of technical and managerial investment and innovation as its neighbour, but has seen considerable growth in agricultural outputs since the early 1990s, despite static or reduced water availability for agriculture (Figure 2). Despite these gains, Jordan’s agricultural sector is regarded as having significant inefficiencies in water productivity (EcoPeace, 2013) [4]. Nationally, however, because of significant rain-fed production—especially of olives—agricultural production per unit water applied across the entire output appears to be higher in Jordan than in Israel. Based on 2016 Food and Agricultural Organization (FAO) food balance [5] and national water statistics, Jordan’s total agricultural applied water productivity (agricultural water allocation per FAO recorded production tonne) was 194 m3/t, while Israel’s was 267 m3/t. This data, however, excludes considerable illegal abstraction of agriculture water in Jordan, as well as conflating rain-fed and irrigated production. As the empirical work below will demonstrate, the aggregate numbers mask considerable differences in water application and yield for certain crops.
Since 2012, Jordan has experienced additional pressure on its water resources due to its hosting of refugees from Syria. This has exacerbated its already extreme water scarcity, with available total supplies (across all sectors) dropping from 270 m3/cap/yr in 1988 to 106 m3/cap/yr in 2015 (based on Ministry of Water data and official population statistics). The increase in people within the territory required that the Ministry of Water and Irrigation rework their 2008–2022 water master plan ‘Water for Life’ (Ministry of Water and Irrigation (MWI) 2008) [6]. The resulting 2016–2025 plan (MWI, 2016) [7] accounts for increased demand due to Syrian refugees, and new supplies coming online from groundwater sources and the planned ‘Red Sea Dead Sea’ Conveyance. The proposed scheme, currently under tendering as of 2018, involves the production of desalinated water from the Red Sea, with brine discharged into the Dead Sea, helping to slow the decline in water level of the Dead Sea. The fresh desalinated water will be supplied directly to Jordan, and will form part of a water swap with Israel, and also through Israel to the Palestinians using natural water supplies from the Sea of Galilee (Lake Tiberias) and desalinated resources from the Mediterranean Sea (World Bank 2014) [8]. Increased domestic water use in Jordan, combined with new infrastructure capacity, will increase the availability of treated wastewater in agriculture (Seder and Abdel-Jabbar, 2011) [9], enabling reallocation of freshwater to the domestic and industrial sectors.
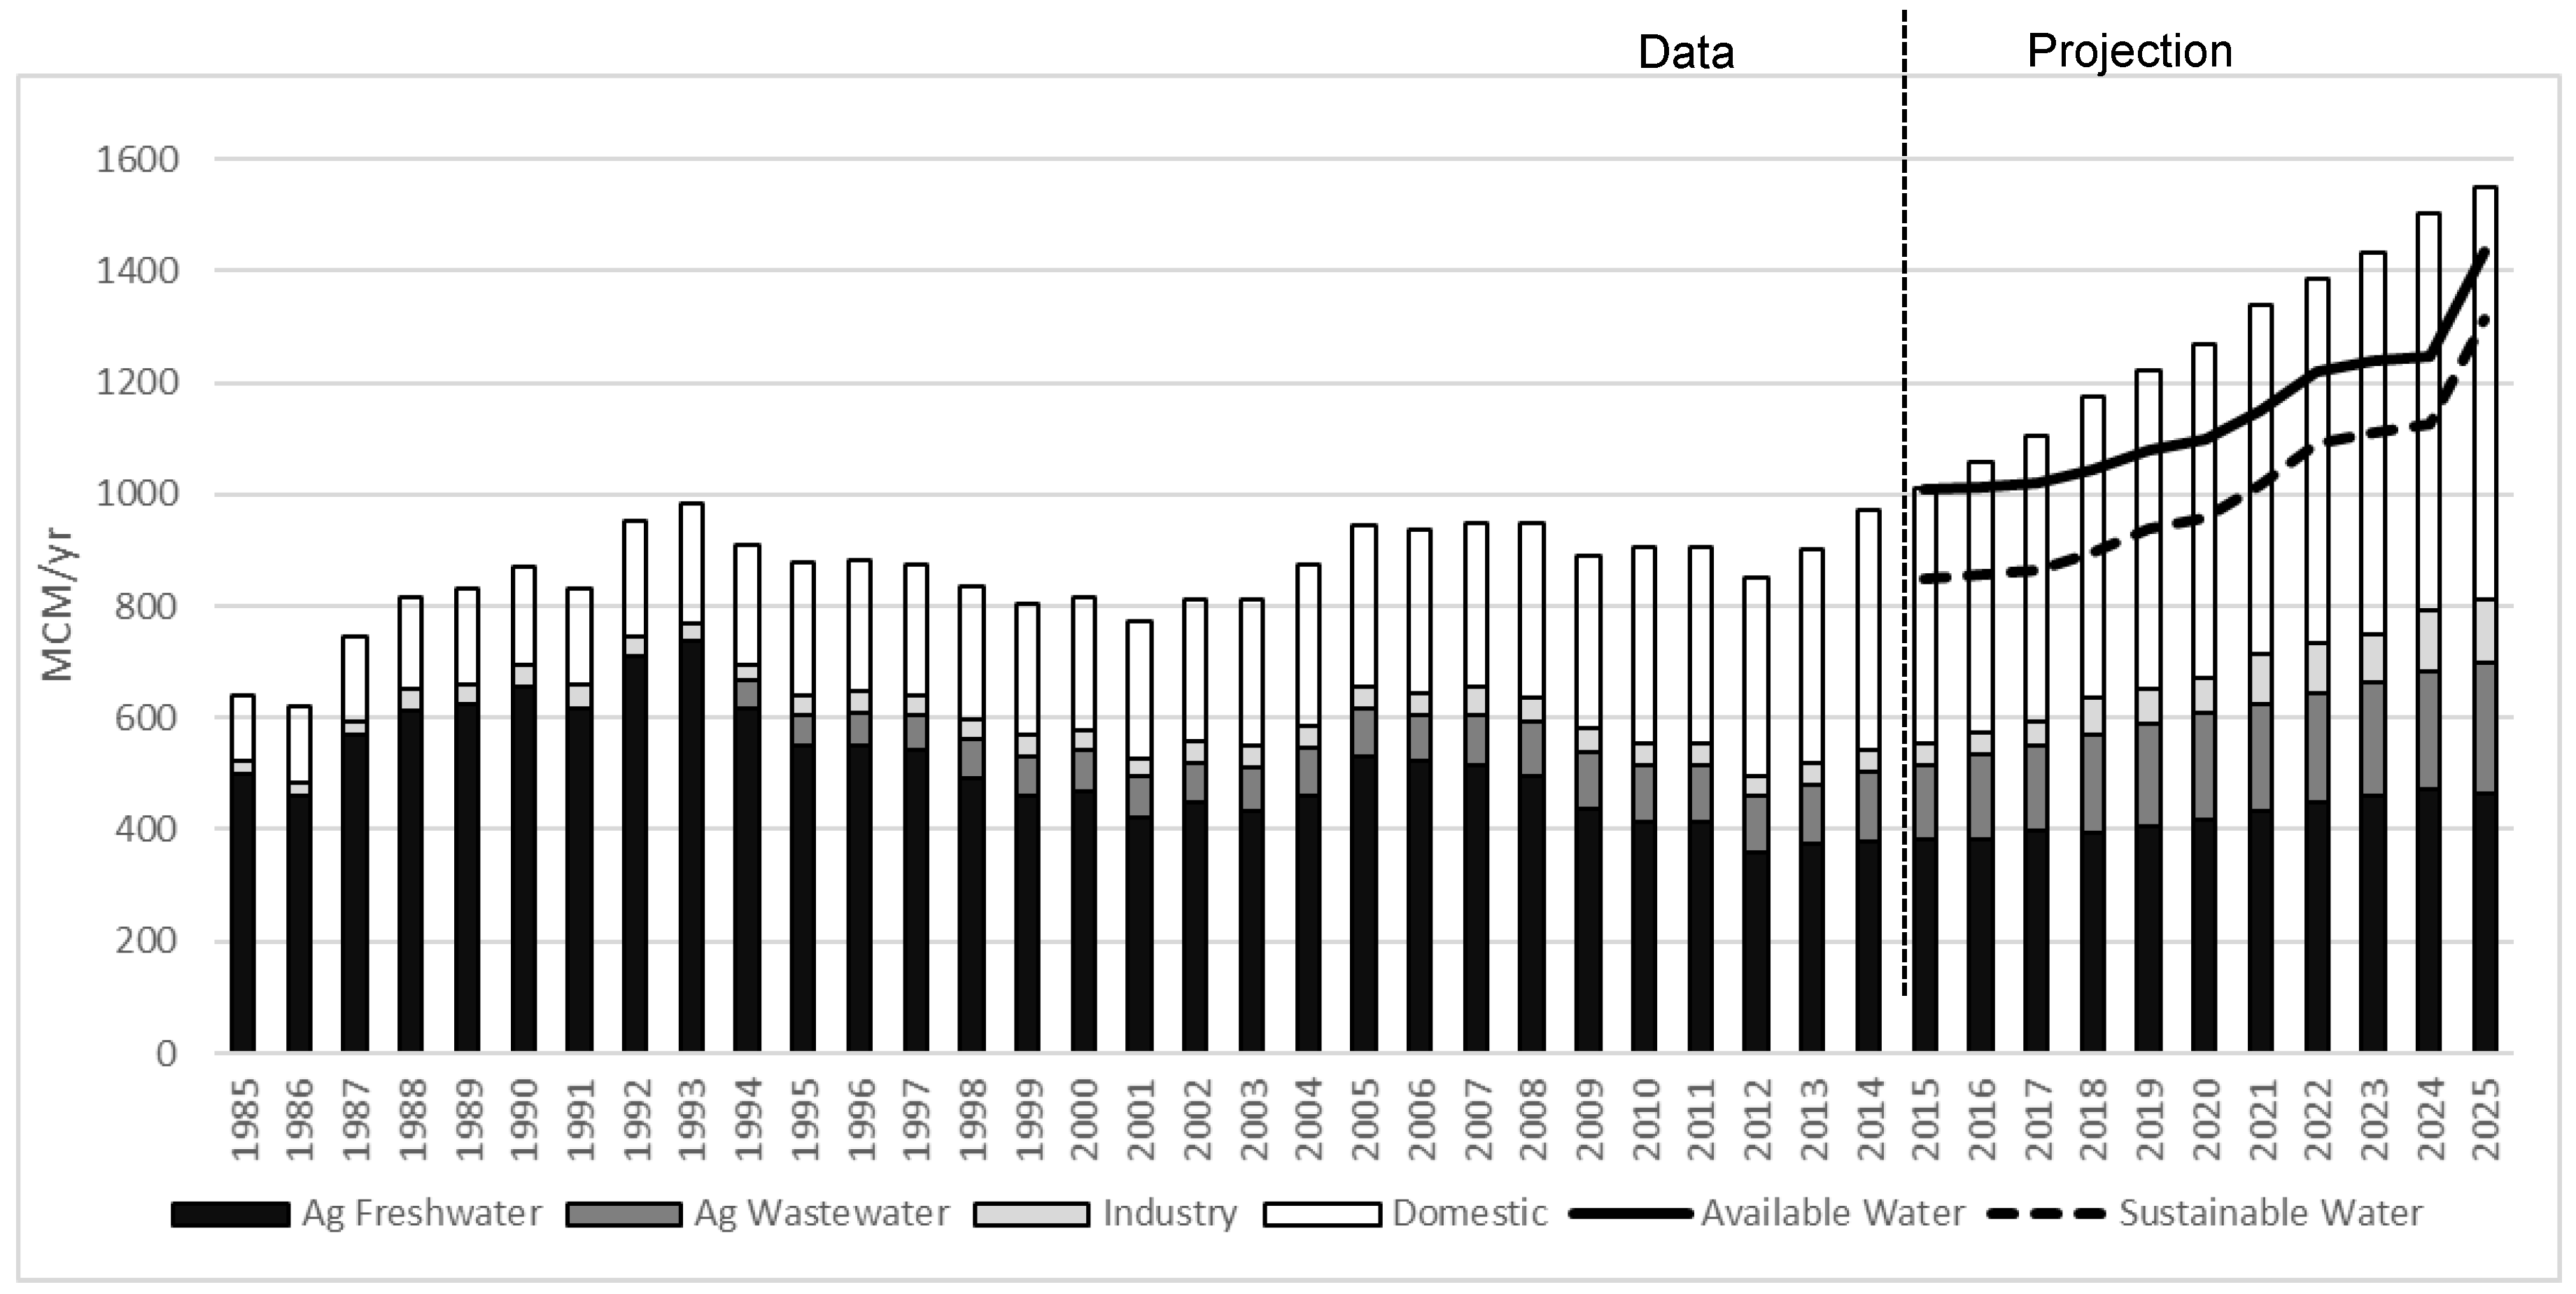
Despite these planned additional resources, there is still a significant deficit between anticipated demand by 2025 (Yorke, 2016) [10]. Figure 3 uses historic data from 1986 to 2015, combined with the authors’ extrapolation of demand from present usage levels to meet with MWI’s forecast demand by 2025, plotted with MWI’s annual projection of available water. The MWI provides data for available supply and anticipated demand, but does not project where the shortfall will impact, or how new supplies will be distributed across sectors. As a result, there is no attempt by the 2025 plan authors to forecast how newly available water will be allocated across demands under conditions of supply deficit. In the absence of further data, our analysis here assumes a linear growth in demand from actual current to theoretical future demands. A significant deficit between available water and cross-sectoral demand exists in 2025, based on current resource projections. Given the gap between future supply and projected demand, this paper considers how a reduction in agricultural water demand, based on moving towards regional best practice in agricultural water productivity, could enable enhanced agricultural water decoupling, and thereby ameliorate Jordan’s future water resource deficit.
This paper takes a first step towards establishing a potential reduction in agricultural water requirements in Jordan (or enabling growth within current water resource allocations), by examining differences in water application per unit crop output across the Jordan Basin. The analysis is focused on 14 crops that together comprise over 90% of production tonnage and water application in both Israel and Jordan, and 86% of Jordan’s accounted water application as of 2010. Where data is available, the analysis also includes an assessment of agricultural water productivity within Palestine (considered in this paper as Palestinian-controlled/operated farms within the West Bank and Gaza Strip).
Two methods of assessments were pursued: The first to obtain an approximate aggregate national picture of relative water application per unit crop output; and the second to compare trends at the farm level. The two methods were also intended to verify the directions in differences of national level trends, and to provide an initial assessment of uncertainty in any trends being identified.
2. Methodology
The first methodology involved a comparison of agricultural yield per unit water application based on national average numbers, as assessed on a national level using aggregated country-specific yield data. Much work on crop water fluxes has been carried out to date at a regional scale, using large gridded, physically-based models (e.g., Hoff et al. 2010 [12]). It is recognised that this methodology ignores variations in crop water requirements in different regions of the countries, predominantly because of variations in topography, rainfall depth, soil conditions, and humidity. The methodology is adopted, however, as there is no long-term breakdown of annual production at the sub-national scale, and consequently no reliable means to weight national production by different hydro-climatic conditions. The first stage of the analysis involved deriving agricultural water productivity numbers from secondary sources and combining them with annual national tonnages.
For Israel, extension service data was assembled for 52 crops for all regions where the crops were grown, and yield per cubic meter of applied water was calculated for each region, using the most up-to-date value available from 2000 to 2015 (Ministry of Agriculture, 2016 [13]). The regional values were then averaged (using the arithmetic mean). As a result of the lack of regional crop distribution, no weighting could be applied to this calculation to capture regional bias in crop growth location. The average water intensity was then multiplied by reported national annual production data from the Israeli Central Bureau of Statistics (personal communication). Crops not accounted for in the calculations included ornamental flowers (water data unavailable) and feed crops (not irrigated). See Appendix A for water intensity calculations for most crop types.
For Jordan, agricultural water intensity was derived through a similar method, but using total water application and area data from International Resources Group (IRG) and Karablieh (2012) (Tables 23, 25, 27, and 29) [14], whose data is based on an analysis of cropping carried out in 2010, combined with official production tonnages. Fifty-five crops were available from this study in categories appropriate for reported national crop tonnages (See Appendix A for water intensity calculations). Olives, however, are produced under both irrigated and rain-fed conditions, and calculations on crop per unit water required isolating the irrigated production only. The IRG and Karablieh (2012) publication included its own assessment of rain-fed versus irrigated production proportions for 2010, and this proportional split was used to attribute an annual production proportion to irrigation. As with Israel, a national average water application and yield number was calculated, which, for Jordan, involved combining environmental diverse agricultural environments spanning the Jordan Valley and highlands. Again, this was necessary as annual tonnage reports do not attribute production to the different regions. No sector-wide secondary data on crop yield and water application was identified for Palestine.
In order to validate the national crop level numbers and provide an effective comparison between Israel and Jordan, especially given the impact of national averaging of the water numbers, the water application numbers were combined with historic agricultural tonnage. The results are shown in Figure 4 and Figure 5. Figure 4, for Israel, shows significant under-estimation of agricultural water application, when derived from crop water needs multiplied by annual tonnage, by over 40%. A slight increase in efficiency is seen based on the simulations, with simulated agricultural water use growing faster than reported agricultural water use (gradient y = 6.83x vs. y = 3.4x).
For Jordan, there is a strong efficiency gradient in the simulated value, indicated by a lower simulated water application historically (with static benchmarking, smaller historic yields would result in simulation of lower historic water use, whereas in reality, the historic water application would be higher for a given yield). Importantly, for the benchmark year of 2010 of the agricultural water data, there is a tendency towards convergence. For the year 2010, the simulation over-estimates agricultural water application by 72 MCM. This value is close to the 110 MCM of illegal groundwater abstraction that has been eliminated (Obeidat, 2016) [15]. Therefore, simulation over-estimation for the benchmark year should be expected given that reported tonnage includes all production, regardless of legality of water source.
The accountable discrepancy between simulated and official data in Jordan means that the average water application numbers are accepted for the purposes of this study. For Israel, there is a clear and unexplainable under-estimation of agricultural water application, which will in part be because of national averaging used in the methodology. Making allowances for crops not accounted for, (including cut flowers) and for water allocated to livestock and non-irrigated agricultural purposes, the agricultural water application numbers for Israel were inflated by 42% to ensure a highly conservative comparison between Israeli and Jordanian water application. This percentage was determined through a three-year moving-window average comparison between the simulated and official agricultural data. Across the entire 16-year time series, the discrepancy was 48% between the simulated and official agricultural allocation. However, focusing on the final five years of data (i.e., allowing for slight efficiency gradient), this moving average discrepancy was 42%. The simulated figures were thus inflated by 42%, resulting in the smallest sum of differences between simulated and official agricultural water over the 2009–2013 period. From the national simulations in Israel and Jordan, the basket of 14 crops (Table 1) was selected as the focus of deeper water analysis, and the identification of comparative trends across the region.
A second assessment methodology aimed to verify the trends indicated by the methodology above. This involved gathering primary data from farm-level structured interviews carried out in the three study jurisdictions during late 2016. Farmer-based, semi-structured interviews have recently been used successfully by O’Keefe et al. (2016) [16] to understand farmer irrigation practices. Our interviews were carried out in summer 2016, comprising 19 respondents in Jordan, focusing on the North and Central Jordan Valley, along with farms near Amman; 12 farm interviews in Israel, focusing on the centre and north; and 27 in Palestine (comprising 22 interviews in the West Bank and 5 in the Gaza Strip). This farm-level analysis was compared with secondary data to confirm whether or not the trends seen in the secondary analysis were correct, as well as to identify variations in performance between individual farms. The farm interview questions elicited information of crop areas, yield per dunam (1 dunam = 1000 m2, or 0.1 ha), and water application per dunam per year or growing season (then converted to annual numbers). Information on farm gate crop prices were also elicited, along with sources farmers used for agricultural production, irrigation methods used, and the role of agriculture in the farmers’ economic lives.
A further series of semi-structured interviews with eight policy stakeholders and research scholars in Jordan was carried out in August 2017, reflecting on the initial empirical findings and exploring the institutional settings and opportunities for change along the lines identified through the study. This forms a final element of research on institutional barriers and opportunities for improved water productivity. All interviews were approved by the ethical committee of the School of Anthropology and Museum Ethnography Research Ethics Committee, University of Oxford, under references SAME_C1A_16_050 (for 2016 farmer interviews) and SAME_C1A_17_029 (for 2017 policy interviews), and carried out under the procedures laid out by the researchers and approved by the committee.
3. Results
This section reviews the results from the secondary and primary data, demonstrating the differences in water application per ton of production between Israel and Jordan. The farm-level primary analysis also illustrates the uncertainty associated with the direction of trends.
3.1. Secondary Agriultural Water Data Analysis
Table 1 shows the results of the secondary analysis for the 14 crops. For the 508 MCM (average 2009–2013) accounted for by the 14 crops selected in Jordan, agricultural water application may be reduced by up to 168 MCM/yr if Israeli trends in water application and crop yield were targeted. Key instances of lower water application appear in tomatoes, apples, clover, and olives. Potatoes and cucumber production in Jordan appear to be more water productive than in Israel, although in the case of potatoes, this is likely entirely due to the adjustment of the Israeli agricultural water figures discussed above.
Clover production is not irrigated in Israel as this is not considered an economically effective use of water. Feed crops are thus only grown in areas with sufficient rainfall, and a large majority of national needs are imported (Gilmont, 2014) [1]. Meanwhile, the data for Jordan suggests that the country devotes around 71 MCM/yr to irrigate clover for animal feed. One of the farmers interviewed indicated that much livestock feed irrigation is carried out by livestock farmers themselves to avoid purchasing feedstocks on the open market. While interview data suggests that some of this irrigation is carried out with treated wastewater, even this resource has an opportunity cost associated with it, especially in its potential use on tree crops. Review of assessments of agricultural land in Jordan suggests that sufficient rain-fed area theoretically exist nationally to support more rain-fed agriculture, including feed crops. Boller et al. (2005) [17] observed that Trifolium Clypeatum is grown near the Dead Sea in Israel in areas of less than 300 mm/yr rainfall. Al-Jaloudy (2006) [18] notes that 5.9% of Jordan’s land area receives 200–300 mm of rainfall, the ‘marginal zone’ just above the threshold for aridity. Meanwhile, the total cultivated area in Jordan (combined rain-fed and irrigated lands) comprises only 3% of the national area [18]. This discrepancy suggests that further research is necessary into potential suitable rain-fed areas that could support feedstock, although it is likely that these areas would not be proximate to livestock farmers. Reducing or eliminating clover irrigation through either rain-fed production or assistance through enhanced import substitution would likely require structural support to assist farmers with purchasing feedstocks, and to ensure that supply and affordability does not place undue strain on livelihoods. Changes in currently irrigated feedcrops would, however, appear to be an important avenue to consider in enhanced agricultural water decoupling in Jordan. Savings of 71 MCM from such changes to rain-fed feedstock production would require significant regulatory power if these resources are to be mobilised outside the agriculture sector, as farmers would likely seek to grow other crops with their water and land resources. However, even this recapture of ‘saved’ water would assist decoupling in providing opportunities for support for the cultivation of crops that might enhance national food security or income in the agricultural sector.
3.2. Primary Interview Agricultural Water Data Analysis
The primary data collection included data on farm-level information on water application and yield. As per the secondary data, these were averaged across the sample, not to assemble a national average, but rather to identify a general direction of comparison between crops’ water productivity in Israel and Jordan, as well as provide insights into behaviour in Palestine.
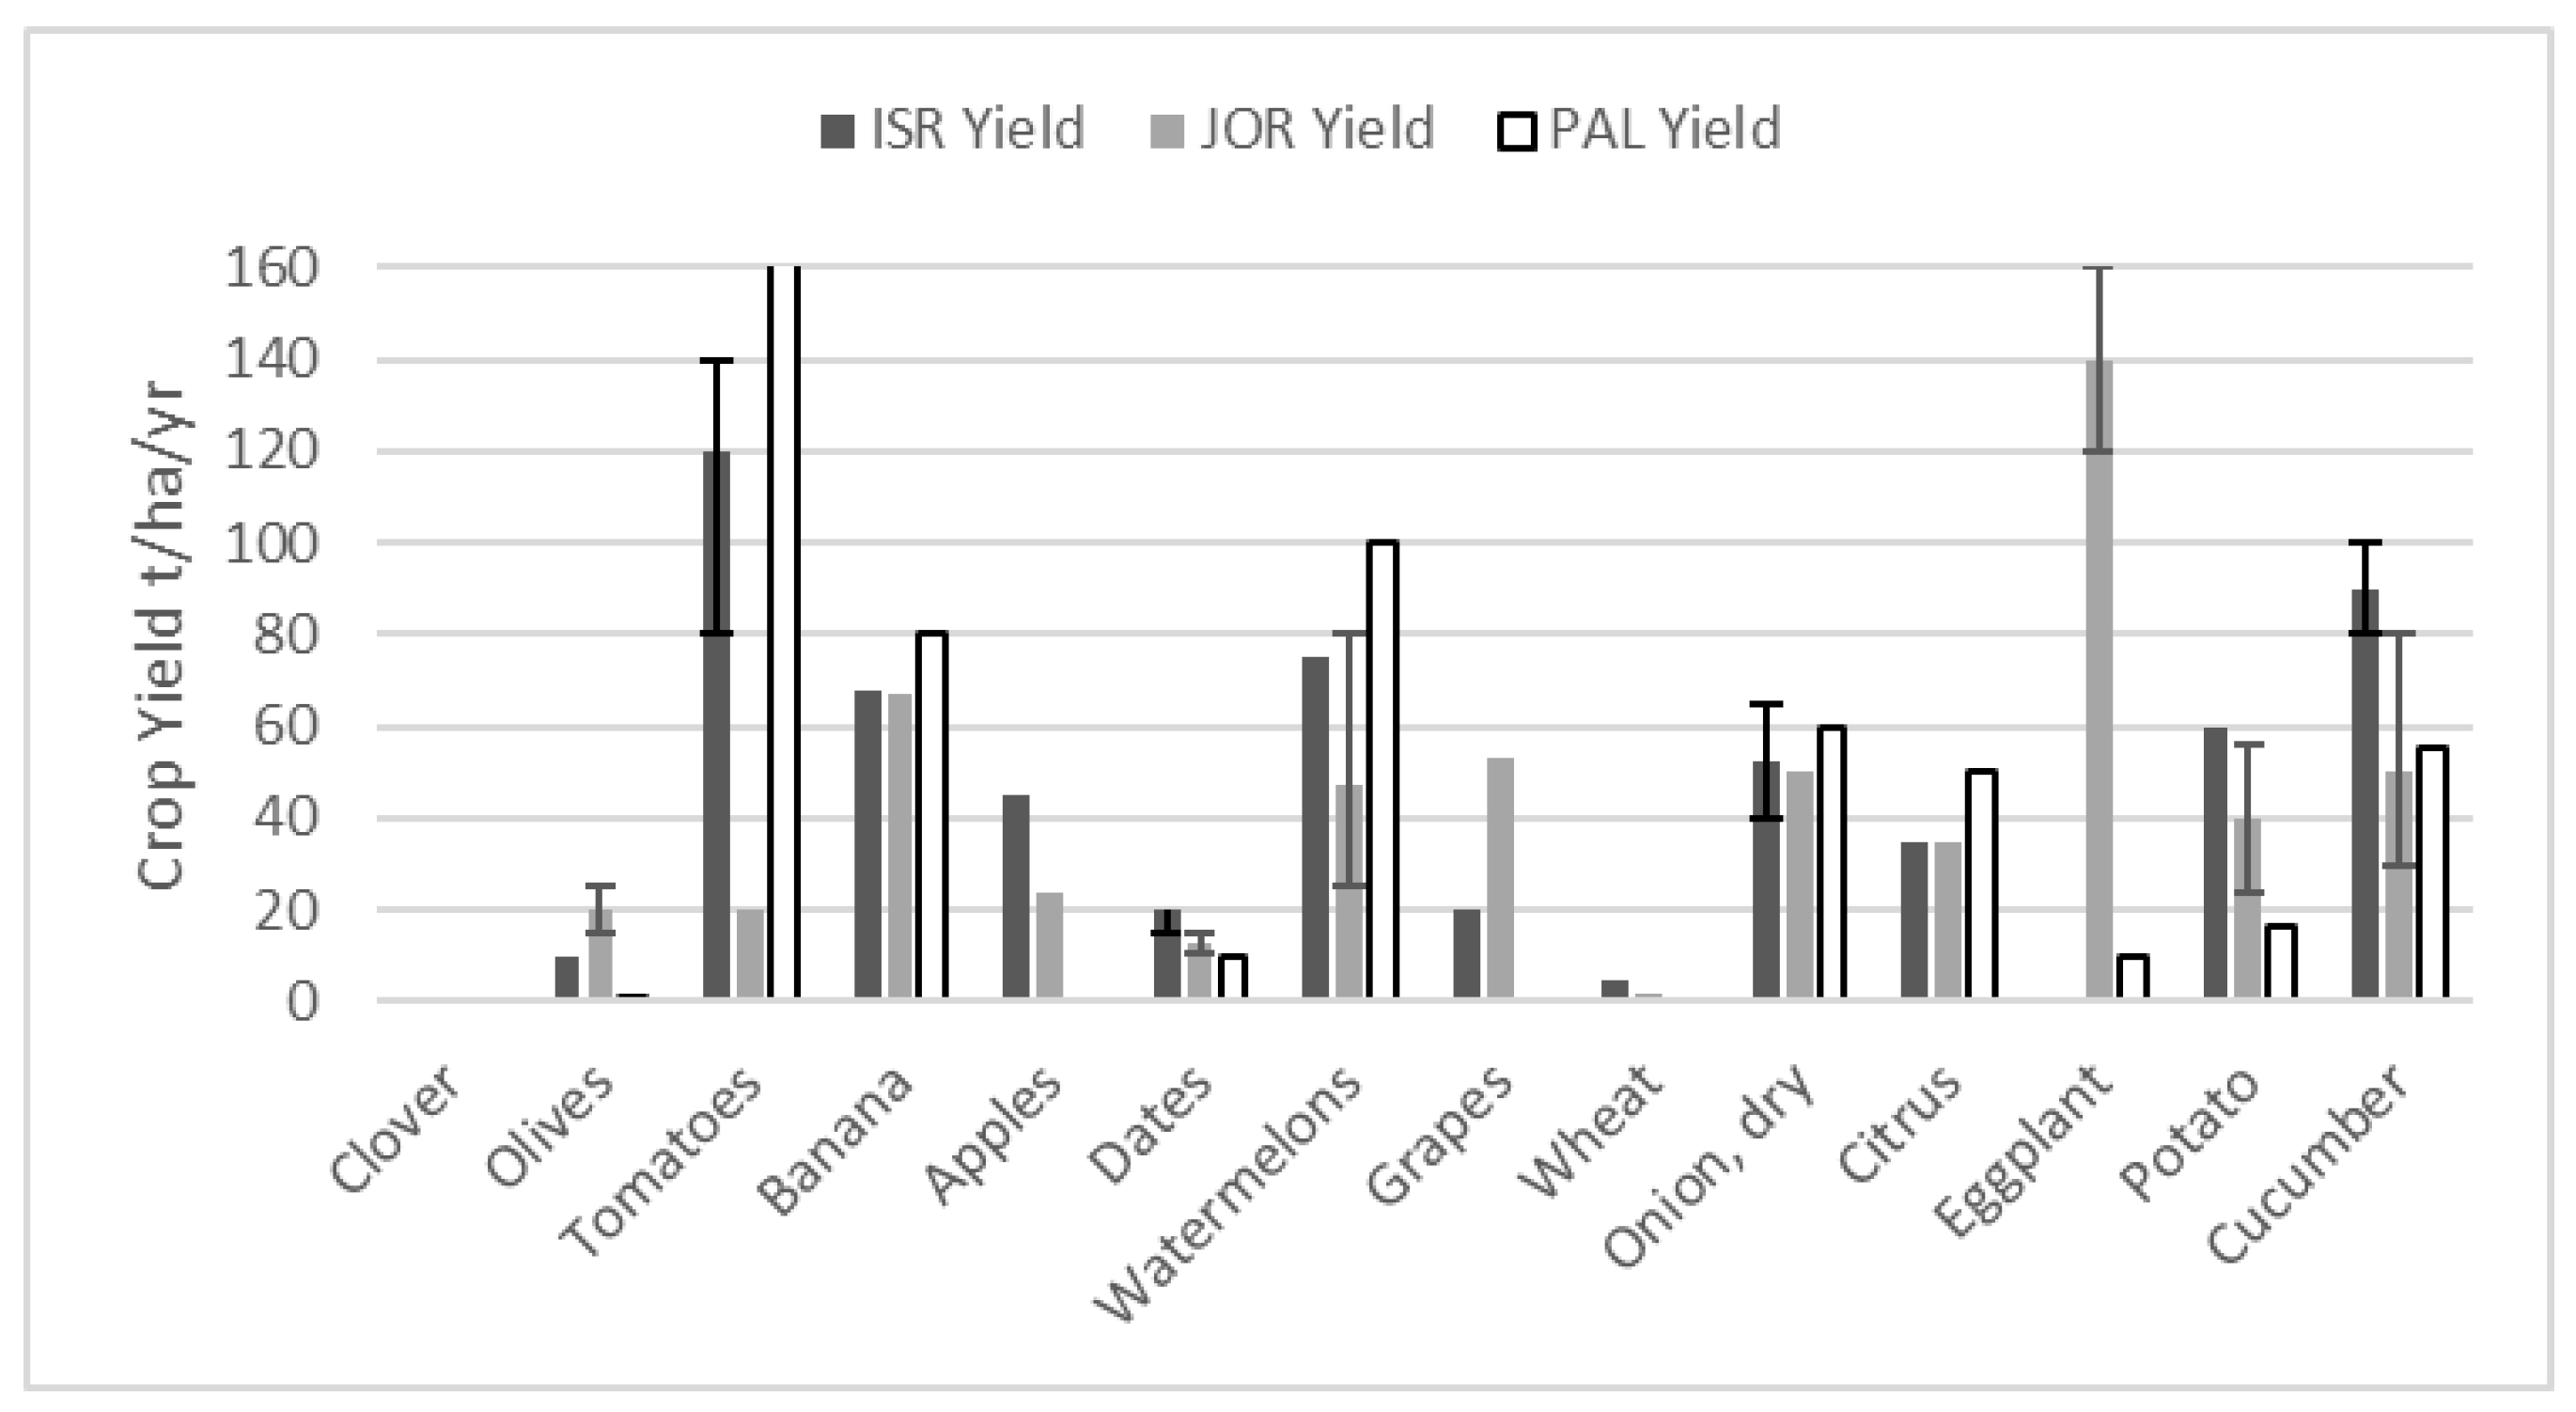
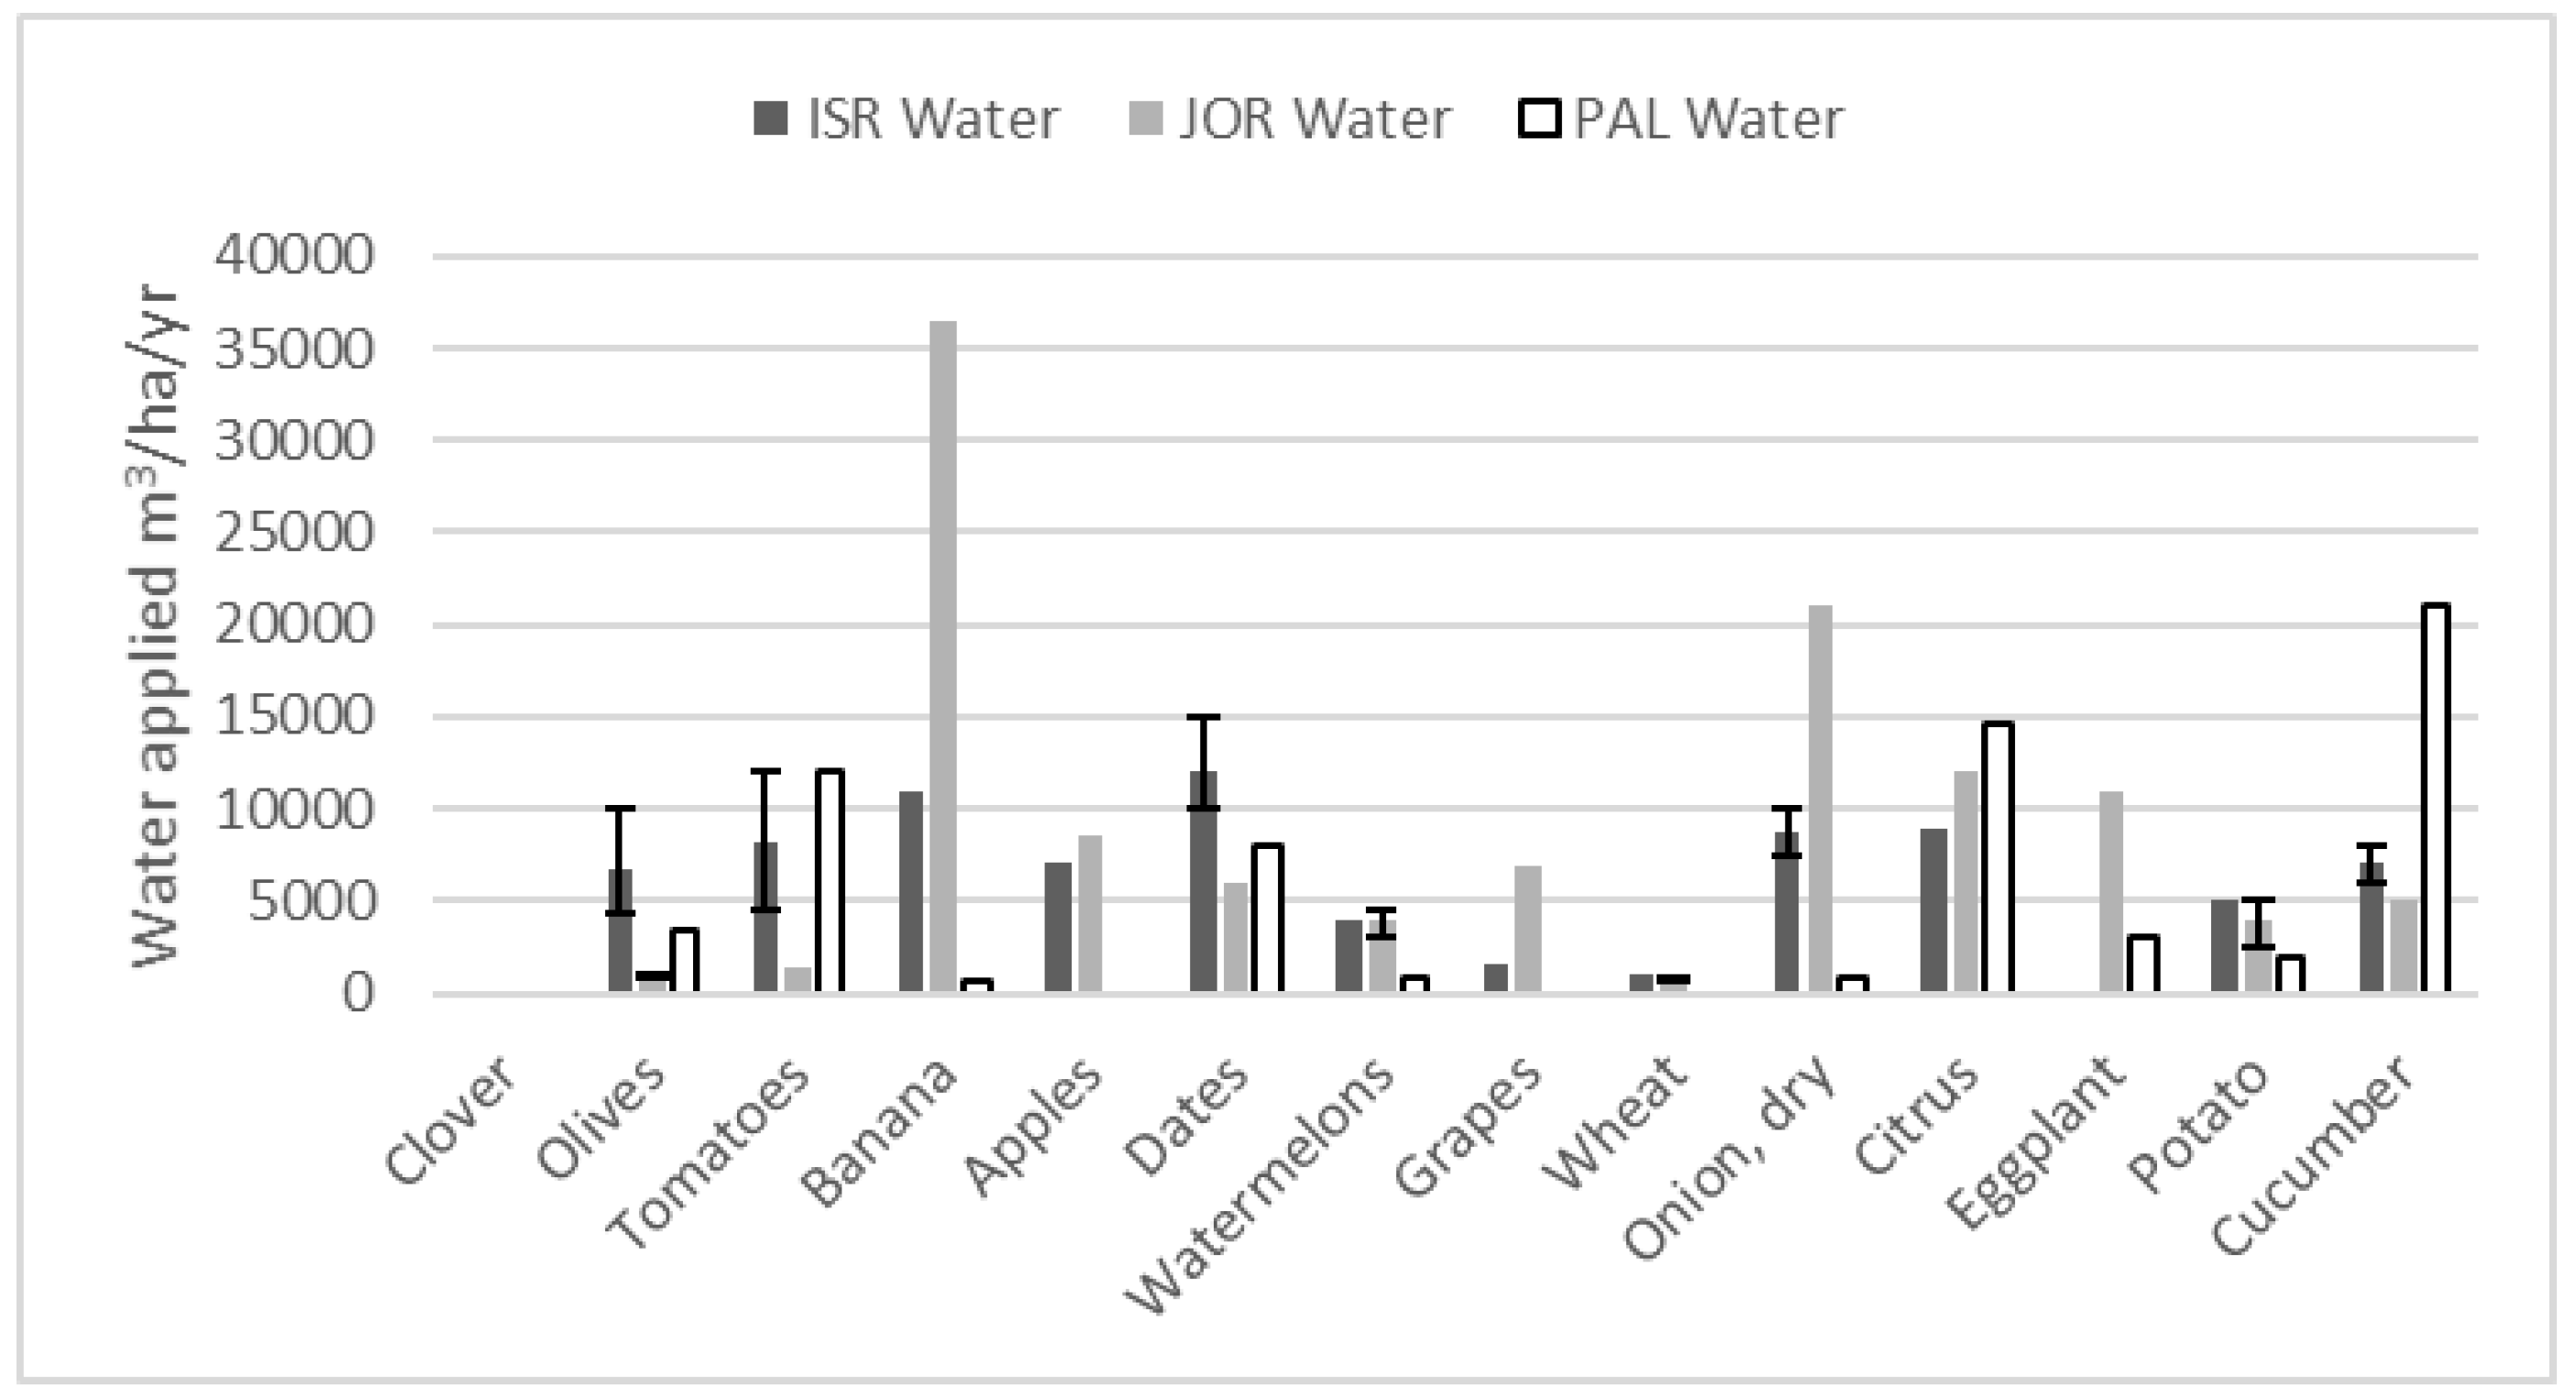
The results are shown in Table 2, while Figure 6 and Figure 7 show the ranges (average, maxima, and minima) for yield and water application per hectare across the farm-level sample for the 14 crops investigated. Table 2 also includes extension service data for Israel for the same regions as the farm-level data, enabling comparison between farm-level results with recommended best practices.
The water application values derived from farm interviews are generally lower than those suggested by the national average data. For Israel, this is likely in part because of the artificial adjustment of the numbers used in the calculation as discussed above. However, in the case of dates, potatoes, and grapes, farmer reported data is well below the uncorrected, non-averaged extension service data for the specific region in which interviews were carried out. The general direction of the evidence, however, suggests that Israeli farmers have lower application per unit yield when compared with neighbouring farmers. For Jordan, the farm-level results indicate that there has likely been some improvements in either water application and/or yield since the 2010 fieldwork of IRG and Karablieh (2012) [14]. Particular region disparity is noted for onions and bananas, which appear to have twice the water application in Jordan than in Israeli, for similar reported yield. It is possible that this result is skewed by only having one farm sample for each of these crops in Jordan, as a result of limited resources available for this study to date.
For tomatoes, banana, apples, wheat, onion, and citrus, Israel demonstrates, as with the secondary data, lower water applications than Jordan. For other crops, farm-level evidence suggests that Jordan may exhibit lower water application than Israel, especially in the case of olives and dates, where water application in Jordan is much lower. Follow-up questioning with farmers indicated that, while the fieldwork had isolated producers of irrigated crops, farmers were actually practicing rain-fed cultivation with supplementary irrigation. Yield data for dates is similar for Israel and Jordan (Figure 6), but water application is much lower in Jordan (Figure 7). In follow-up discussions with the Israeli agricultural extension service, it was confirmed that supplemental irrigation of rain-fed date and olive production in the North Jordan valley was possible, but according to their experience, was not profitable. Different species may play a role here, especially in the case of olives, where Jordanian experts suggested that much Israeli production was derived from more water-intensive species. Clover could not be tested at the farm level, as we were unable to access clover-producing farmers; the agricultural extension service, however, confirmed this as a rain-fed crop in Israel.
Analysis of Palestinian water productivity results finds significant potential for lower water application in olives, citrus, and cucumbers, when compared with Israel. For cucumbers, the farmer interview data suggests that water application is very high when compared with both Israel and Jordan. For citrus, while water application is high, reported yield is also higher than its neighbours, possibly because of limited land availability in the Gaza strip. By contrast, reported olive yield is low, while water application per hectare is comparable to the lowest water values reported for Israel, equating to a much higher water/crop ton. Other Palestinian crops appear to be far more water productive than their Israeli neighbours, although some results seem unusually low, especially for bananas, watermelons, and onions. The result for the banana crop does raise questions pertaining to the reliability of the data, as the single Palestinian banana farm surveyed was in an area receiving around 230 mm/yr rainfall, well below the depth required for rain-fed banana cultivation. The farmer also noted a significant decline in banana plantations in recent years due to the water requirements of the crop. It is suggested that it is likely that the reported yield and water data for bananas are not accurate. The results for olives, also when combined with supplemental irrigation practices, are also of questionable reliability.
While the interview results show some conflicting results with the secondary data, and are cause for concern over the reliability of the Palestinian data, there are some important implications to be drawn from the results. Importantly, for six crops, the direction of differences in water application are the same in both primary and second data between Israel and Jordan, thus there would appear to be relative confidence as to the secondary national trends. This represents 65 MCM/yr of secondary data reduced water application that appear reliable (out of the 97 MCM/yr non-clover related reduced application). Therefore, it is suggested that differences in water application due to non-clover related irrigated crops between Israel and Jordan may be between 65 and 97 MCM/yr, when scaled to Jordanian production tonnages, pending further in-depth research (discussed below).
3.3. Primary Interview Data Analysis of Socio-Economic Farm Context
This analysis draws on the interview data to understand some of the contextual differences in which farmers in the three jurisdictions operate, and the possible impact this may have on water productivity. The interviews included short-answer questions on farm size, education, income sources, perceptions on the future of farming, irrigation technology, and agricultural information.
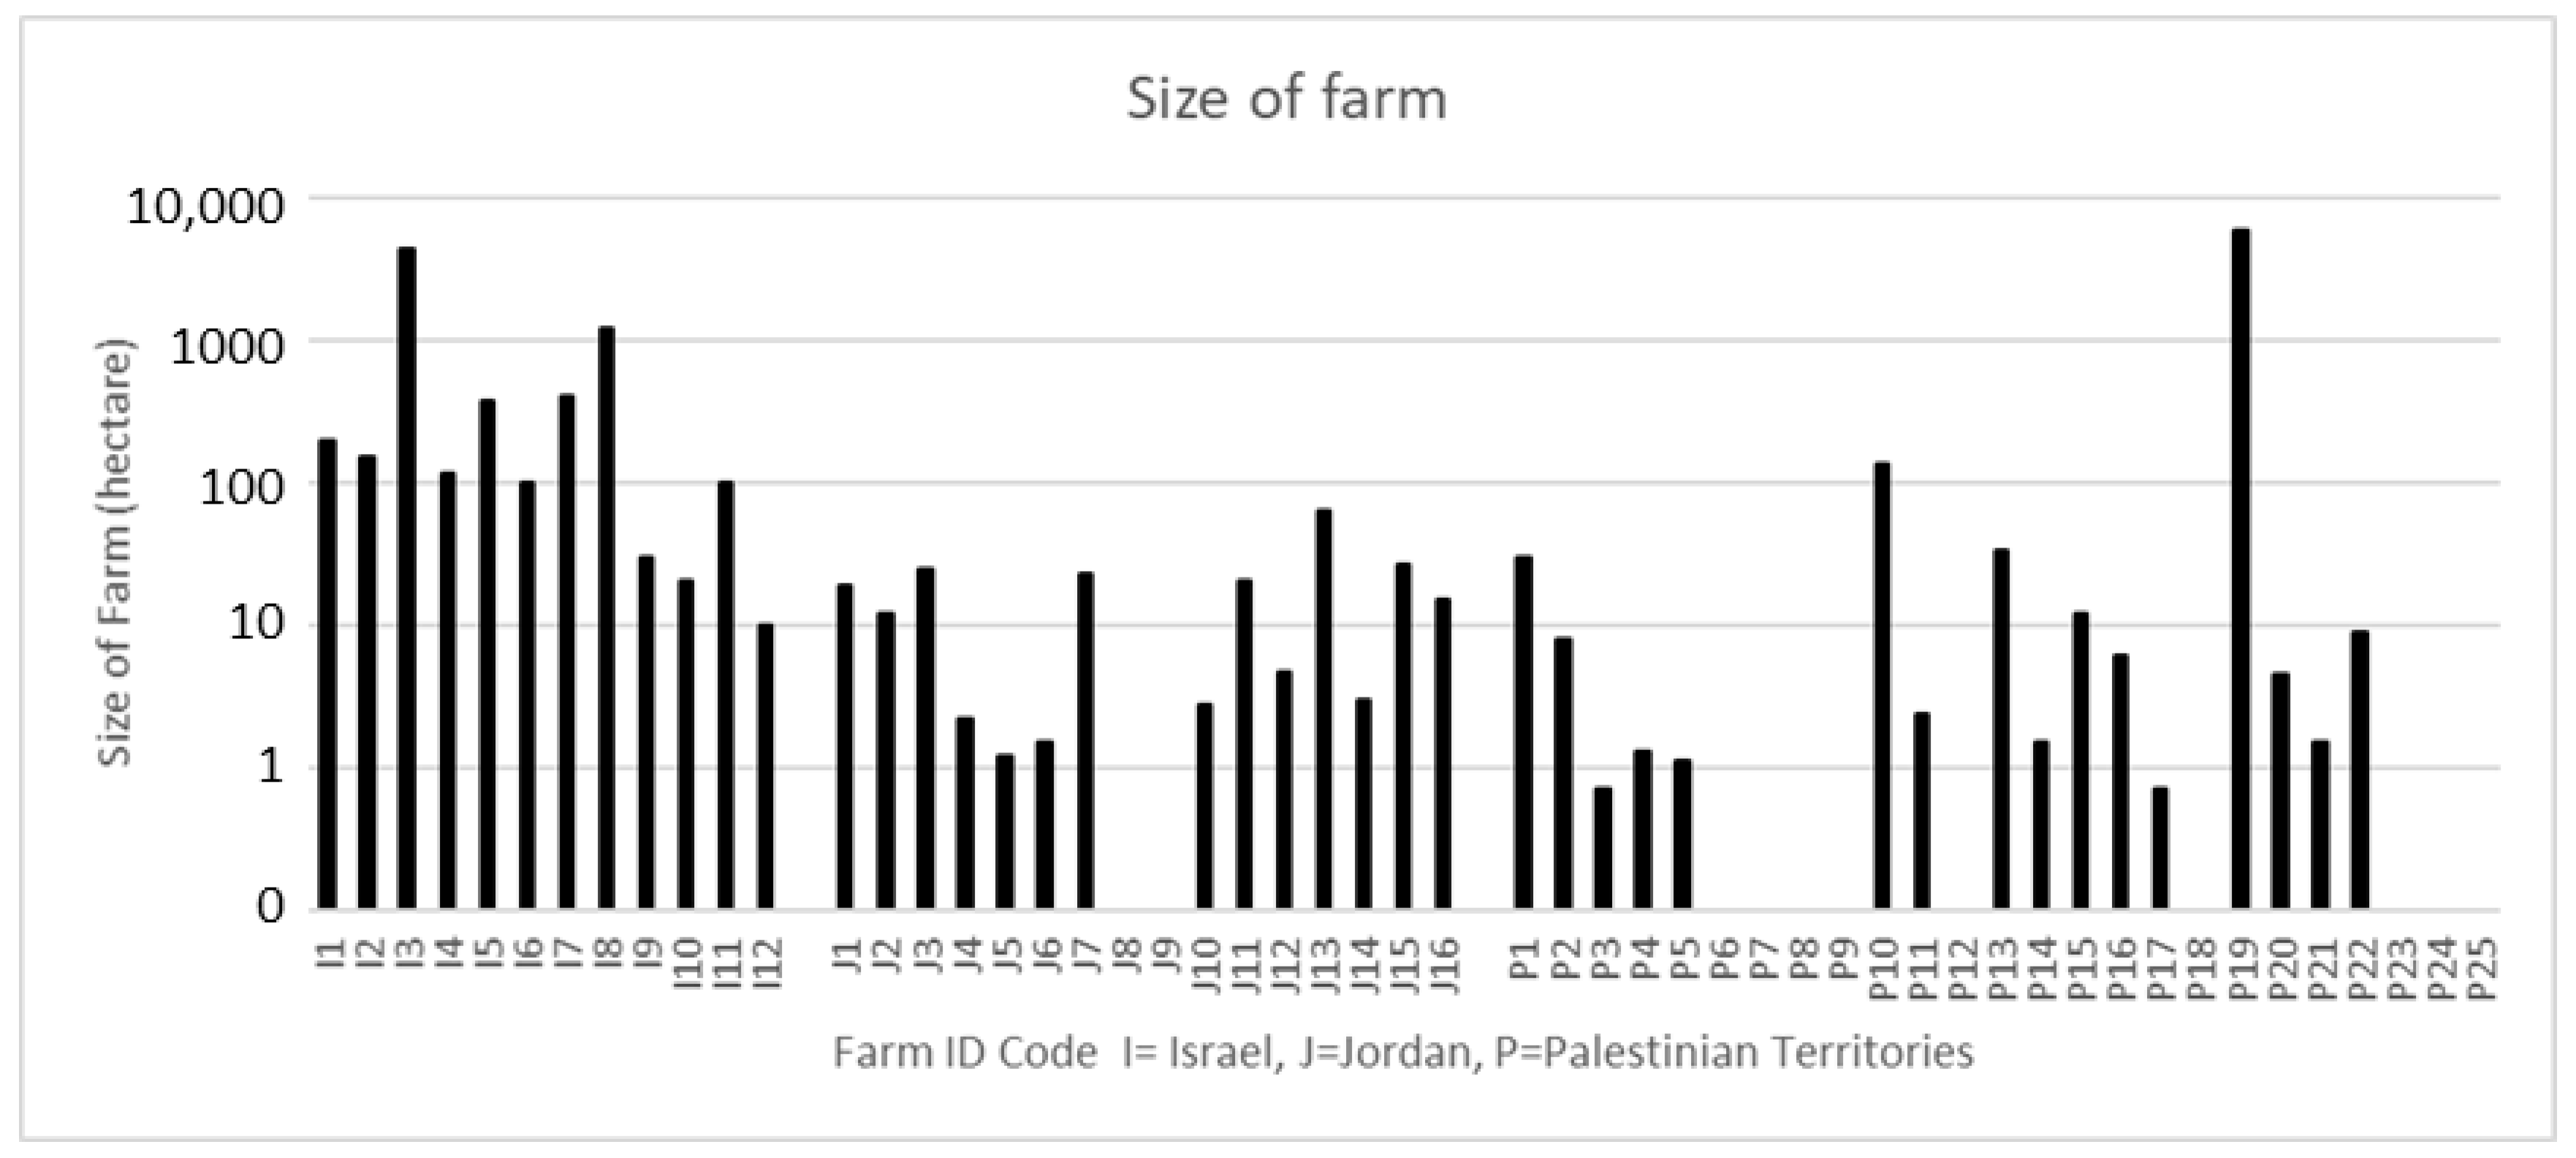
Israeli farmers generally operate larger farm areas than Palestinian or Jordanian farmers (Figure 8). This potential provides an economy of scale in both operation and investment at the farm.
Nearly all Israeli farmers interviewed are dependent on agricultural activity for a majority of their income. For most Palestinian farmers, agricultural activities represent their main source of income. For Jordan, around 50% of the farmers interviewed had significant other incomes, including pensions from previous employment and property investments/trade. The presence of alternative income in the Jordanian case can be considered as potentially reducing the importance of increased agricultural returns, especially in the case of ‘hobby farms’ (Al-Rimawi, 2012) [19]. On the other hand, it is possible that alternative higher value income streams might enable larger investments than would be possible through agricultural returns alone. Investment decisions might also relate to the perceived sustainability of the agricultural industry, which is questioned by reliance on other sources of employment. While nearly all Israeli farmers believed that the next generation would enter farming (though possibly following earlier careers elsewhere), over half the Palestinian and Jordanian farmers surveyed perceived a lack of interest by the next generation, compounded by a lack of governmental promotion of agriculture. For Palestinian farmers, concerns over future water availability, yield reliability, land access, imported products, climate change, and limited donor support for the sector also contributed to the pessimistic outlook.
Farmer-reported adoption of irrigation technology did not produce notable differences between the three jurisdictions, with a mix of drip and sprinkler irrigation reported in nearly all cases. However, field evidence in Jordan suggests that some Jordanian ‘drip’ irrigation is, in the case of fruit trees, actually basin trickle irrigation, without the close application of water directly to the soil used by Israeli farmers. A difference in ground cover was also noted for citrus, with Israeli groves being mulched, while some Jordanian citrus groves were observed as having grass or scrub cover, likely consuming additional irrigation or rainfall moisture. For banana crops, the use of netting to change local canopy humidity is near-universal in Israel, but is only occasionally adopted in Jordan. Palestinian farmers raised an important observation about irrigation timing, highlighting that intermittent supply to many Palestinian users meant that farmers had to apply water to crops when it was available, rather than when the crops could optimally use it or needed it.
The role and use of government-sponsored agricultural extension support was also found to vary. Israeli farmers are well-supported by, and strong users of, the Ministry of Agriculture Extension service, which possesses field and research branches in each of the key agro-climatic regions. Palestinian farmers are also well served by the 300 extension service field staff, and farmers engaged with their advice. The Jordanian extension service, by contrast, suffers from lack of capacity, with a mere 54 field staff for the entire country. This limits the available advice and opportunities for engagement, and the depth of region/crop specific timely advice that can be provided. In the opinion of some farmers, certain extension agents lacked proactivity and indeed, some newly graduated extension officers lacked experience vis-a-vis the farmers they advise. Five farmers in the Jordanian sample reported actively avoiding advice from the extension service due to past poor experience.
The above analysis indicates that there are notable, although uncertain, differences in agricultural water productivity between Israeli, Palestinian, and Jordanian farmers, as well as socio-economic context. For Jordan, the potential difference in water productivity has the ability to make an important contribution to its future national water security. To this end, the next section discussed a further round of interviews that examined the potential and barriers to improve water productivity uptake in Jordan.
3.4. Interview-Based Analysis of Institutional and Policy Barriers and Opportunities to Improved Water Productivity
A further stage of this research involved discussing findings with policy practitioners and high-level stakeholders to elicit attitudes towards water productivity as a key instrument in Jordan’s water future. Such research was not carried out in Palestine as initial data deficits obstructed a meaningful discussion to this end. Jordanian interviewees comprised individuals from within the water and agricultural bureaucracy, together with other academic and professional experts, and eight interviews were carried out during August 2017. The interviews covered a range of issues relating to future water challenges in Jordan, and the potential for new efforts in agricultural productivity to play a role in future resource management. The discussions also examined the institutional foundations of water and agricultural management with regard to improved water productivity.
Key water challenges that were highlighted included climate change and its potential role in reducing both rainfall and available water supply, as well as in increasing water demand by crops due to higher temperatures and CO2 concentrations (noted by two interviewees). Domestic water allocations were also anticipated to increase in the coming years, as a result of both population growth and a stated government intention to increase per capita supply and supply reliability (noted by two interviewees). Three interviewees observed that the challenges are compounded by the Syrian refugee crisis and the increased pressure it has create in host communities. The refugee pressures especially have generated urgency to increase water supply capacity. Five interviewees highlighted that the resultant impetus to increase the use of treated wastewater in agriculture will also require improvements in wastewater quality to enable wider use of the resource without, as one interviewee stressed, a build-up of salt in the soil.
The interviews revealed a significant tension in perceptions over the role of improving agricultural water productivity as a contributing mechanism to assist in adjusting future water allocations. Three interviewees supported the potential of improved water productivity, and one provided an example of high-tech hydroponics near Mafraq in Northern Jordan, where the production of (predominantly export) tomatoes might rank as the most water productive in the region. This case demonstrates what can be achieved with high levels of investment and a guaranteed market, as well as the internal best practice learning that might occur across Jordan. Jordan’s agricultural risk fund, while no longer providing explicit support for water-related investments, provides insurance for crops grown in appropriate regions, thereby encouraging improved sectoral resilience to environmental shocks. This indirect incentive to adhere to agricultural zoning should result in more appropriate use of water and greater returns per unit application. Furthermore, a Jordanian agricultural and water researcher observed that, with finite water available for agriculture, increased output in the future will necessitate improved productivity of water within agriculture. He noted further, however, that this needed to be part of a holistic cross-sectoral strategy, and would take 10–15 years to achieve, giving time and support for farmers to adapt.
Against the observed potential, a number of obstacles were raised. In particular, that poor agricultural performance is largely a result of ingrained behaviour by farmers. Indeed, an official within the water bureaucracy noted that force of habit and resistance to change is a key contributor to low water productivity. A forceful argument put forward by a Jordan Valley agricultural water representative highlights that current agricultural allocations to the Valley were around 60% of those mandated by policy. It would, therefore, be politically unacceptable to cut allocations further and force reduced water application in the Jordan Valley without impeding crop production. Therefore, it is argued that current performance indicates that tremendous efficiency is being achieved. By contrast, the Jordan highlands might have much greater improvements in productivity potential. This argument in the Jordan Valley, however, counters the empirical evidence presented above, that when compared with the environmentally similar context of Israel, it is possible to reduce water application per unit crop output. The argument also runs counter to the arguments by professionals discussed above, that improved productivity will have to feature in the future.
Existing regulatory arrangements and operational procedures were highlighted as a further obstacle to knowledge-led innovation. Water management and crop-choice decisions are embedded in complex webs of competing institutional commitments and customary expectations, echoing the findings of Lach et al. (2005) [20] and Rayner et al. (2005) [21]. Incorporating new knowledge is far from straightforward. Even existing rules and regulations may be hard to enforce in the face of entrenched agricultural practices. The case of bananas was cited as a particular example. Partly because of their water intensity, bananas are not zoned to be grown anywhere in Jordan. However, a senior official within the Jordanian hydrocracy argued that it is impossible, even undesirable, to completely stop their production because of the need to supply local markets and to maintain plant diversity within the Jordan Valley. The overall picture of water productivity and the policies that guide it presents a significant tension between those who argue that improved productivity is possible, and those who say Jordanian agriculture is already performing beyond its expected capabilities in water productivity.
The tension between attitudes towards potential to reduce agricultural water application and improved water productivity nests within a wider political challenge of structures laying out the rules and operations of water and agriculture in Jordan. This can be expressed as the institutional (rules) and organisational (actors) structures (as posited by the North, 1994 [22]) determining how resources are allocated. Raising tariffs for agricultural water might be a potential mechanism to incentivise investment and behavioural change at the farm level, however such a move would be politically challenging both to the organisational structure and its personnel, because of the social resistance that would be encountered. Socio-economic implications of change are also a barrier, with one interviewee highlighting that 10% of Jordan’s prison population are indebted farmers. There is a strong aversion to increasing these impacts as a cost of changes in agriculture and practices. To overcome these barriers, representatives of the agricultural bureaucracy argued for solutions that are socially practical, in order to overcome resistance and enforce existing regulation.
A further barrier to improving on-farm water behaviour relates to coordination and responsibilities between relevant ministries and agencies. Five interviewees highlighted the need for improved coordination (a de-siloing) between water and agricultural policy, echoing findings by Al-Zu’bi (2016) [23] regarding climate change governance. In particular, it was noted that the Jordanian Ministry of Water and Irrigation’s responsibilities for water end at the ‘farm gate’; on-farm usage, regulation, and improvement of water productivity falls under the remit of the Ministry of Agriculture. Attention was drawn to an imbalance in attention between the water and agricultural sectors concerning water productivity, with much more attention in the former than in the latter. Coordination was seen to be further hindered by rivalries in policies and spheres of influence between the ministries of water and agriculture, with overlapping rules and regulations, and gaps in regulatory responsibilities. These findings echo previous work on Jordan’s institutional water environment (Denny et al. 2008 [24], Yorke 2013 [25]), but offer a strong stakeholder-identified insight into the challenges for improved water and agricultural policy moving forward.
An example provided of the effects of siloed policy concerned case of new date trees, which have been encouraged by the Jordanian Ministry of Agriculture, and for which current water is available. Less consideration, however, had been given to the water requirements of the plantings as they matured over the next decade, implying a lack of sinuosity between water and agricultural policies.
Institutional challenges are compounded by deficits in operational and knowledge capacity. For the Jordan Valley, for instance, a more detailed understanding of specific agricultural and soil conditions for each farm might assist in delivering improved water productivity. However, this requires extension service and research investment. According to the extension service, while staff have deep in agricultural and environmental knowledge, the service suffers from a high turnover of staff, exacerbated by competition in salaries from the growing hi-tech agricultural sectors in the Gulf region. Dissemination of new knowledge and techniques is hindered by limited extension service budgets. The generation of that knowledge itself is hindered by donor dependence, bringing with it research that often matches donor or funder interests, rather than on-the-ground and policy needs. At the same time, as one agricultural scientist noted, there is failure on the part of science to speak the language of policy and to communicate ideas in a way that promotes policy salience. This perspective was shared by a representative of the Jordanian Ministry of Water and Irrigation who observed the need for greater engagement and understanding of conditions on the ground. Another suggested that Jordan had sufficient ideas and technical capacity, but lacked a deeper understanding, awareness, and action on how to achieve the required coordinated change at the organisational and institutional levels.
The perceived weaknesses of current institutional and organisational structure led to independent suggestions for change from four interviewees across the water and agricultural policy communities and water and agriculture research communities. First, that agricultural policies needed to be integrated into national economic planning with work on climate change and water. Second, that a high-level commission be formed with high-level representatives from the water, agriculture, trade, and labour sectors to plan a strategic cross-sectoral pathway, and to address institutional overlaps. Third, a related independent suggestion was a cabinet decision on a government package to determine the future balance of agricultural production and markets, and food imports and exports. Finally, an advisory committee with membership and/or input from policy and legal experts, as well as from applied practitioners and leading academics, drawing on global best practice cases of successful knowledge pooling.
Despite the challenges facing Jordan’s water future, there is some professional evidence that changes in water application might be an avenue to improve the country’s water situation through enhanced water resource decoupling in agriculture. Institutionally structural impediments must be overcome, with a clear demand for improved policy coordination. In addition to the immediate institutional challenges, there is also a longer-term need to consider water and agriculture’s role within the broader political and social economy of Jordan.
4. Discussion and Conclusions
This paper has explored the potential for enhanced water productivity in Jordan and Palestine, based on regional best practice in water productivity from, in most cases, neighbouring Israel. Overall, the research found notable differences in water application per unit crop production in Israel and Jordan for at least six key crops. Scaled to Jordanian production tonnages, this difference amounts to 168 MCM/yr. 71 MCM (42%) of this is dependent on changing behaviour towards rain-fed clover cultivation, which, if socio-economic and regulatory conditions allowed it, could enable this volume of water to be devoted to higher value crops or even allocated to other economic opportunities outside agriculture. The remaining potential of reduced water application, based on the two methodologies used, is between 65 and 97 MCM/yr, (58% of reduction, or 13–20% of current agricultural water allocations). There is also evidence that Israel can learn from successful and profitable supplemental irrigation practices in Jordanian dates and olives. Trends for Palestine are less clear, with notable unreliability in the collected data, hindered by agricultural heterogeneity and geopolitical context. As discussed below, significant further work is needed to understand exactly if and how reduced water application can be translated into real savings that could be reallocated for either agricultural growth and/or other economic uses.
The methodology has a number of significant limitations, and should only be regarded as a first step in a deeper interrogation of regional agricultural trends. Key among these is the use of national averaging of water application. This was necessitated by an inability to disaggregate national crop production by sub-national areas. Only around half of the potential difference in water application was verified by farm-level data, and further work, including a larger number of farm samples, is needed. A larger farm sample size would capture the environmental diversity in the region and inter-annual variations in perennial crop water requirements related to variations in annual rainfall.
A deeper challenge relates to the idea of water saving. As recent FAO work highlights, improving water efficiency through reduced water application on farms does not necessarily result in water savings on a larger scale (Perry and Steduto, 2017) [26]. This is often because of a failure to account for return flows (direct runoff or infiltration), with the result that increased efficiency from the same abstraction results in more evapotranspiration and less return flow (ibid). Perry and Steduto (2017) suggest that disappointing environmental flow returns in Australia’s Murray Darling Basin can be attributed to greater productive consumption of the same (or indeed less) actual abstraction, resulting in drastically reduced return flows. A similar picture is presented by Ward and Pulido-Velazquez (2008) in the Upper Rio Grande, in the Southern United States [27]. For Jordan, therefore, it is essential to understand what is happening to the water at the farm level, which, when compared with Israel, is apparently ‘excess’. The presence of significant return flows or unaccounted water on farms will almost certainly result in increased water consumption if irrigation efficiency measures are implemented without simultaneous improved regulation (namely enforced reduction) of abstraction. Questions on runoff/return flows were included in farmer interviews, however no reports of any flows were made; in contrast, farmers were keen to stress that given that water and/or pumping energy has to be paid for, and given that allocations in the Jordan valley are below desired levels, every drop of water that farmers applied was used productively in their perception, or for maintaining healthy soils through salt flushing.
One potential future avenue of assessment in the area of water productivity and return flows is to use satellite data to compare evaporation and evapotranspiration rates with farmer-declared water application, plus local rainfall. This methodology has been used to uncover illegal water use in Jordanian agriculture (Al-Bakri, et al., 2016) [28], but might also have the potential to identify whether there are significant surface or sub-surface return flows, and indeed whether there are significant differences in non-productive evaporation between Israeli and Jordanian farm plots. A deeper interrogation of how the differences in water application relate to real differences in crop water use (evapotranspiration per yield) will be a crucial next step to further understand differences in agricultural water productivity and quantifying the real potential to produce savings at the system level. Only if real savings are possible in Jordan, can improved agricultural water productivity be an effective mechanism to enhance water resource decoupling.
If reduced water application can be translated into a real water saving, significant investment would likely be required to achieve these savings. However, similar efforts in Israel from 1995 for improvements in agricultural water productivity were economically assessed to provide the cheapest means of enhancing national water security (Arlosoroff, 1997 [29]). While infrastructure and regulation in Jordan may increase costs, agricultural investments might also be expected to have additional benefits to the rural economy and livelihoods. These multiple potential socio-economic gains beyond the immediate issue of enhanced water security should also be considered in any investment and policy decisions.
Politically, our research identified divergent views on the potential for changes in agricultural water application in Jordan, with strong arguments presented both ways, especially regarding the Jordan Valley. Policy progress, and thus the potential for improved coordination within and between ministries, appears to be hampered by siloed operations. Achieving this coordination, and forging future policy, however, is itself politically difficult. Our analysis of the policy conditions highlighted an awareness of the need for greater understanding and commitment to overcoming institutional barriers and coordination challenges. While some frustration was expressed that both research and donor work in Jordan was serving academic or donor interests, a genuine need for input in understanding and managing institutional challenges was apparent. Demand for applied research that meets stakeholder needs in this political arena would appear to exist, and should be given urgent attention as a key element for Jordan’s future water, agricultural, and economic sustainability. Investment and attention in this area has clear salience to Jordan’s pursuit of the 2015 Sustainable Development Goals.
Author Contributions
This research was conceived by Michael Gilmont, who also coordinated the work of the project research team, with conceptual development carried out in conjunction with the Principle Investigators Steve Rayner (UK), Nadav Tal (Israel), and Erica Harper (Jordan). Detailed project framing, fieldwork design, and fieldwork execution (including interviews) was carried out by Lara Nassar (Jordan), Nadav Tal (Israel), and Hilmi Salem (Palestine). Further development of the enquiry into Institutional analysis was carried out by Lara Nassar, Michael Gilmont, and Steve Rayner. This paper was drafted by the project team, under the leadership of Michael Gilmont.
Acknowledgments
This research was funded by British Council MENA Institutional Links Grant (STREAM Program) ID218186526 covering the core of this research into decoupling and water productivity, and by University of Oxford’s John Fell Fund, grant number 162/047, for funding further work into institutional and organisational landscapes of uptake. The authors also acknowledge the support of the University of Oxford (including the Institute of Science, Innovation, and Society (InSIS), and the Environmental Change Institute (ECI)), and its respective country project partners, the West Asia North Africa (WANA) Institute and EcoPeace Middle East, in conducting this research. This paper is developed and extended from work included in a joint report produced by WANA, EcoPeace, and Oxford in July 2017.
Conflicts of Interest
The authors declare no conflict of interest. Aside specification by the British Council STREAM program of cooperation between U.K. researchers with research partner(s) in Israel and researcher partner(s) in Jordan, the funding sponsors have no role in the design of the study, in the collection, analyses or interpretation of data, in the writing of the manuscript, and in the decision to publish the results.
Appendix A. Water Intensity Calculations and Data

Table A1.
Water Numbers for Israel.
| Crop | Average Yield | Average Recommended Water Application | Average Water Intensity |
|---|---|---|---|
| Almonds | 0.2 | 600.0 | 3750.0 |
| Apricot | 2.2 | 450.0 | 204.5 |
| Avocado Etinger | 2.3 | 1000.0 | 444.4 |
| Avocado Has | 1.6 | 1000.0 | 625.0 |
| Avocado Average | 1.9 | 1000.0 | 534.7 |
| Bananas | 5.7 | 1802.0 | 316.1 |
| Beet | 6.0 | 250.0 | 41.7 |
| Cabbage and Brassicas | 8.0 | 450.0 | 56.3 |
| Carrot and turnips | 7.5 | 550.0 | 73.3 |
| Cauliflower | 3.0 | 320.0 | 106.7 |
| Celery | 10,000 units (2t) | 400.0 | 200.0 |
| Chillies and Peppers | 9.3 | 1246.0 | 133.4 |
| Cotton fibres | 0.2 | 470.0 | 2611.1 |
| Cotton seeds | 0.3 | 470.0 | 1615.1 |
| Cucumbers | 25.0 | 1200.0 | 48.0 |
| Dates Barhi | 1.7 | 1500.0 | 882.4 |
| Dates Majul | 0.9 | 1500.0 | 1764.7 |
| Dates Average | 12.6 | 835.0 | 1323.5 |
| Other Vegetables | 5.9 | 622.2 | 106.2 |
| Dry onion | 5.0 | 650.0 | 130.0 |
| Eggplant | 10.0 | 700.0 | 70.0 |
| Figs Brazilan | 1.5 | 850.0 | 566.7 |
| Figs Hamadi | 3.5 | 1700.0 | 485.7 |
| Figs Average | 7.5 | 675.0 | 526.2 |
| Grapefruit white | 8.0 | 800.0 | 100.0 |
| Grapefruit red | 7.0 | 900.0 | 128.6 |
| Grapefruit average | 7.5 | 850.0 | 114.3 |
| Grapes for food | 2.7 | 768.8 | 286.8 |
| Grapes for wine | 1.4 | 200.0 | 142.9 |
| Ground nut | 1.0 | 520.0 | 547.4 |
| Lemons | 5.0 | 750.0 | 150.0 |
| Lettuce and chicory | 8.0 | 180.0 | 22.5 |
| Limes | 3.0 | 750.0 | 250.0 |
| Maize grains | 1.8 | 550.0 | 305.6 |
| Mangoes Maya | 3.0 | 800.0 | 266.7 |
| Mangoes Kit | 4.5 | 900.0 | 200.0 |
| Mango average | 3.8 | 850.0 | 233.3 |
| Melons | 7.0 | 700.0 | 100.0 |
| Nectarine middle | 3.5 | 600.0 | 171.4 |
| Nectarine late | 4.3 | 700.0 | 164.7 |
| Nectarine early | 2.3 | 450.0 | 200.0 |
| Nectarine average | 3.3 | 583.3 | 178.7 |
| Olives | 1.3 | 1125.0 | 900.0 |
| Other orchards | 3.0 | 675.0 | 222.1 |
| Other types of citrus | 5.0 | 792.0 | 158.4 |
| Pears kotsia | 3.7 | 650.0 | 175.7 |
| Pears kotsia valley | 2.5 | 650.0 | 260.0 |
| Pears average | 3.1 | 650.0 | 217.8 |
| Peaches middle | 3.5 | 600.0 | 171.4 |
| Peaches early | 2.5 | 450.0 | 180.0 |
| Peaches late | 4.5 | 750.0 | 166.7 |
| Peaches | 3.5 | 600.0 | 172.7 |
| Peas | 0.6 | 125.0 | 227.3 |
| Pecan | 0.4 | 900.0 | 2571.4 |
| Persimmon | 5.0 | 900.0 | 180.0 |
| Plums late | 3.0 | 650.0 | 216.7 |
| Plums early | 2.0 | 450.0 | 225.0 |
| Plums Average | 2.5 | 550.0 | 220.8 |
| Sorghum, grains | 2.1 | 225.0 | 107.1 |
| Strawberries | 8.0 | 1100.0 | 137.5 |
| Sweet potatoes | 4.5 | 700.0 | 155.6 |
| Tomato | 19.0 | 1000.0 | 52.6 |
| Oranges | 5.0 | 800.0 | 160.0 |
| Watermelon | 7.0 | 400.0 | 57.1 |
| Wheat for silage | 1.0 | 40.0 | 40.0 |
Note: Derived from yield and recommended water application (Extension Service), as averaged from different regions where appropriate. Italic water intensity is an average of sub-species water intensity, not calculated by average yield and average application. Some water intensity numbers apply to multiple listed crop types (e.g., Other Citrus), so number of listed crops do not tally with crop numbers listed in text.
Table A2.
Jordan Water Intensity Calculations.
| Crop | 2010 Yield (tonnes) | Area (dunam) | Water/Dunam (derived) | Total Water (m3) | Water/Crop (m3/t) (derived) |
|---|---|---|---|---|---|
| alfalfa | 1 | 7 | 857.1 | 6000 | 12,000.0 |
| almonds | 2419 | 1260 | 870.6 | 1,097,000 | 453.5 |
| apples | 28,770 | 17,826 | 841.8 | 15,006,000 | 521.6 |
| apricots | 6796 | 8376 | 834.5 | 6,990,000 | 1028.5 |
| bananas | 43,753 | 18,527 | 1438.3 | 26,647,000 | 609.0 |
| barley | 10,659 | 12,623 | 258.2 | 3,259,000 | 305.8 |
| beans broad | 21,150 | 15,466 | 347.7 | 5,378,000 | 254.3 |
| beans string | 8218 | 5603 | 345.0 | 1,933,000 | 235.2 |
| broom millet | 14 | 11 | 545.5 | 6000 | 438.0 |
| cabbage | 20,317 | 6329 | 373.0 | 2,361,000 | 116.2 |
| carrots | 6770 | 1634 | 255.8 | 418,000 | 61.7 |
| cauliflowers | 54,734 | 18,025 | 395.1 | 7,121,000 | 130.1 |
| chick peas | 3935 | 1801 | 149.9 | 270,000 | 68.6 |
| citrus | 119,726 | 68,386 | 513.8 | 35,134,000 | 293.5 |
| clover trifoil | 223,591 | 65,771 | 1276.8 | 83,977,000 | 375.6 |
| corn white | 25,476 | 20,003 | 575.1 | 11,503,000 | 451.5 |
| cow peas | 650 | 456 | 339.9 | 155,000 | 238.5 |
| cucumbers | 176,179 | 20,047 | 356.0 | 7,137,000 | 40.5 |
| date palms | 11,241 | 17,079 | 1439.3 | 24,582,000 | 2186.9 |
| eggplants | 104,748 | 30,070 | 387.7 | 11,659,000 | 111.3 |
| figs | 953 | 1051 | 882.0 | 927,000 | 972.9 |
| garlic | 486 | 149 | 684.6 | 102,000 | 210.1 |
| grapes | 29,683 | 21,660 | 672.9 | 14,576,000 | 491.1 |
| guavas | 2270 | 2155 | 781.9 | 1,685,000 | 742.3 |
| jew’s mallow | 35,659 | 12,797 | 476.3 | 6,095,000 | 170.9 |
| lentils | 245 | 71 | 1436.6 | 102,000 | 416.0 |
| lettuce | 48,200 | 14,344 | 269.0 | 3,859,000 | 80.1 |
| maize | 29,006 | 14,963 | 728.4 | 10,899,000 | 375.7 |
| marrows | 69,655 | 11,620 | 244.9 | 2,846,000 | 40.9 |
| melons | 31,051 | 8112 | 846.9 | 6,870,000 | 221.2 |
| okra | 6814 | 7420 | 458.4 | 3,401,000 | 499.1 |
| olives | 171,672 | 249,729 | 527.8 | 1.32 × 10⁸ | 2399.3 |
| onions dry | 15,765 | 8590 | 485.9 | 4,174,000 | 264.8 |
| onions green | 3512 | 836 | 793.1 | 663,000 | 188.8 |
| other field crops | 21 | 265 | 211.3 | 56,000 | 2654.0 |
| other fruits | 13,228 | 11,347 | 870.6 | 9,879,000 | 746.8 |
| other vegetables | 27,182 | 11,620 | 244.9 | 2,846,000 | 104.7 |
| parsley | 2543 | 980 | 259.2 | 254,000 | 99.9 |
| peaches | 23,153 | 15,982 | 841.0 | 13,441,000 | 580.5 |
| pears | 2141 | 3023 | 890.8 | 2,693,000 | 1258.1 |
| peas | 3512 | 1846 | 449.1 | 829,000 | 236.0 |
| peppers hot | 18,549 | 7823 | 452.1 | 3,537,000 | 190.7 |
| peppers sweet | 36,590 | 11,126 | 490.7 | 5,460,000 | 149.2 |
| plums/prunes | 2291 | 2863 | 836.5 | 2,395,000 | 1045.4 |
| pomegranates | 2146 | 2138 | 819.9 | 1,753,000 | 816.9 |
| potatoes | 174,931 | 57,969 | 434.2 | 25,173,000 | 143.9 |
| radish | 4161 | 1687 | 284.5 | 480,000 | 115.4 |
| sesame | 118 | 83 | 3831.3 | 318,000 | 2694.9 |
| snake cucumber | 20,987 | 3170 | 60.9 | 193,000 | 9.2 |
| spinach | 6368 | 2125 | 238.1 | 506,000 | 79.5 |
| tomatoes | 737,262 | 141,212 | 524.7 | 74,092,000 | 100.5 |
| turnips | 1516 | 390 | 276.9 | 108,000 | 71.2 |
| vetch | 540 | 78 | 6064.1 | 473,000 | 875.6 |
| water melons | 153,118 | 37,417 | 394.2 | 14,750,000 | 96.3 |
| wheat | 22,126 | 17,094 | 207.1 | 3,541,000 | 160.0 |
Note: Data in this table on area and water use are taken from International Resources Group (IRG) and Karablieh (2012) and calculations of area and water applied to crop during the year 2010, as cited in text. Data on annual yield taken from national statistical accounts for 2010. Calculations on water/dunam and water/crop are derived from this data.
References
- Gilmont, M. Decoupling dependence on natural water: Reflexivity in the regulation and allocation of water in Israel. Water Policy 2014, 16, 79–101. [Google Scholar] [CrossRef]
- World Bank. Water Resources Management in an arid environment: The case of Israel. In World Bank Analytical and Advisory assistance (AAA) Program China: Address Water Scarcity; Background Paper No. 3; East Asia and Pacific Region; World Bank: Washington, DC, USA, 2006. [Google Scholar]
- Teschner, N.; Negev, M. The development of water infrastructures in Israel: Past, present and Future. In Shared Borders, Shared Waters: Israeli-Palestinian and Colorado River Basin Water Challenges; Megdal, S.B., Varadey, R.G., Eden, S., Eds.; CRC Press: Leiden, The Netherlands, 2013. [Google Scholar]
- EcoPeace. Water for agriculture in Jordan: Strategies for reducing consumption in the agricultural sector. 2013. Available online: http://ecopeaceme.org/uploads/13622989291~%5E$%5E~Jordan_Agricultural_Policy_Paper_English.pdf (accessed on 28 June 2017).
- FAO. Food balance tables 1961–2011. In United Nations Food and Agricultural Organisation; FAO: Rome, Italy, 2016. [Google Scholar]
- Ministry of Water and Irrigation (MWI). Water For life. In Jordan’s Water Strategy 2008–2022; MWI: Amman Jordan, 2008. Available online: http://www.mwi.gov.jo/sites/en-us/Documents/Jordan_Water_Strategy_English.pdf (accessed on 20 September 2016).
- Ministry of Water and Irrigation (MWI). National Water Strategy of Jordan 2016–2025; MWI: Amman, Jordan, 2016.
- World Bank. Red Sea-Dead Sea Water Conveyance Study Program. Study of Alternatives; Final Report; World Bank: Washington, DC, USA, 2014. [Google Scholar]
- Seder, N.; Abdel-Jabbar, S. Safe Use of Treated Wastewater in Agriculture Jordan Case Study; Arab Countries Water Utilities Association (ACWUA): Amman, Jordan, 2011. [Google Scholar]
- Yorke, V. Jordan’s Shadow State and Water Management: Prospects for Water Security Will be Dependent on Politics and Regional Cooperation. In Society-Water-Technology: A Critical Appraisal of Major Water Engineering Projects; Hüttl, R.F., Bens, O., Bismuth, C., Hoechstetter, S., Eds.; Springer: Heidelberg, Germany, 2016. [Google Scholar]
- Gilmont, M.; Rayner, S.; Harper, H.; Nassar, L.; Tal, N.; Simpson, M.; Salem, H.S. Decoupling National Water Needs for National Water Supplies. Insights and potential for Countries in the Jordan Basin; WANA Institute: Amman, Jordan, 2017. [Google Scholar]
- Hoff, H.; Falkenmark, M.; Gerten, D.; Gordon, L.; Karlberg, L.; Rockstrom, J. Greening the global water system. J. Hydrol. 2010, 384, 177–186. [Google Scholar] [CrossRef]
- Ministry of Agriculture. Irrigation Coefficients, in Training and Professional Services Database; Israel Ministry of Agriculture: Bet Dagan, Israel, 2016.
- International Resources Group (IRG); Karablieh, E. Institutional Support and Strengthening Program (ISSP) ISSP Water Valuation Study: Disaggregated Economic Value of Water in Industry and Irrigated Agriculture in Jordan; USAID: Washington, DC, USA, 2012.
- Obeidat, O. Ministry ends large-scale water theft in Jordan Valley. Jordan Times, 03 September 2016. [Google Scholar]
- O’Keeffe, J.; Buytaert, W.; Mijic, A.; Brozovic, N.; Sinha, R. The use of semi-structured interviews for the characterization of farmer irrigation practices. Hydrol. Earth Syst. Sci. 2016, 20, 1911–1924. [Google Scholar]
- Boller, B.; Willner, E.; Maggioni, L.; Lipman, E. Report of a Working Group on Forages. Eighth Meeting, 10–12 April 2003; International Plant Genetic Resources Institute: Linz, Austria; Rome, Italy, 2005. [Google Scholar]
- Al-Jaloudy, M.A. Country Pasture/Forage Resources Profiles: Jordan; Suttie, J.M., Reynolds, S.G., Eds.; FAO: Rome, Italy, 2006. [Google Scholar]
- Al-Rimawi, A.S. Reorienting Agricultural Extension in Jordan. Expert Consultation workshop on Market Orientated Agricultural Advisory Services; FAO/AARINENA: Amman, Jordan, 2012. [Google Scholar]
- Lach, D.; Ingram, H.; Rayner, S. Maintaining the Status Quo: How Institutional Norms and Practices Create Conservative Water Organizations. Univ. Tex. Law Rev. 2005, 83, 2027–2053. [Google Scholar]
- Rayner, S.; Ingram, H.; Lach, D. Weather Forecasts Are for Wimps: Why Water Resource Managers Do Not Use Climate Forecasts. Clim. Chang. 2005, 69, 197–277. [Google Scholar] [CrossRef]
- North, D. Institutional Change: A Framework for Analysis. 1994. Available online: https://www.iei.liu.se/nek/730A22/filarkiv-2013/del-1a-andersson/1.516348/NorthInstchangeframework.pdf (accessed on 8 March 2014).
- Al-Zu’bi, M. Jordan’s climate change governance framework: From silos to an intersectoral approach. Environ. Syst. Decis. 2016, 26, 277–301. [Google Scholar] [CrossRef]
- Denny, E.; Donnelly, K.; McKay, R.; Ponte, G.; Uetake, T. Sustainable Water Strategies for Jordan; International Economic Development Program, Gerald R. Ford School of Public Policy, University of Michigan: Ann Arbour, MI, USA, 2008. [Google Scholar]
- Yorke, V. Politics Matter: Jordan’s Path to Water Security Lies through Political Reforms and Regional Cooperation. NCCR Trade Regulation, Working Paper 2013/19. 2013. Available online: https://www.wti.org/media/filer_public/00/98/00989164-e76d-4887-be98-2acd3b193c59/working_paper_2013_19.pdf (accessed on 14 February 2018).
- Perry, C.; Steduto, P. Does Improved Irrigation Technology Save Water? A Review of the Evidence. Discussion Paper on Irrigation and Sustainable Water Resources Management in the Near East and North Africa; FAO: Cairo, Egypt, 2017. [Google Scholar]
- Ward, F.A.; Pulido-Velazquez, P. Water conservation in irrigation can increase water use. Proc. Natl. Acad. Sci. USA 2008, 105, 18215–28220. [Google Scholar] [CrossRef] [PubMed]
- Al-Bakri, J.T.; Shawash, S.; Ghanim, A.; Abdelkhaleq, R. Geospatial techniques for Improved Water Management in Jordan. Water 2016, 8, 132. [Google Scholar] [CrossRef]
- Arlosoroff, S. The public commission on the water sector reform (the general ideas underlying its recommendations). Int. Water Irrig. Rev. 1997, 5, 1–9. [Google Scholar]
Figure 1.
Agricultural production and relative water use in Israel, 1961–2013.

Figure 2.
Agricultural production and relative water use in Jordan, 1985–2013.

Figure 3.
Projection of Jordan’s water needs, based on Ministry of Water and Irrigation (MWI) 2016 demand and supply data in Million Cubic Meters (MCM)/yr. Adapted from Gilmont et al. (2017) [11].
Figure 3.
Projection of Jordan’s water needs, based on Ministry of Water and Irrigation (MWI) 2016 demand and supply data in Million Cubic Meters (MCM)/yr. Adapted from Gilmont et al. (2017) [11].

Figure 4.
Plot of water data (Central Bureau of Statistics Agricultural Allocation) and simulated agricultural water (crop tonnage x water per ton) for the period 2000–2015 for Israel.
Figure 4.
Plot of water data (Central Bureau of Statistics Agricultural Allocation) and simulated agricultural water (crop tonnage x water per ton) for the period 2000–2015 for Israel.

Figure 5.
Plot of water data (Ministry of Water and Irrigation) and simulated agricultural water (crop tonnage x water per ton) for the period 1985–2014 for Jordan.
Figure 5.
Plot of water data (Ministry of Water and Irrigation) and simulated agricultural water (crop tonnage x water per ton) for the period 1985–2014 for Jordan.

Figure 6.
Crop yield per unit area comparison between Israeli, Jordanian, and Palestinian farmers by crop. Adapted from Gilmont et al. 2017 [11]. ISR—Israeli; JOR—Jordanian; PAL—Palestinian.
Figure 6.
Crop yield per unit area comparison between Israeli, Jordanian, and Palestinian farmers by crop. Adapted from Gilmont et al. 2017 [11]. ISR—Israeli; JOR—Jordanian; PAL—Palestinian.

Figure 7.
Water application per area comparison between Israeli, Jordanian, and Palestinian farmers by crop. Adapted from Gilmont et al. 2017 [11].
Figure 7.
Water application per area comparison between Israeli, Jordanian, and Palestinian farmers by crop. Adapted from Gilmont et al. 2017 [11].

Figure 8.
Indication of farm sizes across the three sets of samples (Israel, Jordan, and Palestine). Note that P19 reports a cooperative of multiple farms producing olives and olive oil. Gaps indicate no data given.
Figure 8.
Indication of farm sizes across the three sets of samples (Israel, Jordan, and Palestine). Note that P19 reports a cooperative of multiple farms producing olives and olive oil. Gaps indicate no data given.

Table 1.
Comparative water productivity and potential differences in water application across 14 Crops. Adapted from Gilmont et al. (2017) [11].
Table 1.
Comparative water productivity and potential differences in water application across 14 Crops. Adapted from Gilmont et al. (2017) [11].
| Jordan Water Application MCM (2010) | Jordan Average Tonnage ‘000s (2009–2014) | Jordan Water/Crop Ton | Jordan Average Water Application 2009–2014 MCM/Year | Israel Water/Crop Ton @142% Inflation | % of Present Scenario | Water Application under New Scenario (MCM) | Difference in Water Application/Year for Jordanian Production Tonnages | |
|---|---|---|---|---|---|---|---|---|
| Clover | 84.0 | 190.1 | 376 | 71.41 | Rain-fed | 0% | 0 | 71.4 |
| Olives | 167.1 | 110.5 | 1,627 | 179.75 | 1278 | 79% | 141.2 | 38.6 |
| Tomatoes | 74.1 | 753.6 | 100 | 75.73 | 75 | 75% | 56.3 | 19.4 |
| Banana | 26.6 | 42.4 | 609 | 25.81 | 449 | 74% | 19.0 | 6.8 |
| Apples | 15.0 | 36.1 | 522 | 18.82 | 187 | 36% | 6.7 | 12.1 |
| Dates | 24.6 | 10.7 | 2,187 | 23.44 | 1879 | 86% | 20.1 | 3.3 |
| Watermelon | 14.8 | 117.6 | 96 | 11.33 | 81 | 84% | 9.5 | 1.8 |
| Grapes | 14.6 | 34.7 | 491 | 17.02 | 426 | 87% | 14.8 | 2.3 |
| Wheat | 3.5 | 21.6 | 160 | 3.46 | 57 | 35% | 1.2 | 2.2 |
| Onion, dry | 4.2 | 27.0 | 265 | 7.14 | 185 | 70% | 5.0 | 2.2 |
| Citrus | 35.1 | 108.7 | 293 | 31.89 | 227 | 77% | 24.7 | 7.2 |
| Eggplant | 11.7 | 106.6 | 111 | 11.87 | 99 | 89% | 10.6 | 1.3 |
| Potato | 25.2 | 159.8 | 144 | 23.00 | 189 | 132% | 30.3 | - |
| Cucumber | 7.1 | 191.4 | 41 | 7.75 | 68 | 168% | 13.0 | - |
| Total | 507.5 | 1910.7 | 508.4 | 352.5 | 168.4 |
Table 2.
Water application per tonne yield between secondary and farmer interview data, and between Israeli, Jordanian, and Palestinian cases.
Table 2.
Water application per tonne yield between secondary and farmer interview data, and between Israeli, Jordanian, and Palestinian cases.
| Israel Secondary Data as Calculated (m3/t) | Extension Regional Data (m3/t) | Farmer Interview (m3/t) | Location | Farmer as% Secondary Data | Jordan Secondary Data (m3/t) | Jordan Farmer (m3/t) | Location | Jordan Farmer as% Secondary Data | Jordan Farmer as % Israel Farmer | Palestinian Farmer (m3/t) | Location | Palestinian Farmer as % Israel Farmer | |
|---|---|---|---|---|---|---|---|---|---|---|---|---|---|
| Clover | Rain-fed | - | - | - | 375.58 | No Data | - | - | No Data | - | |||
| Olives | 900 | 355 | 675 | Average | 75% | 1627.00 | 50.2 | JV | 3% | 7% | 3500 | Jenin | 519% |
| Tomatoes | 52.6 | 38 | 38 | Jordan Valley | 72% | 100.5 | 61.2 | JV & North | 61% | 161% | 43 | Tubas | 113% |
| Banana | 316.1 | 204.7 | 217 | Jordan Valley | 69% | 609.03 | 544 | JV | 89% | 251% | 8.75 | Jericho | 4% |
| Apples | 131.5 | 153 | 156 | North | 119% | 521.59 | 354 | Highlands | 68% | 227% | ND | - | |
| Dates | 1323.5 | 1200 | 767 | Jordan Valley | 58% | 2186.89 | 486 | JV | 22% | 63% | 889 | Jericho | 116% |
| Watermelons | 57.1 | 45 | 150 | Jordan Valley | 263% | 96.33 | 96 | Average | 100% | 64% | 6 | Jericho | 4% |
| Grapes | 300 | 453 | 75 | Jordan Valley | 25% | 491.06 | 130 | Average | 26% | 173% | ND | - | |
| Wheat | 40 | 88 | 200 | Jordan Valley | 500% | 160.04 | 350 | Highlands | 219% | 175% | ND | - | |
| Onion, dry | 130 | 88 | 92 | Jordan Valley | 71% | 264.77 | 422 | JV | 159% | 459% | 14 | Tubas | 15% |
| Citrus | 160 | 161 | 203 | Average | 127% | 293.45 | 342.9 | JV | 121% | 169% | 292 | Gaza | 144% |
| Eggplant | 70 | ND | 111.31 | 143 | JV | 128% | 700 | Jericho | - | ||||
| Potato | 133.3 | 139 | 83 | Centre | 62% | 143.9 | 125 | Average | 87% | 151% | 42 | Tubas | 51% |
| Cucumber | 48 | 77 | Jordan Valley | 160% | 40.51 | 113 | JV | 279% | 147% | 382 | Jenin | 496% |
© 2018 by the authors. Licensee MDPI, Basel, Switzerland. This article is an open access article distributed under the terms and conditions of the Creative Commons Attribution (CC BY) license (http://creativecommons.org/licenses/by/4.0/).
Share and Cite
MDPI and ACS Style
Gilmont, M.; Nassar, L.; Rayner, S.; Tal, N.; Harper, E.; Salem, H.S. The Potential for Enhanced Water Decoupling in the Jordan Basin through Regional Agricultural Best Practice. Land 2018, 7, 63. https://doi.org/10.3390/land7020063
AMA Style
Gilmont M, Nassar L, Rayner S, Tal N, Harper E, Salem HS. The Potential for Enhanced Water Decoupling in the Jordan Basin through Regional Agricultural Best Practice. Land. 2018; 7(2):63. https://doi.org/10.3390/land7020063
Chicago/Turabian StyleGilmont, Michael, Lara Nassar, Steve Rayner, Nadav Tal, Erica Harper, and Hilmi S. Salem. 2018. "The Potential for Enhanced Water Decoupling in the Jordan Basin through Regional Agricultural Best Practice" Land 7, no. 2: 63. https://doi.org/10.3390/land7020063
Note that from the first issue of 2016, this journal uses article numbers instead of page numbers. See further details here.