Parameter Optimization on the Forced Ventilation of Symmetric Tunnel Construction Based on the Super-Short Bench-Cut Method

1
Tunnel and Underground Engineering Research Center of Ministry of Education, Beijing Jiaotong University, Beijing 100044, China
2
Beijing Municipal Engineering Research Institute, Beijing 100037, China
*
Author to whom correspondence should be addressed.
Symmetry 2018, 10(2), 49; https://doi.org/10.3390/sym10020049
Submission received: 2 January 2018
/
Revised: 24 January 2018
/
Accepted: 9 February 2018
/
Published: 15 February 2018
Abstract
:To exploit the influence of the tunnel face and the distance between the diameter and the orifice of a blast pipe on the ventilation effect in symmetric tunnel construction, this paper uses Fluent to establish a three-dimensional model and numerical simulation. Firstly, the accuracy of the numerical simulation is tested and then the distance between the orifice and tunnel face and the influence of the air duct diameter on the ventilation effect are studied, respectively. The results show that the ventilation effect is best when the wind pipe is arranged on one side of the tunnel wall (an asymmetrical layout), although the space in the tunnel is axisymmetric, and that the error of the numerical simulation is less than 5% of the measured value. When the distance between the orifice and tunnel face is 5 m, the uniformity of the air flow field near the tunnel face is poor; when the distance is 10 m and 12 m, an obvious vertex area appears in the tunnel. Furthermore, the uniformity of the wind velocity flow field is optimal when the distance is 8 m. When the air duct diameter is less than 1.4 m, there is a uniformity of the flow field near the tunnel face of the upper and lower benches; when the air duct diameter is more than 1.4 m, the tunnel face of the upper bench near the ground shows more obvious backflow. Therefore, it was determined that taking the air duct diameter as 1.4 m and the distance between the orifice and tunnel face as 8 m was the best combination for the design of ventilation in this project. It was also found that a better ventilation effect can be achieved when the distance between the nozzle of the ventilator and the tunnel face is 6 m–9 m and the wind speed of the nozzle is 6 m/s–8 m/s. In practical engineering, the wind speed and the required air volume should be taken into consideration to determine the diameter of the ventilator.
1. Introduction
Taking practical, economical, and safe ventilation measures are essential in the process of tunnel construction. Many scholars have studied the ventilation of symmetrical tunnel construction. For example, Tan et al. [1] researched the distribution of dusts and harmful gases in tunnels after construction blasting that used the drilling and blasting method; Peng et al. [2,3] analyzed the forced ventilation effect of tunnels in construction using the positive bench method and put forward the notion that the ventilation effect is best when the air duct layout is along the sidewall of the tunnel and the distance to tunnel face is 5 m–10 m. Oka et al. [4] researched the attenuation characteristics of the wind velocities and temperatures in tunnels, Wesely [5] made three-dimensional numerical simulations of wind velocity flow fields near tunnel faces under driving auxiliary ventilation conditions, Zhang et al. [6,7] made numerical simulation research on the application of high powered jet ventilation technology in long tunnels, Fang et al. [8] and Mirhedayatian et al. [9] researched the distribution of wind velocity flow fields in tunnel construction, Liu et al. [10] and Wang et al. [11] conducted numerical simulation research on related parameter optimization of gas tunnel construction ventilation and diversion tunnel construction ventilation, and He et al. [12] researched the characteristics of tunnel ventilation flow fields in intersecting tunnel construction. Additionally, Wang et al. also worked on numerical simulation and field measurement research on tunnel construction ventilation [13], Zhang et al. [14] conducted numerical simulation research on the ventilation flow field of gas tunnel construction. Furthermore, Zolfani et al. [15] studied a new hybrid multi-criteria decision-making (MCDM) method for the selection of optimal alternatives for the mechanical longitudinal ventilation of tunnel pollutants, Spearpoint et al. and Trussoni et al. studied the ventilation of the operation tunnel in the case of fire [16,17], Cardillo et al. [18] studied the aerodynamic effect of pressure pulses on tunnel ventilation fans, and Fouladgar et al. [19] analyzed the importance of ventilation in the process of tunnel construction.
There is a lot of related research on ventilation during tunnel construction, however, it can be found from related references and site investigations that the type of ventilation differs depending on the different tunnel structures, duct layouts, and tunnel construction methods. For this purpose, based on the Fluent numerical simulation software, this study researches the wind velocity flow field near the working face of tunnels with different air duct diameters and different air duct distances from the tunnel face for numerical simulation research. The related conclusions in this paper are of utmost importance in guiding the ventilation scheme formulation of urban tunnel construction.
2. The Engineering Situation and Ventilation Calculation
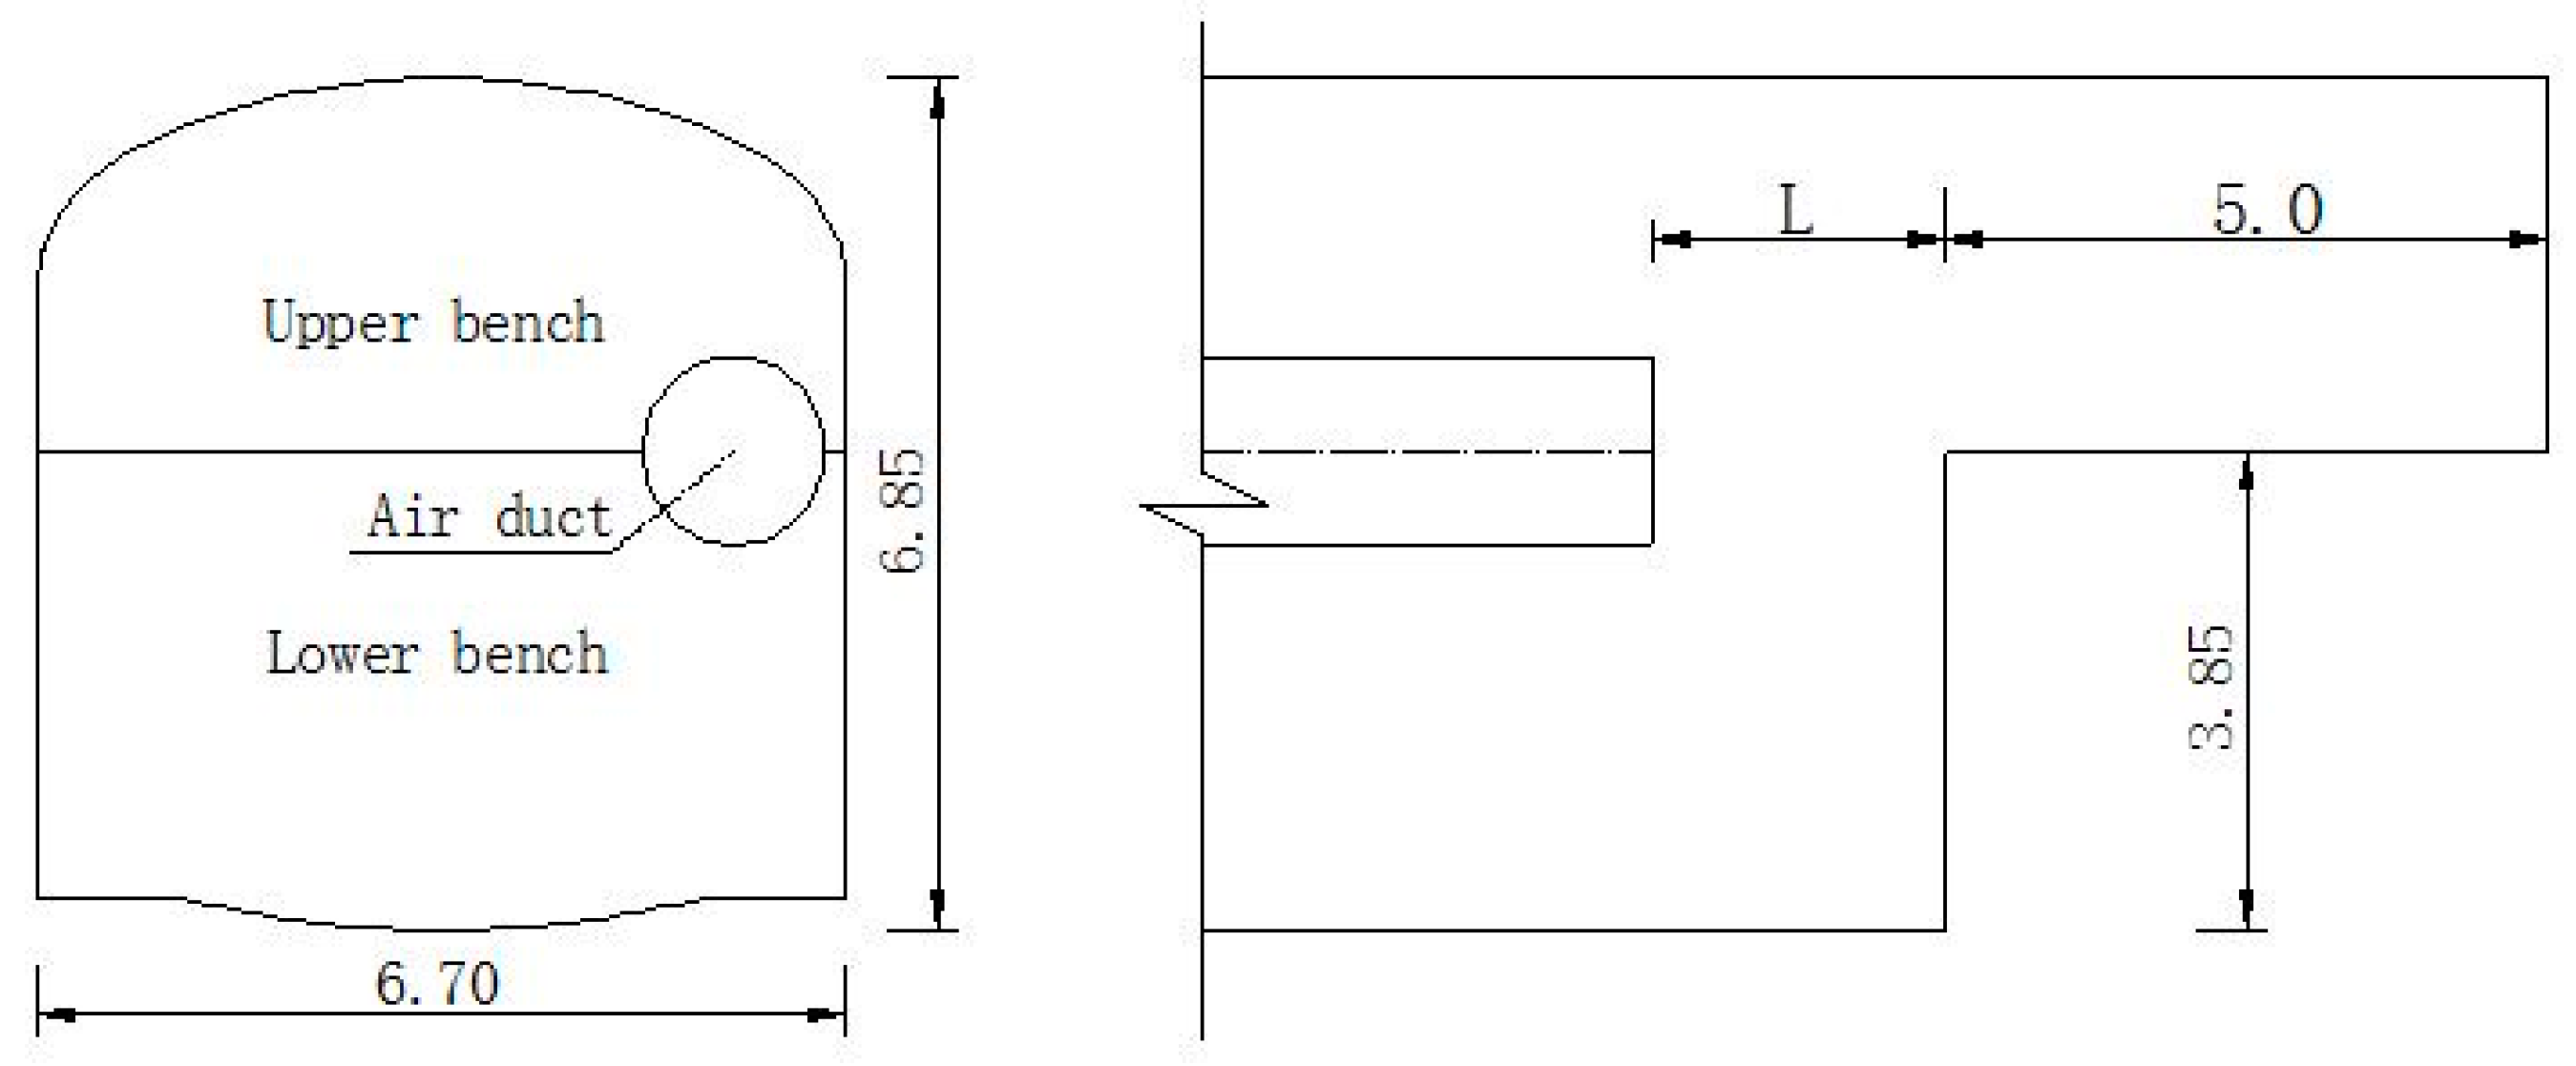
The tunnel investigated in this study is the subsurface tunnel near Xinghaiwan Square in the project of quadruple-circuit transmission line reconstruction in Yanta, Dalian. The designed mileage of the subsurface tunnel is K0 + 000–K0 + 700 with a horseshoe cross-section and composite lining. The overall dimensions of excavation are 6.7 m × 6.85 m using the bench-cut method of construction. The height in the upper and lower bench is 3 m and 3.85 m, respectively, and the length of the bench is less than 5 m.
The vertical shafts are set as K0 + 000, K0 + 240.28, and K0 + 549.914, and the net areas are 7.7 m × 8.5 m, 5.0 m × 6.0 m, and 5.0 m × 6.0 m, respectively. To guarantee a good working environment near the face of the upper and lower bench, the blast pipe is arranged along the sidewall of the tunnel and the orifice layout of the air duct is at the rear of the lower bench. The excavation face of the tunnel is axisymmetric. We found that the ventilation effect is best when the wind pipe is arranged on one side of the tunnel wall (an asymmetrical layout) through an investigation of the literature and numerical simulation. The tunnel section formation and the layout position of air duct are shown in Figure 1.
After calculating the air volume consumed by the normal breathing of the largest possible number of individuals at its operation and the minimum wind velocity ventilation, and after diluting the maximum explosive quantity capable of producing harmful gases and diluting the worktable to produce waste gas in the tunnel, the largest air volume required by the minimum wind velocity ventilation can be found; the air volume required for the tunnel construction ventilation is obtained after considering the loss of air through duct leakage as V = 680 m3/min.
3. The Numerical Simulation Validation
This study adopts the numerical simulation method for forced ventilation parameter research. To guarantee the reliability of the results, this study takes the tunnel construction ventilation in the northwest regions of China as an example. After obtaining the measured ventilation data in the first stage of construction, we use Fluent for the numerical simulation of the wind velocity flow field in the tunnel. After adjusting each simulated parameter value until the error is less than 5% of the measured value, the adjusted parameters are adopted for the numerical simulation of the construction ventilation of the object investigated in this study.
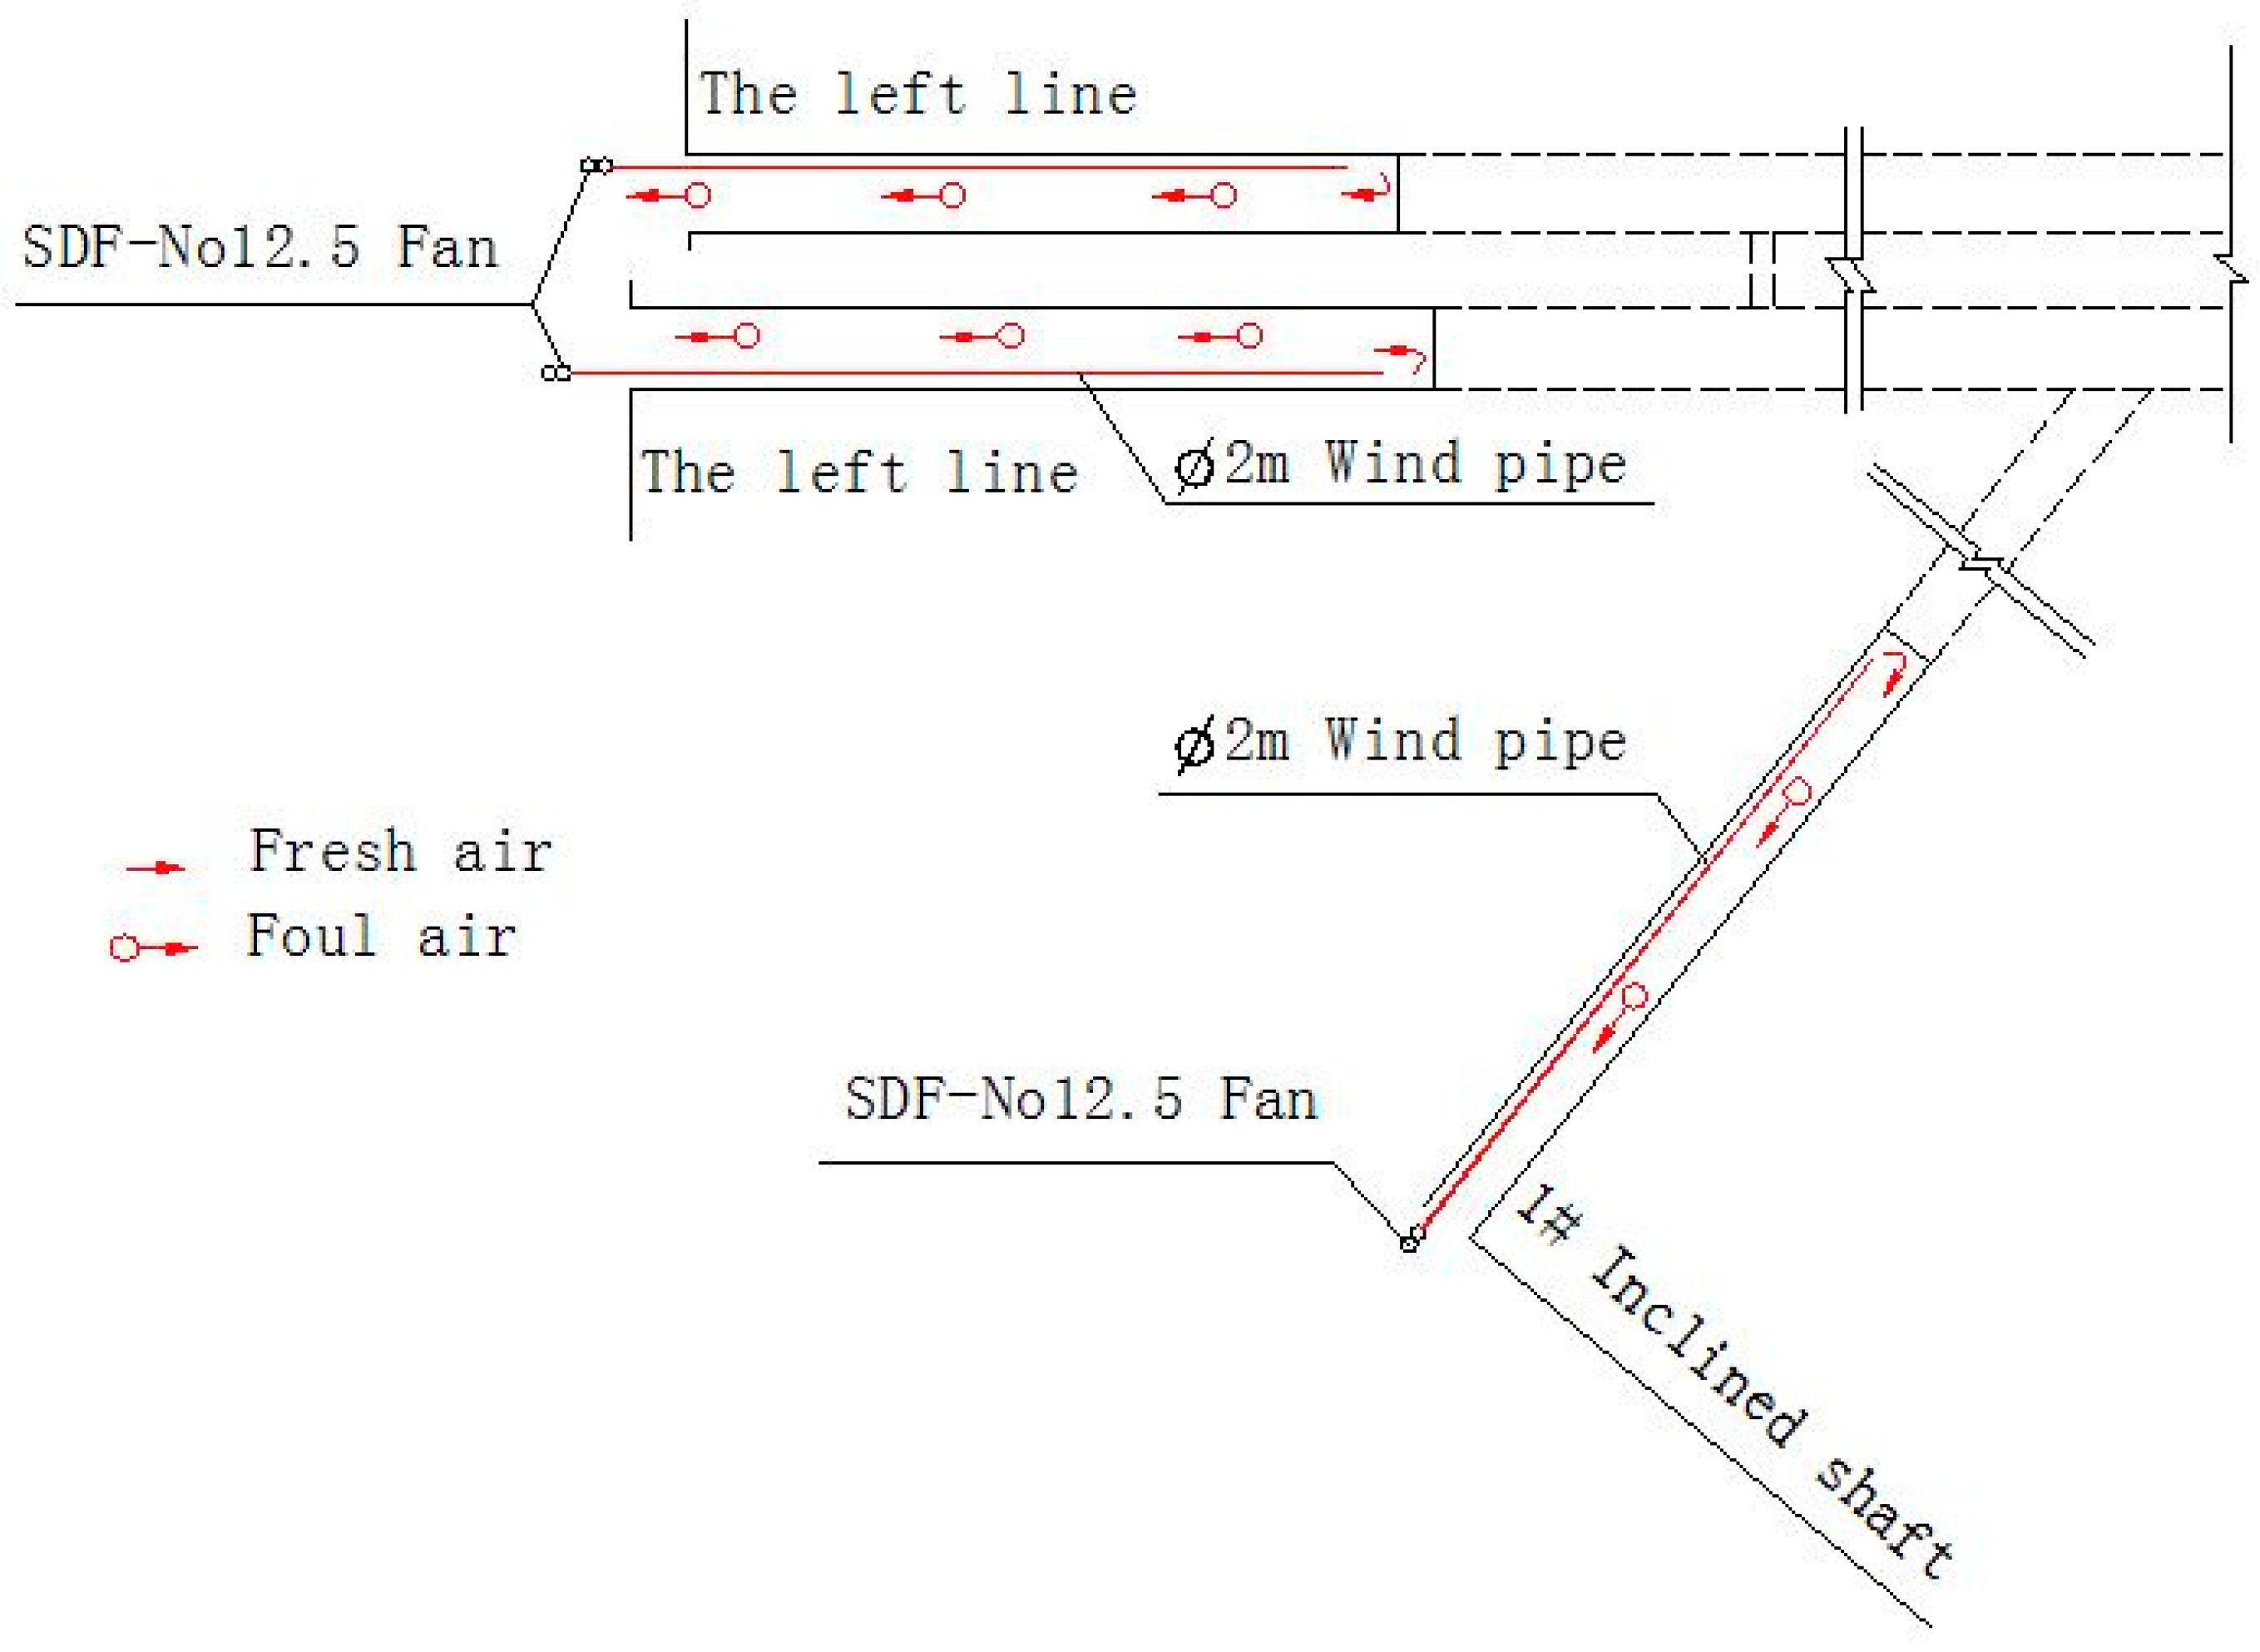
Figure 2 shows the schematic diagram of the tunnel construction ventilation in its first stage. The main cave adopts a bidirectional tunneling construction method with an inlet and an outlet.
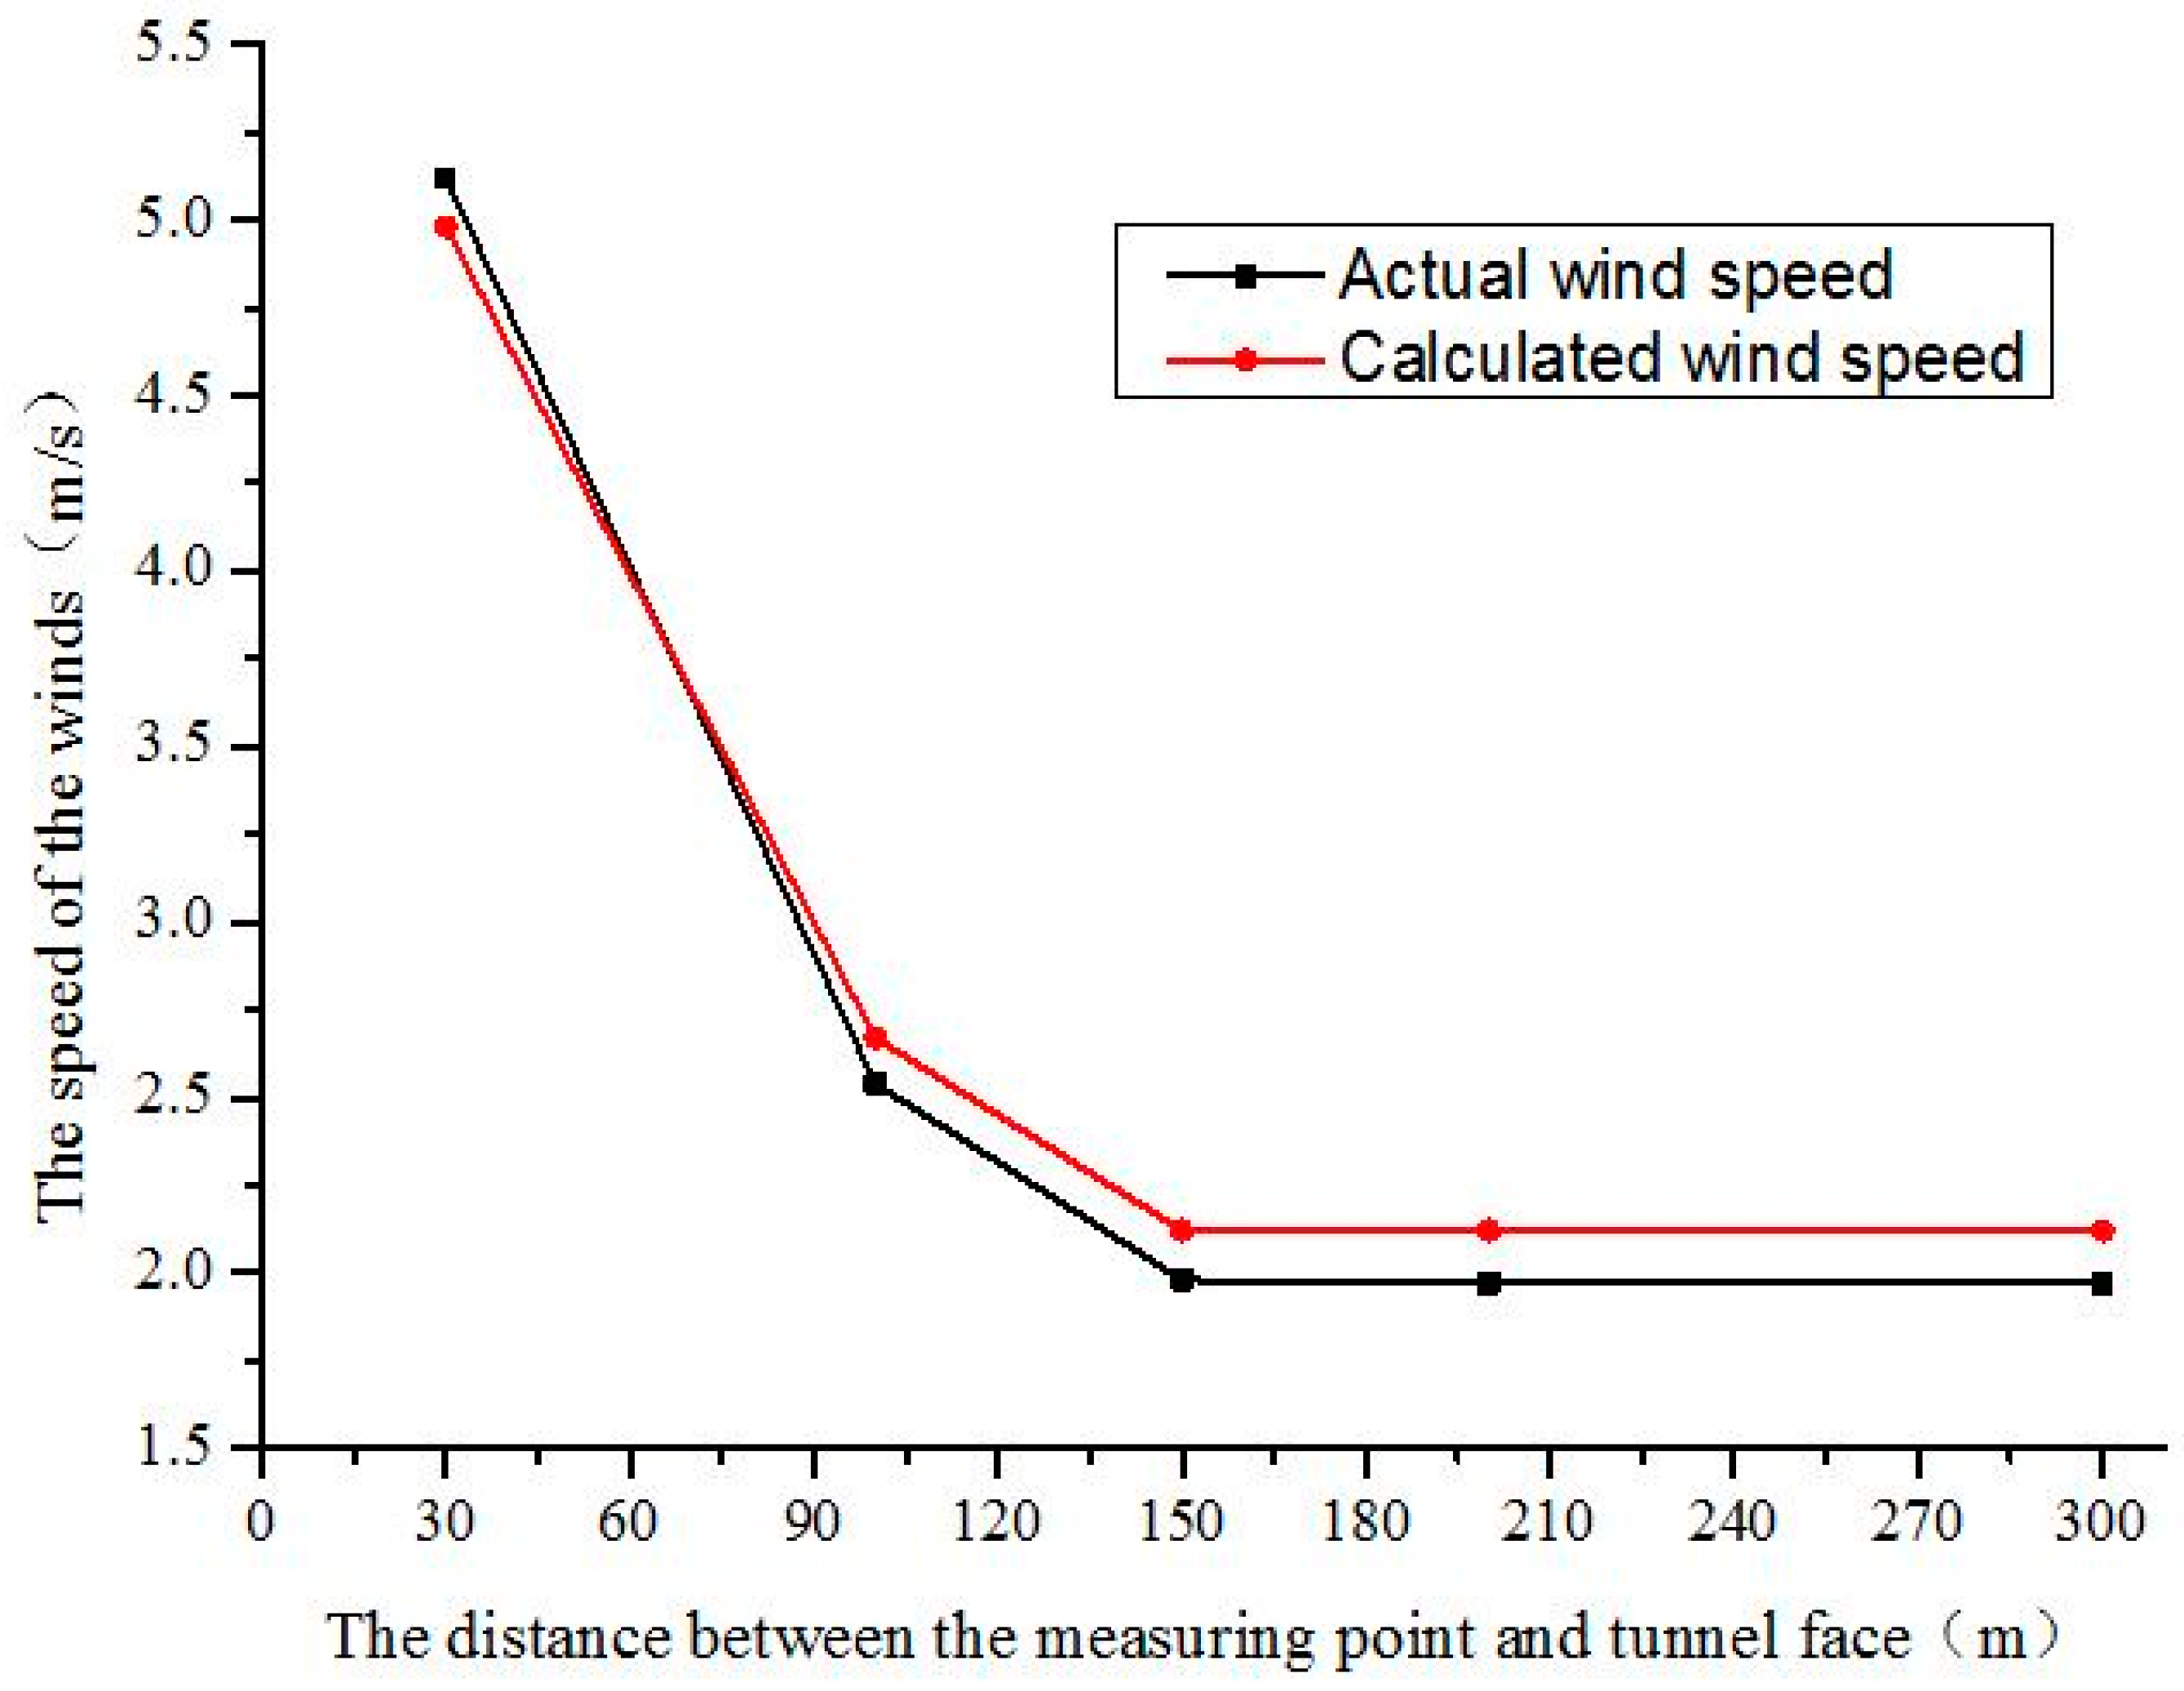
It can be found from the construction ventilation design that during the tunnel construction, the air volume (V1 = 3253 m3/min) required by the main cave construction uses an air duct with a diameter of 2 m, where the wind velocity in the outlet is 8.63 m/s. As the left line of the main cave is 420 m, the monitoring points of the velocity are set at 30 m, 100 m, 150 m, 200 m and 300 m from the tunnel face. The finite element software, Fluent, is used to establish the corresponding numerical model. In the numerical simulation, the air in the duct is regarded as an ideal gas. Using the k-epsilon turbulence model, the outlet of the tunnel is set as a free outlet, the outlet of the air duct is set as the velocity outlet, and the sidewalls of the air duct and tunnel are set as the wall with no energy exchange. Additionally, within Fluent, monitoring points are set at distances of 30 m, 100 m, 150 m, 200 m and 300 m from the tunnel face. The comparison between the measured wind velocity and the velocity in the numerical simulation is shown in Figure 3.
From Figure 3, when the distance of the measuring points from the tunnel face is small, the measured velocity is relatively large. With increasing of the distance from the tunnel face, the measured velocity decreases. In addition, when the distance between the measuring point and the tunnel face is more than 150 m, the velocity in the tunnel tends to stabilize. At the same time, it should be noted that the deviation between the measured and simulated values is less than 5% of the measured wind velocity of the tunnel. Therefore, the method of using the numerical simulation to study the stability of the ventilation flow field in tunnel constructions is feasible.
4. The Numerical Model and Related Parameters Calculation
4.1. Establishment of the Numerical Model
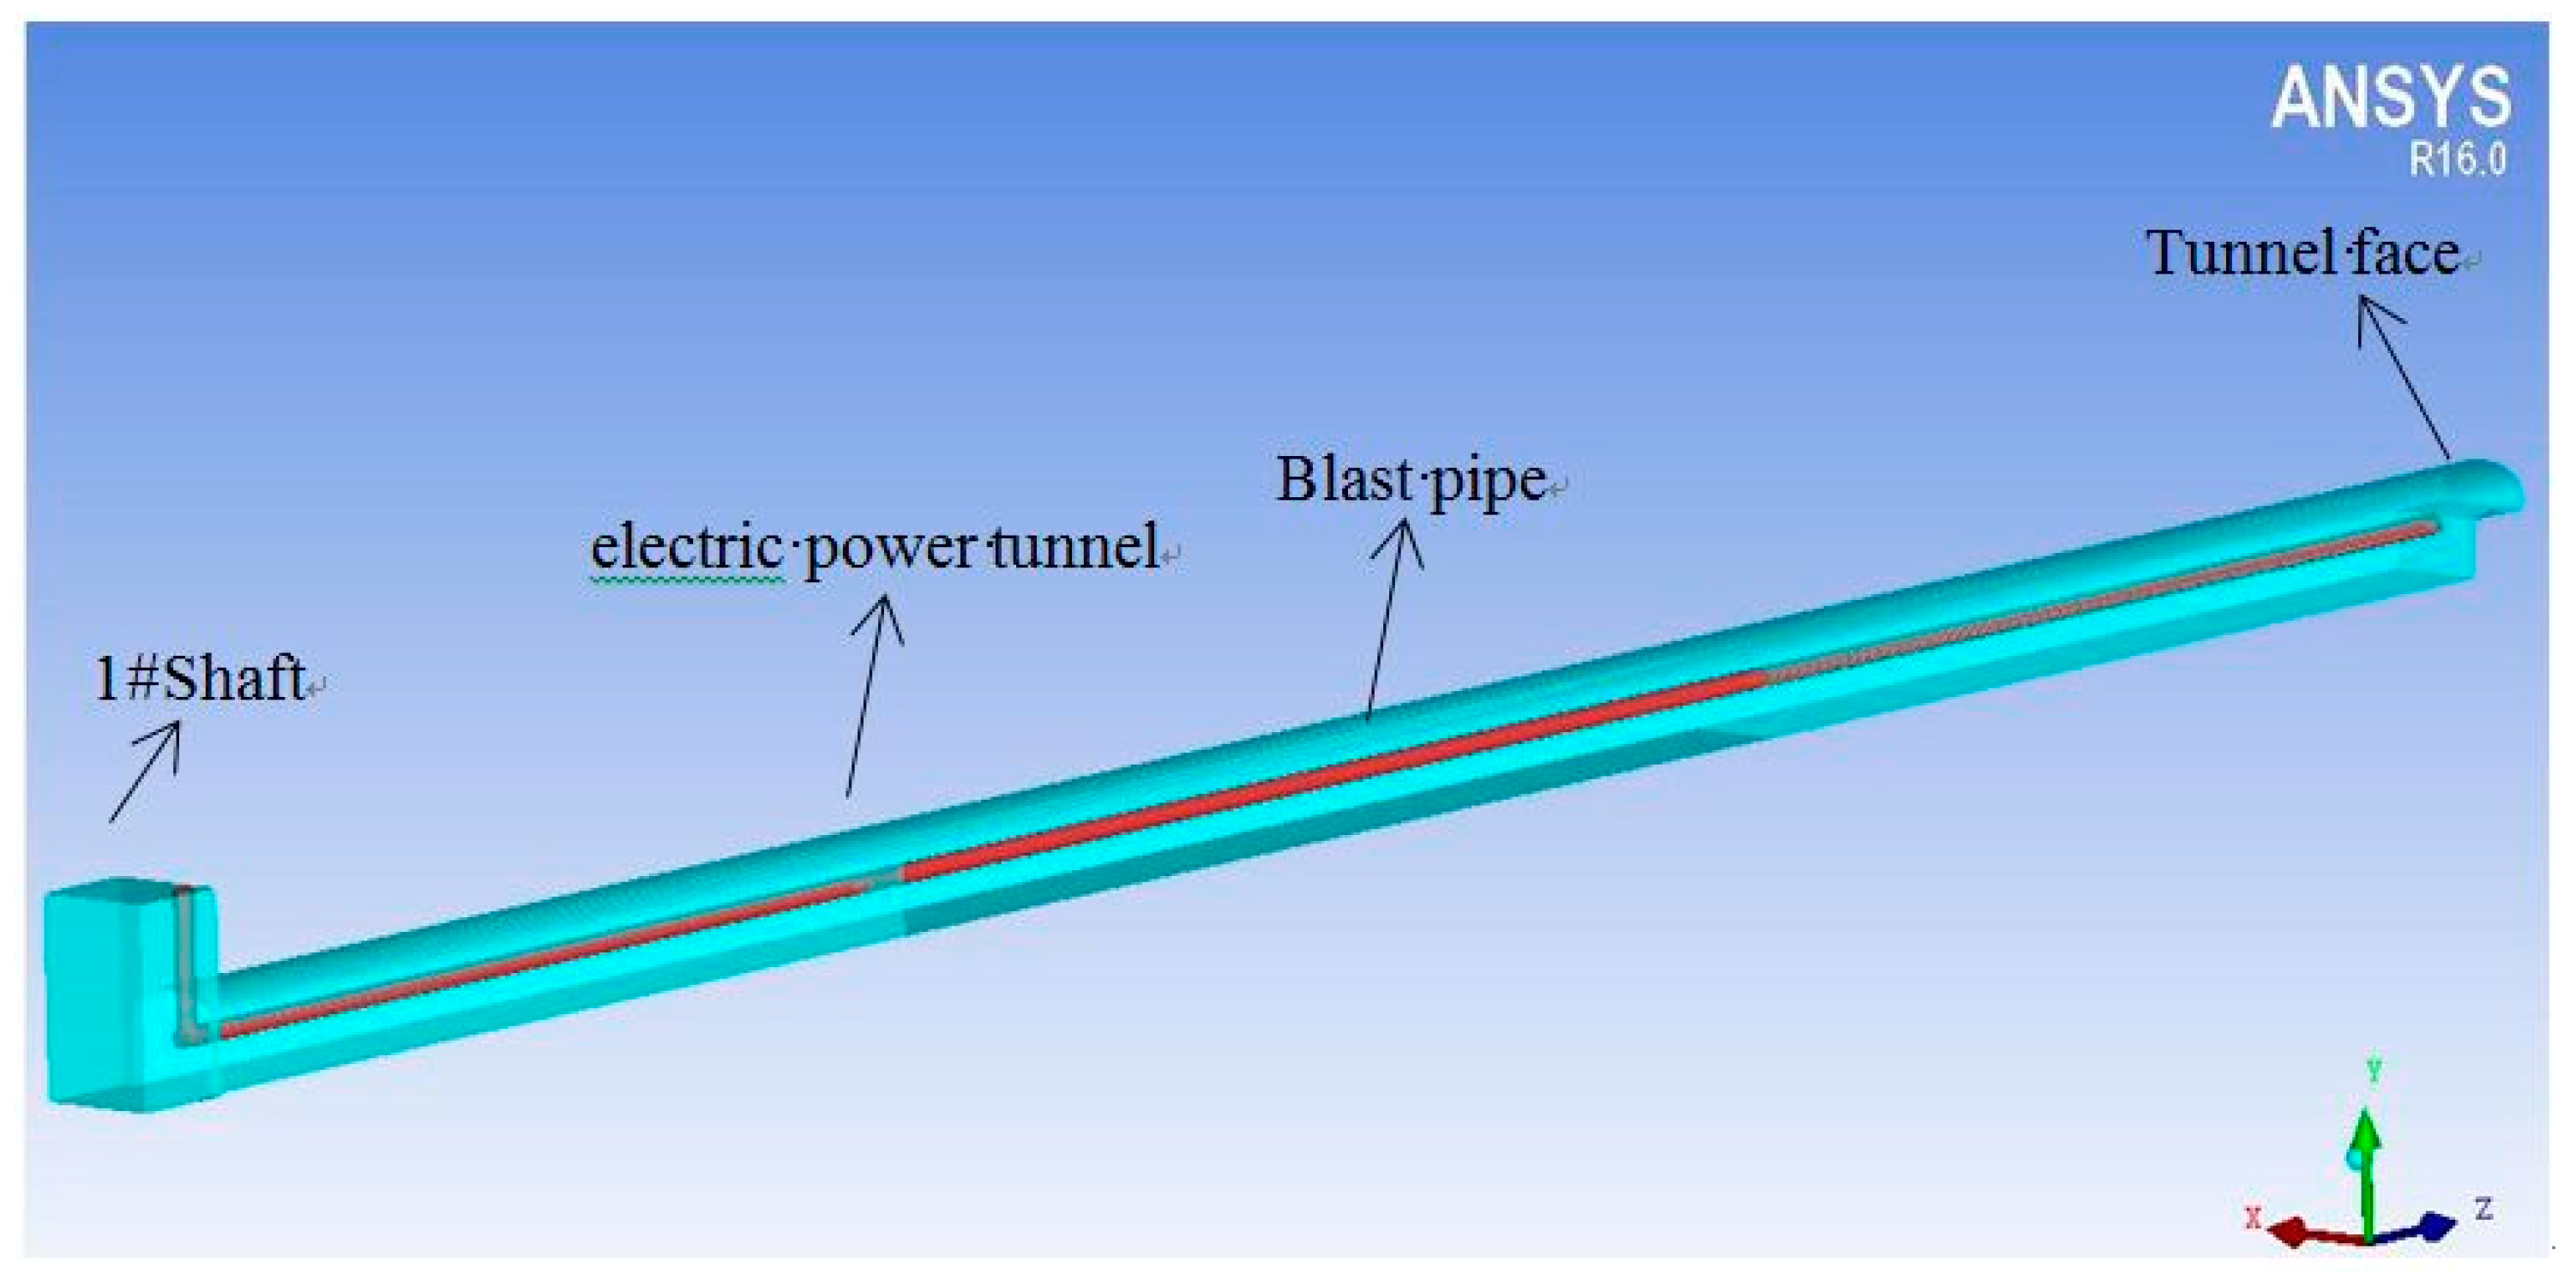
When the tunnel construction reaches the second shaft position, the second shaft position is the channel that air duct layout and waste gas excluding. Therefore, the tunnel construction to the second front shaft is the most unfavorable situation in terms of ventilation. Ignoring the influence of operating personnel and trolleys on the ventilation effect, a three-dimensional model is shown in Figure 4.
4.2. Calculating Operating Conditions
In order to study the influence of the distance between the orifice of the blast pipe and the tunnel face on the ventilation effect, an air duct with a diameter of 1.0 m is taken as an example. The distance L from the orifice to the tunnel face (as shown in Figure 1) is taken as 5 m, 8 m, 10 m and 12 m, respectively. Then, using the two stable aspects of velocity and wind velocity flow field, the influence of different L values on the ventilation effect is analyzed. Afterwards, the optimal distance between the orifice of the blast pipe and the tunnel face is selected to study the influence of the air duct diameter on tunnel ventilation. The air duct diameter D is taken as 1.0 m, 1.1 m, 1.2 m, 1.4 m, 1.6 m, and 1.8 m.
4.3. Setting Boundary Conditions
When the blast pipe diameter is 1.0 m, the blast pipe velocity is 14.4 m/s (calculated according to the air volume required by the tunnel) with a Mach number of M = 0.042 < 0.2. Thereby, the air is processed by the incompressible fluid. According to Equation (1) [4], to calculate the Reynolds number (Re) under different operational conditions, when the air duct diameter is 1.8 m, the minimum value is approximately 534,460 and the jet medium is in a turbulent state. The standard model put forward by Launder and Spalding is used for the numerical simulation of turbulent airflow in tunnels. The control parameters used are the default values of Fluent, with turbulence intensity I, turbulent kinetic energy k, and turbulent dissipation coefficient e, which are all calculated through each operational condition on the basis of Equations (2)–(4) [4], respectively.
where is the air density with 1.205 kg/m3, is the flow velocity of the air medium in the air duct, is the equivalent diameter of the air duct, is the turbulent scale, and is the empirical constant (0.09).
The outlet of the air duct is set as a velocity-inlet, as shown in Figure 4. Thus, it only needs to set the velocity value of the jet medium in the Z direction. The inlet of the vertical shaft is an outlet for waste residue and waste gas and is set as an outflow. The remaining objects such as the tunnel face, bench face, air duct wall, tunnel wall, and vertical shaft wall are all set as walls in Fluent.
5. Analysis of the Numerical Simulation Results
5.1. The Influence of the Distance between the Orifice and the Tunnel Face on the Wind Velocity Flow Field
Peng Pei [2] researched the influence of the distance between the orifice and tunnel face on the wind velocity flow field when the bench length was 20 m and put forward the idea that the ventilation effect is optimal when the distance of the orifice from the tunnel face is 5 m–10 m. The bench length of the project is small and, for convenience, the air duct can only be installed near the tunnel sidewalls and the orifice lies at the intersection of the upper and lower steps. Therefore, the value of L is the following distances of the orifice from the lower tunnel face: 5 m, 8 m, 10 m and 12 m. The influence of the distance between the orifice and the tunnel face on the wind velocity flow field is studied.
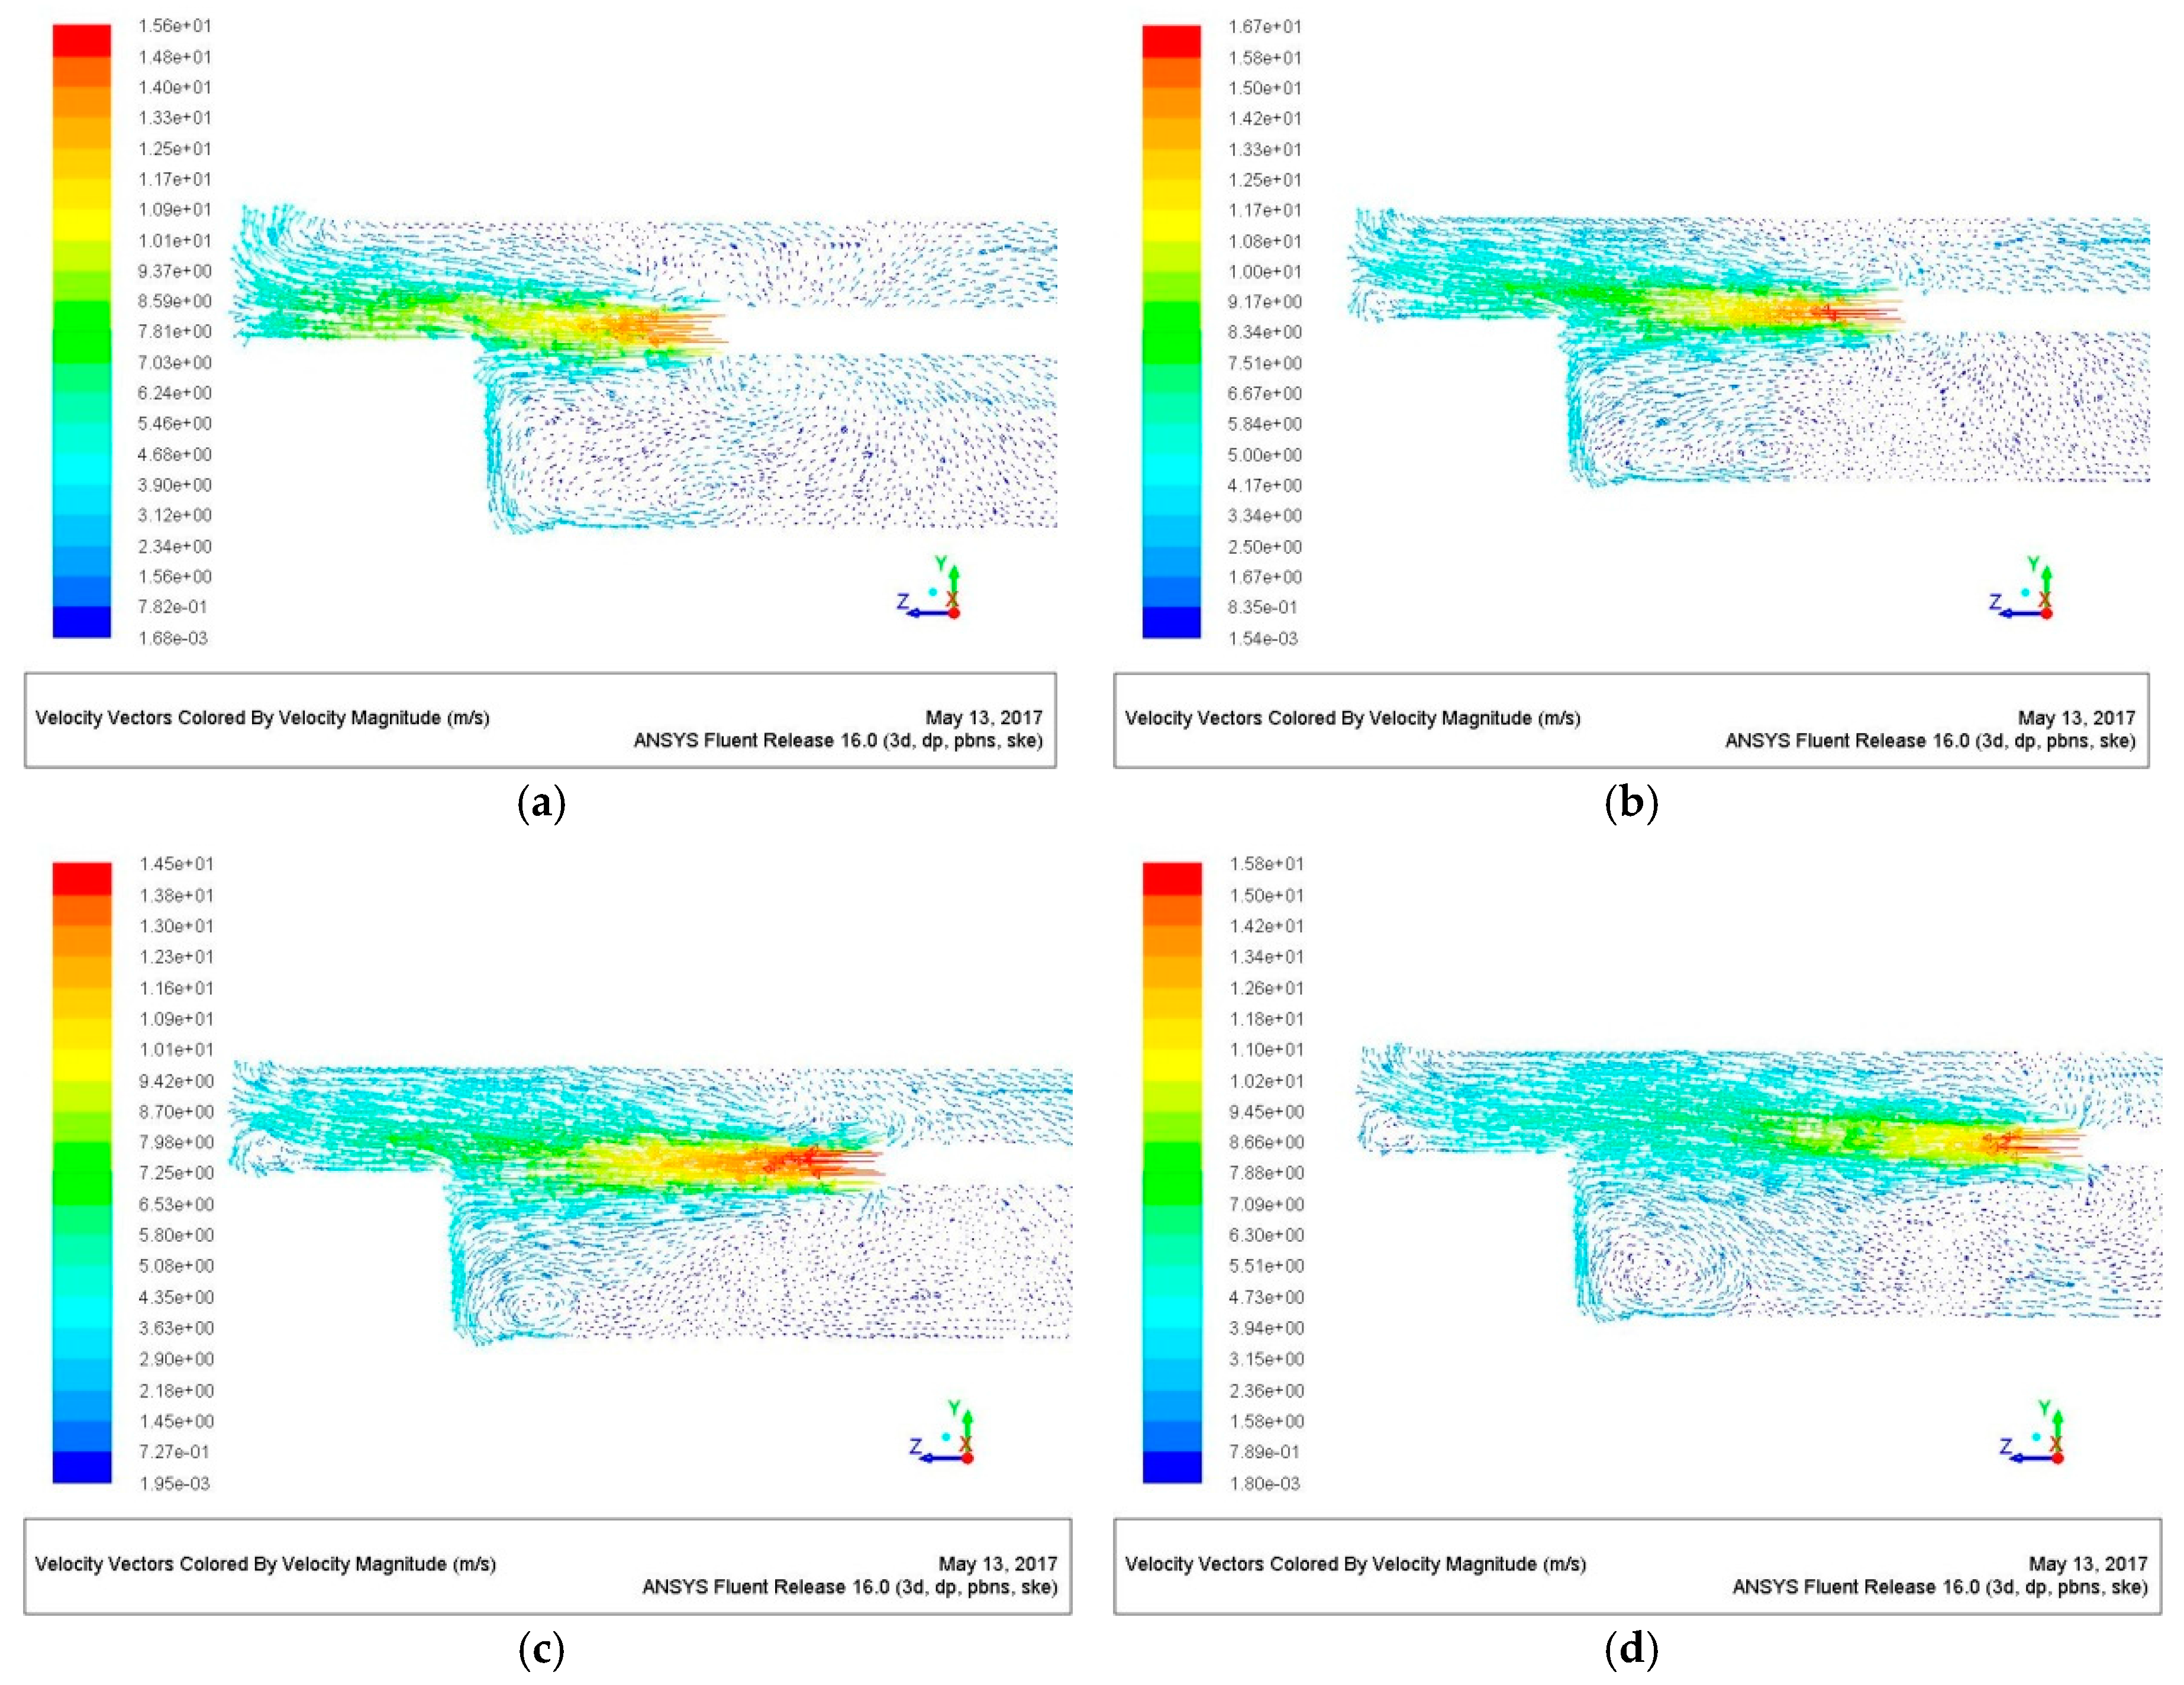
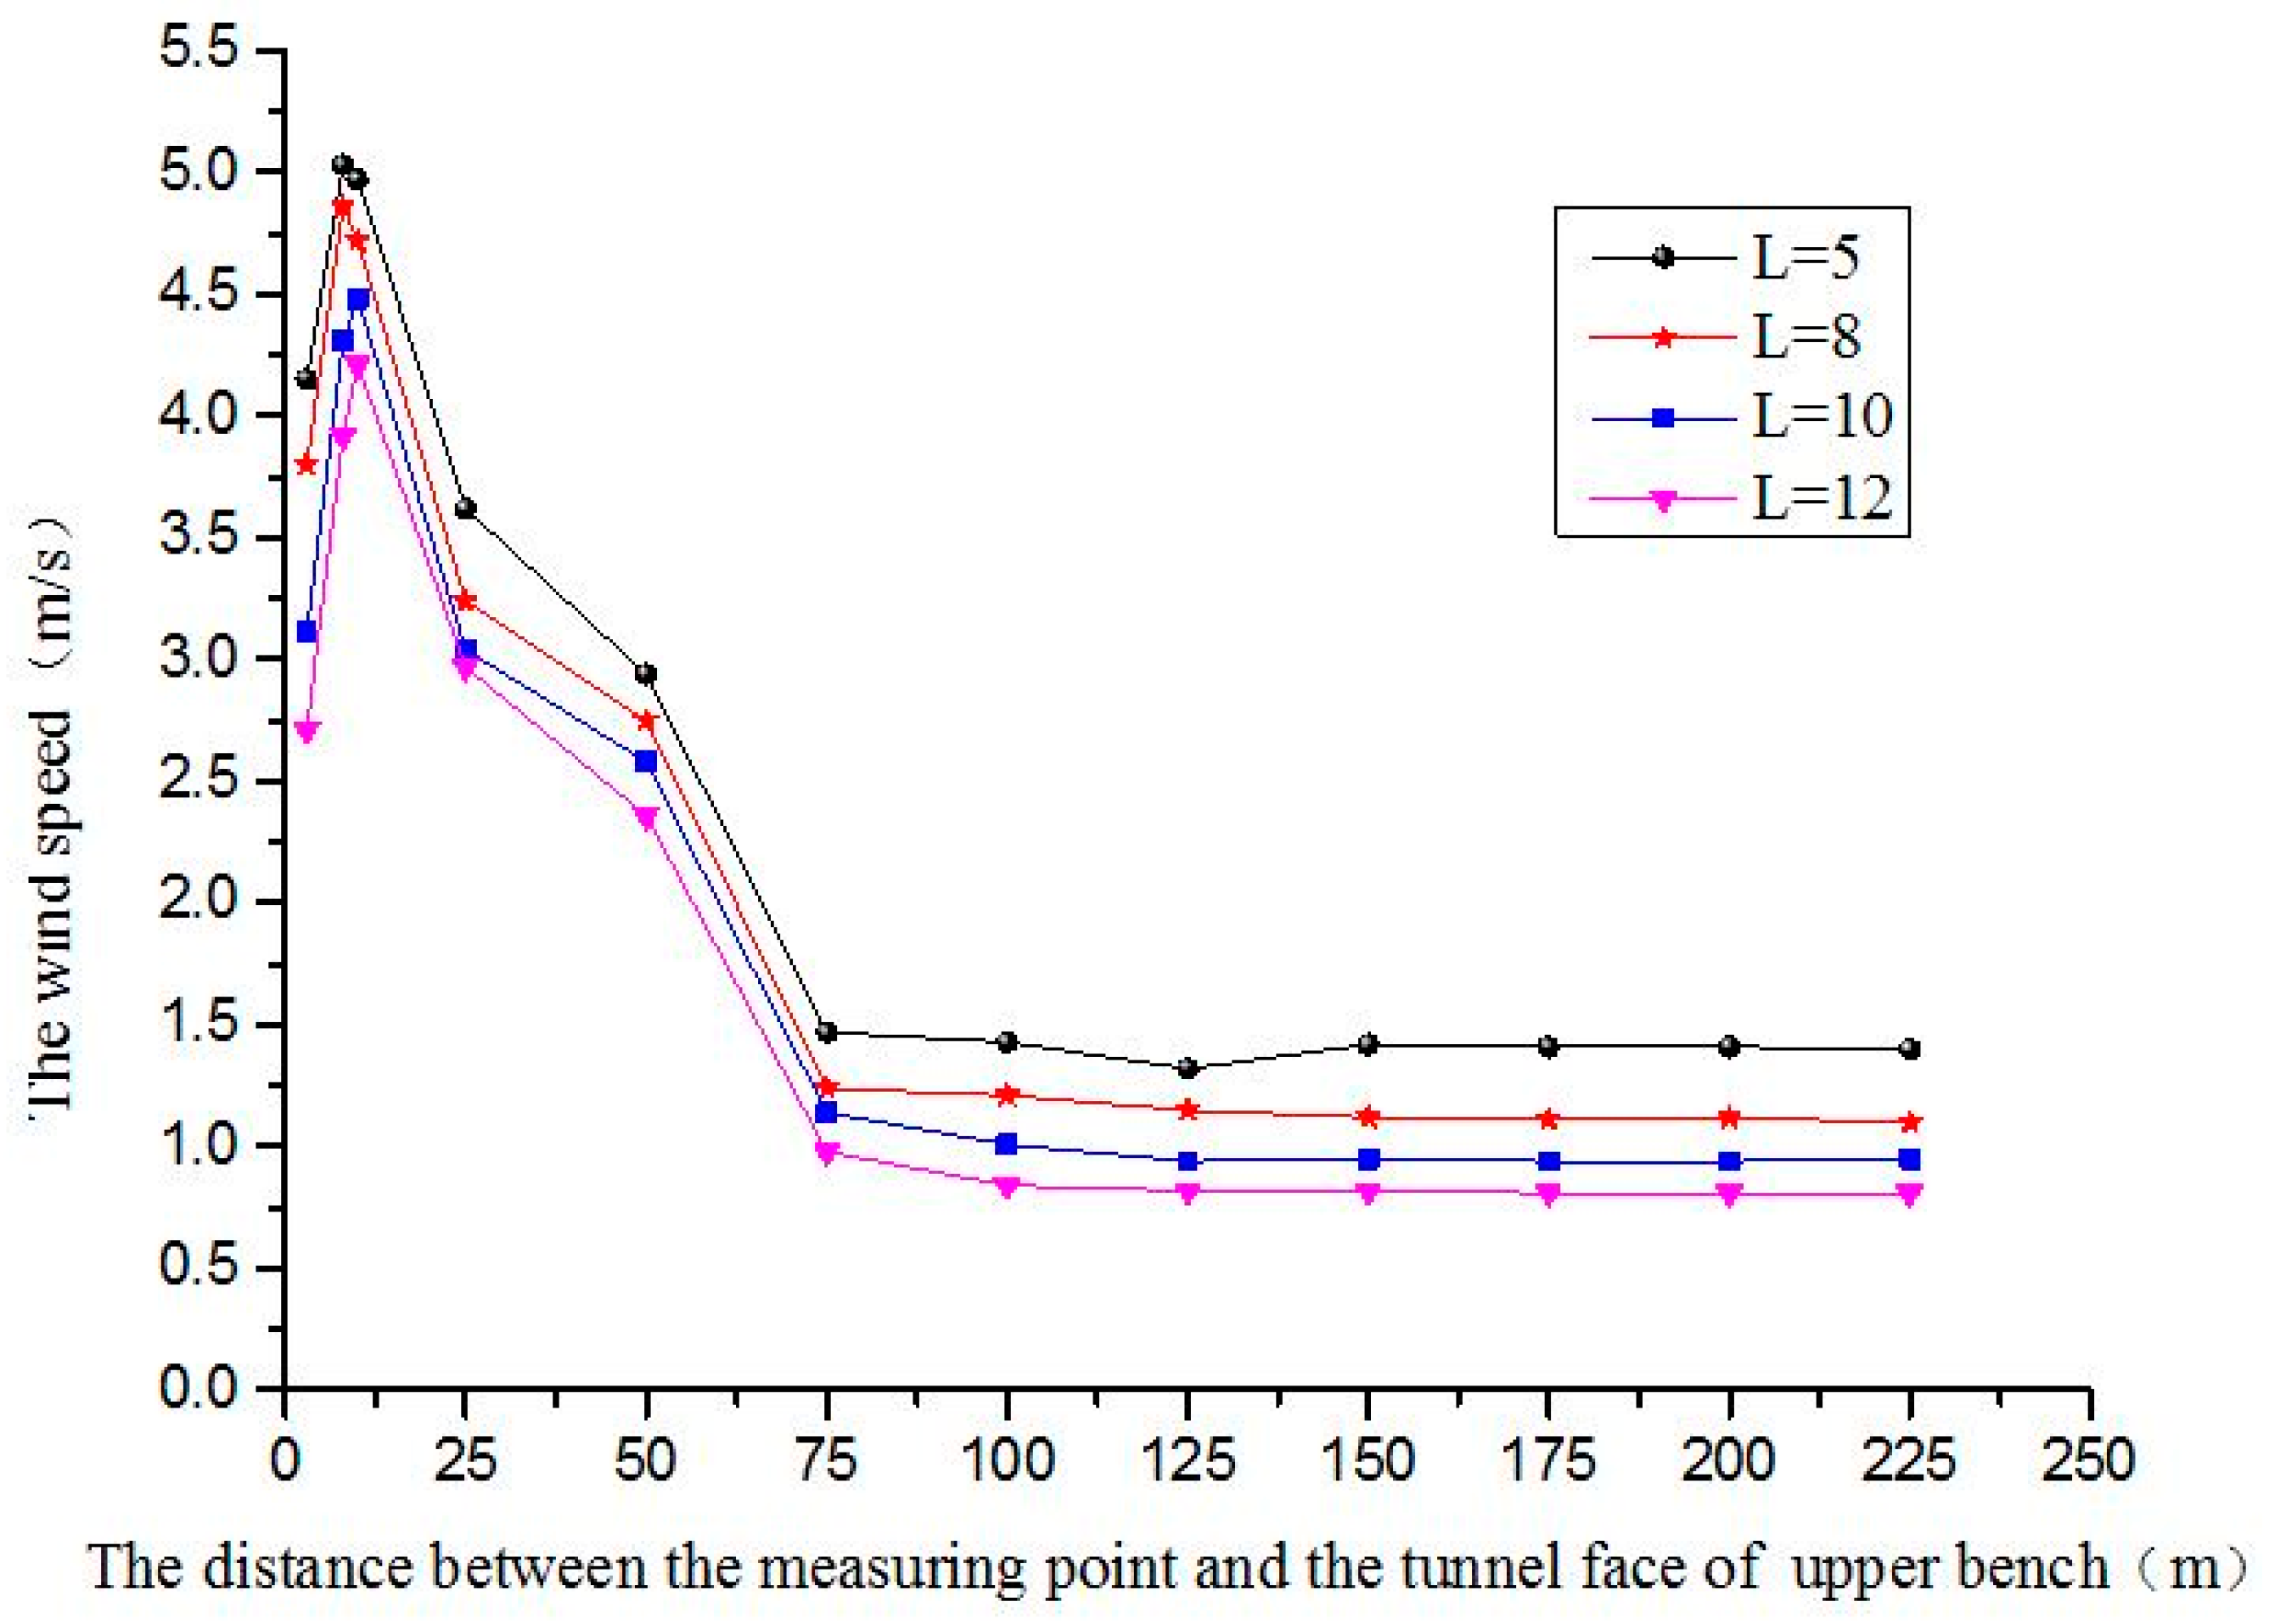
Figure 5 is the distribution diagram of the wind velocity flow field in the tunnel when the air duct diameter is 1.0 m and the distance (L) between the blast pipe and the lower bench is 5 m, 8 m, 10 m and 12 m, respectively. Figure 6 is the velocity of each measuring point when the distance between the blast pipe and the tunnel face is 5 m–12 m. The following conclusions can be obtained from Figure 5 and Figure 6:
- When L is 5 m, the wind velocity flow field in the upper bench is very uniform without backflow. This is because, with the close distance between the air duct and the tunnel face of the lower bench, the air sent by the air duct tends to have a downward trend and clings to the tunnel face without an obvious backflow. However, the uniformity of the airflow field behind the tunnel face is significantly poor.
- When L is 8 m, the wind velocity flow field in the upper step is relatively uniform without backflow. At this moment, the distance between the orifice and tunnel face is far and the differential flow field of the lower step improves largely without backflow. The uniformity of the air flow field in the upper and lower tunnel faces is good.
- When L is 10 m and 12 m, the backflow appears below the upper tunnel face. When L = 10 m, the ground behind the lower tunnel face appears to be an obvious vortex area and when the distance between the air duct and tunnel face increases to 12 m, the vortex area enlarges and new vortex areas appear behind it.
- Calculation results show that when the distance between the orifice and tunnel face is 8 m, the wind velocity flow field near the upper and lower tunnel face is the most uniform without obvious backflow.
5.2. The Influence of the Air Duct Diameter on the Wind Velocity Flow Field
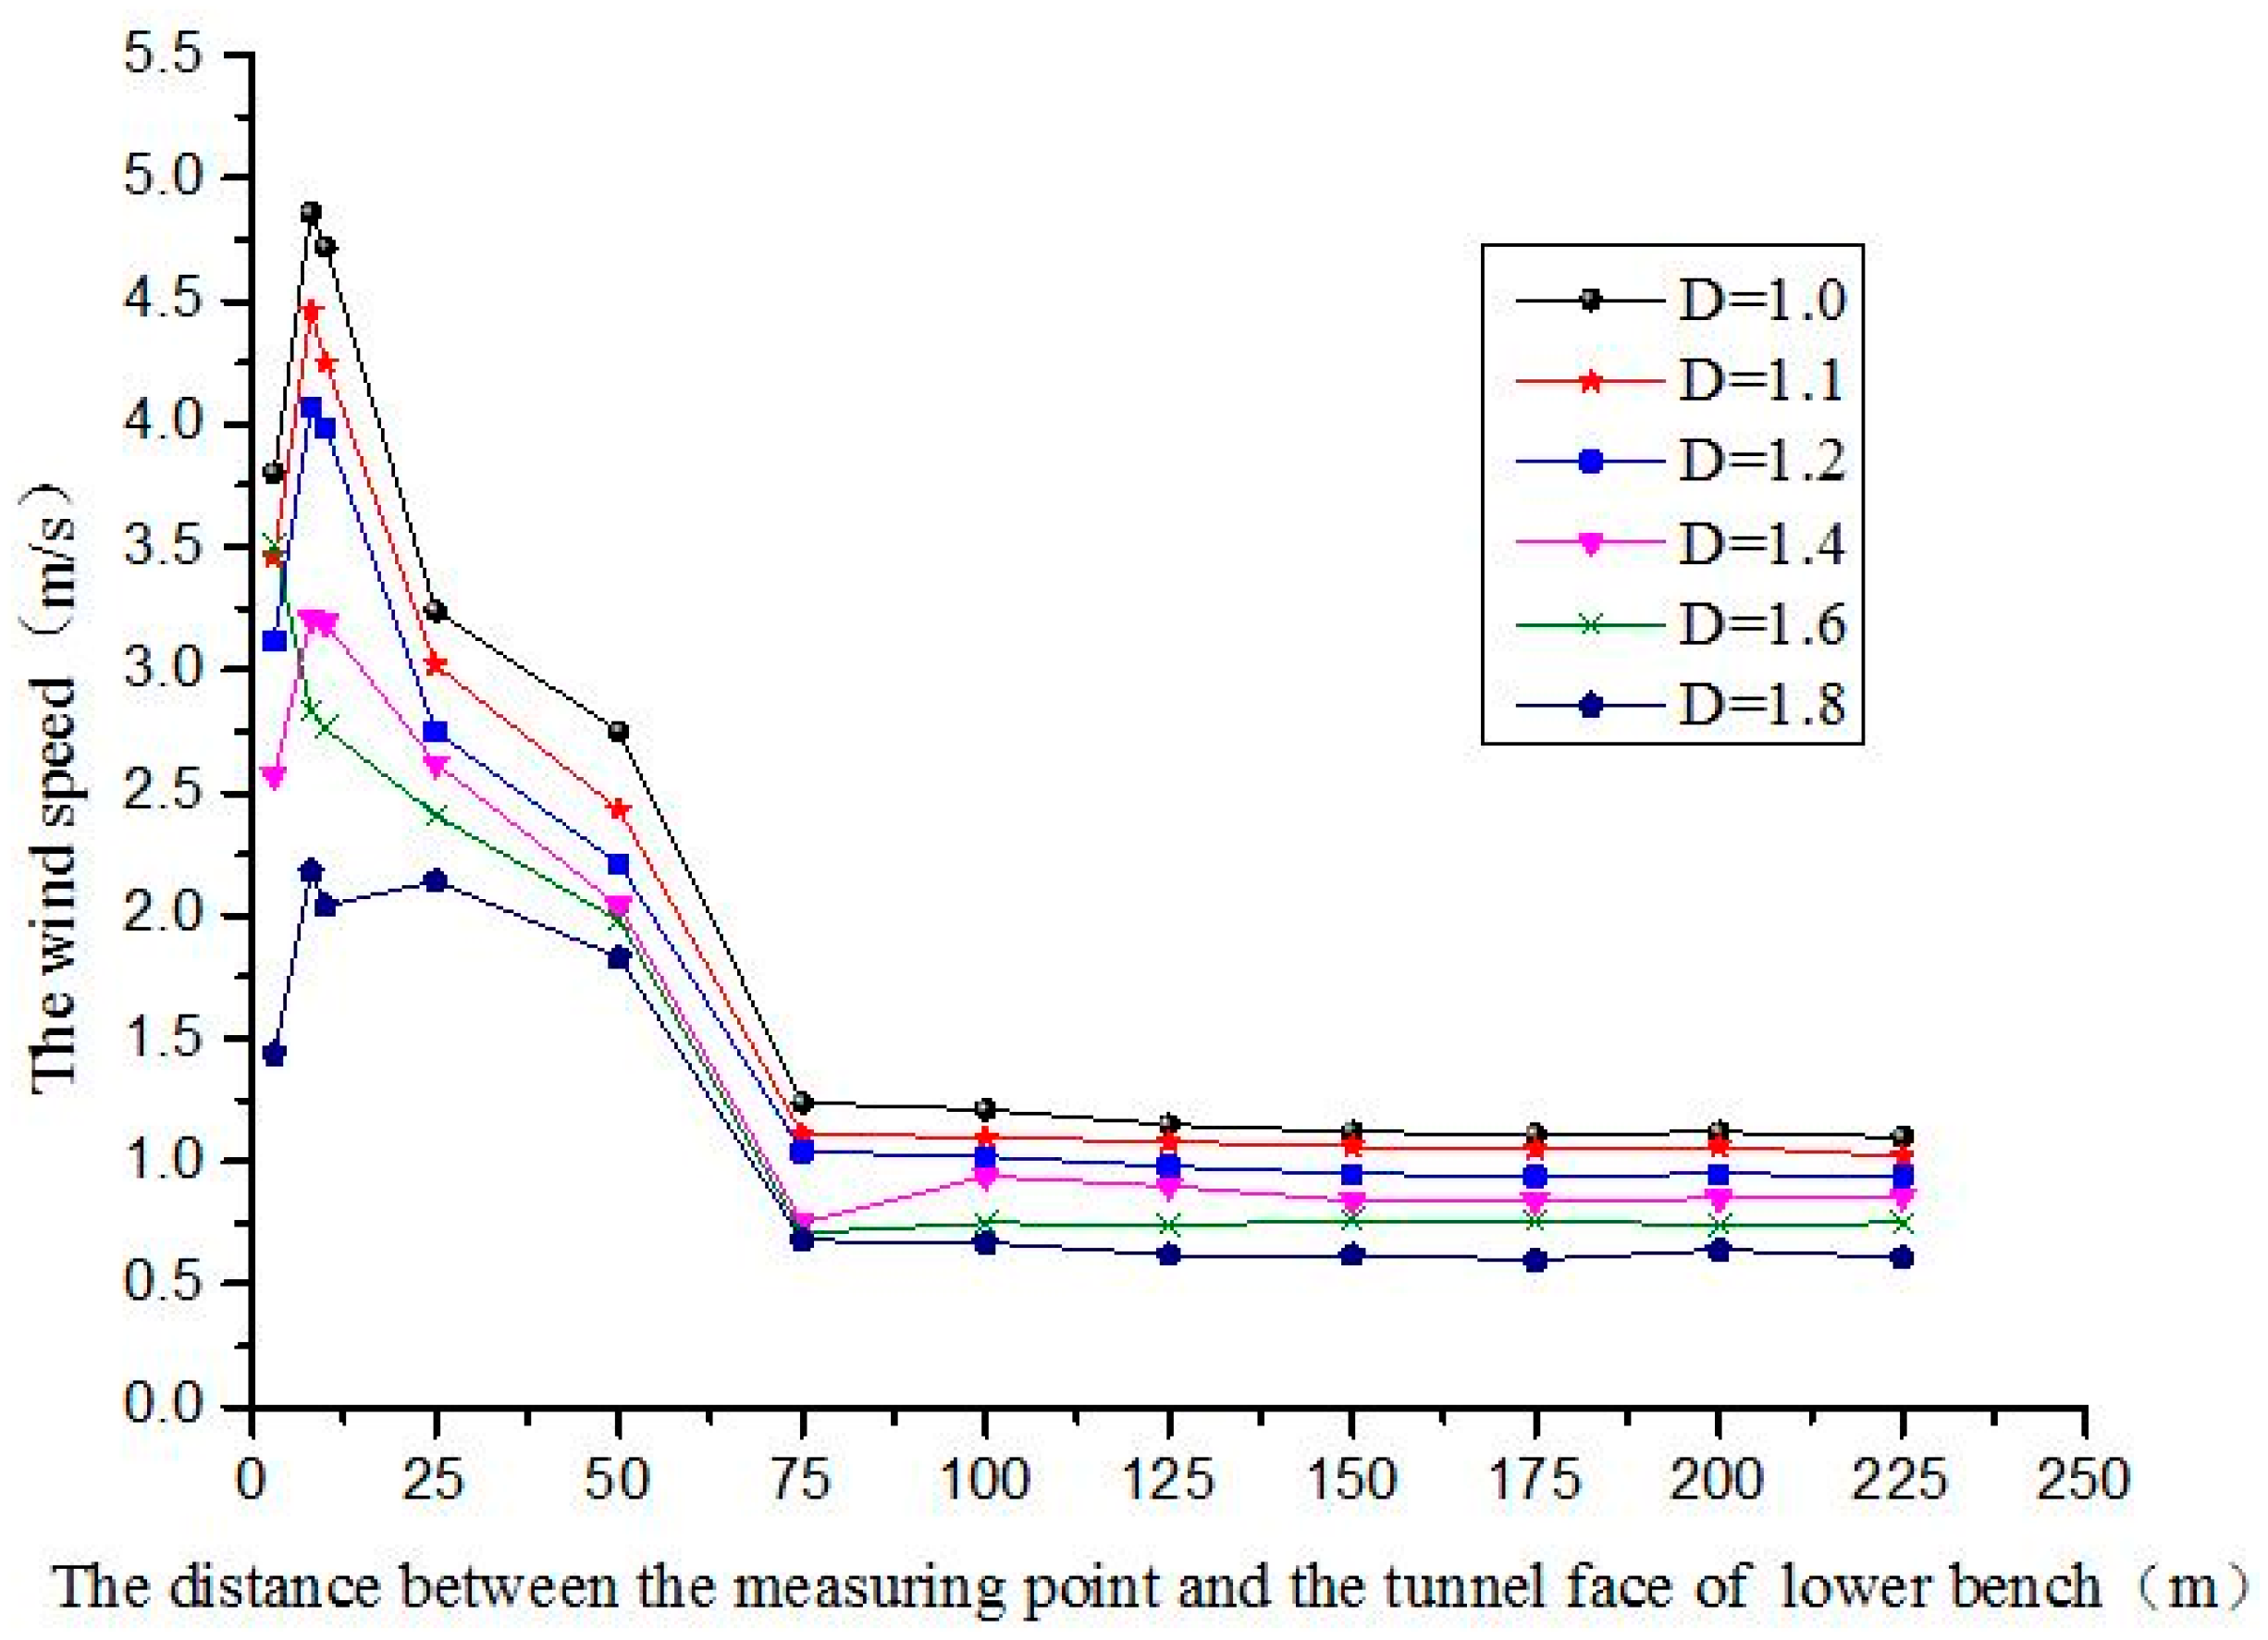
For security and economic reasons, the air volume transported to the tunnel is certain. That is, when the diameter of the pipe changes, the velocity changes with it. Wesely et al. [14] found that increasing the air duct diameter in a certain range can render the wind velocity flow field more uniform. This portion of the paper focuses on the distribution of wind velocity flow fields in tunnels when the air duct diameter (D) is 1.0 m, 1.1 m, 1.2 m, 1.4 m, 1.6 m, and 1.8 m respectively.
Figure 7 is the distribution of the wind velocity flow field when the value of the air duct diameter is different. We can obtain the following conclusions from Figure 8:
- After comparing the distribution of the wind velocity flow field in the tunnel when the value of air duct diameter is different, as shown in Figure 4, it is clear that when D is 1.0 m, 1.1 m and 1.2 m, due to the large velocity when the pipe diameter is small, a lot of energy is rebounded after touching the wall, leading to a less than ideal ventilation effect occurring in the corner of the wall.
- When the air duct diameter is 1.6 m and 1.8 m, due to the further reduction of the velocity of the orifice, an obvious backflow appears at the tunnel face of the upper step near the ground. The ventilation effect is also not ideal at this moment.
- When the air duct diameter is 1.4 m, there is not only obstructed ventilation in the corner because of the large velocity when the air duct diameter is small, but the backflow is also prevented from forming near the tunnel face when the air duct diameter is large.
6. Conclusions
This article uses the Fluent finite element software and takes the subsurface tunnel near Xinghaiwan Square in the project of quadruple-circuit transmission line reconstruction in Yanta, Dalian as an example. The parameter optimization of forced ventilation in construction and excavation by manipulating the distance of the orifice to the tunnel face and the blast pipe diameter provides a powerful basis for the optimization of the ventilation scheme in the construction process. Through numerical simulation research, the following main conclusions were drawn:
- After obtaining the related parameters in the first stage of the construction ventilation from a tunnel in the northwestern area of China, a numerical model was established to achieve the simulated value of the velocity of each measuring point and compare them with the measured values found in order to ascertain whether the numerical simulation applied in this study was entirely feasible.
- The ventilation effect is better when the wind pipe is arranged on one side of the tunnel wall (an asymmetrical layout), although the space in the tunnel is axisymmetric.
- When the air duct diameter is 1 m, the calculation results are as follows: when the distance between the air duct and tunnel face is 5 m, the uniformity of the air flow field near the tunnel face is poor compared to when the distance between them is 8 m, even though there are no obvious vortex zones. However, when the distance is 10 m or 12 m, vortex zones appear in the tunnel. Thus, it is more reasonable when the distance between the air duct and the tunnel face is 8 m.
- When the distance between the air duct and the tunnel face is 8 m and the air duct diameter is less than or equal to 1.2 m, the velocity is high as the pipe diameter is small and a large amount of energy is rebounded after touching the wall, which leads to the non-ideal ventilation effect outputting from the corner of the wall. However, when the pipe diameter is more than or equal to 1.6 m, the upper tunnel face near the ground appears to show more obvious backflow for the small velocity of the orifice.
- When the air duct is 1.4 m and the distance between the orifice and tunnel face is 8 m, there is no obvious backflow in the tunnel and the uniformity of wind velocity flow field is good, which can be regarded as the best combination for application in practical engineering.
- We can obtain better ventilation effect when the distance between the nozzle of the ventilator and the tunnel face is 6 m–9 m and the wind speed of the nozzle is 6 m/s–8 m/s. In practical engineering, the wind speed and the required air volume should be taken into consideration to determine the diameter of the ventilator.
Author Contributions
Xiaokai Niu conceived the work that led to the submission and designed monitoring scheme of wind speed in construction site; Dingli Zhang researched on numerical simulation method and played an important role in interpreting the results; Jie Su obtained numerical simulation data and drafted the manuscript; Hong Guo obtained data from the construction site and revised the manuscript.
Conflicts of Interest
The authors declare no conflict of interest.
References
- Tan, X.; Chen, S.; Zhou, Z. Air Quality Field Testing in Tunnel Construction with the Drilling and Blasting Method. Chin. J. Undergr. Space Eng. 2016, 12, 567–572. [Google Scholar]
- Peng, P.; Fang, Y.; Zhou, C.Y.; Chen, X.G. Effect Analysis and Parameter Optimization of Forced Ventilation during Tunneling; Railway Standard Design: Beijing, China, 2014. [Google Scholar]
- Fang, Y.; Peng, P.; Zhao, Z.; Zhou, C.Y. Numerical Simulation of the Effect of Outlet Position of Air Duct on the Construction Ventilation of the Tunnel. Chin. J. Undergr. Space Eng. 2014, 10, 468–473. [Google Scholar]
- Oka, Y.; Oka, H. Velocity and temperature attenuation of a ceiling-jet along a horizontal tunnel with a flat ceiling and natural ventilation. Tunn. Undergr. Space Technol. 2016, 56, 79–89. [Google Scholar] [CrossRef]
- Wesely, R. Airflow at heading faces with forcing auxiliary ventilation. In Proceedings of the 3rd International Mine Ventilation Congress, Harrogate, UK, 13–19 June 1984; pp. 73–82. [Google Scholar]
- Zhang, H.; Chen S, G.; Chen, L. A Study on Large Power Jet Ventilation Technology in Long Tunnel Construction. Appl. Mech. Mater. 2011, 94, 1800–1804. [Google Scholar] [CrossRef]
- Zhang, H.; Fang, L.; Sun, J.; Zhou, Z. CFD Analysis of Tunnel Construction Ventilation Effect Based on Typical Wall Roughness Model; China Railway Science: Beijing, China, 2016. [Google Scholar]
- Fang, Y.; Fan, J.; Kenneally, B.; Mooney, M. Air flow behavior and gas dispersion in the recirculation ventilation system of a twin-tunnel construction. Tunn. Undergr. Space Technol. 2016, 58, 30–39. [Google Scholar] [CrossRef]
- Mirhedayatian, M.; Jelodar M, J.; Adnani, S.; Akbarnejad, M.; Saen, R.F. A new approach for prioritization in fuzzy AHP with an application for selecting the best tunnel ventilation system. Int. J. Adv. Manuf. Technol. 2013, 68, 2589–2599. [Google Scholar] [CrossRef]
- Liu D, W.; Tang, Y.; Li, B.; Peng, W.-D. Numerical simulation and test analysis of construction ventilation air duct optimization in gas tunnel. China J. Highw. Transp. 2015, 28, 98–103. [Google Scholar]
- Wang, X.; Zhen, L.; Yang, A.; Zhang, A. Simulation for Construction Ventilation Two-Phase Flow in Diversion Tunnel Considering Heat Exchange. J. Tianjin Univ. 2013, 46, 322–327. [Google Scholar]
- He, K.; Ye, M.; Li, Y.; Chen, J. Characteristic Research on Construction Ventilation Flow Field of Cross Tunnel. J. Sichuan Univ. 2014, 46, 20–25. [Google Scholar]
- Zhang X, J.; Zhou C, Y.; Fu, Y.P.; Fang, Y. Construction Ventilation of Tongluoshan Expressway Tunnel. Adv. Mater. Res. 2013, 838–841, 1234–1239. [Google Scholar] [CrossRef]
- Wang, X.; Zhang, Z.; Zhou, Z.; Chen, H. Numerical simulation of TBM construction ventilation in a long diversion tunnel. Tunn. Undergr. Space Technol. 2011, 26, 560–572. [Google Scholar] [CrossRef]
- Zolfani, S.H.; Esfahani, M.H.; Bitarafan, M.; Zavadskas, E.K.; Arefi, S.L. Developing a new hybrid MCDM method for selection of the optimal alternative of mechanical longitudinal ventilation of tunnel pollutants during automobile accidents. Transport 2013, 28, 89–96. [Google Scholar] [CrossRef]
- Wang, X.Y.; Spearpoint, M.J.; Fleischmann, C.M. Investigation of the effect of tunnel ventilation on crib fires through small-scale experiments. Fire Saf. J. 2017, 88, 45–55. [Google Scholar] [CrossRef]
- Zhang, Q.; Guo, X.; Trussoni, E.; Astore, G.; Xu, S.; Grasso, P. Theoretical analysis on plane fire plume in a longitudinally ventilated tunnel. Tunn. Undergr. Space Technol. 2012, 30, 124–131. [Google Scholar] [CrossRef]
- Cardillo, L.; Corsini, A.; Delibra, G.; Rispoli, F.; Sheard, A.G. A numerical investigation into the aerodynamic effect of pressure pulses on a tunnel ventilation fan. Proc. Inst. Mech. Eng. Part A J. Power Energy 2014, 228, 285–294. [Google Scholar] [CrossRef]
- Fouladgar, M.M.; Yazdani-Chamzini, A.; Zavadskas, E.K. Risk evaluation of tunneling projects. Arch. Civ. Mech. Eng. 2012, 12, 1–12. [Google Scholar] [CrossRef]
Figure 1.
The tunnel section formation and the layout position of air duct (unit: m).

Figure 2.
The first stage of the ventilation construction of a tunnel in the northwest regions of China.
Figure 2.
The first stage of the ventilation construction of a tunnel in the northwest regions of China.

Figure 3.
The comparison between the measured velocity and the numerical simulation results.

Figure 4.
A three-dimensional model of the electric power tunnel.

Figure 5.
The wind velocity flow field when the air duct diameter is 1.0. (a) L = 5 m; (b) L = 8 m; (c) L = 10 m; and (d) L = 12 m.
Figure 5.
The wind velocity flow field when the air duct diameter is 1.0. (a) L = 5 m; (b) L = 8 m; (c) L = 10 m; and (d) L = 12 m.

Figure 6.
The velocity of each measuring point when the distance between the blast pipe and the tunnel face is different.
Figure 6.
The velocity of each measuring point when the distance between the blast pipe and the tunnel face is different.

Figure 7.
The wind velocity flow field of the tunnel when the blast pipe diameter is different. (a) D = 1.0 m; (b) D = 1.1 m; (c) D = 1.2 m; (d) D = 1.4 m; (e) D = 1.6 m; and (f) D = 1.8 m.
Figure 7.
The wind velocity flow field of the tunnel when the blast pipe diameter is different. (a) D = 1.0 m; (b) D = 1.1 m; (c) D = 1.2 m; (d) D = 1.4 m; (e) D = 1.6 m; and (f) D = 1.8 m.
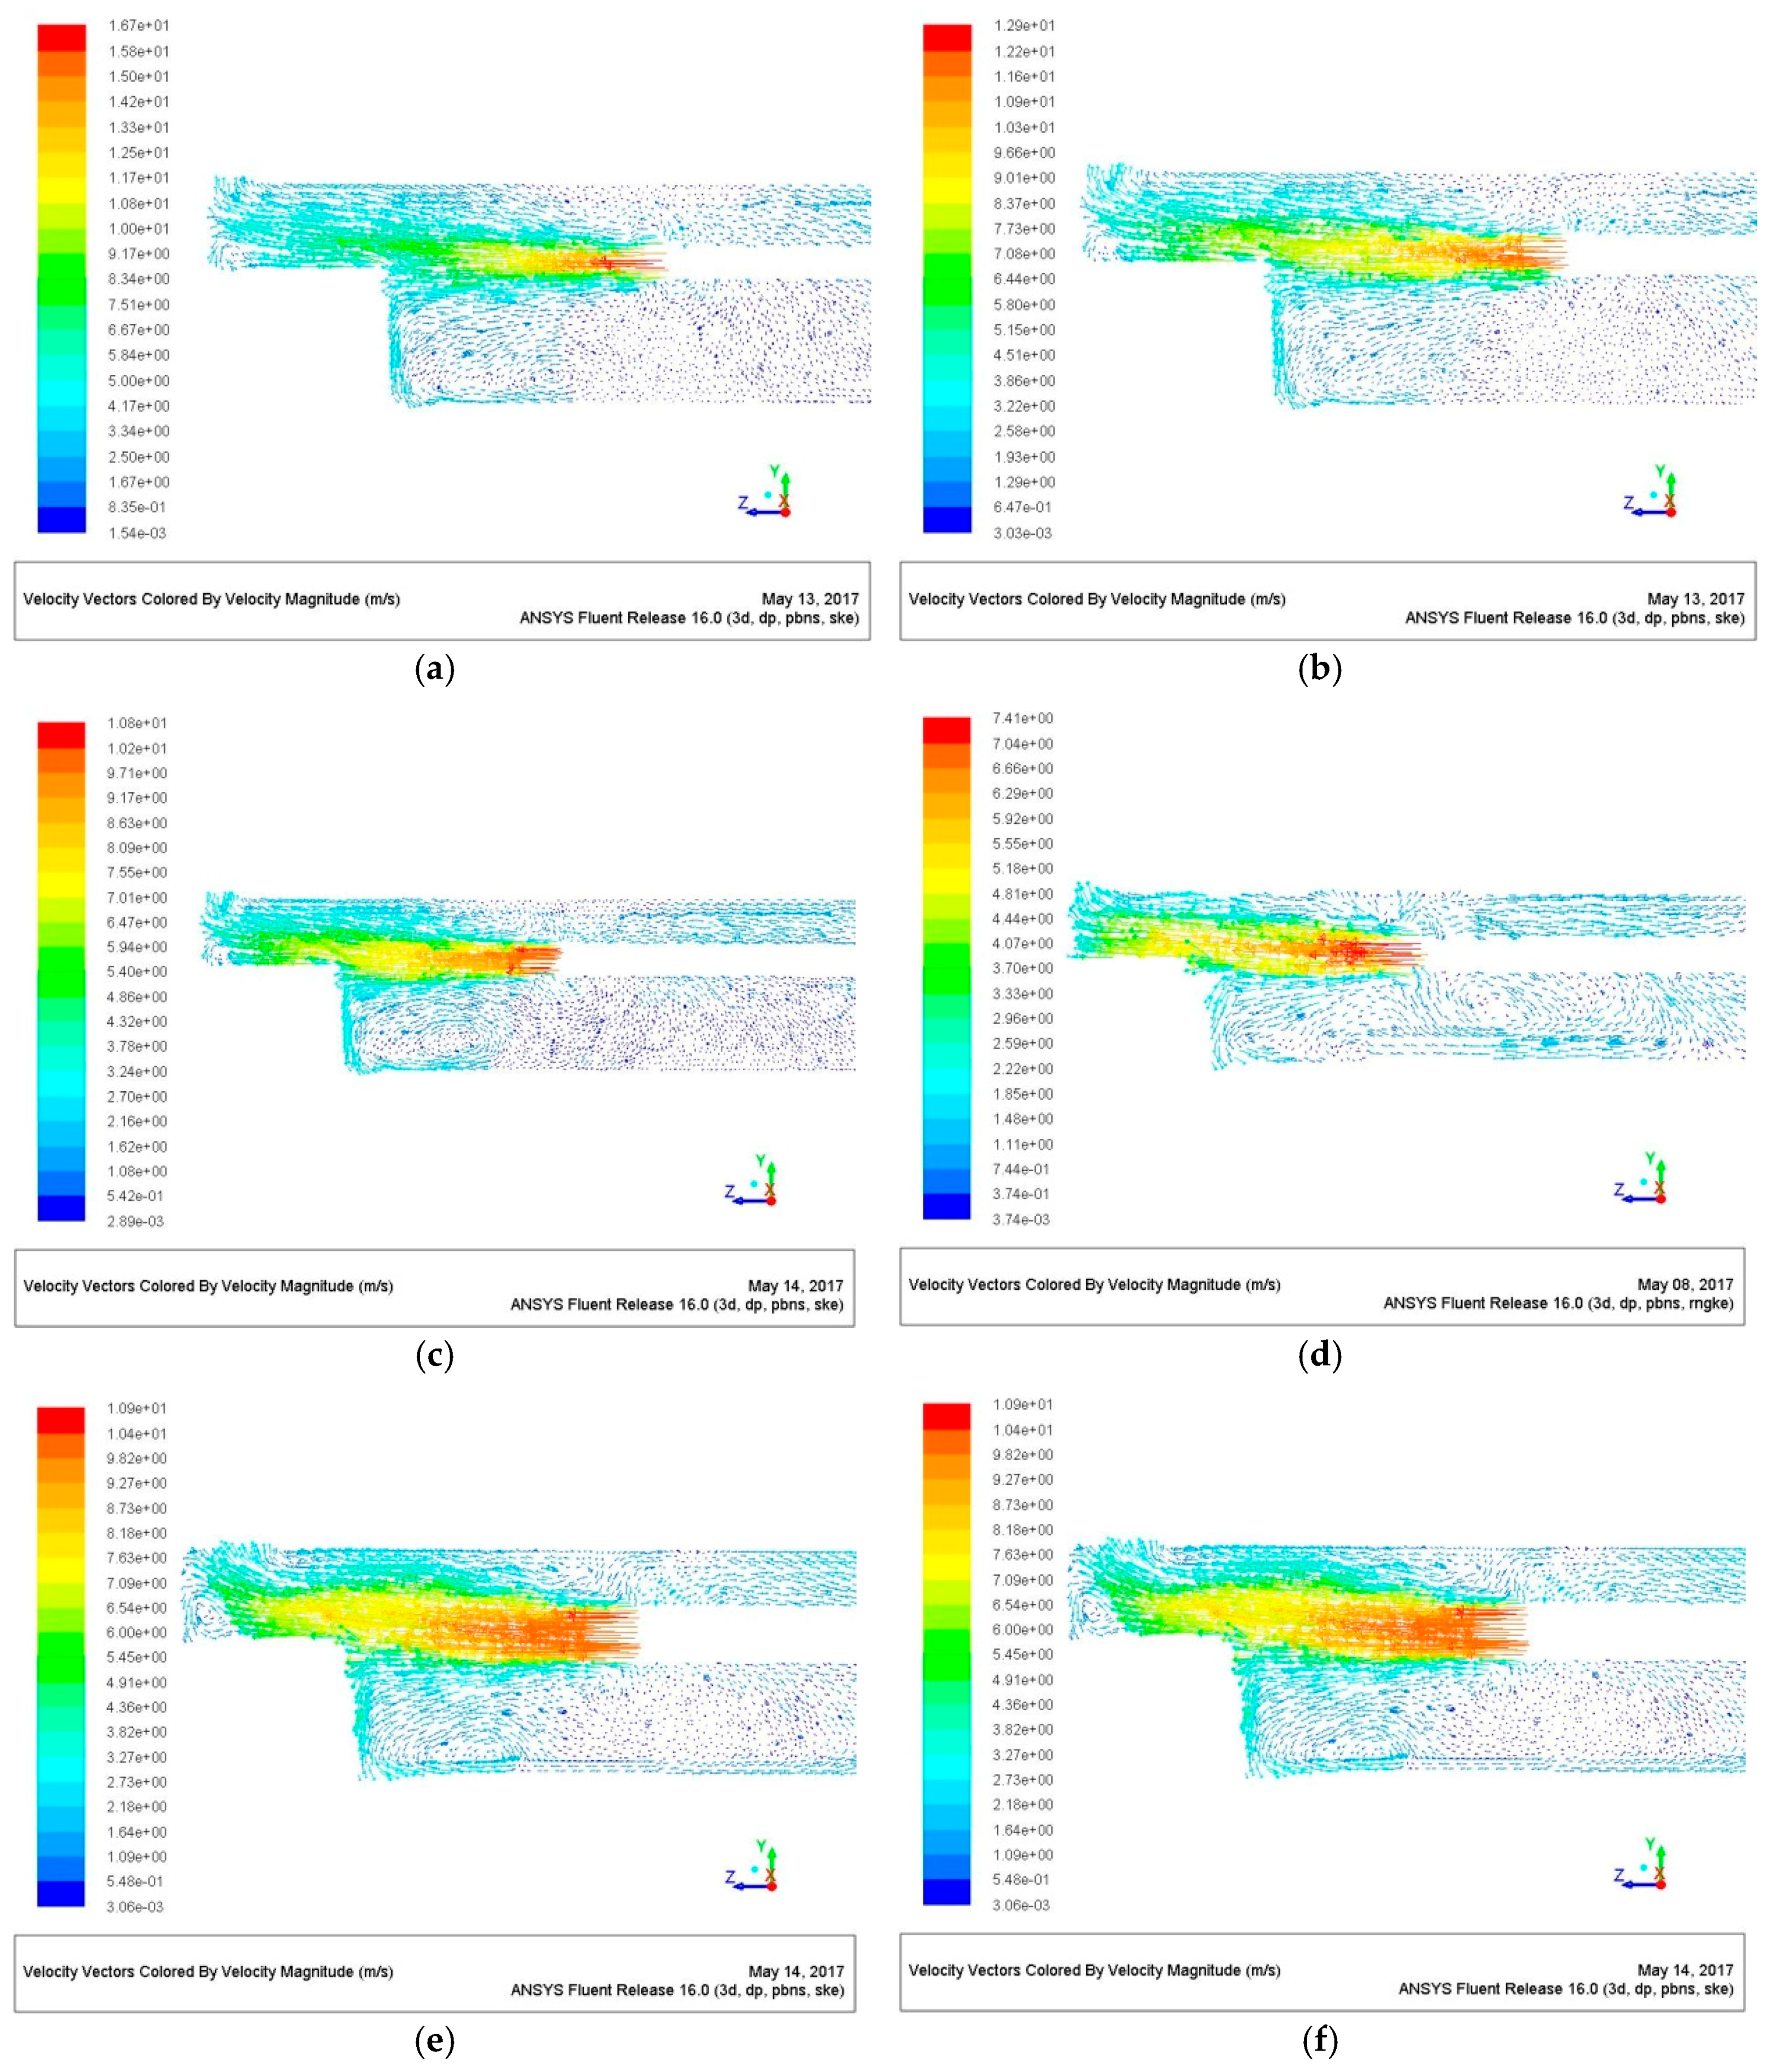
Figure 8.
The velocity of each measuring point in the tunnel when the air duct diameter is different.
Figure 8.
The velocity of each measuring point in the tunnel when the air duct diameter is different.

© 2018 by the authors. Licensee MDPI, Basel, Switzerland. This article is an open access article distributed under the terms and conditions of the Creative Commons Attribution (CC BY) license (http://creativecommons.org/licenses/by/4.0/).
Share and Cite
MDPI and ACS Style
Niu, X.; Zhang, D.; Su, J.; Guo, H. Parameter Optimization on the Forced Ventilation of Symmetric Tunnel Construction Based on the Super-Short Bench-Cut Method. Symmetry 2018, 10, 49. https://doi.org/10.3390/sym10020049
AMA Style
Niu X, Zhang D, Su J, Guo H. Parameter Optimization on the Forced Ventilation of Symmetric Tunnel Construction Based on the Super-Short Bench-Cut Method. Symmetry. 2018; 10(2):49. https://doi.org/10.3390/sym10020049
Chicago/Turabian StyleNiu, Xiaokai, Dingli Zhang, Jie Su, and Hong Guo. 2018. "Parameter Optimization on the Forced Ventilation of Symmetric Tunnel Construction Based on the Super-Short Bench-Cut Method" Symmetry 10, no. 2: 49. https://doi.org/10.3390/sym10020049
Note that from the first issue of 2016, this journal uses article numbers instead of page numbers. See further details here.