Aging Detection of Electrical Point Machines Based on Support Vector Data Description


Department of Computer Convergence Software, Korea University, Sejong Campus, Sejong City 30019, Korea
*
Author to whom correspondence should be addressed.
Symmetry 2017, 9(12), 290; https://doi.org/10.3390/sym9120290
Submission received: 28 September 2017
/
Revised: 16 November 2017
/
Accepted: 22 November 2017
/
Published: 24 November 2017
Abstract
:Electrical point machines (EPM) must be replaced at an appropriate time to prevent the occurrence of operational safety or stability problems in trains resulting from aging or budget constraints. However, it is difficult to replace EPMs effectively because the aging conditions of EPMs depend on the operating environments, and thus, a guideline is typically not be suitable for replacing EPMs at the most timely moment. In this study, we propose a method of classification for the detection of an aging effect to facilitate the timely replacement of EPMs. We employ support vector data description to segregate data of “aged” and “not-yet-aged” equipment by analyzing the subtle differences in normalized electrical signals resulting from aging. Based on the before and after-replacement data that was obtained from experimental studies that were conducted on EPMs, we confirmed that the proposed method was capable of classifying machines based on exhibited aging effects with adequate accuracy.
1. Introduction
Recently, the importance of condition monitoring [1,2,3,4,5,6] has been receiving attention in Industry 4.0 [7]. For example, fault diagnosis for railway components was reported in [8,9,10] because the maintenance of component health ensures safety on the railway. The electrical point machine (EPM) is a significant railway component that safely switches train direction. If a failure of an EPM is not quickly repaired, trains could experience serious accidents, such as derailments, which could lead to human casualties [11]. The electric motor used in EPMs generates electric current signals in specific patterns that can be used for health monitoring of the EPMs. One approach to EPM fault diagnosis involves the classification of machines based on health using support vector machines (SVM) and a discrete wavelet transform (DWT)-based strategy [11]. Further, a fault detection and diagnosis approach for EPMs has been reported using audio signals regarding different abnormal situations [12].
In this study, we focus on the aging effect in existing EPMs with a view to developing a strategy that facilitates their replacement at an appropriate time. From the perspective of safety in railway transportation, the monitoring of significant components such as EPMs is necessary and should be mandated. Regarding the aging of EPMs that progresses slowly, however, it is difficult to determine when to replace them. In the majority of cases, EPMs are replaced based on guiding factors, such as the operating period (e.g., more than ten years) or the number of moving switch blades (e.g., more than 100,000 movements). However, these guidelines are frequently poorly followed and the relatively long operating period of EPMs makes it difficult to obtain in-field electric current signals. Moreover, environmental factors in locations where EPMs are installed, such as severe weather conditions and heavy loads from passing trains [13], are the main cause of aging.
In this study, we propose a method for detecting aging in EPMs using the electric current signals obtained from the machine. The aging decision for EPMs can be regarded as a binary-class classification problem that determines if the current generated from the motor in the EPMs belongs to the aging category, unlike the previous decision problem of the abnormal condition of the EPMs. To detect the aging effect of EPMs, however, it is important to monitor if the current signals are identified to be in the aging category in real time. That is, it is rational to consider this problem as a one-class classification problem because it is a process of identifying only the aging effect of the current signals monitored in real time. Therefore, we exploit the support vector data description (SVDD) [14] approach, which is a one-class classifier that can detect the aging effect of EPMs by only training “not-yet-aged” current data. To the best of our knowledge, this is the first report on the detection of aging in EPMs by SVDD-based analysis of after-replacement (i.e., “not-yet-aged”) data only.
The remainder of the paper is as follows. In Section 2, we describe the proposed method using SVDD to detect the aging effect of EPMs. In Section 3, we present the experimental results using the proposed method for both in-field before and after-replacement data. Then, we discuss the results comparing the previous method and present future work. Section 4 presents the conclusions.
2. Method for Diagnosis of Aging in EPMs
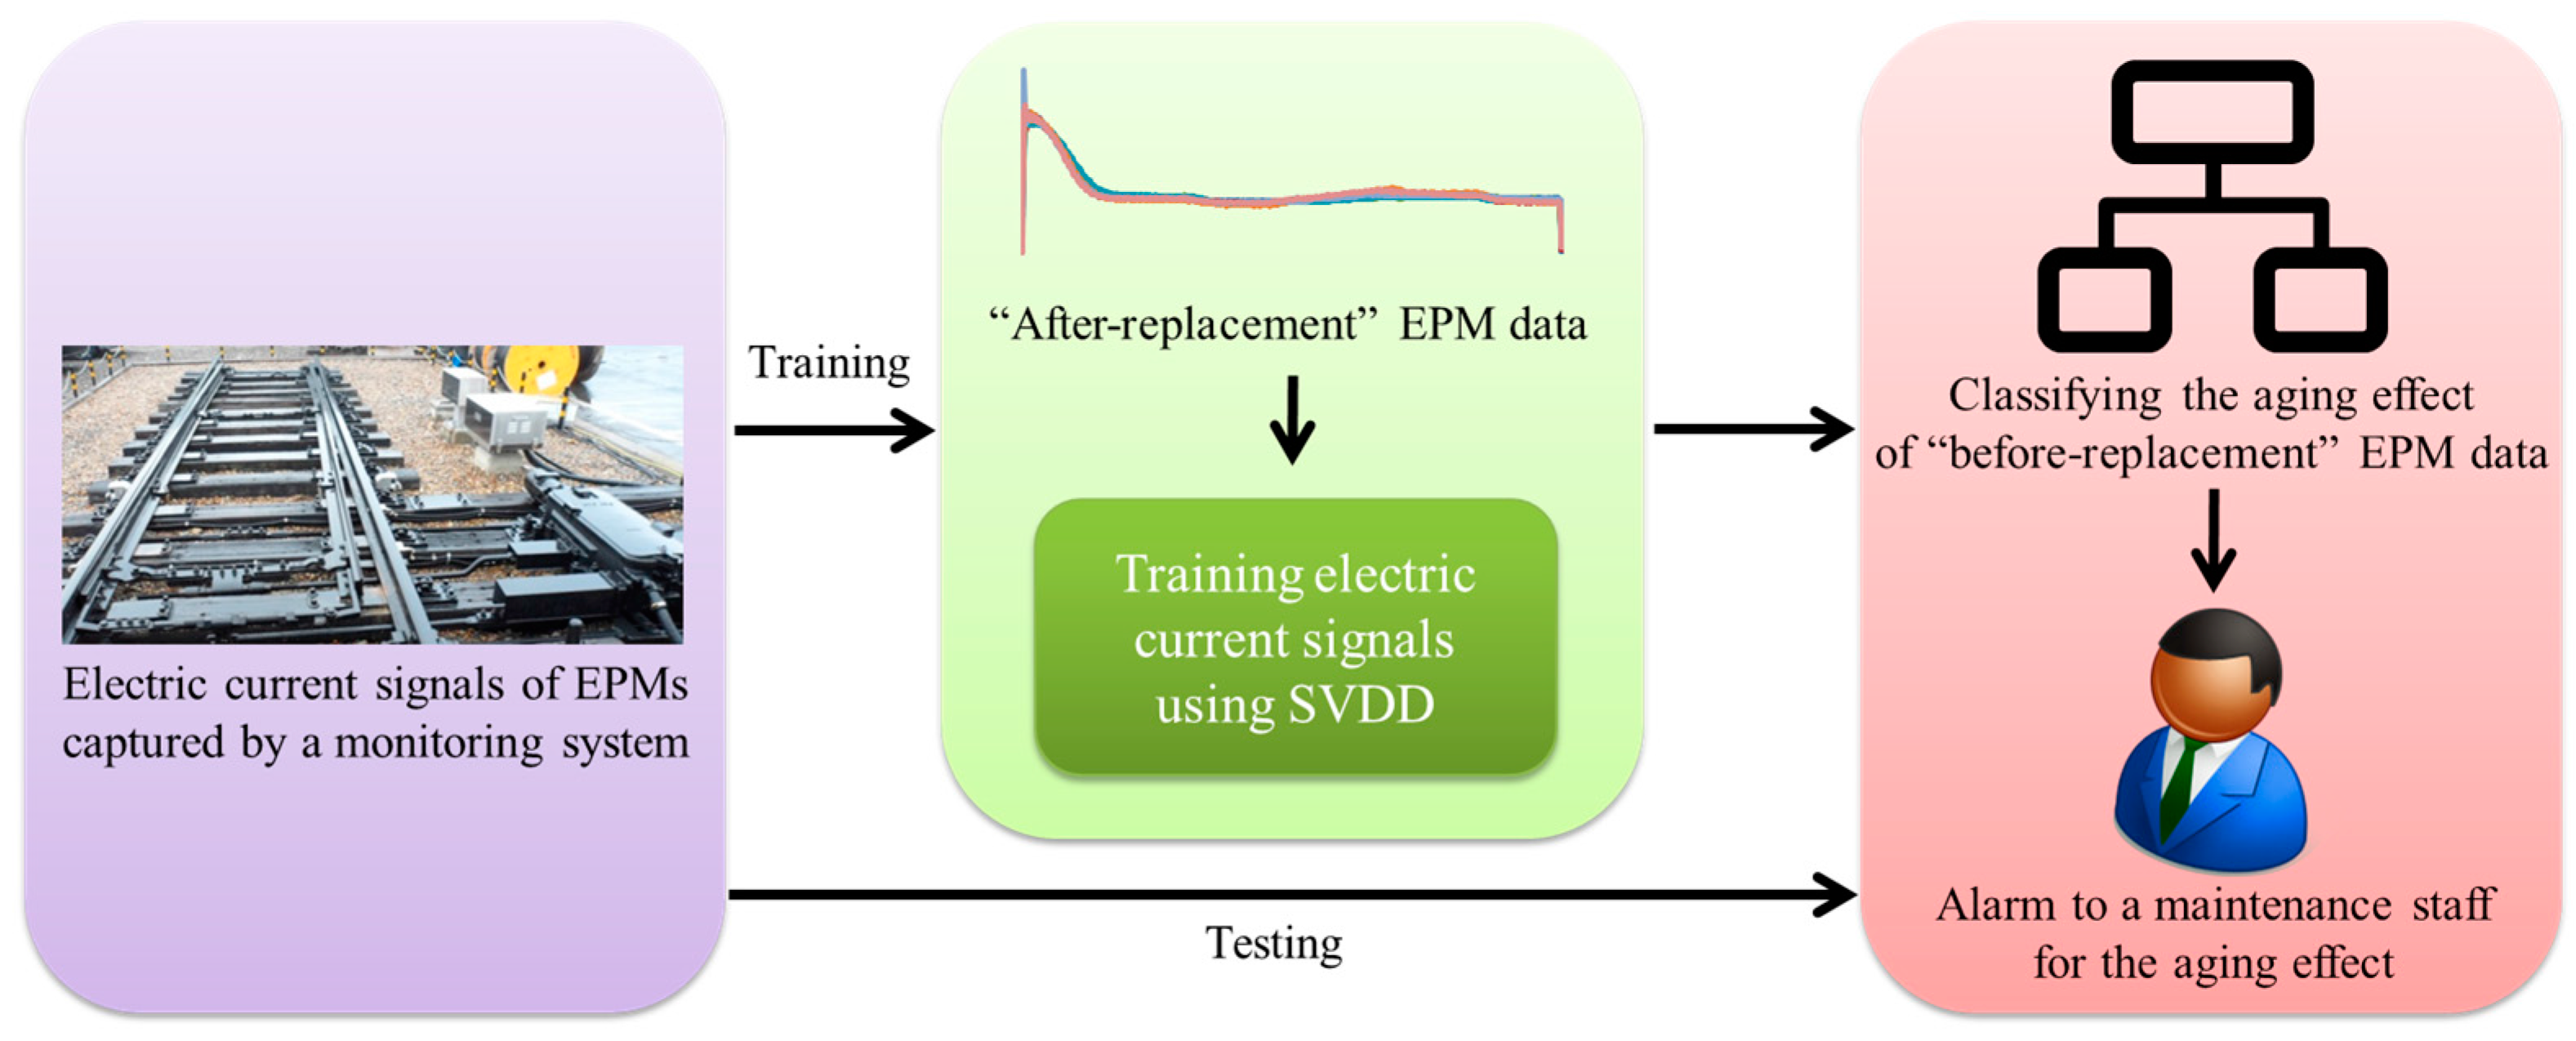
Figure 1 displays the system structure of the detection method for the aging effect of EPMs. First, current signals that are generated from a motor when an EPM is operated are captured by a monitoring system. The current signals are stored in a database in the monitoring system and can be used to manage EPMs in preparation for abnormal situations, such as failures. After gathering both before and after-replacement data using the monitoring system, which monitors the electrical current signals that are generated from the EPMs, both the before and after-replacement data are labelled with the assistance of maintenance staff. Then, only the after-replacement data among all of the labelled current signals is trained through SVDD to produce a hypersphere for classifying the aging effect regarding the EPMs. Using the hypersphere, the before-replacement data can be classified as to whether the data is aging. Finally, the results from this method are directed (as an alarm) to a maintenance staff to consider the aging effect of the EPMs.
Although the EPMs are provided by different manufacturers, we determined that after-replacement (i.e., “not-yet-aged”) data obtained from each replaced EPM exhibited normal electric current patterns. Further, some electric current patterns in the before-replacement data were nearly identical to the patterns from the after-replacement data. However, the majority of the before-replacement (i.e., “aged”) data exhibited subtle differences from the patterns from after-replacement data resulting from the aging effect. Based on these patterns, we classified the electric current patterns in the before- and after-replacement data as “not-yet-aged” and “aged”. Using this approach, an automated decision strategy can be developed to classify before-replacement data into “not-yet-aged” and “aged” categories.
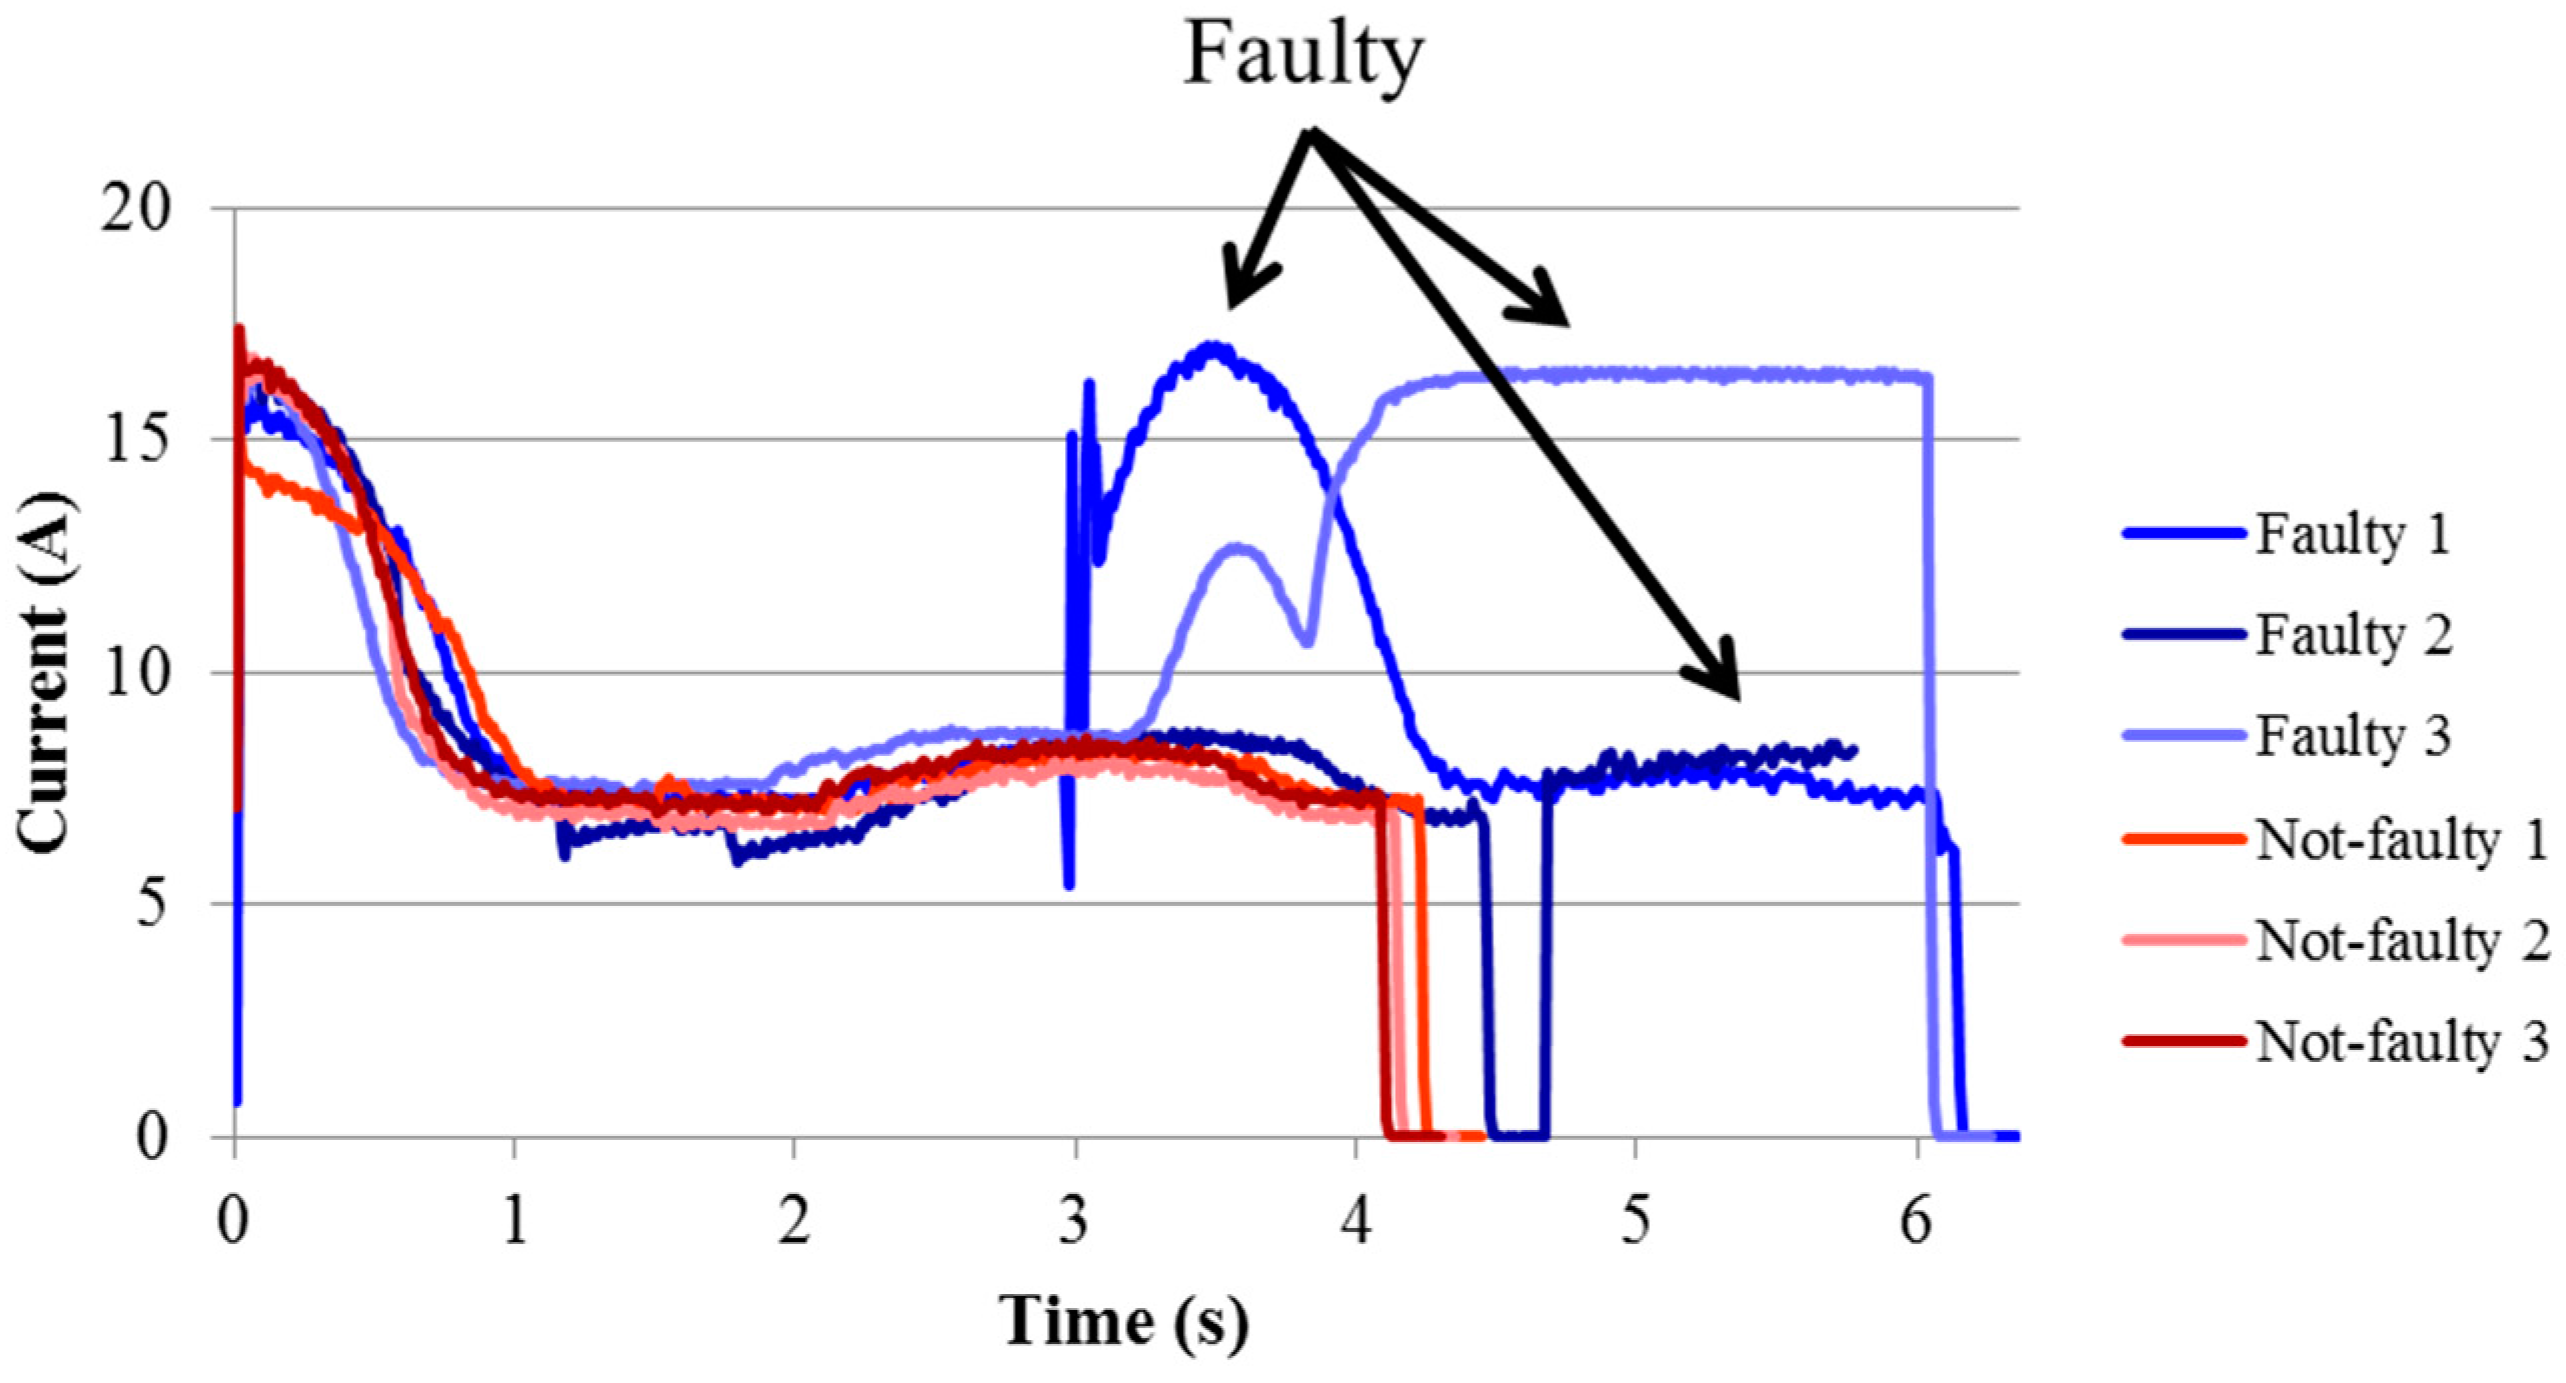
We assume that the machines from which the before-replacement data was measured were not faulty. In fact, because EPMs are the most critical components in a railway system, maintenance staffs check every EPM every night, when trains are non-operational. If an EPM starts exhibiting faulty behavior in the daytime, the maintenance staffs check it immediately. If the fault is a one-time fault caused by noise, such as ballast obstruction [12], then the EPM resumes its operation after the ballast has been removed. Otherwise, the EPM is repaired or replaced the same night. Furthermore, as indicated in Figure 2, the electric current shape of a faulty (i.e., abnormal) EPM is totally different from that of a not-faulty (i.e., normal) EPM, and the faulty EPM can be easily detected by the dynamic time warping (DTW) method [15] for quick repair. However, the subtle difference caused by aging may not be detected by the previous method.
2.1. Data Preprocessing
For practical issues, we also assume that the operating environments of the EPMs for measuring electric current signals differ. Parameters measured, such as length, peak, or average value, in the before-replacement data differ from the values constituting after-replacement data because of environmental factors. That is, the parameters gained from the operating EPMs have a wide range of attributes. Figure 3 describes the different attributes in the current signals according to the operating environments of each EPM, and indicates the differences between the before-replacement data and the relatively constant after-replacement data.
These properties can result in misclassification in detecting aging in EPMs. To ensure that the properties for both sets of data are uniform, we applied length-normalization and Z-normalization to them. Note that this normalization is typical of time-series analysis [16]. Figure 4 depicts some of the “normalized” before and after-replacement data. As indicated in Figure 4a, the normalization allows for the before-replacement data to represent subtle differences in the data due to the aging effect. These subtle differences are likely to be clues to detect the aging effect for the EPMs. Furthermore, similar current shapes are displayed between the “not-yet-aged” before-replacement and after-replacement data in Figure 4a,b, respectively. Thus, a two-class classifier can be used to classify them.
For example, our previous study employed a shapelet method [16] and achieved an acceptable accuracy [17]. The Shapelet method is a machine learning approach that is used to classify data by analyzing time-series shapes. A subsequence called a shapelet is extracted by determining the intervals separating two classes in the training dataset. The shapelet can be used to classify the data into two classes by measuring the Euclidean distance between the subsequence and electric current in the test dataset. In other words, the shapelet method classifies the electric current as “not-yet-aged” or “aged” through the similarity between the shapelet and the time-series shapes. Owing to the fact that the shapelet method could provide a domain expert “visual interpretability” of the criteria that is used for the time-series classification (as compared to typical classification methods), the domain experts agreed that the shapelet method could improve the reliability of each EPM. Note that, in safety- or mission-critical applications such as railway transportation, domain experts are very conservative, and providing the visual interpretability of the proposed technique is important in order for it to be accepted by a domain expert.
However, if we have multiple aged patterns, then the shapelet method has a limitation in distinguishing the aged patterns from not-yet-aged patterns. For example, from a specific infrequently operated EPM, we found that a different pattern occurred repeatedly (see Figure 4c), and maintenance staffs regarded it as a result of aging. As explain in Section 1, each EPM has been affected by different environmental factors in locations where EPMs are installed. Furthermore, collecting a large amount of not-aged data is easy, whereas collecting a large number of various aged patterns is very difficult in real applications. Because another aged pattern can be observed in a specific EPM later, the aging effect of EPMs can be detected accurately using a one-class classifier (e.g., SVDD) trained with after-replacement (i.e., not-aged) data only. That is, we expect that “aged” EPMs can be efficiently replaced with new units when compared to the current replacement guideline (e.g., more than 100,000 movements or ten years).
2.2. SVDD for Detecting the Aging Effect of EPMs
The normalized before and after-replacement data is suitable for SVDD-based analysis, which involves one-class classification of machines based on the aging effect. In this study, we use SVDD for classifying before and after-replacement from EPMs based on the aging effect.
SVDD [14] facilitates the definition of a hypersphere of the least possible volume, such that it contains all data within it. A sphere that meets these criteria can be obtained by solving the minimization problem:
The slack variable is represented as the penalty factor for acceptable error ranges with the deviation of training patterns out of the sphere. The constant C controls the trade-off that is made based on the relative importance of each term; a and r are the center and the radius of the sphere, respectively. Because it is difficult to solve Equation (1), a Lagrange function is constructed by transforming the dual problem to Equation (2):
where, is a Lagrange multiplier, and is a kernel function represented as , which calculates the inner product in a feature space.
Then, the radius of the sphere can be calculated with the selected support vector :
By definition, r represents the distance from the center of the sphere to its boundary. Then, the distance D between current sample x and the center is calculated as:
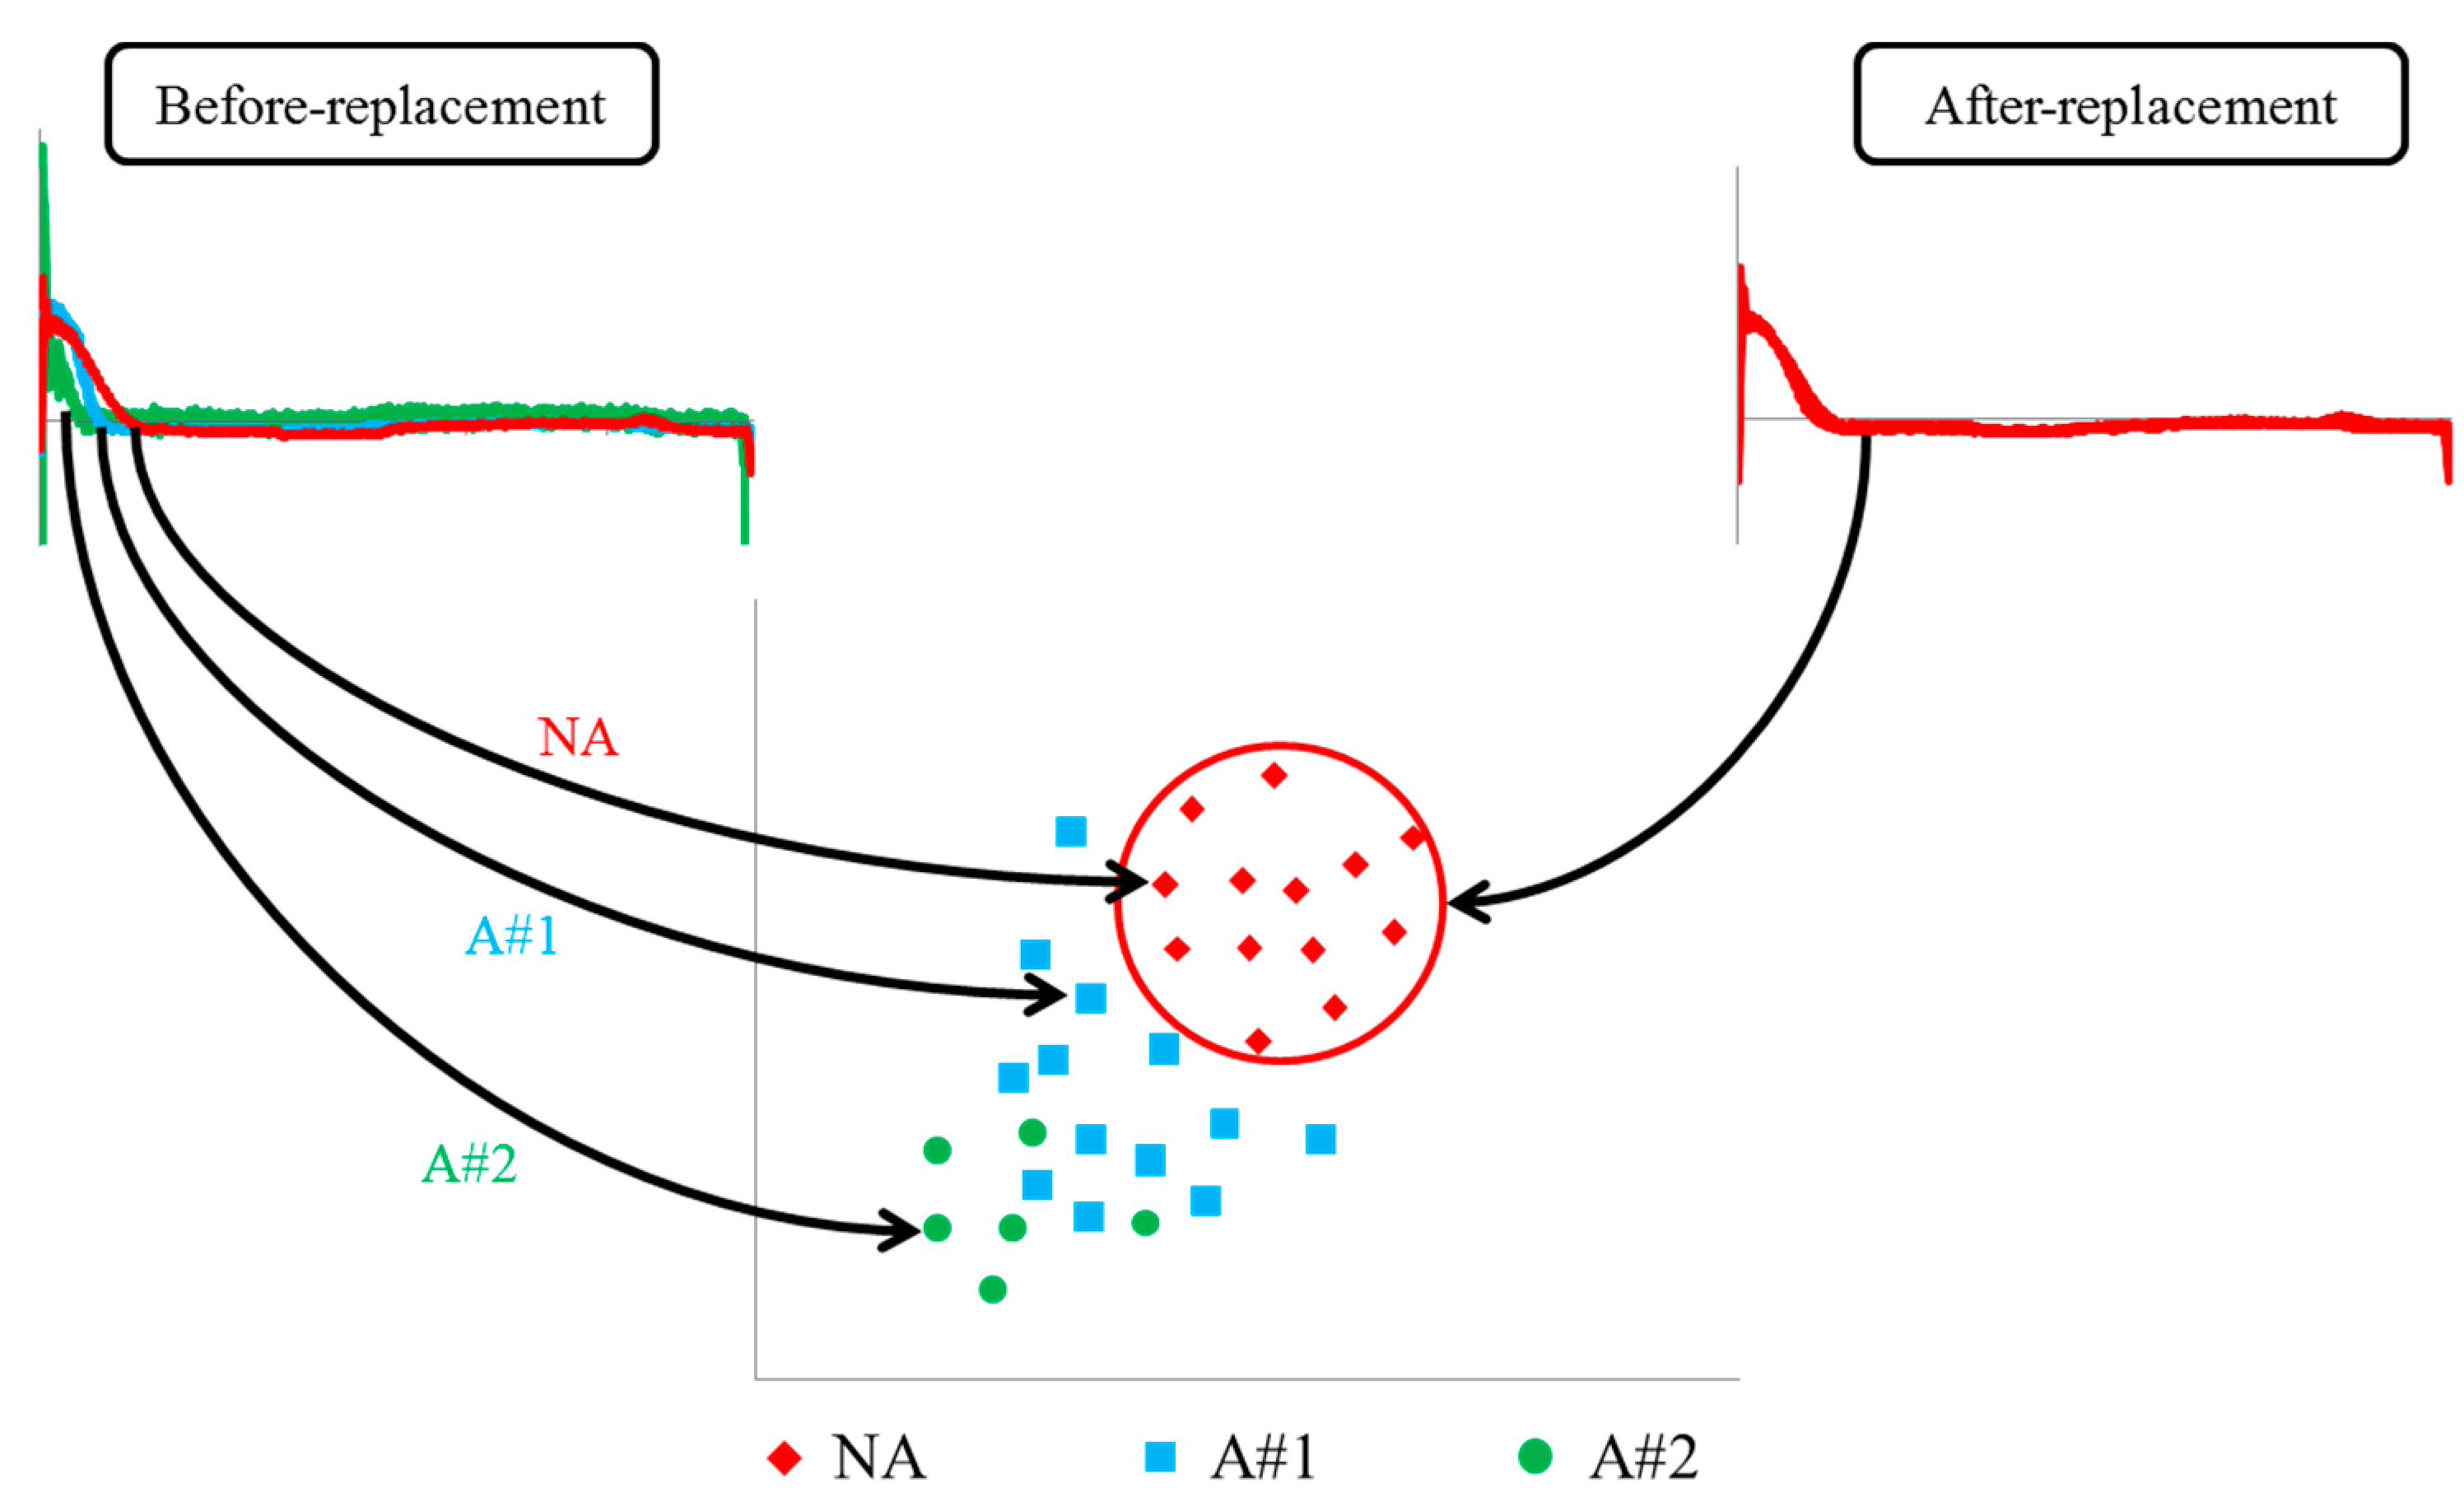
Based on Equation (4), the current sample x is determined to be the aging effect if the distance between the sample and the center is outside the radius. Figure 5 indicates that the electric current signals are classified as “not-yet-aged” and “aged” using SVDD. Thus, after the hypersphere is produced through SVDD using only the after-replacement data, “not-yet-aged” and “aged” before-replacement data can be classified based on internal or external on the hypersphere.
3. Experimental Results
3.1. In-Field Current Signals
The proposed method was executed using the following environment: Intel Core® i5-4670 3.40 GHz, 8GB RAM, and MATLAB R2015a (MathWorks, Massachusetts, MA, USA). We obtained in-field measurement data at a sampling rate of 100 Hz from 48 EPMs installed and having been operated for 14 years on average in nine stations in Korea. Table 1 shows properties of the current data that was measured from some before-replacement EPMs at the seven stations. As indicated in Table 1, each EPM from the A to G stations exhibited “replacement in a timely manner” challenges that were based on the guideline because of environmental factors. For example, even though EPM “52” in “E” station had been in operation for over 12 years and the number of switch movements was approximately 390,000, the EPM had been assigned a “not-yet-aged” condition. Conversely, EPM “51 A” in “G” station had been in operation for over 17 years and had a relatively small number of switch movements, however, the aging of the EPM had advanced and not been replaced at an appropriate time. Thus, we performed the proposed method for detecting the aging effect of EPMs at the proper time.
The obtained in-field data was of two types: before-replacement (data from EPMs that had been in operation for more than ten years) and after-replacement (data from EPMs that had been in operation for less than ten years). As indicated in Figure 3b, the after-replacement data exhibited certain normal electric current patterns despite each EPM being produced by different manufacturers. With the assistance of the maintenance staff, before-replacement data was categorized into two classes: “normal” and “abnormal.” As indicated in Figure 3a, the differences between the two classes resulting from aging and variations in the classes were subtle (especially when compared with the differences resulting from faulty machinery [15] displayed in Figure 1). By performing length-normalization and Z-normalization on the data, variations within each class were reduced, meaning that the effect of aging on electric current signals could be clearly understood.
3.2. Results and Analysis
Before evaluating the performance of the proposed method, we obtained a total of 2401 data items, which comprised 1080 before-replacement data and 1321 after-replacement data, respectively. Then, with the help of a domain expert, we labeled the before-replacement data and the after-replacement data as “not-yet-aged” and “aged.” In the before-replacement data, three patterns (i.e., not-yet-aged, aged #1, and aged #2) were identified, as shown in Figure 4a,c. There were 158, 894, and 28 instances of not-yet-aged, aged #1, and aged #2 patterns, respectively, in the before-replacement data. The 2401 data items were labeled as normal (i.e., 1479 of not-yet-aged) and abnormal (i.e., 922 of aged), along with the after-replacement data. The labeled data was divided into the training and test set at a ratio of 8:2 to perform -fold cross validation. The training set consisted of 1183 normal and 737 abnormal data, and the test set consisted of 296 normal and 185 abnormal data. Note that because SVDD is a one-class classifier, the training set for SVDD consisted of normal data only. Setting the parameters σ = 5.40 and C = 0.001, we then trained the SVDD classifier using the training dataset and subsequently classified the testing dataset into normal (i.e., “not-yet-aged”) and abnormal (i.e., “aged”) categories.
To evaluate the performance of the proposed method, we compared it with the shapelet method [16], support vector machine (SVM) [18], and random forest [19]. Then, we measured the performance of the classification with the Matthews correlation coefficient (MCC) [20]. MCC is a metric to evaluate the classifier performance, which has been recently acknowledged as an elective measure in the machine learning community. MCC returns a value between −1 and +1. If the coefficient is equal to +1, then it indicates a perfect prediction. By contrast, if the coefficient is equal to −1, it represents a total disagreement between the prediction and observation. In addition, MCC leads to a good generalization of results regardless of the ratio between the two classes, contrary to other measurements of classification performance. Thus, we derived the MCC results for each method following Equation (5):
where True Positive (TP) is “not-yet-aged” data identified as “not-yet-aged”, True Negative (TN) is “aged” data identified as “aged”, False Positive (FP) is “aged” data identified as “not-yet-aged”, and False Negative (FN) is “not-yet-aged” data identified as “aged”, respectively. Table 2 shows the MCC results of each method with regards to the -fold cross validation.
As indicated in Table 2, the classification performance of the proposed method was the best when compared with other classification methods. Of course, the performance of both the SVM and random forest methods outperformed the proposed method in some datasets, but the classification methods could not yield as consistent a performance as the proposed method. Furthermore, although the shapelet method achieved a good classification performance for the two (i.e., one aged and one not-yet-aged) patterns in [17], it had a limitation in distinguishing multiple aged patterns from the not-yet-aged pattern. Given that the EPM environment undergoes many variations in each location, the possibility of unpredictable or various aging patterns should not be ignored. Comparison methods should be re-learned whenever the various aging patterns occur, and this may not be practical in railway applications. By contrast, the proposed method is only trained with the not-yet-aged pattern, and thus, it is practically suitable for detecting the aging effect for EPMs. Finally, the computation time for the classification using the proposed method was 0.67 msec (measured without executing other user programs) per each test data, on average. Therefore, the proposed method can detect the aging effect of EPMs in real-time.
4. Conclusions
Managing EPMs is crucial to the prevention of severe accidents, such as derailments. Aging detection of EPMs is particularly important for avoiding future accidents in advance. However, replacing EPMs based on a replacement guideline is not appropriate because of the environmental variations of the installed location. Thus, EPMs must be analyzed for the aging effect and replaced in a timely manner by considering such factors.
In this study, we proposed a classification system to detect the aging effect in EPMs based on their electric current signals. The proposed method trained after-replacement data from EPMs using SVDD and then classified tested EPMs as “not-yet-aged” and “aged” using before-replacement data. On in-field replacement data, the proposed method based on one-class classification exhibited improved accuracy in terms of experimental results on the detection of EPM aging than the typical methods based on a two-class classification such as shapelet, SVM, and random forest.
In fact, the performance of a data-driven method depends on the quality of the training data. However, for the aging detection problem, it is very difficult to acquire an adequate number of diverse types of “in-field” aged data, not “laboratory-simulated” aged data. Given that EPMs are the most critical components in a railway system and are affected by the environmental variations of the installed location, a low probability of an unknown aged pattern occurring later cannot be ignored. Even with the unbalanced data of the aged patterns, or unknown aged patterns, the one-class classifier-based method trained only with the not-aged pattern can practically solve the aging detection problem. We are continuously collecting more data, and we will report further results to compare the SVDD method with deep learning methods [21,22].
Acknowledgments
This study was supported by a Korea University Grant. We also thank the Sehwa R&D Center for providing the in-field EPM data in Korea obtained from their condition monitoring system.
Author Contributions
Yongwha Chung and Daihee Park conceived and designed the experimental method; Yongwha Chung, Daihee Park, and Jonguk Lee described the SVDD; Jaewon Sa and Younchang Choi analyzed the before and after-replacement data obtained from the EPMs; Jaewon Sa conducted the experiment using SVDD to detect the aging effect in the current data; Jaewon Sa and Younchang Choi conducted three classification methods for comparison with our proposed method; Jaewon Sa, Younchang Choi, and Yongwha Chung wrote the paper.
Conflicts of Interest
The authors declare no conflict of interest.
References
- Yin, S.; Ding, X.; Zhou, D. Diagnosis and Prognosis for Complicated Industrial Systems-Part 1. IEEE Trans. Ind. Electron. 2016, 63, 2501–2505. [Google Scholar] [CrossRef]
- Fang, X.; Gebraeel, N.Z.; Paynabar, K. Scalable Prognostic Models for Large-scale Condition Monitoring Applications. IISE Trans. 2017, 49, 698–710. [Google Scholar] [CrossRef]
- Deng, W.; Zhao, H.; Yang, X.; Dong, C. A Fault Feature Extraction Method for Motor Bearing and Transmission Analysis. Symmetry 2017, 9, 60. [Google Scholar] [CrossRef]
- Dalvand, F.; Dalvand, S.; Sharafi, F.; Pecht, M. Current Noise Cancellation for Bearing Fault Diagnosis Using Time-Shifting. IEEE Trans. Ind. Electron. 2017, 64, 8138–8147. [Google Scholar] [CrossRef]
- Jin, W.; Shi, Z.; Siegel, D.; Dersin, P.; Douziech, C.; Pugnaloni, M.; Cascia, P.; Lee, J. Development and Evaluation of Health Monitoring Techniques for Railway Point Machines. In Proceedings of the IEEE Conference on Prognostics and Health Management, Austin, TX, USA, 22–25 June 2015. [Google Scholar]
- Zhou, H.; Shi, T.; Liao, G.; Xuan, J.; Duan, J.; Su, L.; He, Z.; Lai, W. Weighted Kernel Entropy Component Analysis for Fault Diagnosis of Rolling Bearings. Sensors 2017, 17, 625. [Google Scholar] [CrossRef] [PubMed]
- Gilchrist, A. Introducing Industry 4.0; Apress: New York, NY, USA, 2016; pp. 195–215. [Google Scholar]
- Thurston, D.F. Broken Rail Detection: Practical Application of New Technology or Risk Mitigation Approaches. IEEE Veh. Technol. Mag. 2014, 9, 80–85. [Google Scholar] [CrossRef]
- Boldolamiri, N.; Sani, M.; Mirabadi, A. Time-Domain Stator Current Condition Monitoring: Analyzing Point Failures Detection by Kolmogorov-Smirnov (K-S) Test. Int. J. Electr. Comput. Energ. Electron. Commun. Eng. 2012, 6, 587–592. [Google Scholar]
- Zarembski, A.; Palese, J. Managing Risk on the Railway Infrastructure. In Proceedings of the 7th World Congress on Railway Research, Montreal, QC, Canada, 4–8 June 2006. [Google Scholar]
- Asada, T.; Roberts, C.; Koseki, C. An Algorithm for Improved Performance of Railway Condition Monitoring Equipment: Alternating-Current Point Machine Case Study. Transp. Res. Part C Emerg. Technol. 2013, 30, 81–92. [Google Scholar] [CrossRef]
- Lee, J.; Choi, H.; Park, D.; Chung, Y.; Kim, H.-Y.; Yoon, S. Fault Detection and Diagnosis of Railway Point Machines by Sound Analysis. Sensors 2016, 16, 549. [Google Scholar] [CrossRef] [PubMed]
- Vileiniskis, M. Fault Detection and Diagnosis Methods for Engineering Systems. Ph.D. Thesis, University of Nottingham, Nottingham, UK, 2015. [Google Scholar]
- Cristianini, N.; Shawe-Taylor, J. An Introduction to Support Vector Machines and Other Kernel-Based Learning Methods; Cambridge University Press: New York, NY, USA, 2000. [Google Scholar]
- Kim, H.; Sa, J.; Chung, Y.; Park, D.; Yoon, S. Fault Diagnosis of Railway Point Machines using Dynamic Time Warping. Electron. Lett. 2016, 52, 818–819. [Google Scholar] [CrossRef]
- Rakthanmanon, T.; Keogh, E. Fast Shapelets: A Scalable Algorithm for Discovering Time Series Shapelets. In Proceedings of the SIAM International Conference on Data Mining, Austin, TX, USA, 2–4 May 2013; pp. 668–676. [Google Scholar]
- Sa, J.; Choi, Y.; Chung, Y.; Kim, H.-Y.; Park, D.; Yoon, S. Replacement Condition Detection of Railway Point Machines Using an Electric Current Sensor. Sensors 2017, 17, 263. [Google Scholar] [CrossRef] [PubMed]
- Chang, C.C.; Lin, C.J. LIBSVM: A Library for Support Vector Machines. ACM Trans. Intell. Syst. Technol. 2011, 2, 27. [Google Scholar] [CrossRef]
- Han, T.; Jiang, D. Rolling Bearing Fault Diagnostic Method based on VMD-AR Model and Random Forest Classifier. Shock Vib. 2016, 2016, 11. [Google Scholar] [CrossRef]
- Boughorbel, S.; Jarray, F.; El-Anbari, M. Optimal Classifier for Imbalanced Data using Matthews Correlation Coefficient Metric. PLoS ONE 2017, 12, e0177678. [Google Scholar] [CrossRef] [PubMed]
- He, M.; He, D. Deep Learning Based Approach for Bearing Fault Diagnosis. IEEE Trans. Ind. Appl. 2017, 53, 3057–3065. [Google Scholar] [CrossRef]
- Fuan, W.; Hongkai, J.; Haidong, S.; Wenjing, D.; Shuaipeng, W. An Adaptive Deep Convolutional Neural Network for Rolling Bearing Fault Diagnosis. Meas. Sci. Technol. 2017, 28, 18. [Google Scholar] [CrossRef]
Figure 1.
Overall structure of aging detection system of electrical point machine (EPMs).

Figure 2.
Comparison between faulty and not-faulty data.

Figure 3.
Comparison between before and after-replacement data: (a) different attributes in before-replacement data caused by operating environment; (b) relatively constant attributes in after-replacement data.
Figure 3.
Comparison between before and after-replacement data: (a) different attributes in before-replacement data caused by operating environment; (b) relatively constant attributes in after-replacement data.
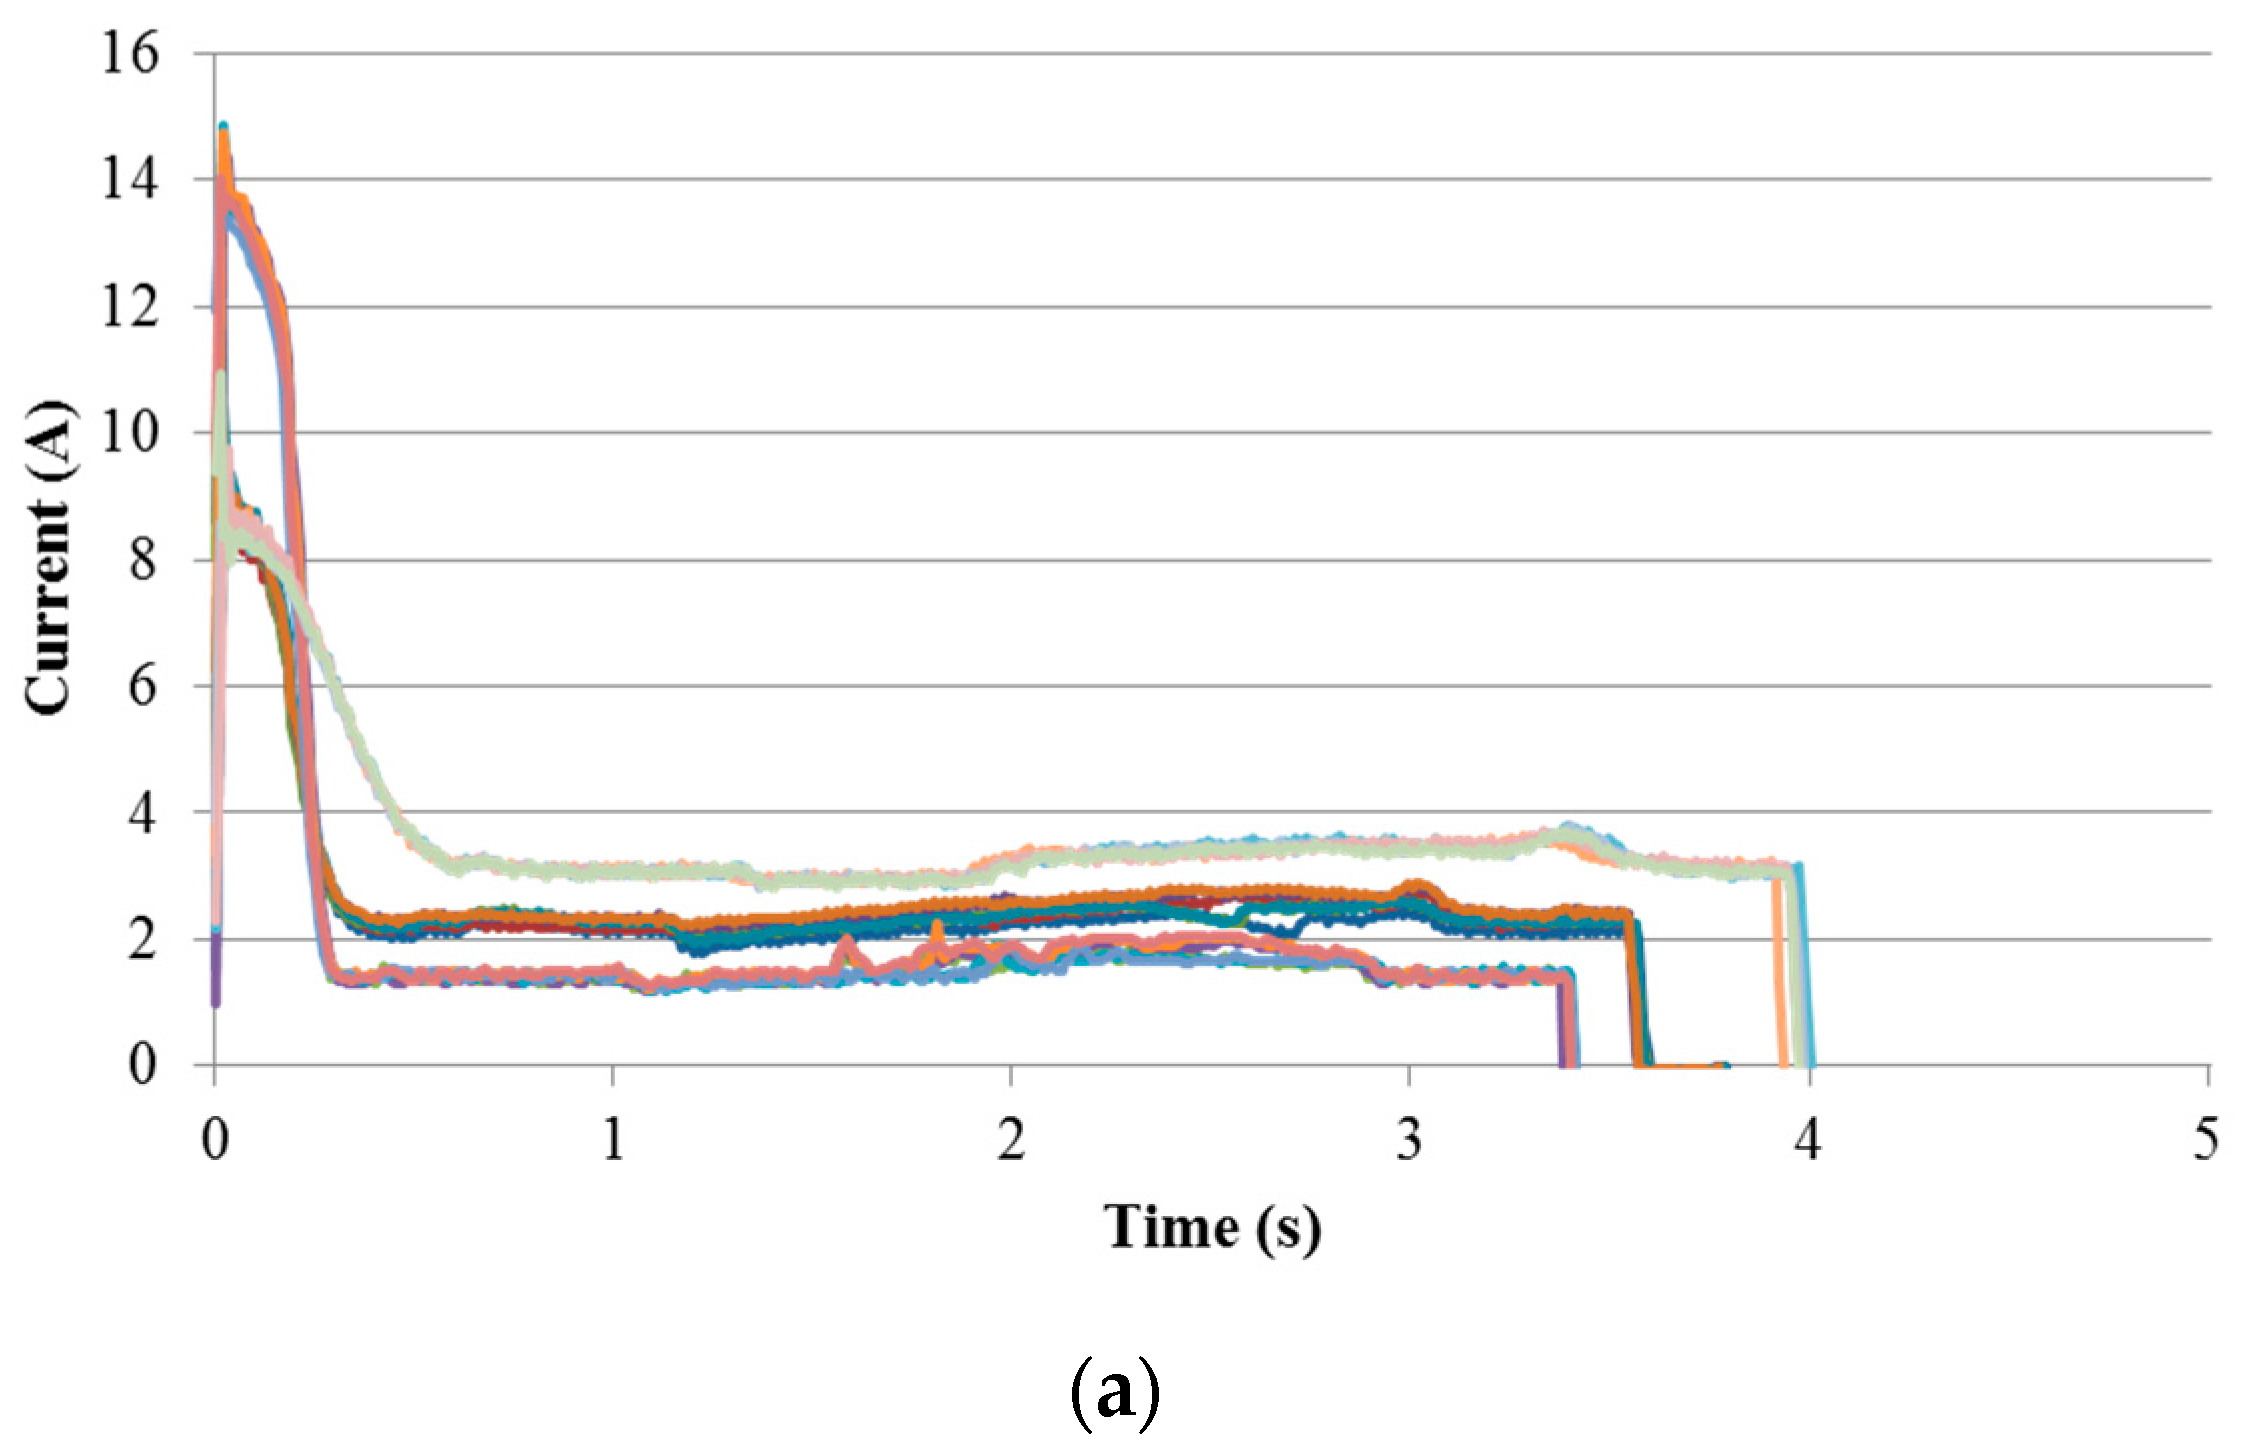
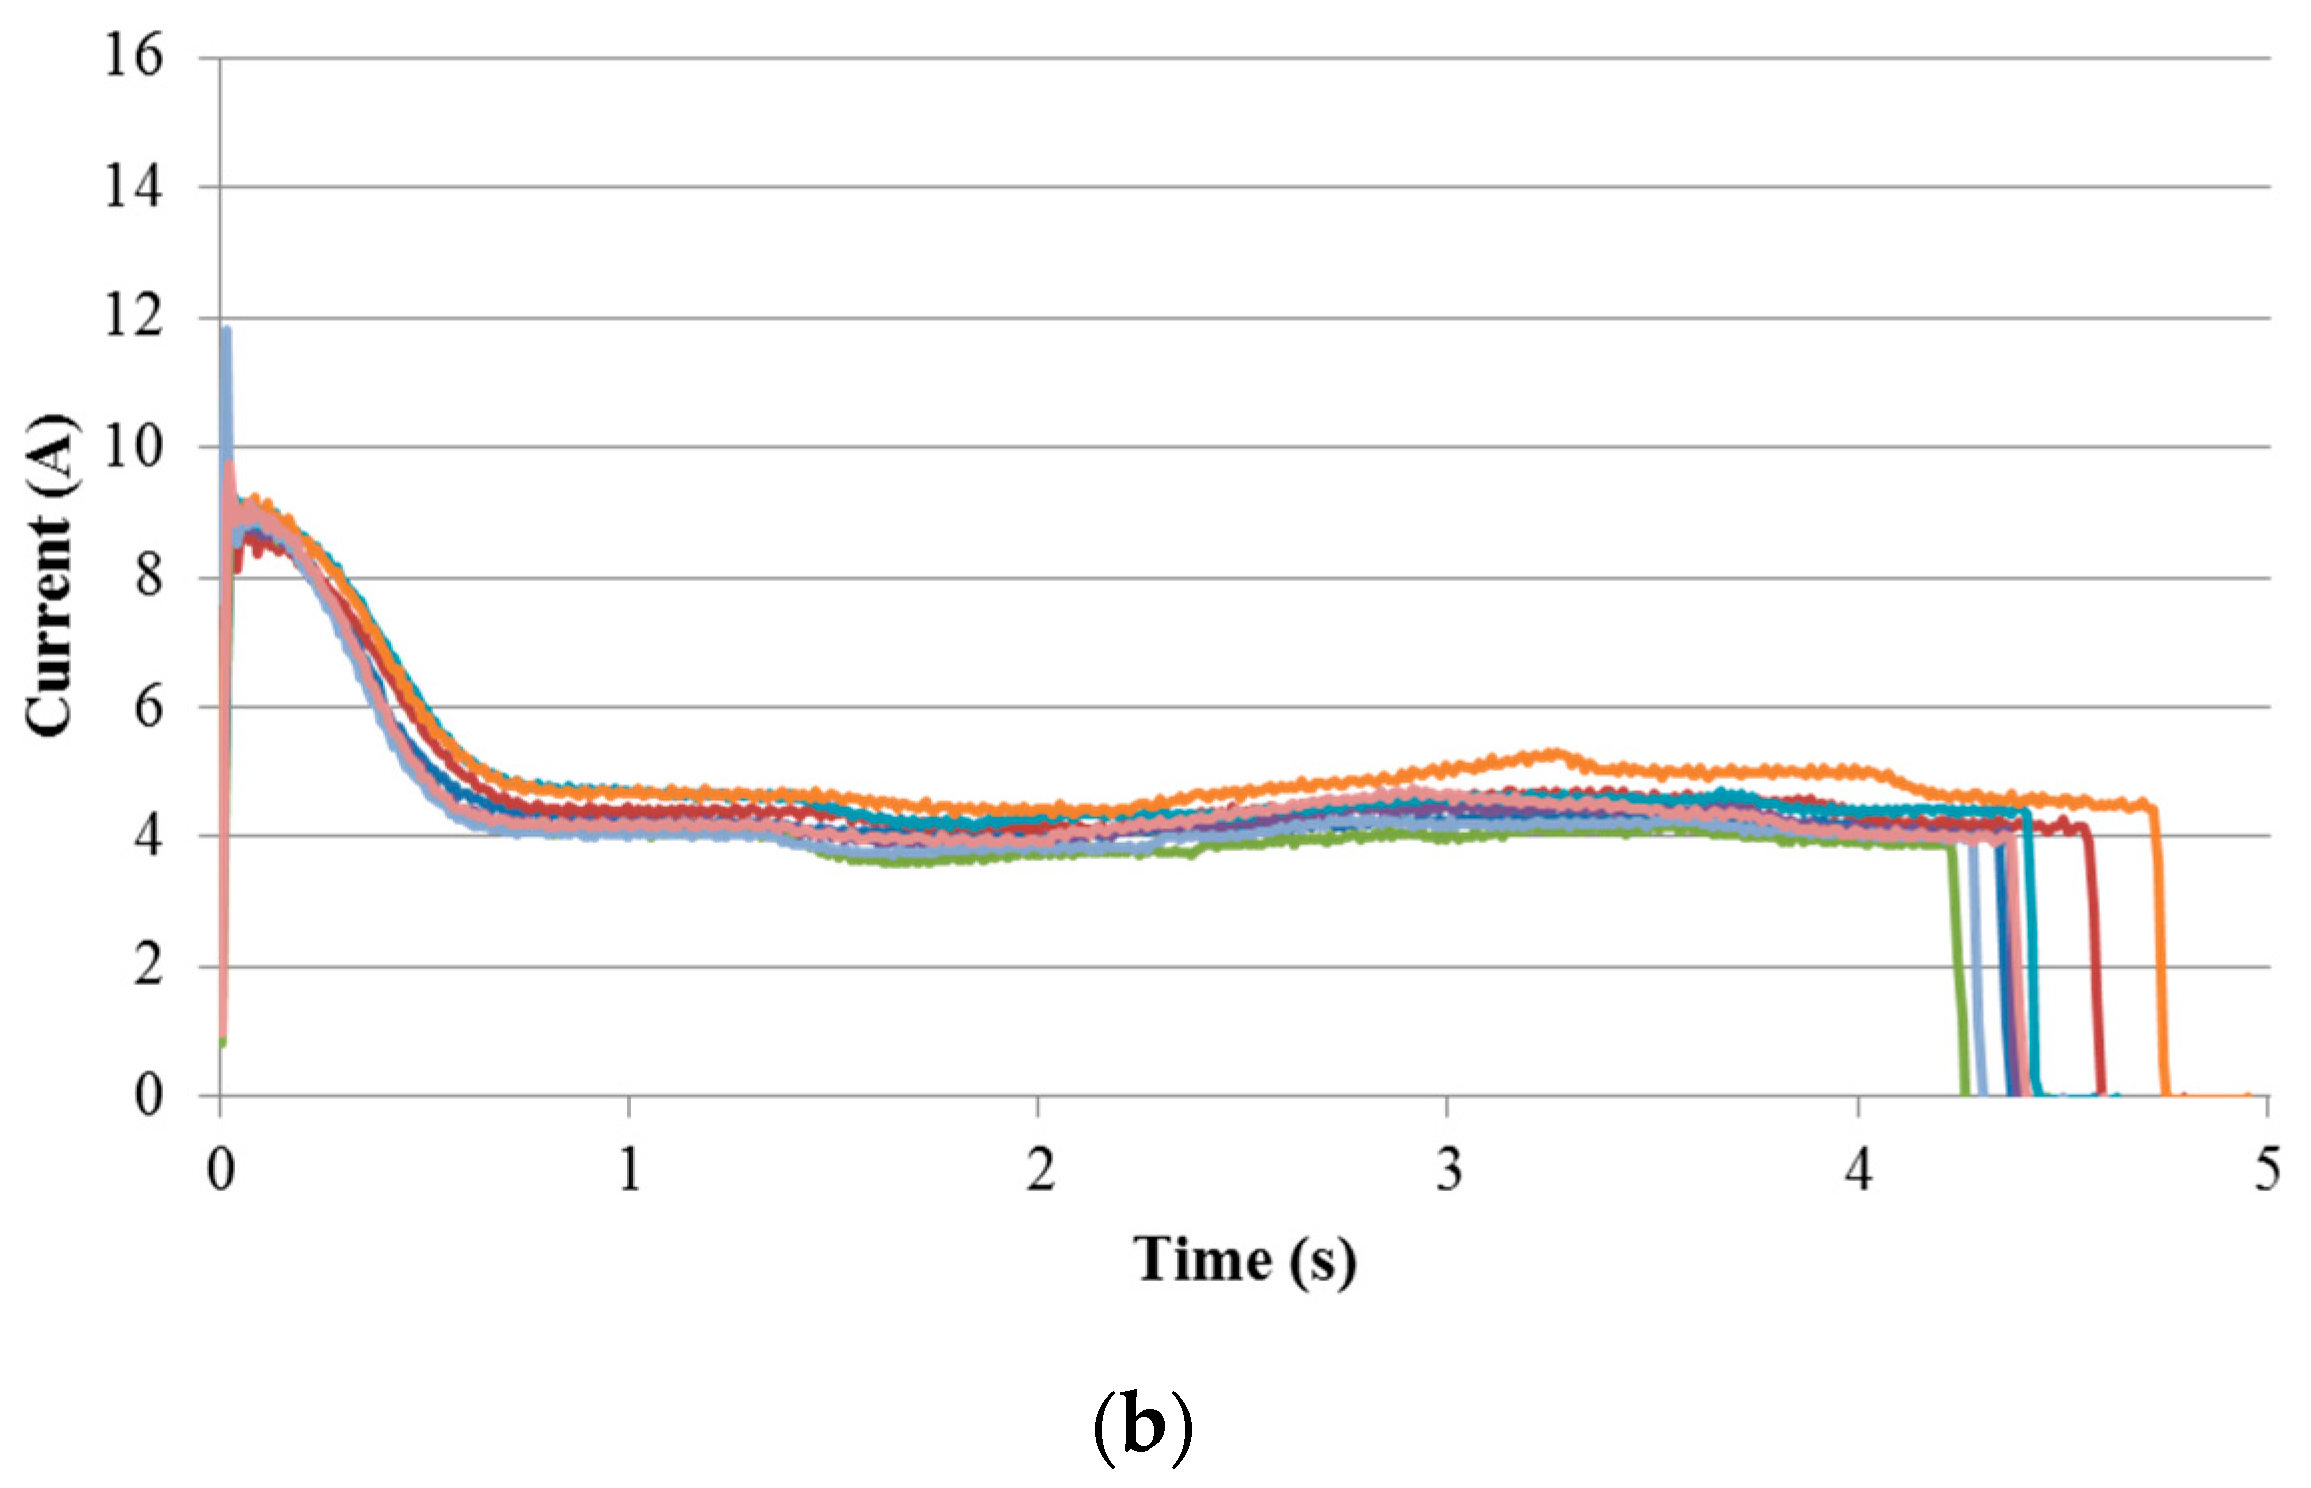
Figure 4.
Comparison between “normalized” before and after-replacement data: (a) Normalized before-replacement data operating more than ten years; (b) Normalized after-replacement data; and, (c) Another normalized aged pattern in before-replacement data.
Figure 4.
Comparison between “normalized” before and after-replacement data: (a) Normalized before-replacement data operating more than ten years; (b) Normalized after-replacement data; and, (c) Another normalized aged pattern in before-replacement data.
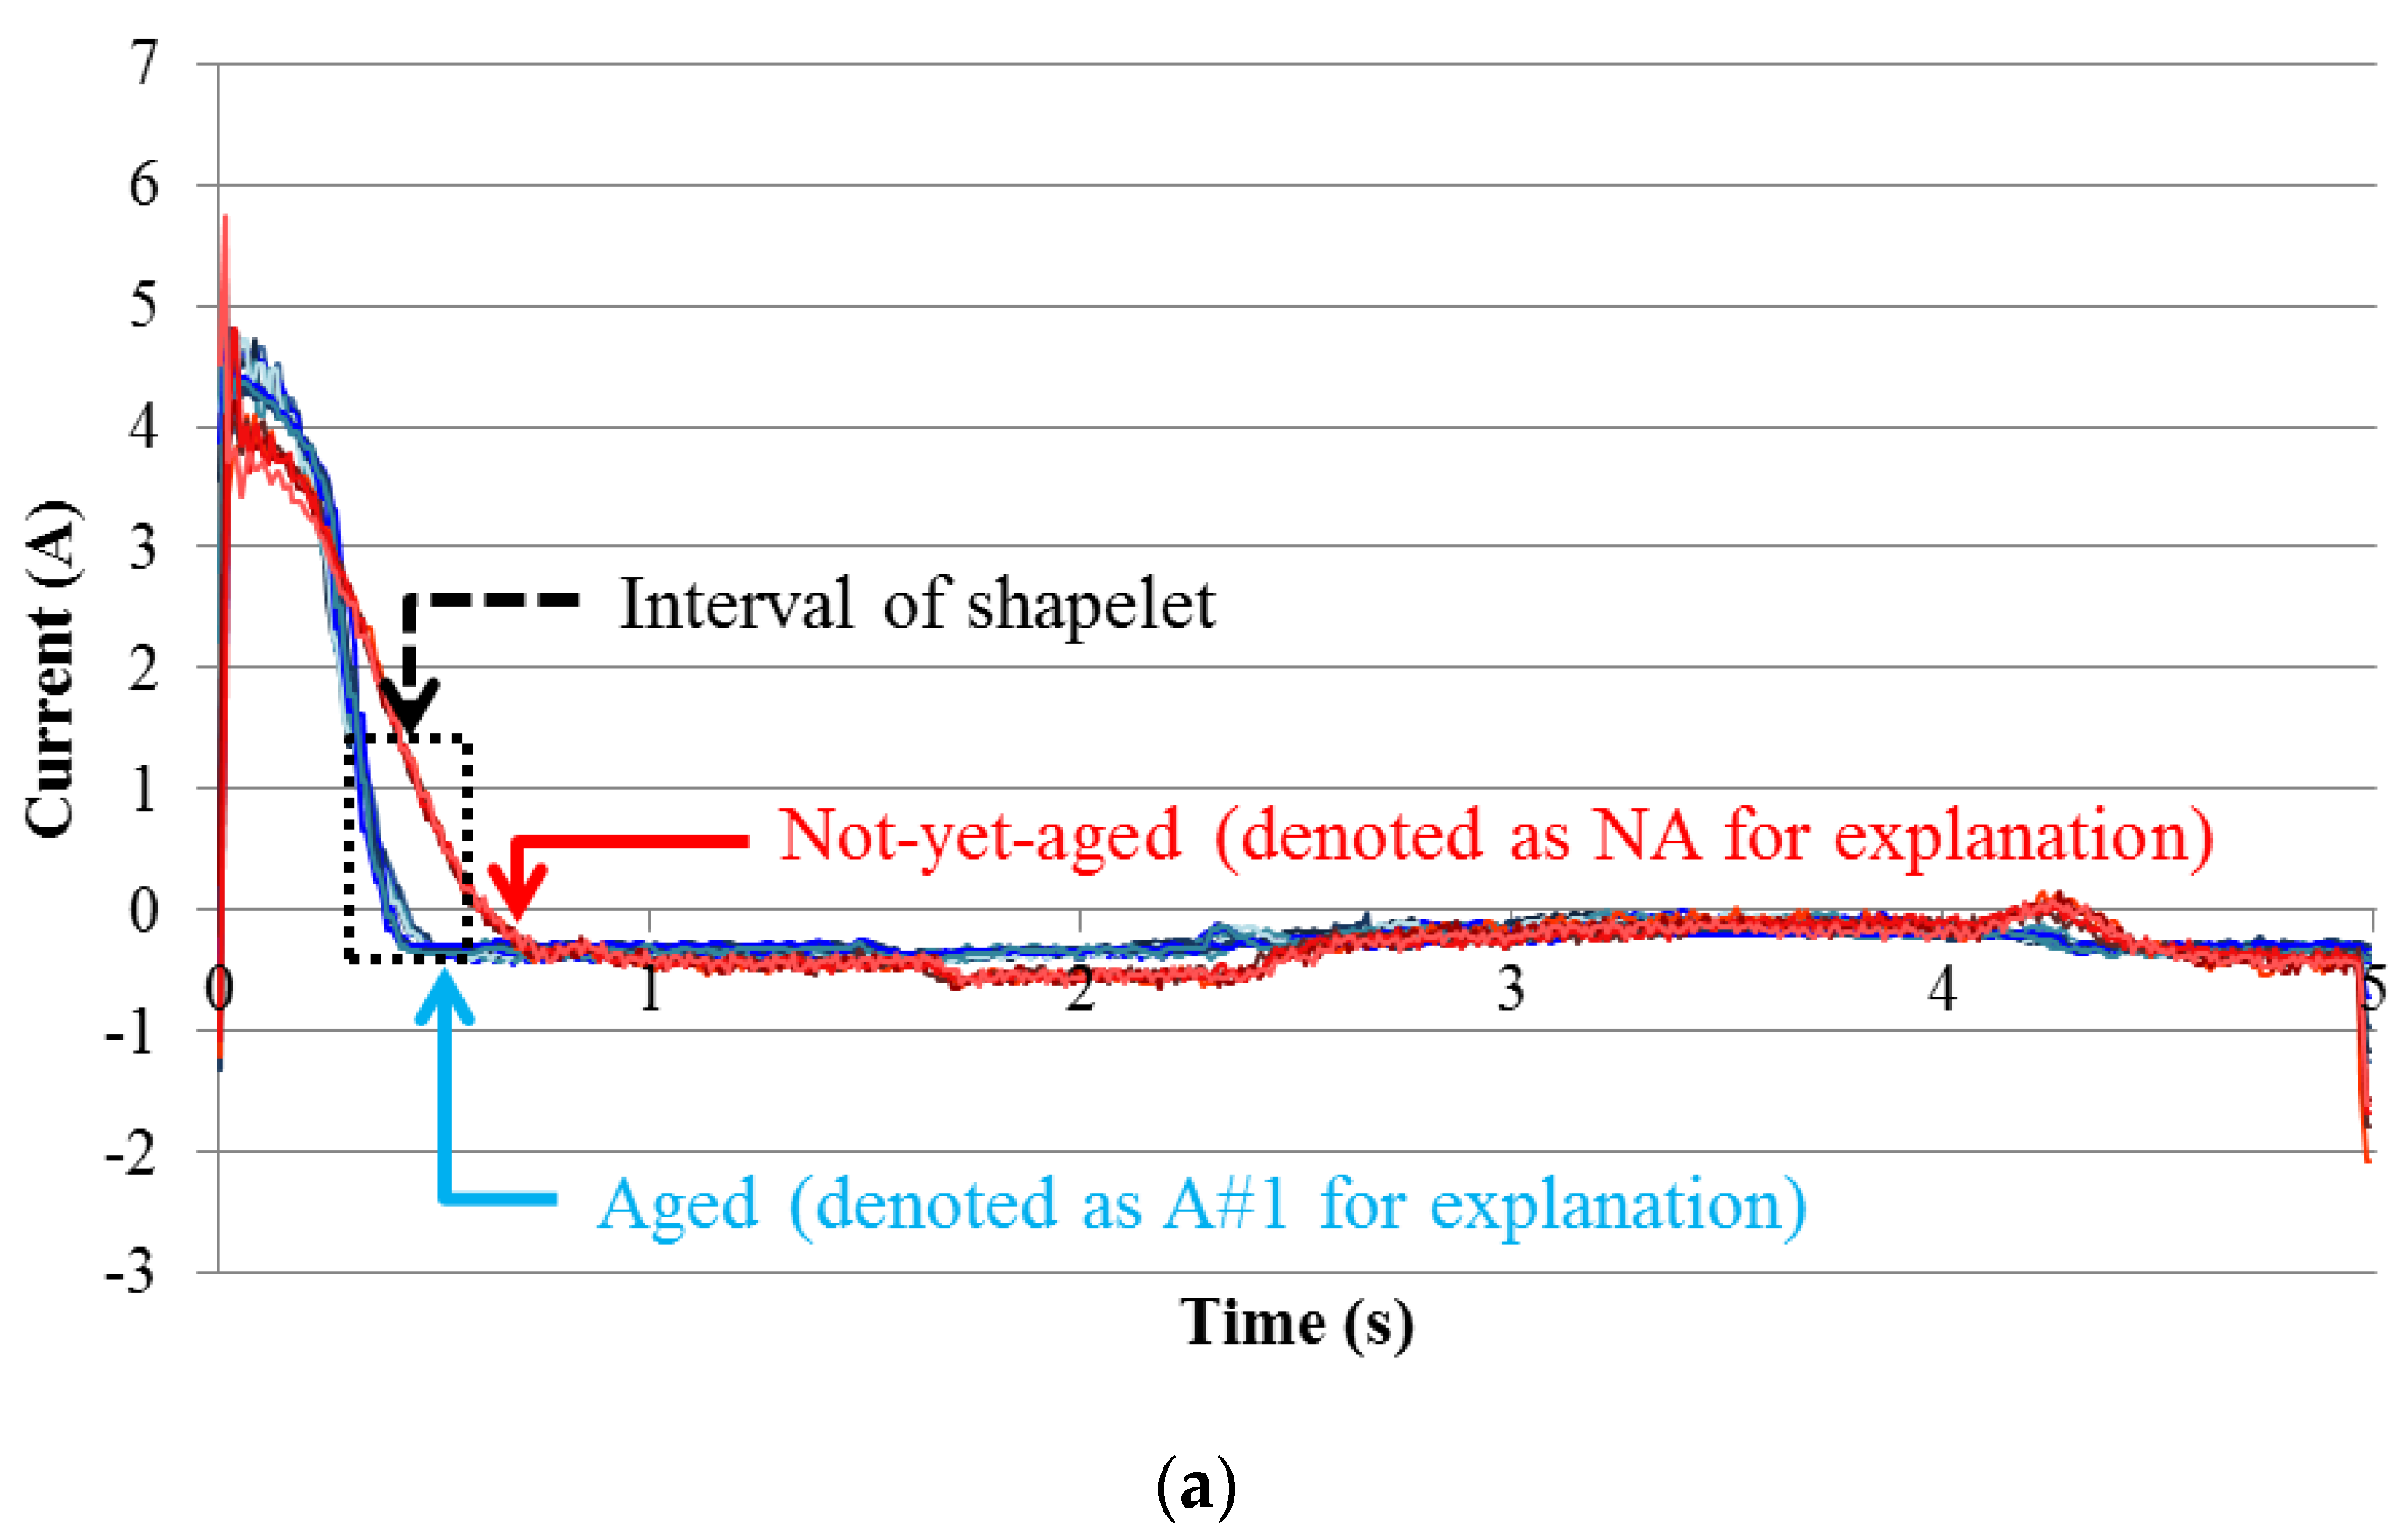
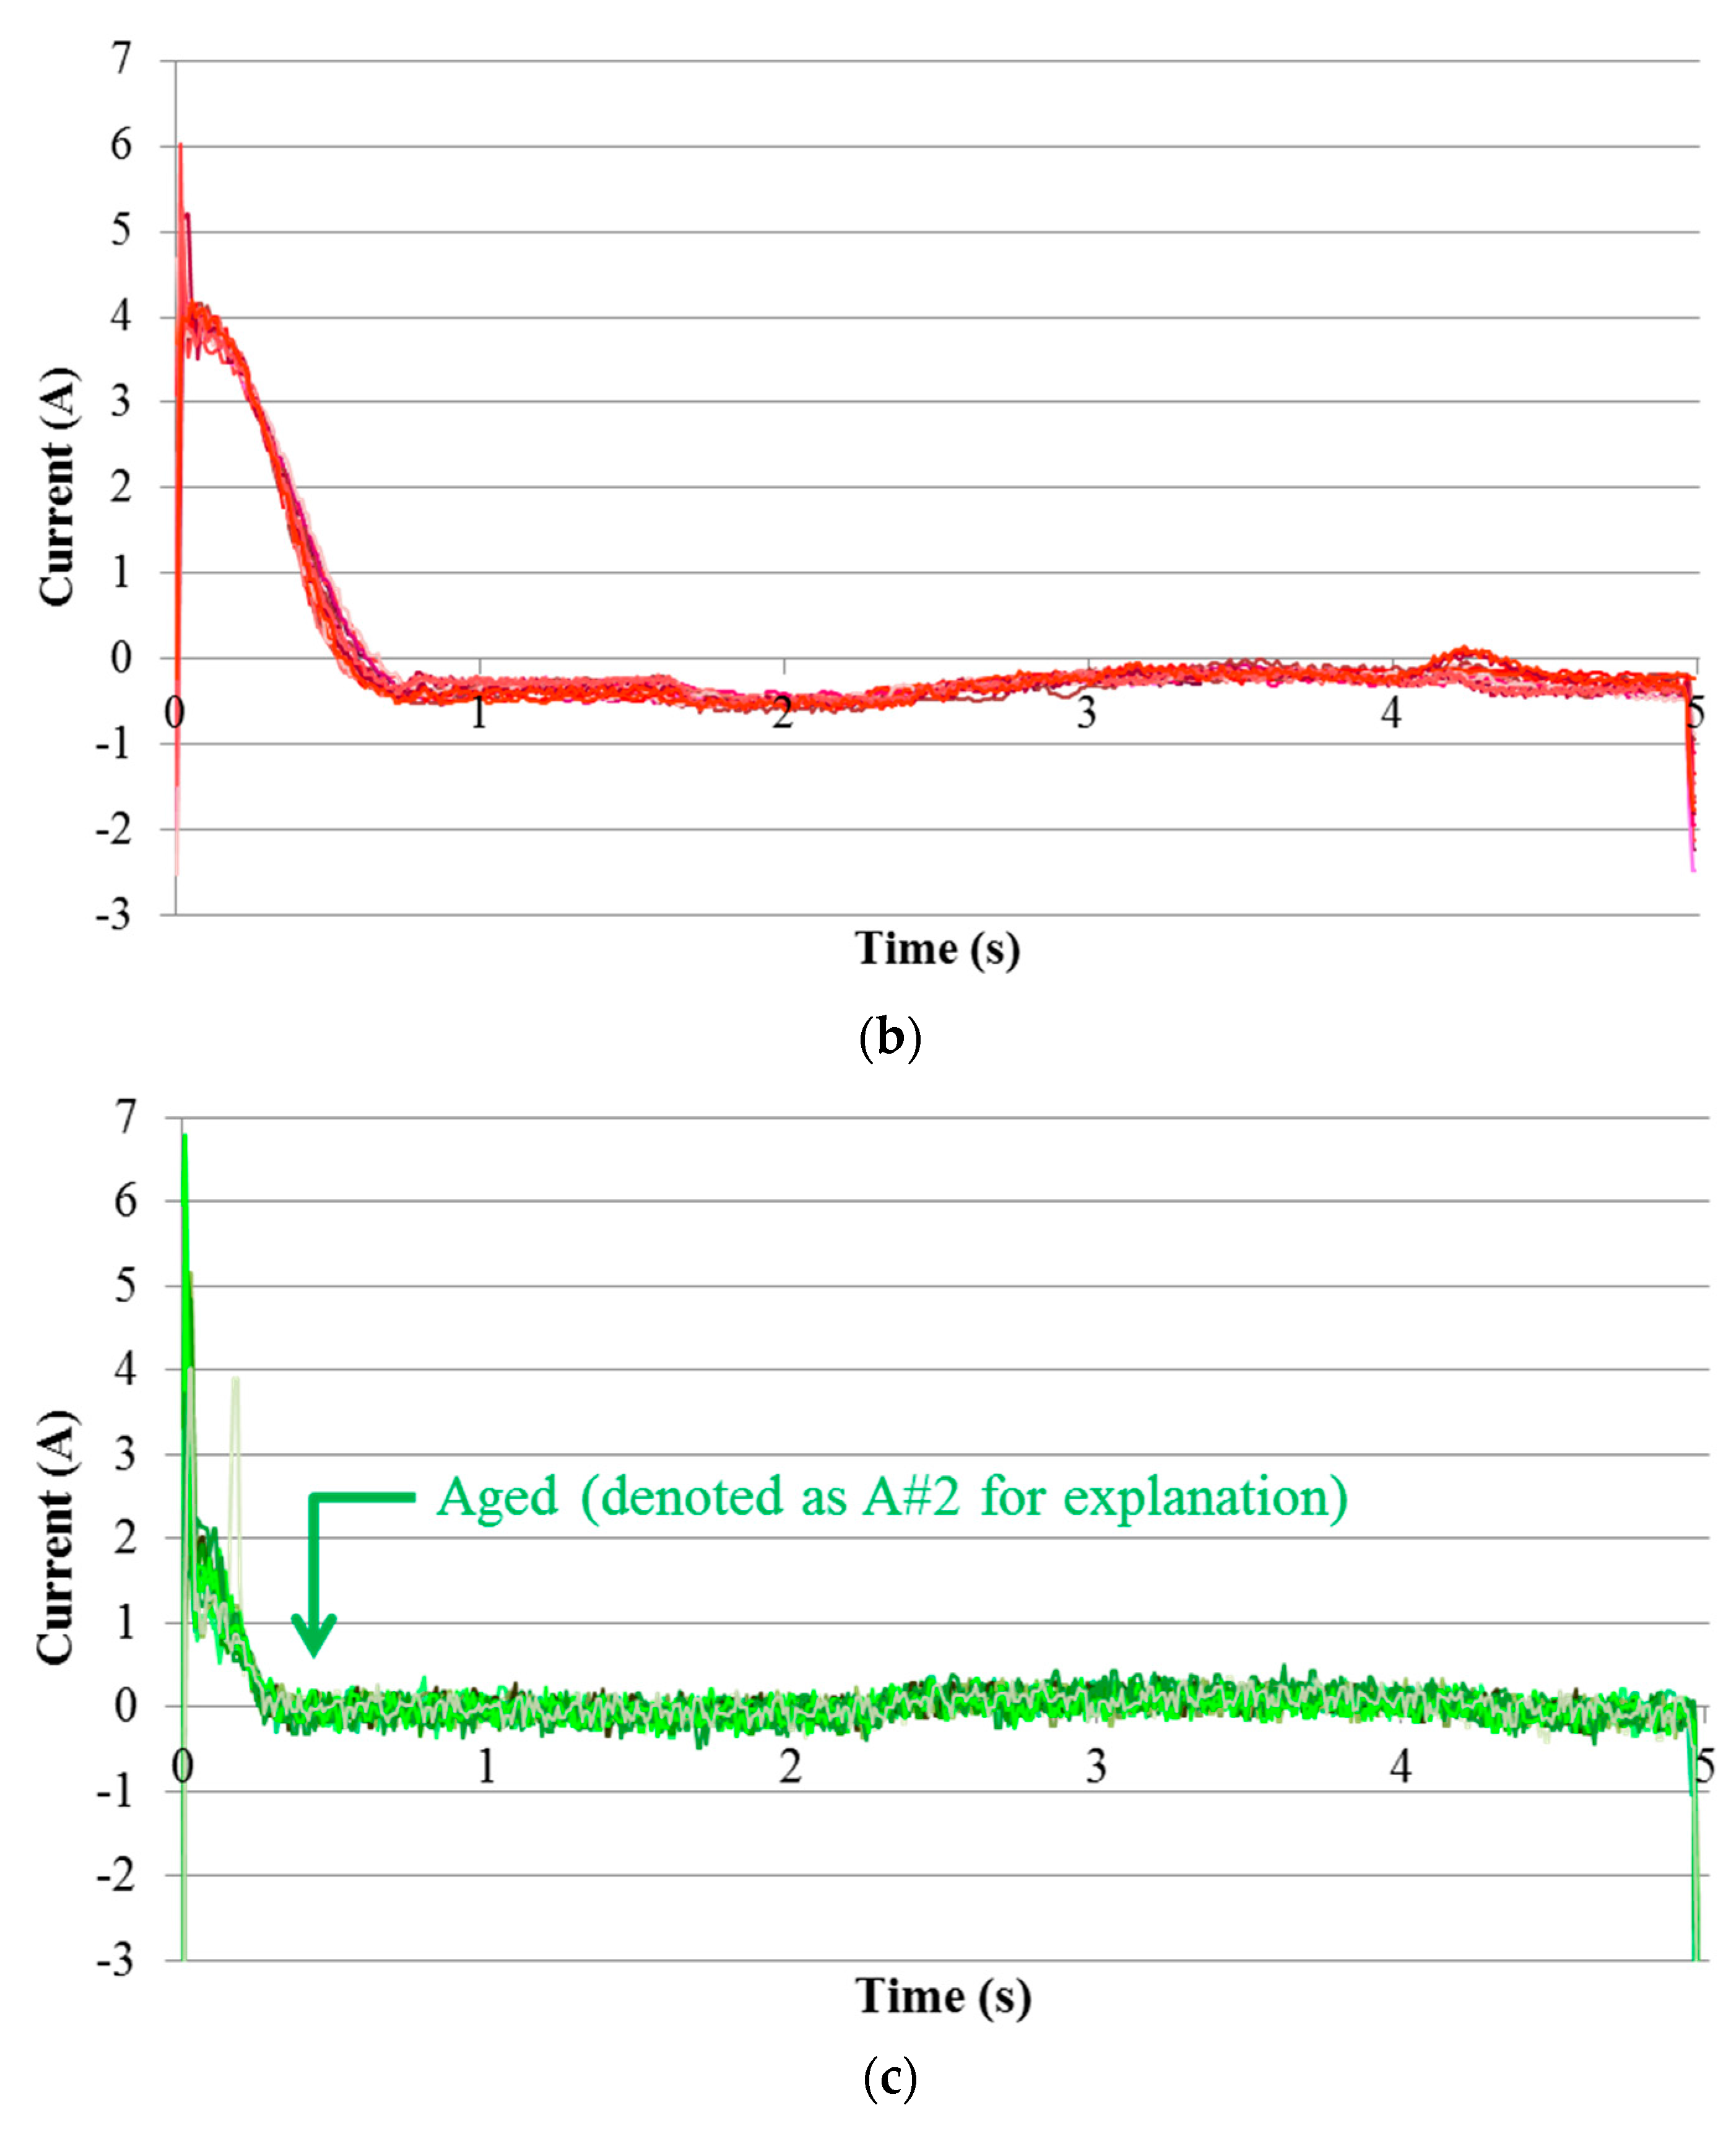
Figure 5.
Classification as “not-yet-aged” and “aged” from electric current signals using support vector data description (SVDD).
Figure 5.
Classification as “not-yet-aged” and “aged” from electric current signals using support vector data description (SVDD).


Table 1.
Properties of before-replacement current data of some EPMs.
| Station | Name of EPM | Operating Period | Total Movements | Aging Status |
|---|---|---|---|---|
| A | 22B | 2002.09–2014.12 | 4654 | Aging |
| 23A | 2002.05–2014.12 | 2059 | Aging | |
| 23B | 2002.05–2014.12 | 1284 | Aging | |
| 24A | 2002.09–2014.12 | 8968 | Aging | |
| 24B | 2002.09–2014.12 | 2596 | Aging | |
| 25 | 2002.05–2014.11 | 2981 | Aging | |
| 26B | 2002.05–2014.11 | 9388 | Aging | |
| 27B | 2002.09–2014.11 | 5367 | Aging | |
| 28 | 2002.09–2014.11 | 33,272 | Aging | |
| 52B | 2002.11–2014.11 | 3193 | Aging | |
| 54A | 2002.10–2014.11 | 8624 | Aging | |
| 54B | 2002.10–2014.11 | 8260 | Aging | |
| 57B | 2002.10–2014.11 | 13,674 | Aging | |
| 58 | 2002.10–2014.11 | 22,953 | Aging | |
| B | 21A | 2002.04–2014.12 | 4376 | Aging |
| 22A | 2002.04–2014.12 | 8245 | Aging | |
| 55 | 2000.12–2014.03 | 653 | Aging | |
| C | 22B | 2001.01–2014.05 | 107,927 | Aging |
| 23 | 2001.01–2014.05 | 70,022 | Aging | |
| 25B | 2002.01–2014.05 | 83,276 | Not aging | |
| 51A | 2002.01–2014.12 | 22,304 | Aging | |
| 54B | 2001.01–2014.12 | 12,875 | Aging | |
| 58A | 2001.01–2014.12 | 66,050 | Aging | |
| 59 | 2001.01–2014.12 | 77,214 | Aging | |
| D | 32 | 2004.04–2014.12 | 11,442 | Aging |
| E | 21B | 2000.12–2014.03 | 23,517 | Not aging |
| 22 | 1998.05–2014.03 | 113,811 | Aging | |
| 51A | 2002.04–2014.12 | 5778 | Not aging | |
| 52 | 2002.04–2014.12 | 391,141 | Not aging | |
| 55A | 2002.04–2014.12 | 52,906 | Not aging | |
| F | 51A | 2000.12–2014.03 | 6303 | Aging |
| 51B | 2001.12–2014.11 | 5209 | Aging | |
| 52 | 2000.12–2014.03 | 82,795 | Aging | |
| 53 | 2000.12–2014.11 | 12,195 | Aging | |
| G | 22 | 2000.01–2014.12 | 108,600 | Aging |
| 23A | 1997.01–2014.12 | 11,269 | Aging | |
| 23B | 1997.01–2014.12 | 11,282 | Aging | |
| 51A | 1997.01–2014.11 | 436 | Aging | |
| 53 | 1997.01–2014.12 | 62,658 | Aging |
Table 2.
Comparison of the Matthews correlation coefficient (MCC) results of each method.
| # of Repetitions | # of Folds | MCC | |||
|---|---|---|---|---|---|
| Proposed Method | Shapelet [16] | SVM [18] | Random Forest [19] | ||
| Repetition 1 | 1 | 0.94 | 0.86 | 0.89 | 0.88 |
| 2 | 0.93 | 0.87 | 0.86 | 0.90 | |
| 3 | 0.95 | 0.83 | 0.87 | 0.92 | |
| 4 | 0.94 | 0.85 | 0.87 | 0.96 | |
| 5 | 0.95 | 0.86 | 0.94 | 0.89 | |
| Repetition 2 | 1 | 0.94 | 0.86 | 0.91 | 0.91 |
| 2 | 0.96 | 0.77 | 0.96 | 0.87 | |
| 3 | 0.93 | 0.79 | 0.86 | 0.91 | |
| 4 | 0.94 | 0.84 | 0.88 | 0.71 | |
| 5 | 0.96 | 0.83 | 0.87 | 0.90 | |
| Repetition 3 | 1 | 0.95 | 0.81 | 0.97 | 0.91 |
| 2 | 0.90 | 0.83 | 0.85 | 0.95 | |
| 3 | 0.96 | 0.76 | 0.86 | 0.94 | |
| 4 | 0.97 | 0.84 | 0.91 | 0.92 | |
| 5 | 0.93 | 0.81 | 0.91 | 0.91 | |
| Repetition 4 | 1 | 0.94 | 0.92 | 0.98 | 0.91 |
| 2 | 0.93 | 0.85 | 0.85 | 0.89 | |
| 3 | 0.96 | 0.78 | 0.86 | 0.94 | |
| 4 | 0.95 | 0.84 | 0.92 | 0.86 | |
| 5 | 0.96 | 0.82 | 0.92 | 0.92 | |
| Repetition 5 | 1 | 0.89 | 0.81 | 0.88 | 0.93 |
| 2 | 0.96 | 0.91 | 0.85 | 0.95 | |
| 3 | 0.97 | 0.87 | 0.97 | 0.96 | |
| 4 | 0.95 | 0.81 | 0.98 | 0.88 | |
| 5 | 0.94 | 0.84 | 0.88 | 0.86 | |
| Average | – | 0.94 | 0.83 | 0.90 | 0.90 |
© 2017 by the authors. Licensee MDPI, Basel, Switzerland. This article is an open access article distributed under the terms and conditions of the Creative Commons Attribution (CC BY) license (http://creativecommons.org/licenses/by/4.0/).
Share and Cite
MDPI and ACS Style
Sa, J.; Choi, Y.; Chung, Y.; Lee, J.; Park, D. Aging Detection of Electrical Point Machines Based on Support Vector Data Description. Symmetry 2017, 9, 290. https://doi.org/10.3390/sym9120290
AMA Style
Sa J, Choi Y, Chung Y, Lee J, Park D. Aging Detection of Electrical Point Machines Based on Support Vector Data Description. Symmetry. 2017; 9(12):290. https://doi.org/10.3390/sym9120290
Chicago/Turabian StyleSa, Jaewon, Younchang Choi, Yongwha Chung, Jonguk Lee, and Daihee Park. 2017. "Aging Detection of Electrical Point Machines Based on Support Vector Data Description" Symmetry 9, no. 12: 290. https://doi.org/10.3390/sym9120290
Note that from the first issue of 2016, this journal uses article numbers instead of page numbers. See further details here.