Article

Analyzing Spatial Behavior of Backcountry Skiers in Mountain Protected Areas Combining GPS Tracking and Graph Theory

by
Karolina Taczanowska
1,*,
Mikołaj Bielański
2,
Luis-Millán González
3,
Xavier Garcia-Massó
4 and
José L. Toca-Herrera
5
1
Institute of Landscape Development, Recreation and Conservation Planning, Department of Landscape, Spatial and Infrastructure Sciences, University of Natural Resources and Life Sciences (BOKU), 1190 Vienna, Austria
2
Department of Tourism and Recreation, University School of Physical Education, 31-571 Cracow, Poland
3
Department of Physical Education and Sport, University of Valencia, 46010 Valencia, Spain
4
Departament de Didàctica de l’Expressió Musical, Plàstica i Corporal, University of Valencia, 46010 Valencia, Spain
5
Institute for Biophysics, Department of Nanobiotecnology, University of Natural Resources and Life Sciences (BOKU), 1190 Vienna, Austria
*
Author to whom correspondence should be addressed.
Symmetry 2017, 9(12), 317; https://doi.org/10.3390/sym9120317
Submission received: 15 November 2017 / Revised: 10 December 2017 / Accepted: 11 December 2017 / Published: 14 December 2017
(This article belongs to the Special Issue Graph Theory)

Abstract

:
Mountain protected areas (PAs) aim to preserve vulnerable environments and at the same time encourage numerous outdoor leisure activities. Understanding the way people use natural environments is crucial to balance the needs of visitors and site capacities. This study aims to develop an approach to evaluate the structure and use of designated skiing zones in PAs combining Global Positioning System (GPS) tracking and analytical methods based on graph theory. The study is based on empirical data (n = 609 GPS tracks of backcountry skiers) collected in Tatra National Park (TNP), Poland. The physical structure of the entire skiing zones system has been simplified into a graph structure (structural network; undirected graph). In a second step, the actual use of the area by skiers (functional network; directed graph) was analyzed using a graph-theoretic approach. Network coherence (connectivity indices: β, γ, α), movement directions at path segments, and relative importance of network nodes (node centrality measures: degree, betweenness, closeness, and proximity prestige) were calculated. The system of designated backcountry skiing zones was not evenly used by the visitors. Therefore, the calculated parameters differ significantly between the structural and the functional network. In particular, measures related to the actually used trails are of high importance from the management point of view. Information about the most important node locations can be used for planning sign-posts, on-site maps, interpretative boards, or other tourist infrastructure.

1. Introduction

Protected areas (PAs) play a crucial role in the conservation of vulnerable mountain ecosystems [1]. Depending on the nature conservation regime, they may also have social functions, such as provisioning space for recreation, research, and educational purposes [2]. Mountain PAs frequently serve as attractive tourist destinations, where multifunctional use requires effective management strategies [3]. Therefore, understanding the way people use natural environments is crucial to balance the needs of visitors and site capacities [4,5].
Network science methods, largely based on graph theory, are gaining in importance in social, physical, medical, and many other disciplines [6,7]. In recent years an increased interest in network analytics can also be observed within tourism domain [8,9]. This analytical approach contributes to a better understanding of the structure and the behavior of the whole system, where various types of relationships (social, economic, operational, informational, spatial, etc.) may be investigated [9]. Mobility of tourists is one example of application context, where empirical travel data fits well into the graph theoretic analytical framework [9,10].
Spatial behavior of visitors in outdoor leisure areas can be documented in many different ways [11]. Data on tourists’ mobility can be obtained using traditional survey methods [12,13], trip diaries, or map sketches [14], and since early 2000 also via automatic tracking devices [15,16]. Within the last two decades, Global Positioning System (GPS) tracking has become a well-established method to collect the exact movement trajectories of visitors [15,17,18,19,20]. The raw data comprises series of recorded trackpoints (pairs of geographic positions and associated time stamps), termed GPS tracks. GPS tracking data is typically used to analyze route parameters of individual visitors or a collective distribution of visitors in the study area [21,22,23]. Studies on outdoor recreation in protected areas often use the Geographic Information Systems (GIS) framework for conducting spatial analysis [22]. However, dedicated network analytic approaches investigating the structural and functional properties of recreational/tourism systems are underrepresented in comparison to other analysis methods [9].
TNP is known for its outstanding alpine landscape and is characterized by high biodiversity [24]. Recent rapid development of a new winter recreational activity—backcountry skiing—fosters new management challenges, related to an effective visitor guidance within the protected area [25]. Therefore, this study aims to develop a methodology to evaluate the structure and use of newly designated skiing zones in TNP combining GPS tracking of visitors and analytical methods based on graph theory.

2. Materials and Methods
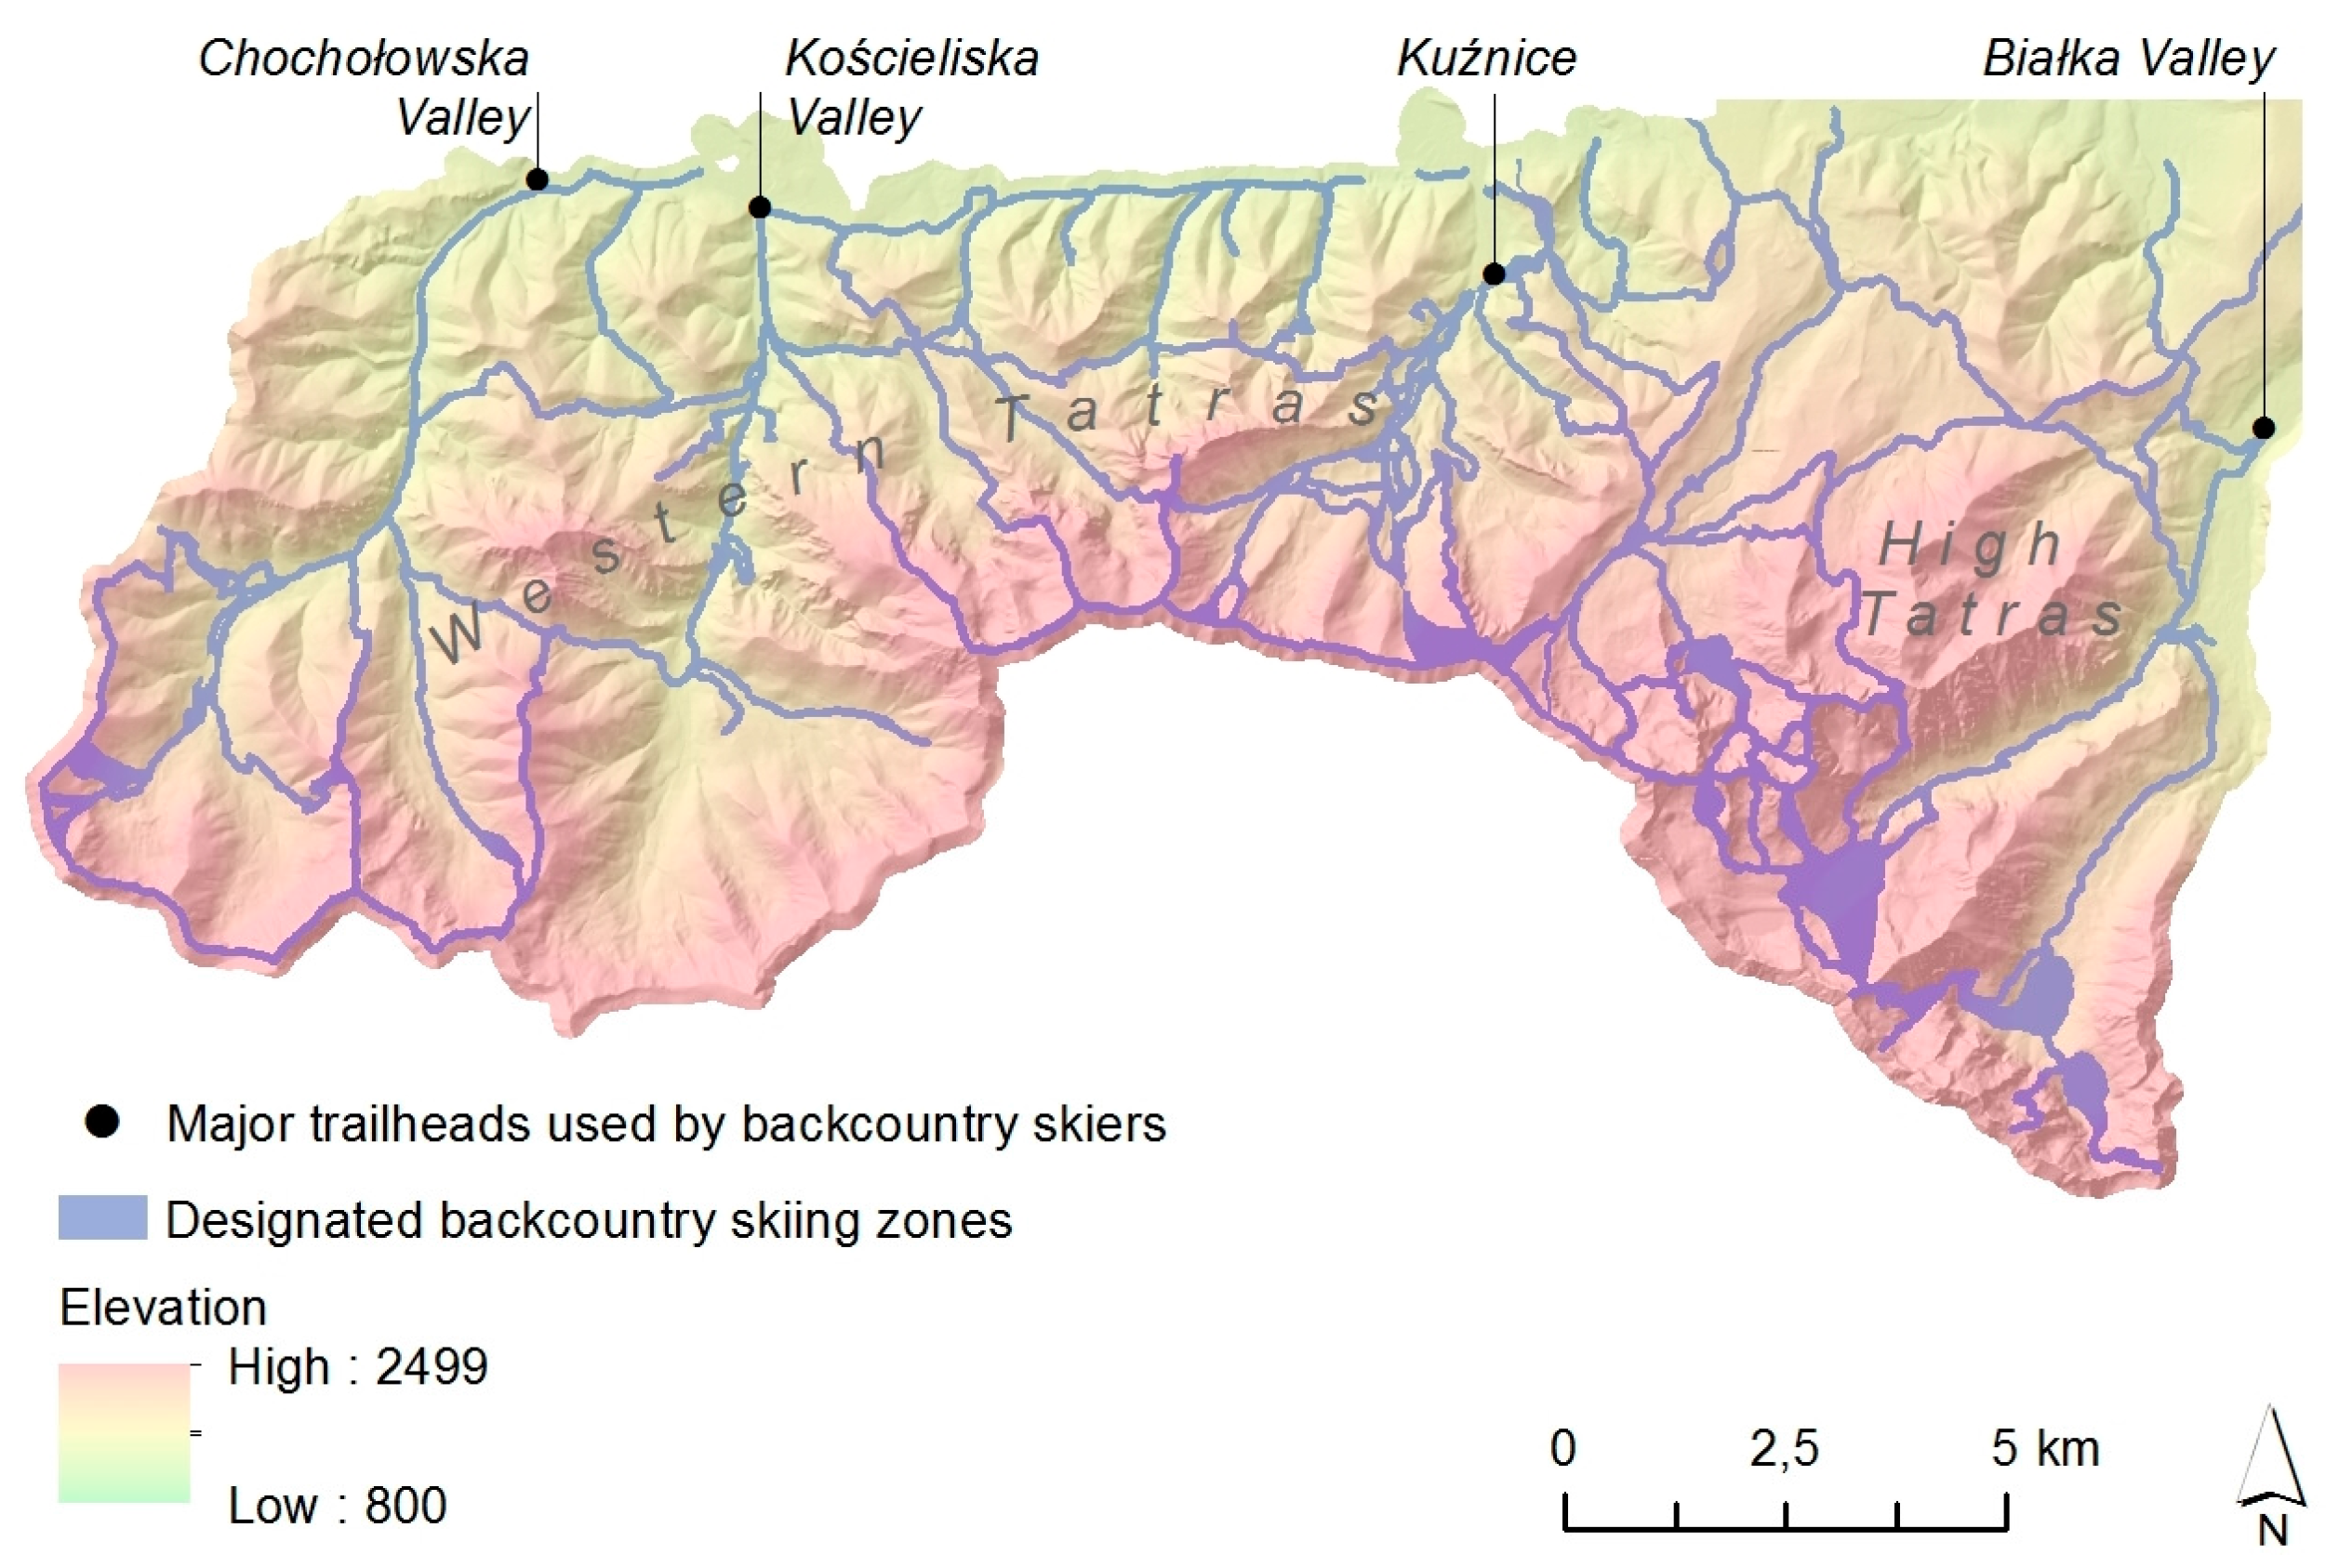
2.1. Study Area

The study is based on empirical data (n = 609 GPS tracks of backcountry skiers) collected in the western part of Tatra National Park (TNP), Poland. The Tatra Mountains are situated in Central Eastern Europe and are the highest mountain range of the Carpathians. The national border between Poland and Slovakia runs along the main mountain ridge, dividing the protected area into two neighboring national parks. The Polish part of TNP covers an area of 21,197 ha [24], where recreational activities, due to nature conservation objectives, are restricted to designated zones [26]. Due to the rapid development of backcountry skiing in the Tatras within the last decade, TNP management has recently introduced a system of designated skiing zones (Figure 1), covering 13% of the TNP area [25]. Backcountry skiers can move up or down over snow-covered terrain without the necessity of using ski lifts nor prepared ski pistes. Ascents are possible with special skins fixed on visitors’ skis. The backcountry skiing traffic within TNP is estimated at 10,000 visits per winter season [27]. Most of the visitor entries (approximately 70%) concentrate at Kuźnice trailhead, whereas other entry points, such as Chochołowska, Kościeliska, and Białka Valleys, are less frequently used [27].

2.2. Data

2.2.1. Inventory of Skiing Zones System

The exact delineation of skiing zones system was obtained from the TNP management and stored within the Geographic Information Systems (GIS) as a vector dataset (Supplementary Materials Data S2. Ski touring area maps).

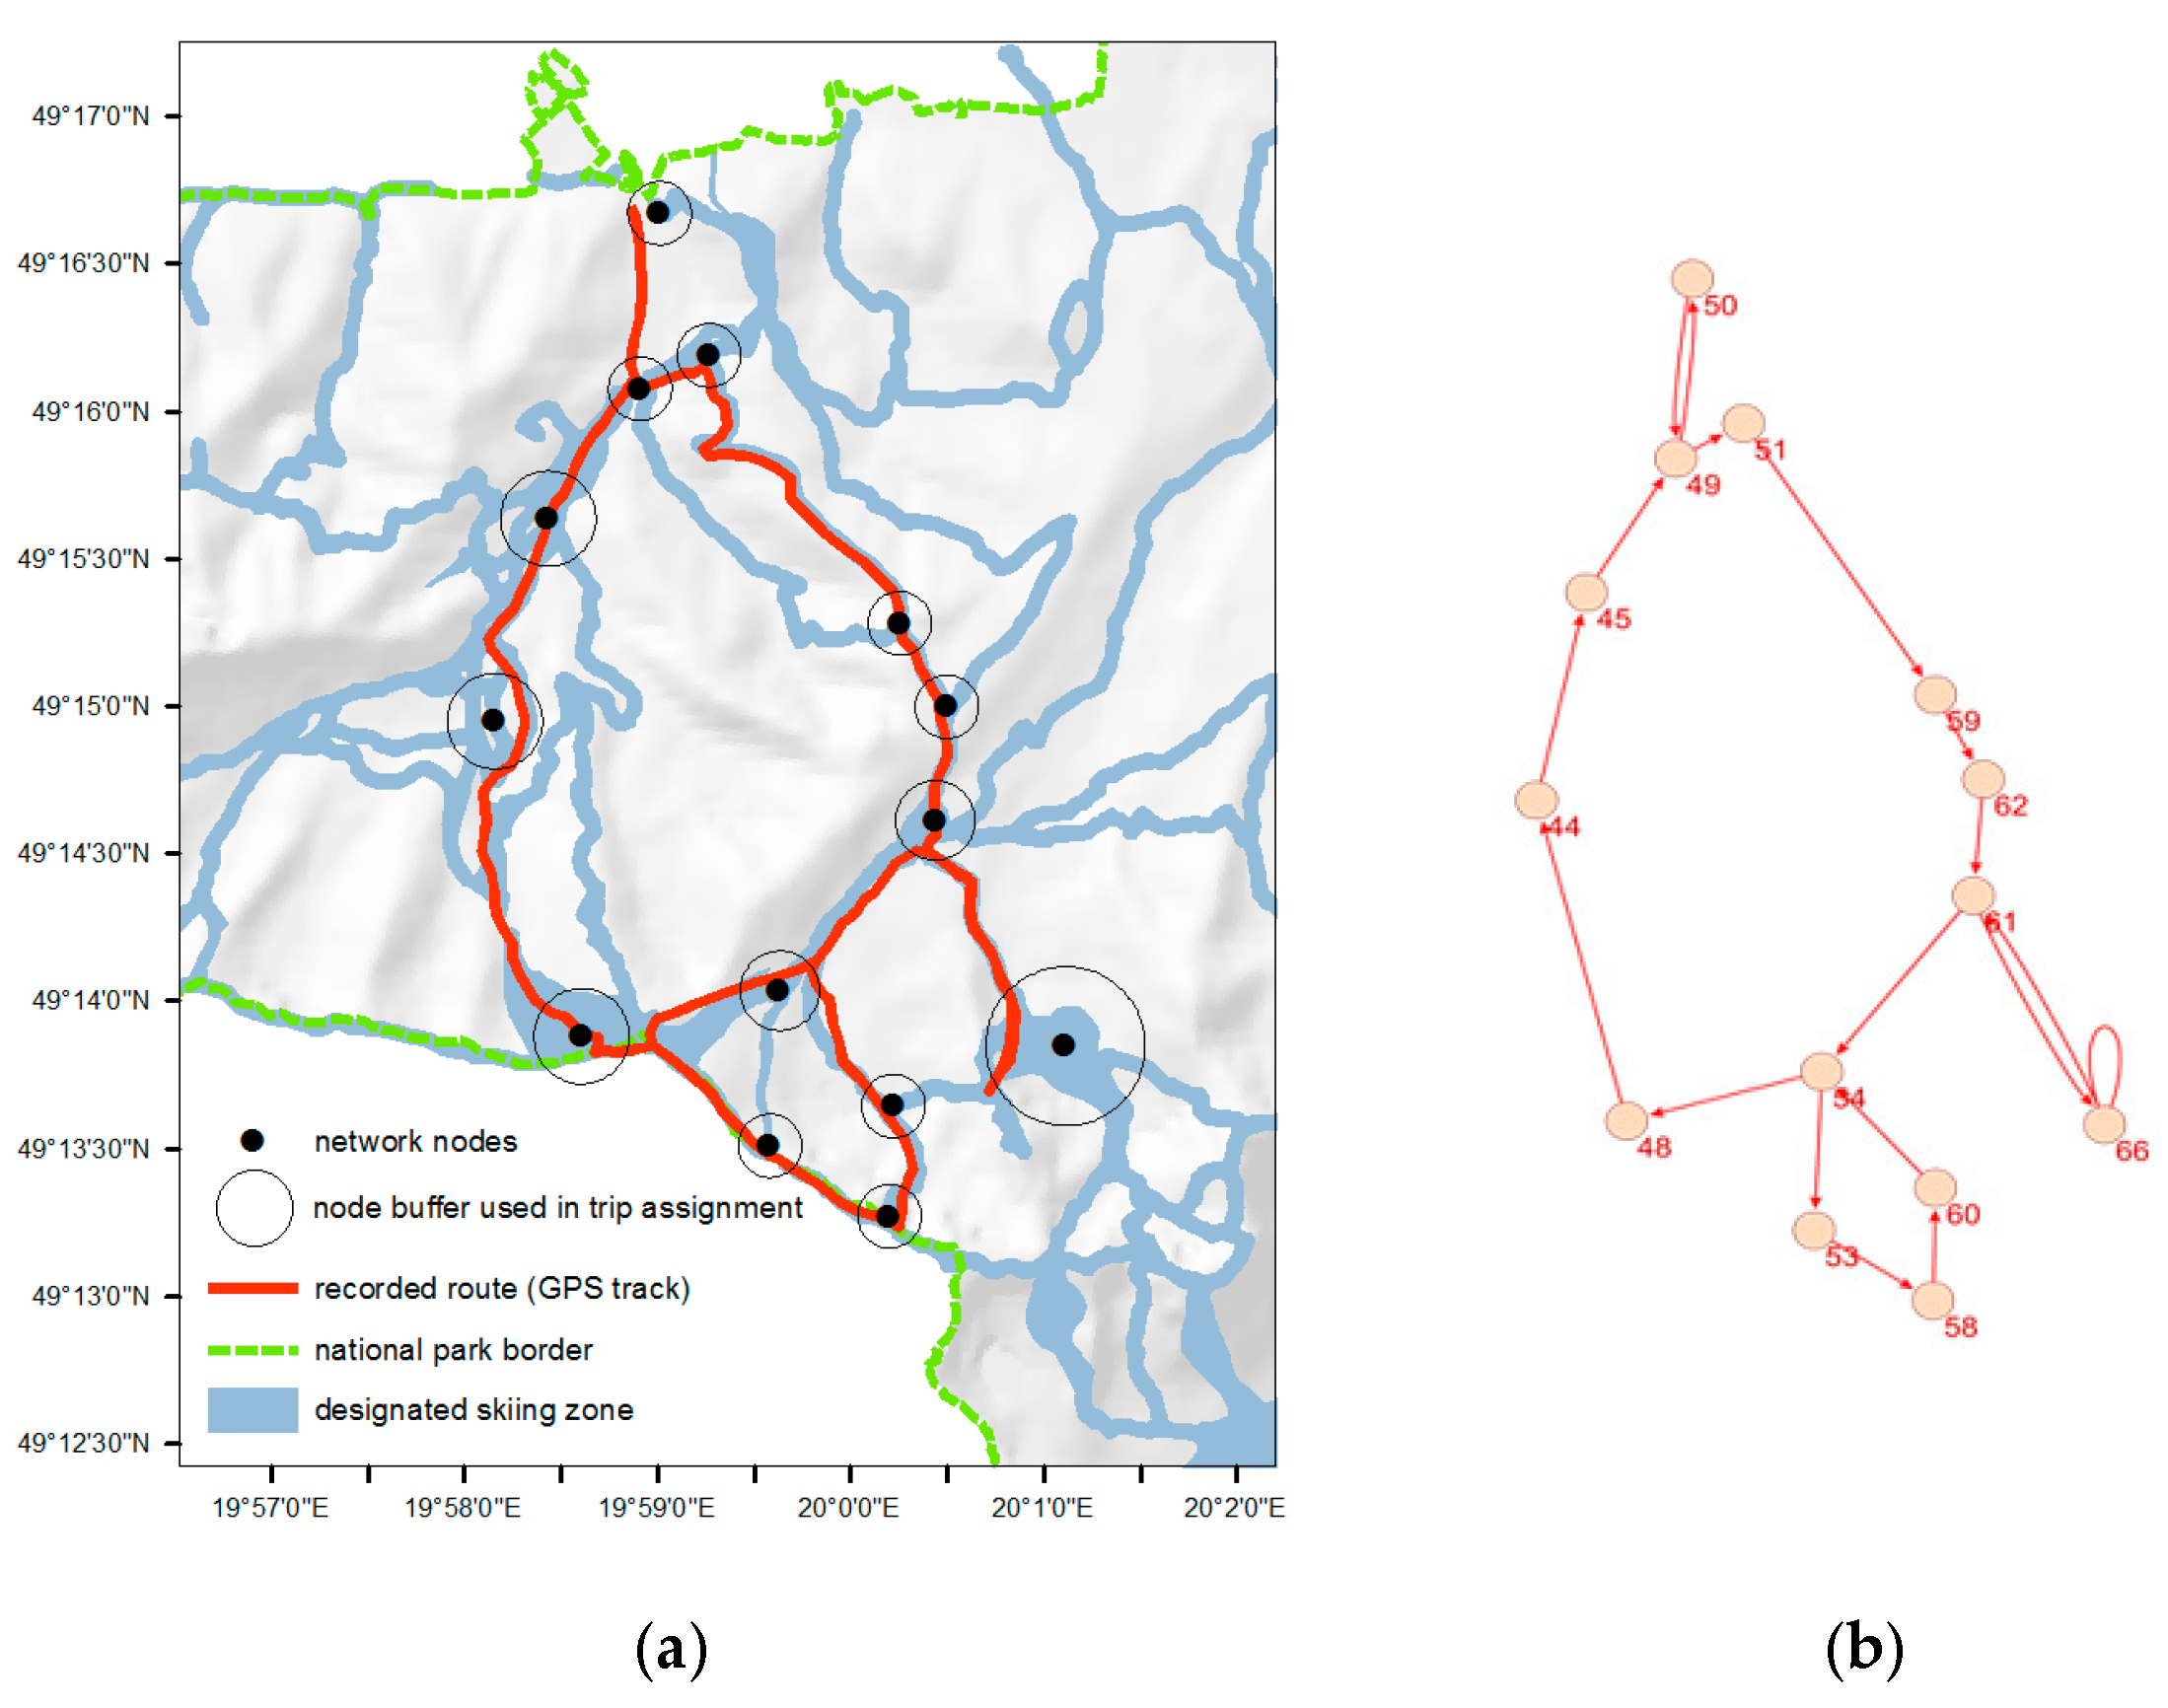
2.2.2. Mobility Data of Backcountry Skiers

In order to collect trip itineraries of backcountry skiers in TNP, the on-site GPS tracking method was applied. One hundred and three GPS loggers (Hollux M-1000C) were distributed by trained staff at major TNP entry points during sampling days throughout the winter seasons of 2012 and 2013. The GPS loggers were distributed simultaneously during the sampling days at three chosen entrances (Kuznice, Koscieliska, Chocholowska). The choice of these points was based on the pilot study [25]. The chosen entrances provide access for the ski tourers to central and western parts of the park. Each ski tourer entering TNP (at the chosen entry points) was approached and asked to carry a GPS device for the duration of his or her trip. The response rate was 87% and the total sample size reached 609 backcountry skiers participating in the study. Thirty-six GPS tracks were partially incomplete due to low battery level and/or device failure, and were therefore excluded from further analysis. Therefore, 573 complete tracks were used as a basis for final calculations (Supplementary Materials Data S1. Tracks).

2.3. Data Analysis

The general procedure of data analysis consisted of the following steps:
  • GPS data pre-processing
  • Creation of the structural network (undirected graph)
  • Creation of the functional network (directed graph)
  • Quantification of network connectivity indices
  • Calculation of centrality measures of network nodes.
The calculations were made in MATLAB (version R2012b) [28] and Pajek software (version 5.01) [29].

2.3.1. Pre-Processing of GPS Data

GPS data was stored in GPX data format and pre-processed. It was necessary to clear some spatial artefacts caused by GPS signal reflection observed while starting up a device or location in unsuitable terrain conditions (e.g., deep mountain valleys, indoor usage of GPS logger in mountain huts or cable car station). GPS loggers were configured to record trackpoints every 50 meters (or every 120 seconds in the absence of movement). Taking into account these conditions, all anomalous data (e.g., displacements > 200 m) were identified and quantified. GPS tracks having signal errors above 10% were not considered for further analysis. However, tracks presenting smaller levels of error (<10%) were corrected using 1-D median filtering (medfilt1 Matlab function). In addition, the first five records from each GPS track were deleted due to the instability of the GPS device immediately after activation.

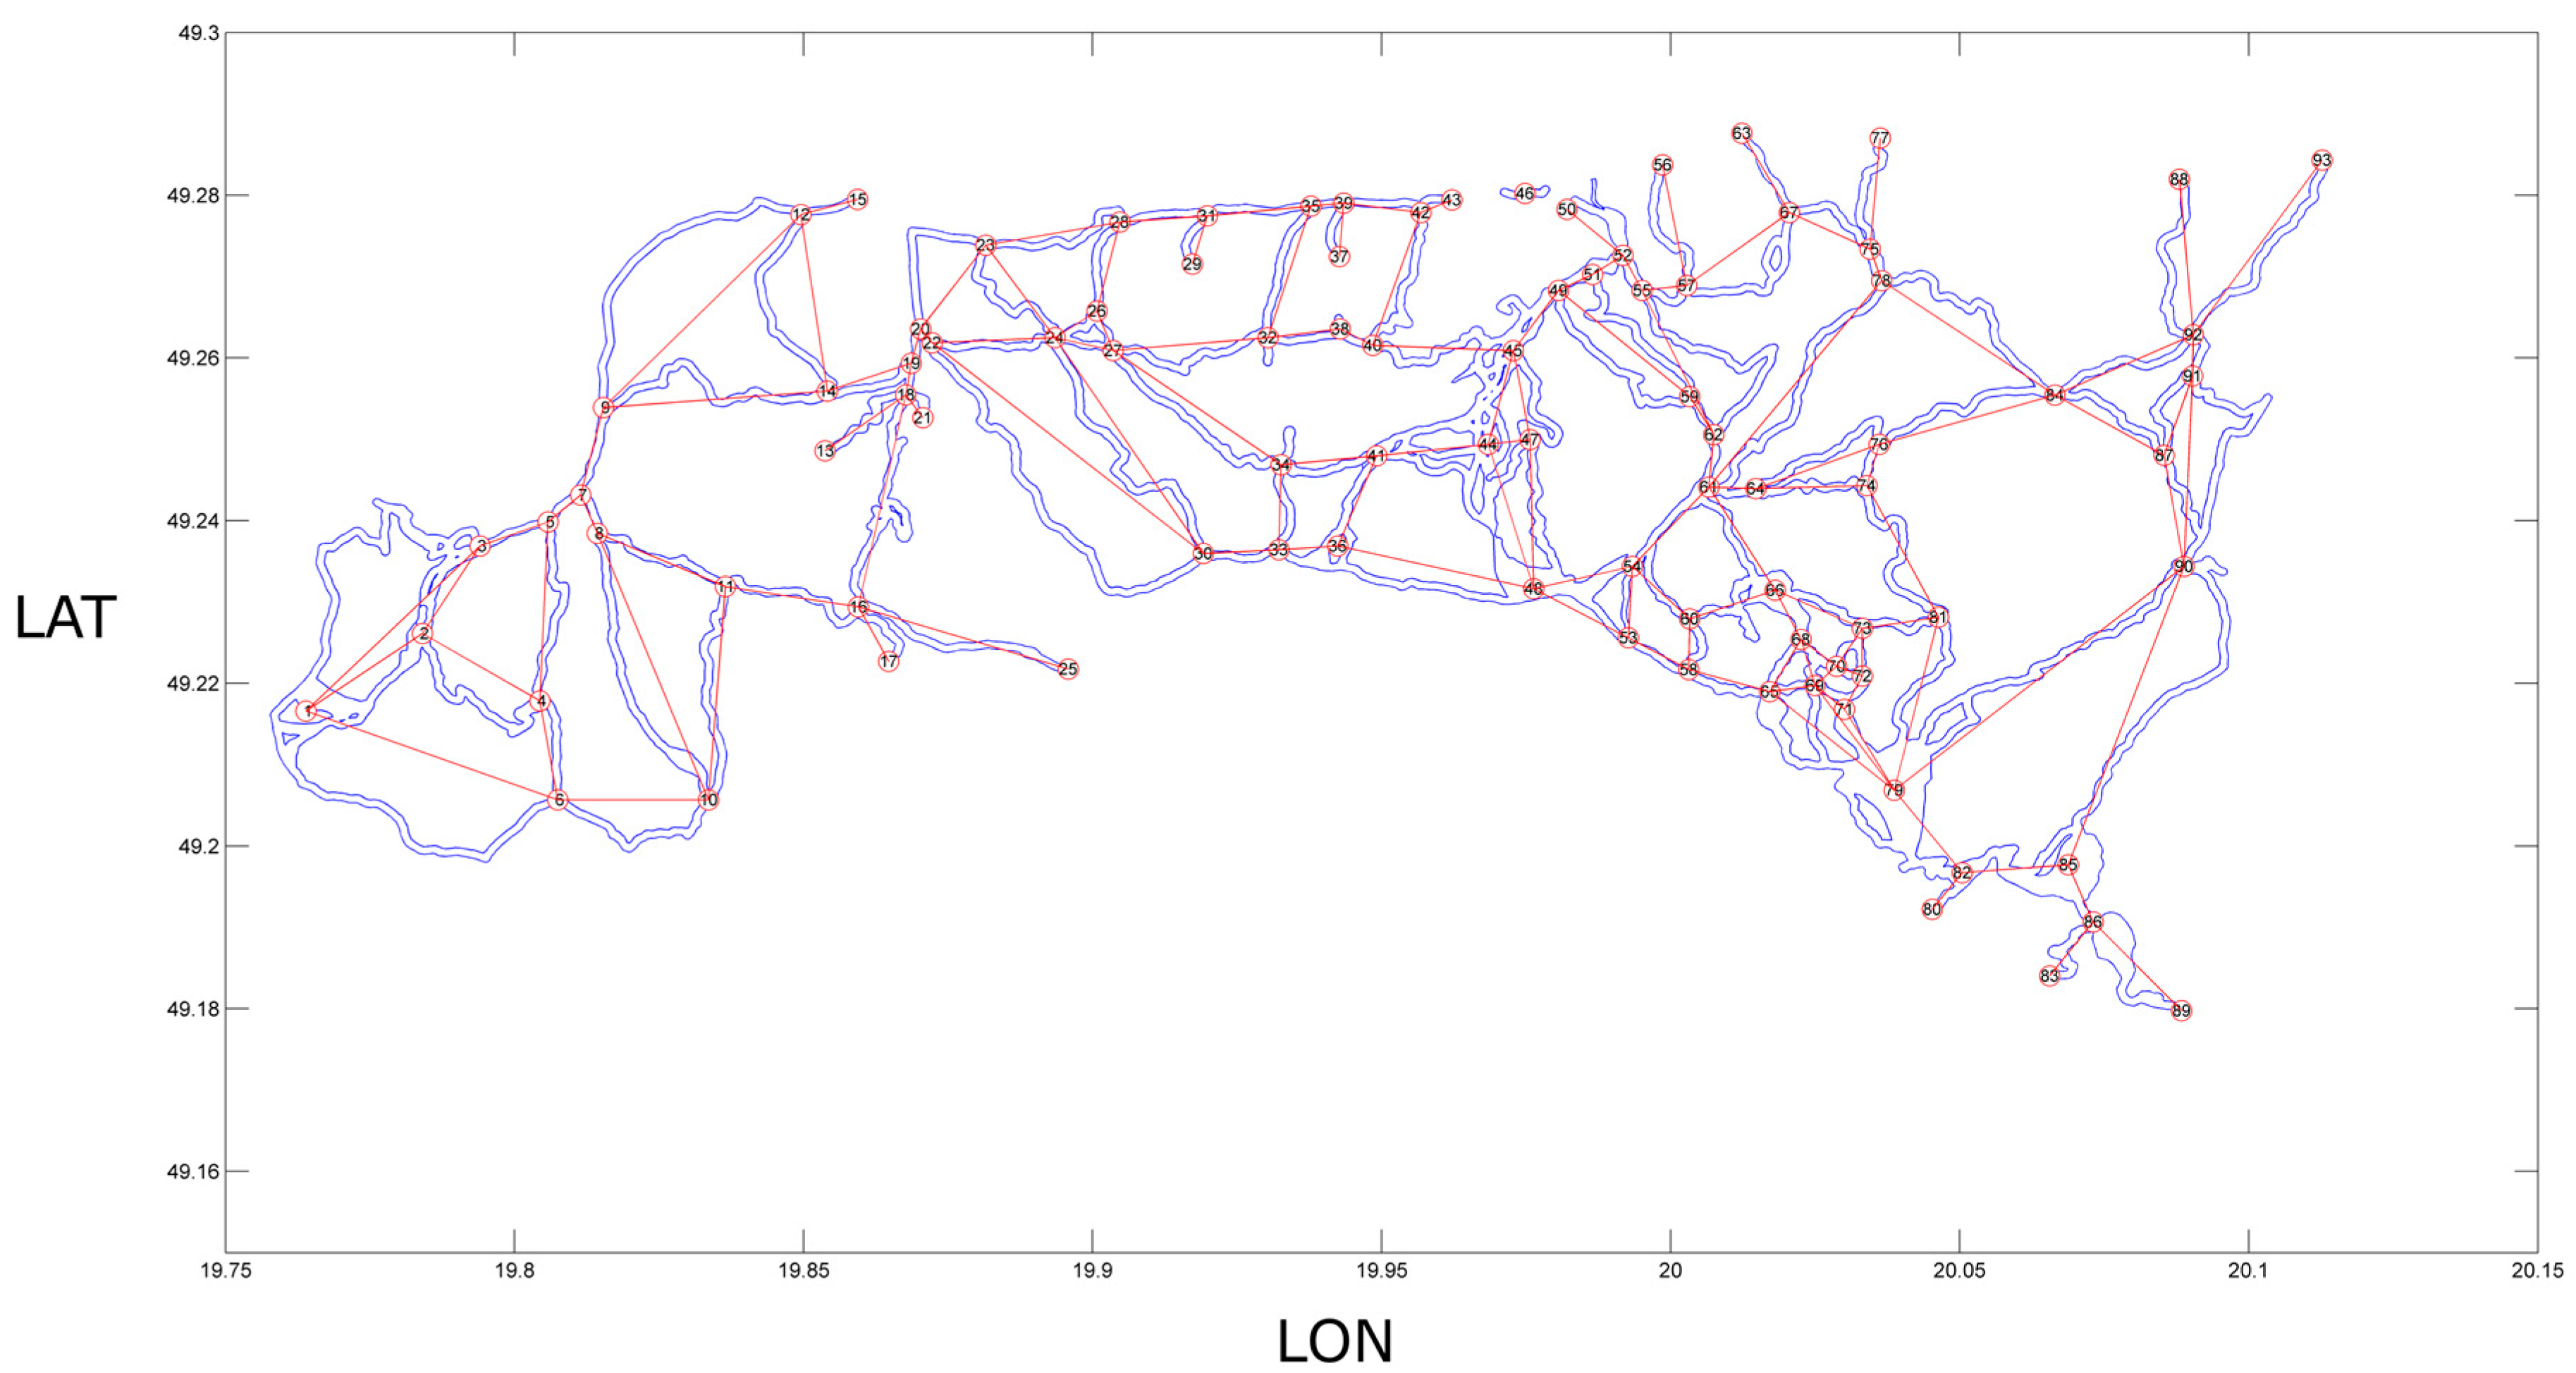
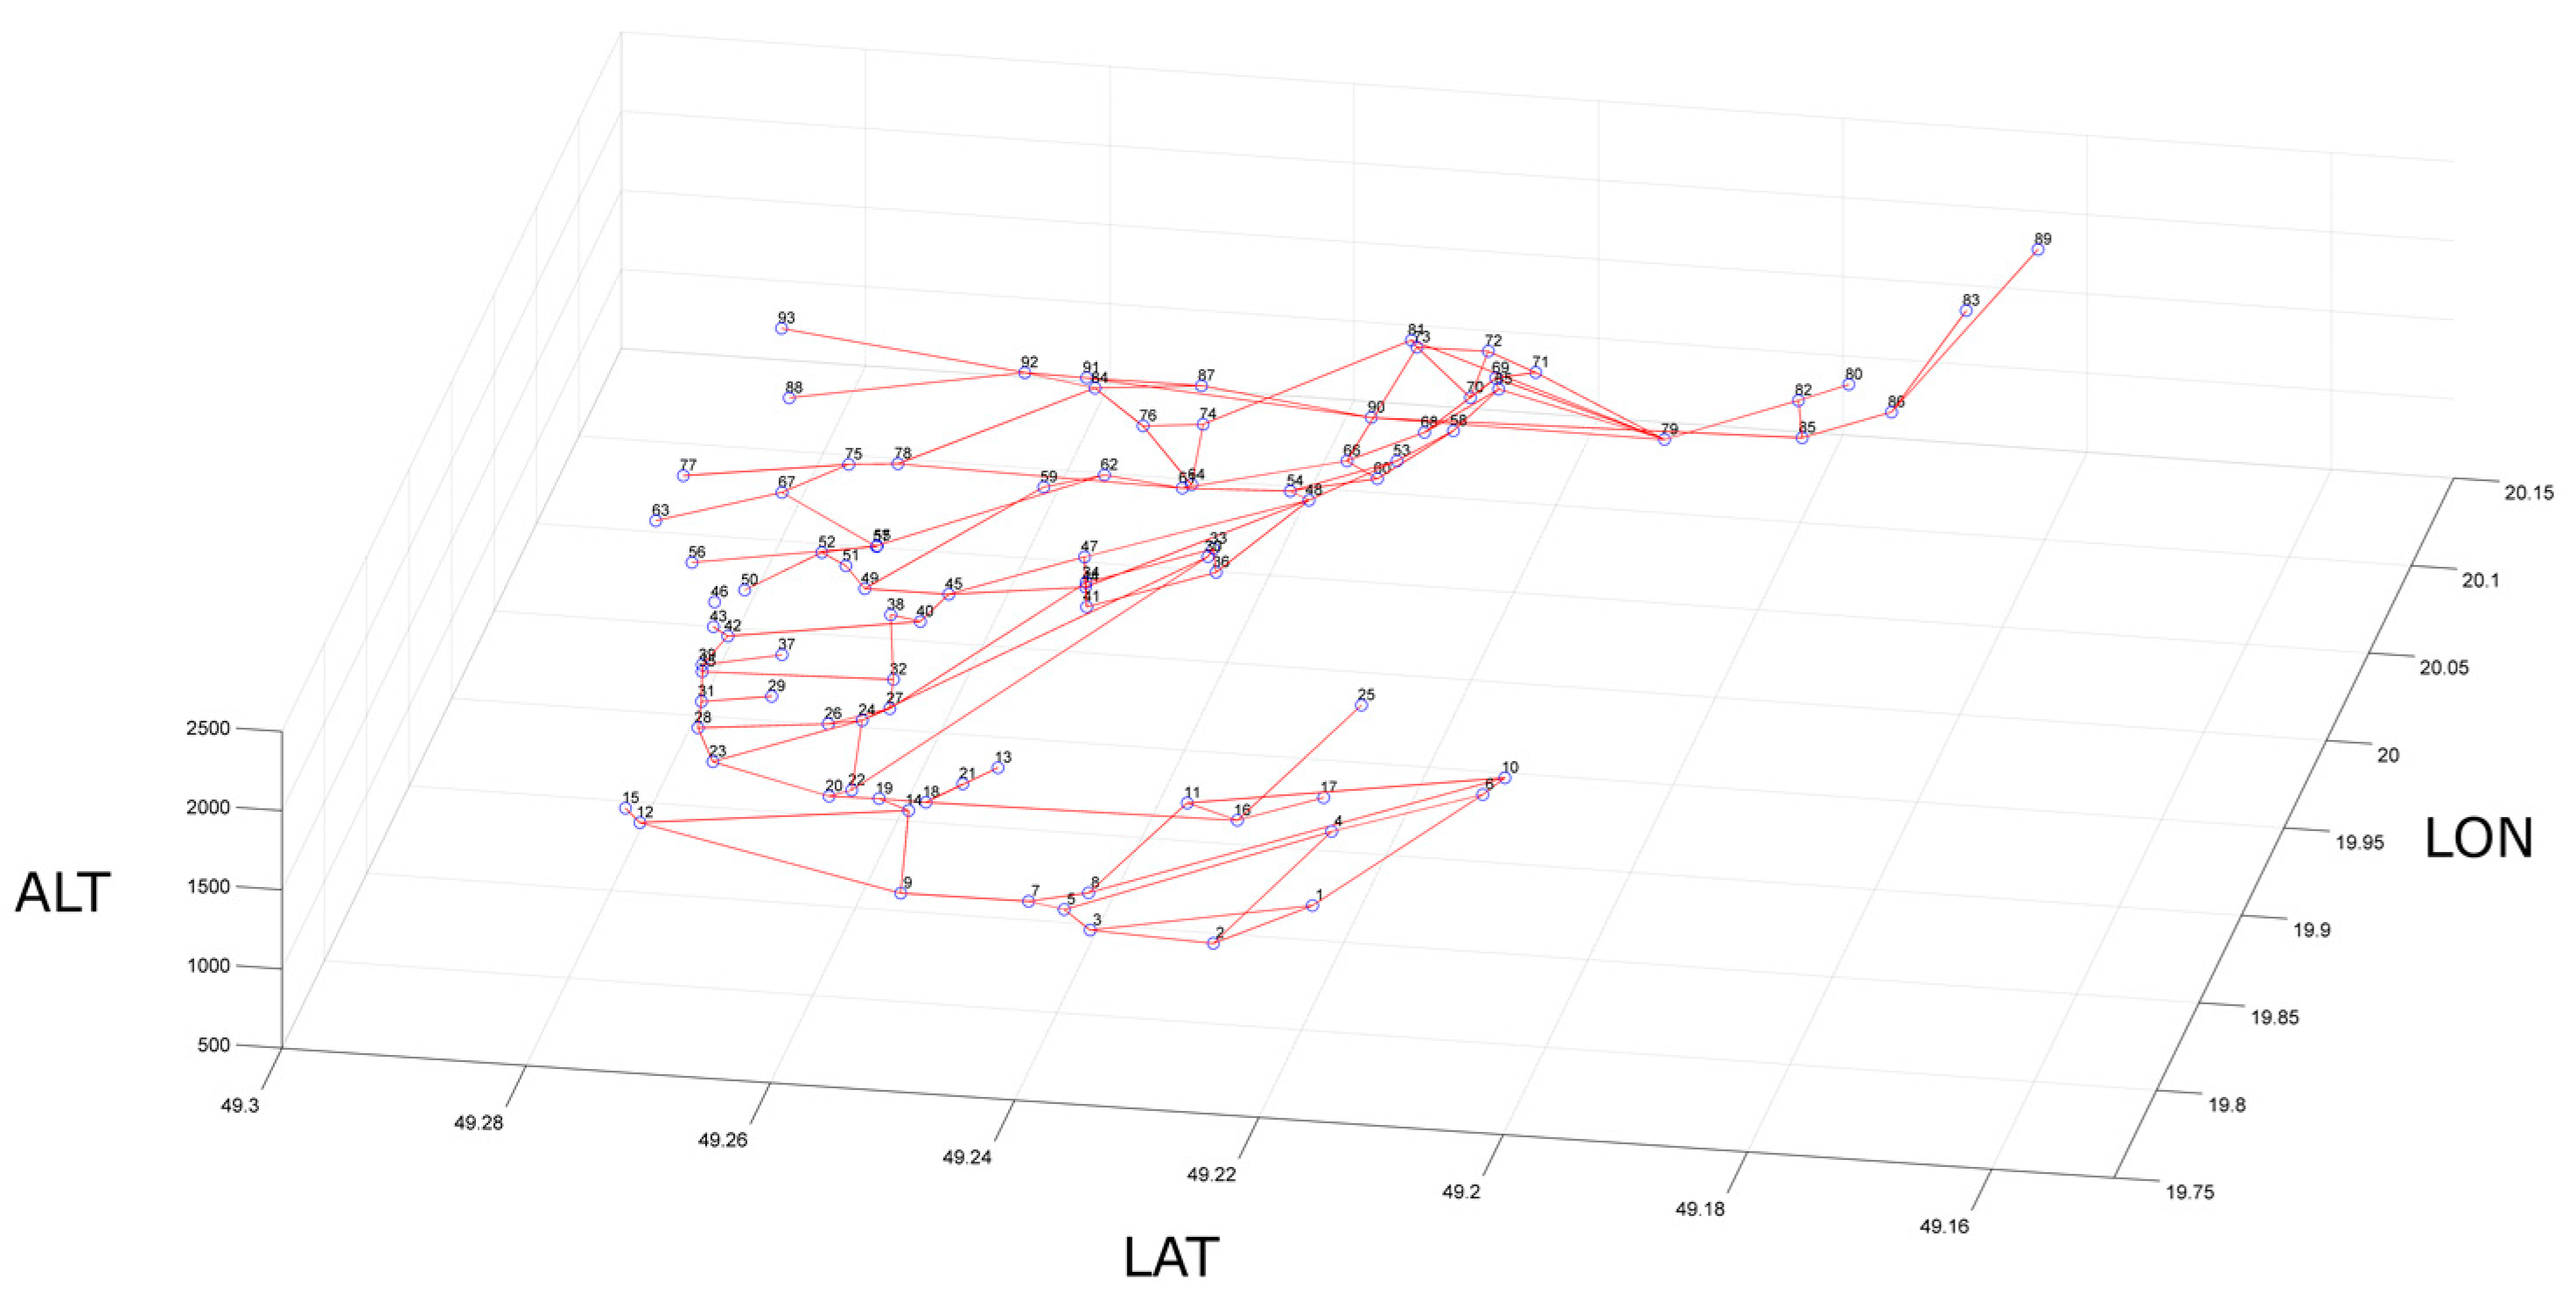
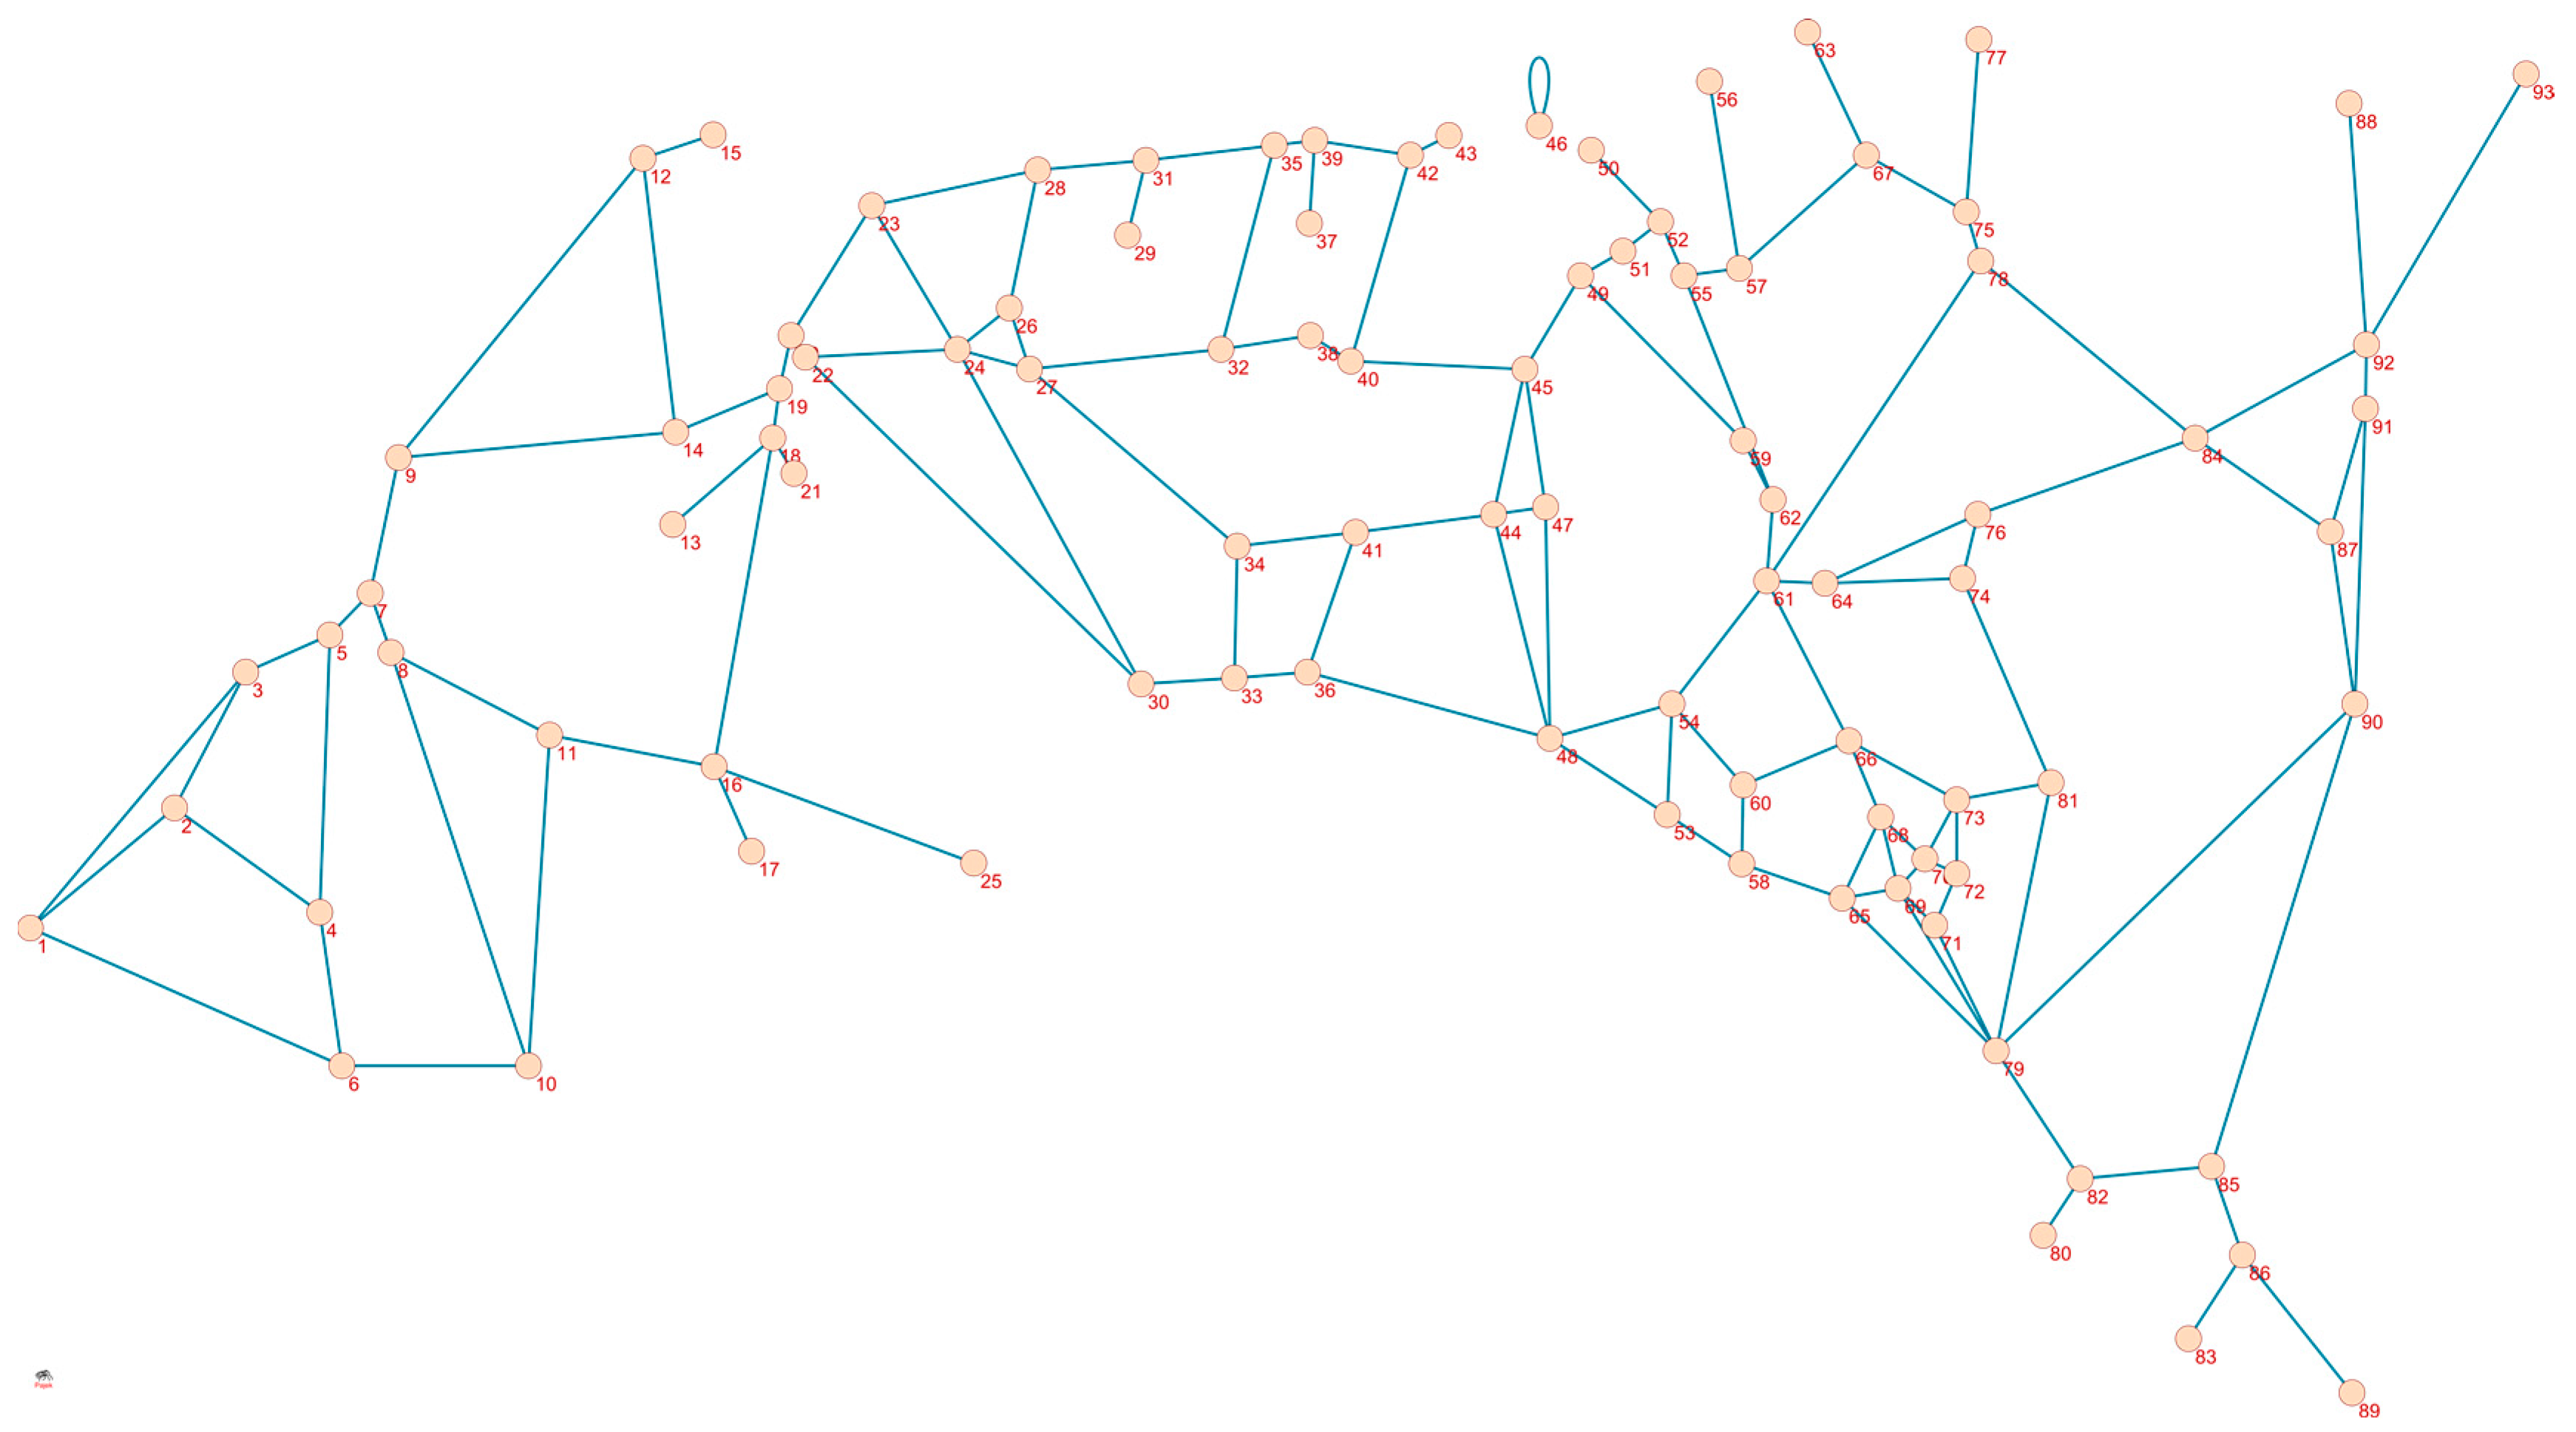
2.3.2. Creating the Structural Network

The physical structure of the entire skiing zones system was simplified into a graph structure (structural network; undirected graph). In order to build this structure, we used the geometric planes of the ski area in ESRI Shapefile (Supplementary Materials Date S2. Ski touring area maps). Trailheads as well as crossing points of skiing areas were used as nodes of the constructed network (all of them were labeled as a function of their west-east location, from 1 to 93). The node number 1 corresponded to the location situated most west, while number 93 referred to the node located most east. The ski paths between nodes were converted into network links (edges of the graph). In this way, the structure of the graph consisted of 93 vertices and 133 edges. The graph structure was saved as plaintext in Pajek file format for further analysis. Figure 2 and Figure 3 present the resulting graph, based on the network of designated skiing zones in TNP. The height of the nodes (Figure 3) was calculated using SRTM Elevation Data [30].

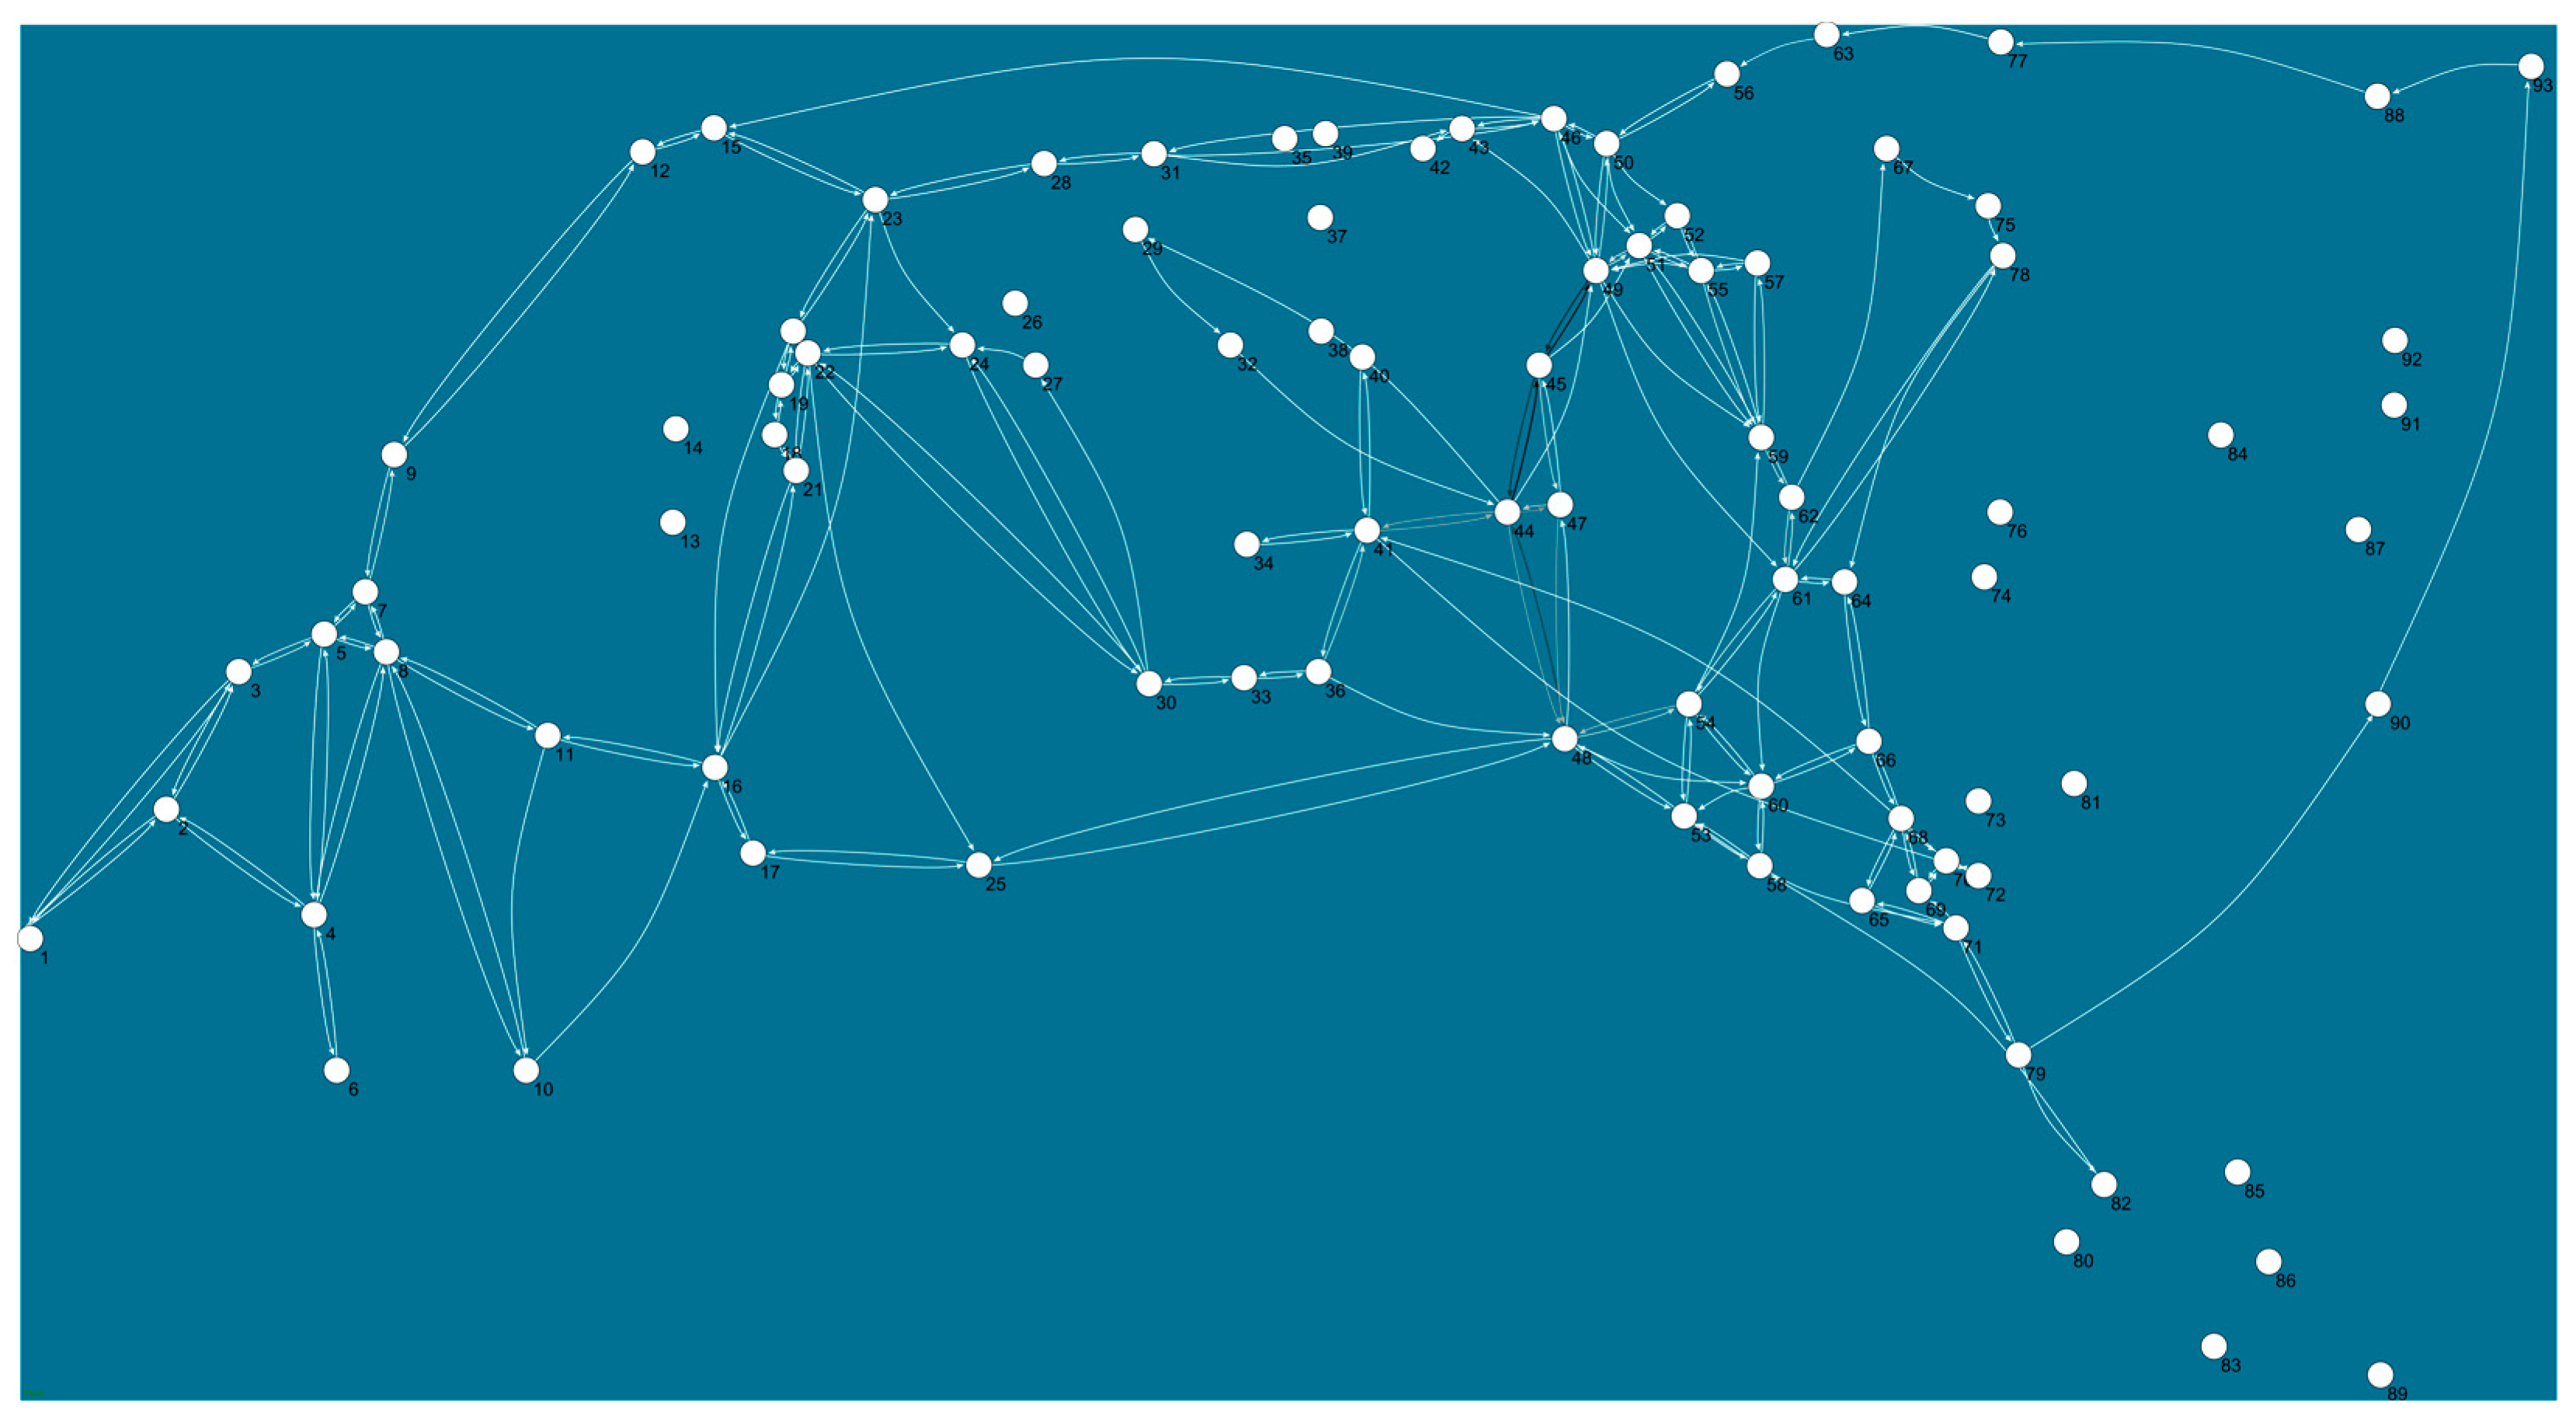
2.3.3. Creating the Functional Network

The actual use of the area by skiers (GPS records of visitors’ trip itineraries) was assigned to the network (functional network; directed graph). In order to allocate visits to specific node locations, a buffer of 200 m for every node was defined. However, after discussion with the experts of the national park, the buffers of 21 nodes were additionally adapted to specific local conditions (the buffer radius was reduced or extended). Intersections of GPS trackpoints with node buffer zones were used to establish a relation between visitor routes and the network. Figure 4 shows an example of a recorded skiing route (a) and its trip assignment to the network (b). Assignment of all GPS tracks resulted in 2420 arcs, linking network nodes. This data was stored as plaintext and analyzed with Pajek software (version 5.01) [31]. The programming code utilized to build the network can be found in the Supplementary Materials Code S3.

2.3.4. Calculating Network Connectivity Indices

Network connectivity indices quantify the coherence of a network. In order to compare the coherence of the entire structural network and the actually used one (functional network), the following measures were calculated:
  • Kansky index β =   e v where e is the number of edges, v is the number of vertices (the higher the value of β , the more coherent the network);
  • Kansky index γ = e / ( 3 ( v 2 ) ) , defining the ratio of the existing number of edges (e) to the maximum possible number of edges resulting from the number of vertices (v). The γ value ranges from 0 to 1, where the value of 1 indicates a completely connected network.
  • Kansky index α = μ 2 v 5 , where μ is a cyclomatic measure calculated as μ = e v + p , where p is the number of isolated subgraphs. An α value of 1 indicates a completely meshed network, and 0 indicates a very simple network.
A more detailed description of the indices can be found in Rodrigue et al. [10].

2.3.5. Calculating Node Centrality Measures

In order to investigate the relative importance of nodes within the system of designated skiing zones, the following centrality measures were computed: degree, input degree, output degree, degree all, weighted input degree, weighted output degree, weighted degree all, closeness, betweenness, and proximity prestige. The calculations were made for both the structural and the functional network, whereas in functional network the nodes without activity were not taken into account. Table 1 gives an overview of the calculated centrality measures.

3. Results

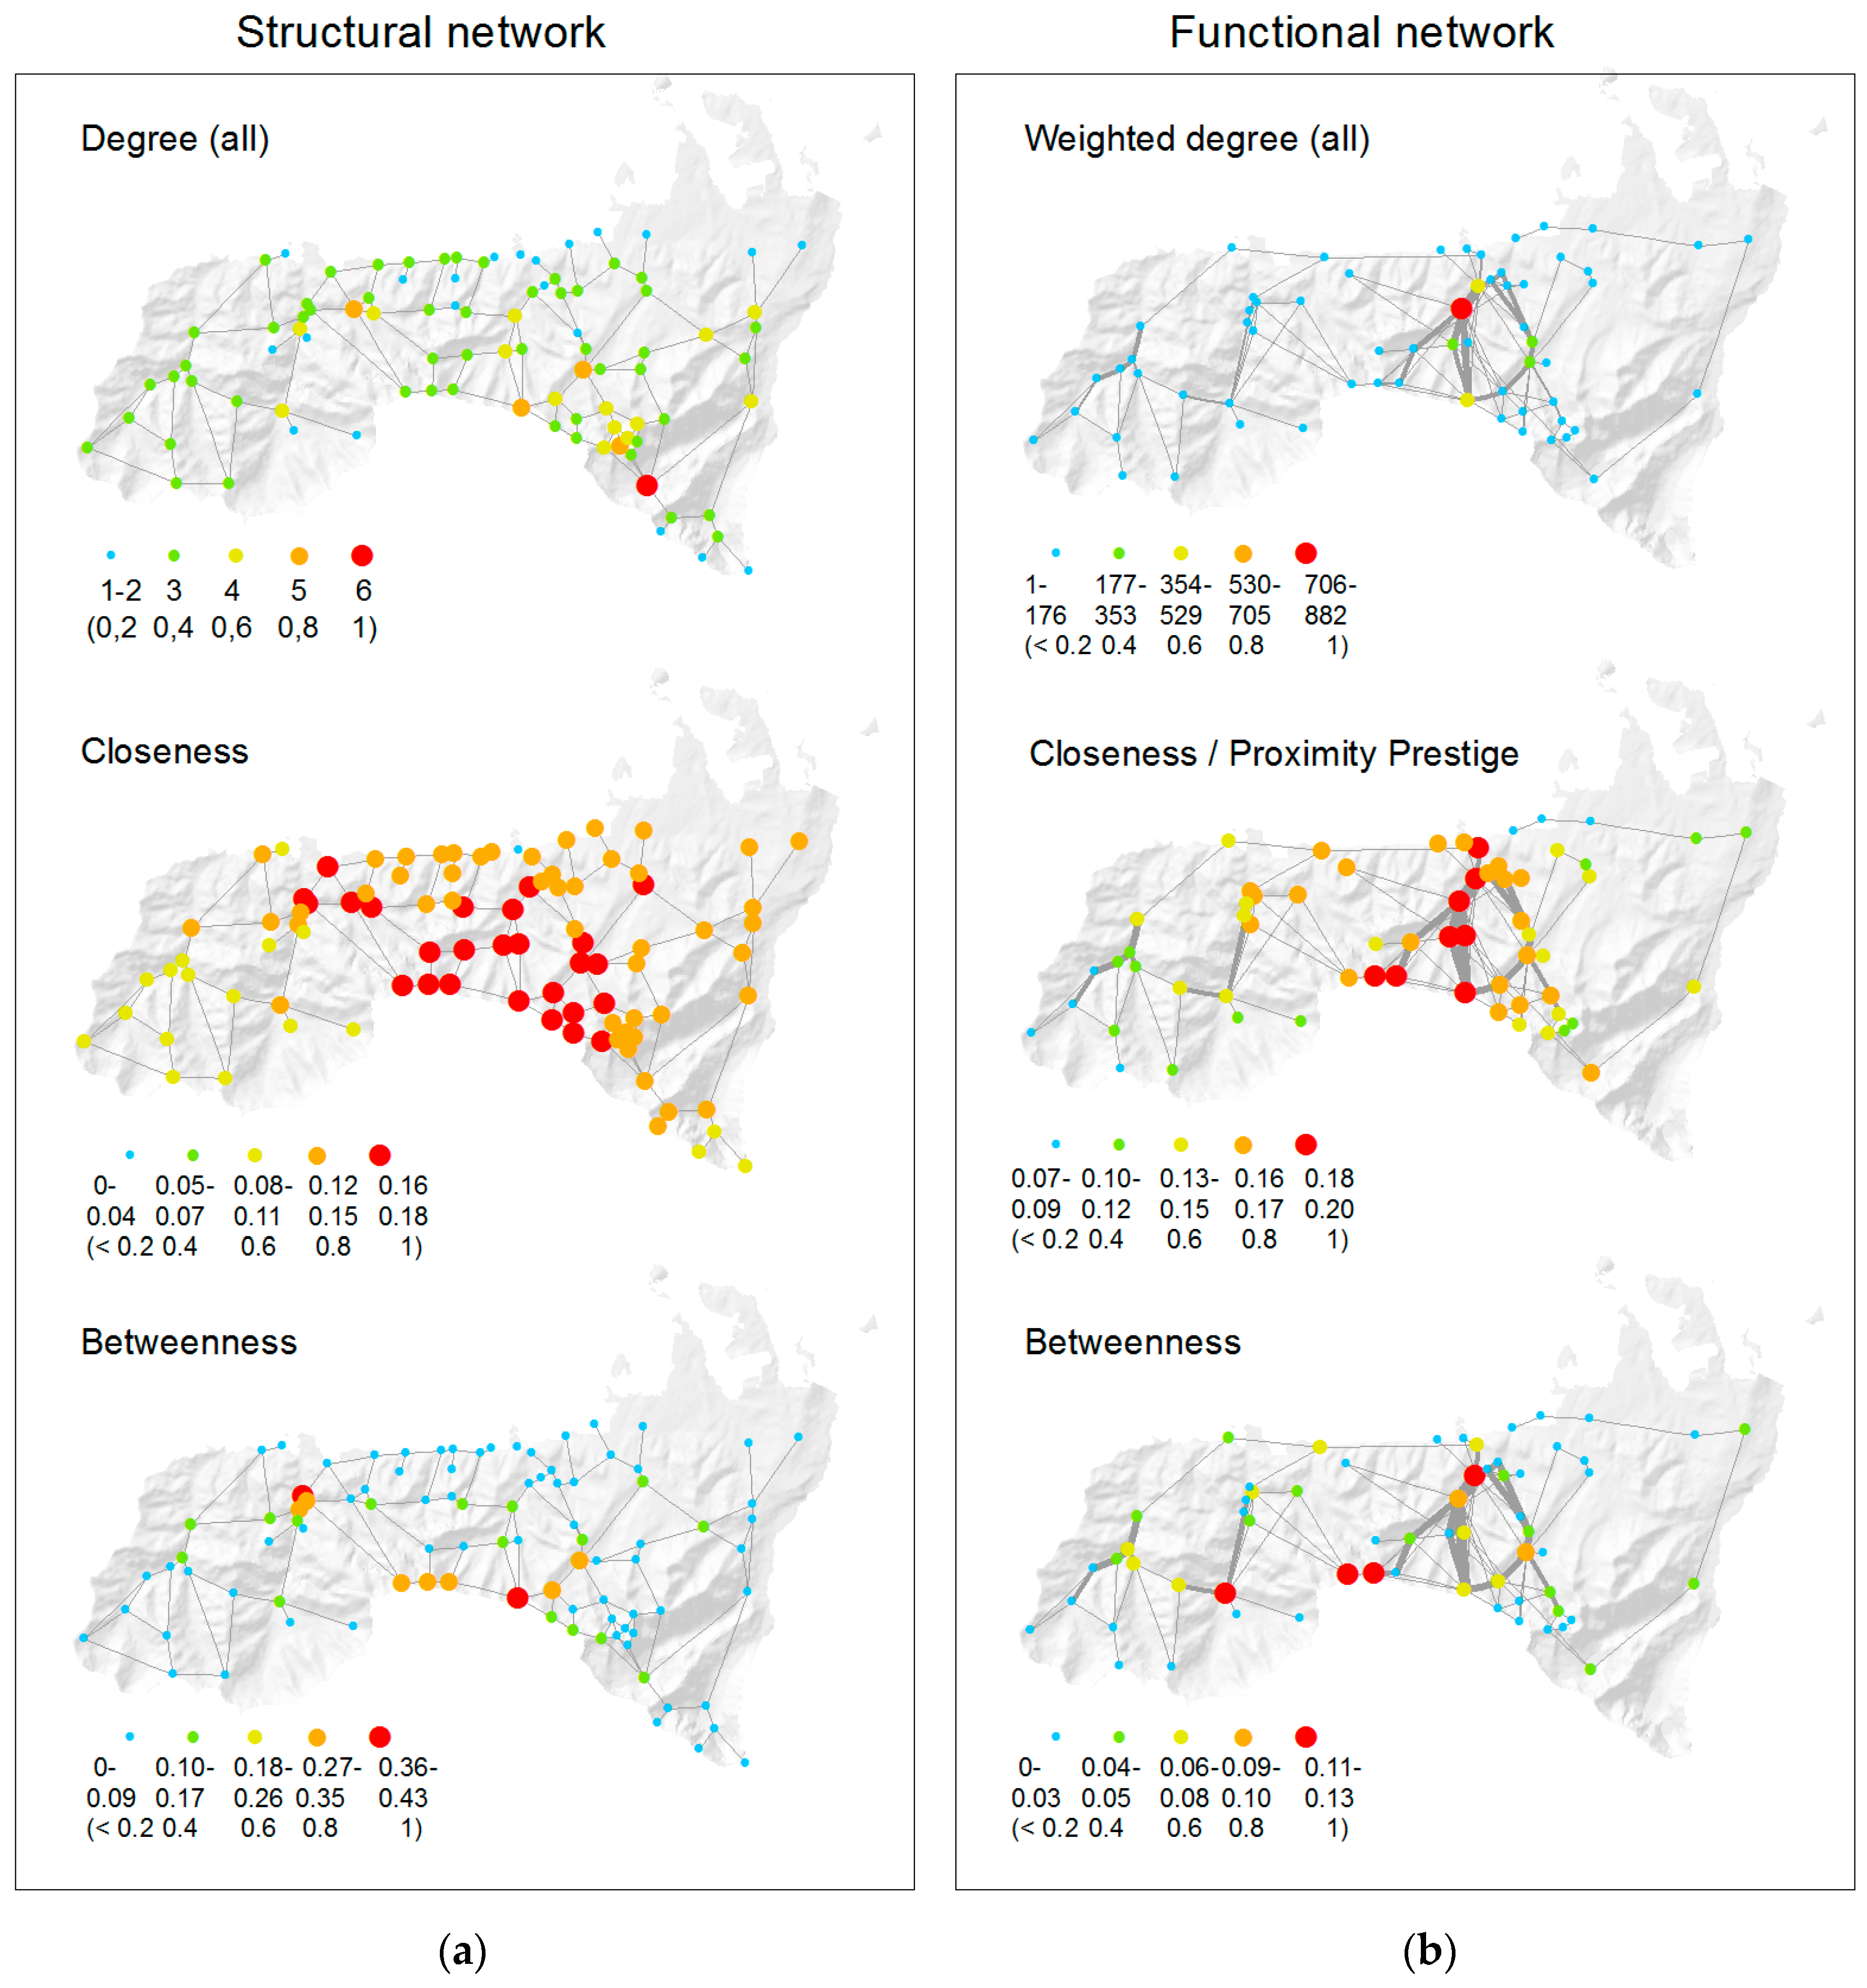
3.1. General Characteristics of the Structural and Functional Networks

Figure 5 depicts the overall structure of the skiing network. The constructed structural network consisted of 93 nodes connected by 133 links. Additionally, one loop (node 46), which was not included in the link quantification, can be also observed. The average degree was 2.86. The longest network distance was established between nodes 1 and 83 (with a total of 20 steps between both), while the number of unreachable pairs was 184.
To build the functional network, all previously defined 93 nodes were considered. However, the collected GPS data indicated that 30 nodes were not visited. The functional network had 175 links connecting 63 nodes. The average degree of the connected network was 3.76, and the longest distance occurred between the nodes 1 and 17 (with 17 steps between them). Figure 6 illustrates the functional skiing network. Both network datasets were stored in Pajek software (Supplementary Materials File S4).

3.2. Network Coherence (Connectivity Indices)

The existing network of designated skiing zones had moderate connectivity ( β = 1.43 ;   γ = 0.49 ;   α = 0.23 ) . Using the network systems typology introduced by Taaffe and Gauthier [33], the investigated network can be classified as a lattice network type. Lattice networks are characterized by a moderate density of edges relative to the number of nodes [33].
The actual recreational use concentrated only on a part of the designated skiing network. Taking into account all 93 nodes of the structural network and the documented visitors’ movement between nodes, we observed that the connectivity indices of the functional network were slightly lower ( β = 1.25 ;   γ = 0.42 ;   α = 0.13 ) . Although 30 out of the total 93 nodes (22%) were not visited at all, several additional connections between node locations were identified outside of the officially designated skiing network. This can be confirmed by the additional calculation of connectivity indices for the connected graph only (63 interconnected nodes used by visitors). These results show higher connectivity in comparison to the structural network ( β = 1.84 ;   γ = 0.63 ;   α = 0.54 ) .

3.3. Relative Importance of Network Nodes (Centrality Measures)

The results show a large heterogeneity of node centrality measures within the investigated network. Each of the applied parameters generated slightly different outputs, indicating the relative importance of nodes within the skiing network of TNP.
All nodes’ centrality values, calculated separately for the structural and the functional networks, can be found in Supplementary Materials Table S1. Figure 7 shows a graphic representation of calculated centrality measures in both networks. Results of the 10 most important nodes, considering “all degree” values, for both networks (structural and functional) are listed in Table 2 and Table 3.
The degree values were obtained for a structural network ranging from 1 to 6, and the average was 2.86. Nodes located near the northern border of the study area served as entrance locations and usually had very low degree values. Low degree values were also a typical feature of distant mountain peaks. The most interconnected nodes were located in the central part of the study area; the node with the highest degree was located in the Valley of Five Lakes. Weighted degree measures, calculated for the functional network, reflected the actual intensity of use at particular node locations. It can be seen that the majority of skiing traffic concentrates in the Kuznice-Kasprowy Wierch area. The highest weighted degree values were observed at nodes 45 and 49 (located lower in the valley, close to the Kuznice entrance point). Other nodes were less frequently used (low weighted degree values). The directions of use were balanced at most node locations; the disproportion of in and out degree values was observed at some trailheads, such as node 49 (Kuznice) and the neighboring node 45.
Closeness centrality is based on the network distance between nodes. In the structural network, nodes located in the central part of the study area had higher closeness measures, whereas nodes placed in the most western part of the park had the lowest closeness measures. Closeness calculations made for the functional network exposed the importance of the Kuznice-Kasprowy Wierch area. Nodes located in the western and the eastern parts of the study area were considered less important. Proximity prestige measures calculated for the directed network (functional network) showed equal the closeness values.
Betweenness centrality provides information about the number of geodesics in the network crossing particular nodes. In the structural network, the highest betweenness measures were observed at node 48 (the summit of Kasprowy Wierch) and at the beginning of the Koscieliska Valley, as well as at several nodes located along the main ridge of the Tatra Mountains. The functional network exposed the importance of the Kuznice entrance (node 49), Ornak mountain hut (node 16), and Czerwone Wierchy peaks (nodes 30 and 33).

4. Discussion and Conclusions

4.1. General Meaning of the Findings

The main contribution of the study is the application of graph theory to analyze a recreational system considering not only the physical structure of the environment, but also its actual use (visitor mobility data obtained via GPS tracking).
Typically, GPS tracks are analyzed within Geographic Information Systems (GIS) and focus on calculations of (track)point densities illustrating the intensity of recreational use [17,20,22,23], intersections with other thematic layers such as nature protection zones and wildlife habitats [20], or movement parameters of individual visitors [21,23,34]. Also, recent approaches of visual analytics dedicated to movement data, such as V-analytics [35,36], have gained importance and are frequently used in the field of spatial planning and transportation [35,37]. Typically, GPS tracks analyzed within a GIS framework are not constrained to network structures [35], although network analysis is an important approach used in geoinformatics [38].
Network analytic tools, although highly recognized in other disciplines such as sociology, economics, transportation, computer science, and medicine [6], are still underrepresented in the domain of recreation research [39]. Most of the studies related to outdoor recreation using graph theoretic analysis methods focus on the physical structures of recreation systems [40,41,42]. Even in the tourism sector (an important branch of the world economy), scientists underline the necessity for tourism scholars to refine and improve their analysis methods and tools, which also refers to network analytics [9].
Our study builds upon our previous work [39], applying graph theoretical approach to analyze the structure and function of a recreational system, using as an example a network of designated backcountry skiing zones.

4.2. Comparison of the Structural and Functional Networks in the Study Area

Our results show that the existing network of designated skiing zones is not evenly used by backcountry skiers. The main objective of the structure created by the park management is to minimize visitors’ impact on nature [26]. However, skiers’ major motivation is to reach an attractive peak and descent [43]. Although general connectivity indices of the structural and functional networks remained similar, a closer look at the spatial distribution of the use intensity (number of visits per network link or weighted degree measures at node locations) revealed large heterogeneity in network use. The region of Kuznice-Kasprowy Wierch turned out to be the most heavily used area, whereas other locations were less frequently visited.
When we analyzed the centrality measures of network nodes in depth, some remarkable differences were observed. The largest differences refer to degree and weighted degree measures as they directly reflect the intensity of tourist traffic. A high degree centrality value in the structural network (the existence of many skiing routes around a specified node) does not always imply higher use intensity at the specified location. For instance, a well-connected node (79) is located in the distant Valley of Five Lakes at a higher elevation. Therefore, although it has a high degree value, it is not that frequently used. In contrary, nodes 49 and 45, located close to the most popular trailhead, Kuznice, have medium degree values in the structural network, but attract most of the skiing visits in the park. For both networks only one node (48—Kasprowy Wierch peak) was similarly important, which is the central point with the top cable car station. It can be reached by ski-tourers from many directions, even in bad weather conditions with a high level of avalanche risk. Moreover, this peak (Kasprowy Wierch) is also surrounded by the groomed pistes for downhill skiing. These factors explain the high popularity of this node location.
The closeness parameter is generally similar in the structural and functional networks. However, there are some nodes that differ in use. Nodes 36 and 53 have a high closeness value in the structural network. These two points are also important in the functional network, as they are usually ski tour destinations and, after reaching them, the skiers turn back and descend. It is also remarkable that nodes with low closeness values were generally less frequently used, or even not visited at all.
The betweenness values showed us that in the structural network the nodes 48, 20, and 19 have very high values, while in the functional network the maximum intermediation values are in nodes 33, 49, 30, and 16. The areas close to the peaks are those used by skiers as transit areas (e.g., nodes: 30, 33), while the areas close to the forest or to the entrances (e.g., nodes: 19, 20) are the most important points according to the structure.
The comparison of the structural and functional properties of the skiing network showed that recreational use only partly depends on the network structure (e.g., distribution of use in the Kuznice-Kasprowy Wierch region). The overall popularity of specific network locations is possibly caused by additional external factors, such as accessibility from tourist resorts or the difficulty of ski tours related to local terrain and snow conditions [25]. A further reason for strong differences between the two mentioned networks is the origin of the structural network, which was primarily designed for summer hiking [26]. The winter network was created only recently [25], and according to the legal regulations it was obligatory to base it on the summer hiking trial network [44].

4.3. Limitations of the Proposed Methodology

The main strength of this study is a parallel analysis of the structural and functional properties of the system of designated skiing zones in TNP. Collected mobility data (GPS tracks) were assigned to the existing network structure and several measures characterizing the overall network as well as the relative importance of node locations were investigated in order to better understand how the park space is being used by backcountry skiers.
Nevertheless, there is still room for methodological improvements. One of the limitations of this study is related to the use of GPS loggers to collect the mobility data of backcountry skiers. It is possible that skiers may have changed their behaviors by feeling observed. This problem is a subject of discussion in recreation monitoring studies using GPS tracking to document visitor behavior in protected areas [19,23,39]. However, so far there is no empirical confirmation of this thesis. Moreover, the accuracy of GPS records can be influenced by mountain terrain conditions (e.g., lower accuracy in narrow valleys, forested areas) [45], which is another limitation of this data collection technique.
Another discussion point refers to the sampling strategy used during the distribution of GPS loggers. GPS devices were distributed simultaneously at major trailheads of the national park by trained staff, which required a demanding logistic strategy and was challenging in winter conditions. Therefore, the study concentrated on the most important entrance locations and some minor trailheads were disregarded. We analyzed only the three main entry points, excluding the Bialka Valley due to its lower importance from the management perspective and high cost of data collection campaign (far away from Zakopane). In the future this entrance might be a case of its own for researching backcountry skiing traffic accessing the highest peaks of the Tatra Mountains.
As a consequence, their surroundings were underrepresented in the overall spatial distribution of skiing traffic, which possibly could affect the calculations of the functional network measures. In order to overcome these limitations, in the future, technological advances should enable anonymous tracking of visitors’ electronic devices (such as mobile phones) at desirable resolutions [15,46,47]. Nevertheless, so far systematic tracking via distributed GPS loggers is one of the most reliable methods used for visitor monitoring in outdoor leisure settings. It is also worth mentioning that the total number of backcountry skiers entering TNP at the investigated trailheads [27] corresponds with the proportions of the collected GPS tracks.
Backcountry skiing is an example of a semi-open recreational system [22], where people can move along designated trails, but they also can leave a marked track and move freely over snow-covered terrain. Assigning recorded visitors’ trip itineraries to a network structure is very successful in cases when visitors follow designated trails. It is also possible when visitors are crossing network nodes and are moving partly off-trail (the presence at particular node locations enables establishing a network link). Yet, the most challenging situation from the network analytics perspective occurs when a visitor completely leaves the system of designated skiing zones and moves freely out of the skiing network. Such type of spatial behavior cannot be documented with the methodology proposed in this paper. Extending the number of network nodes, including all potential off-trail destinations (such as unconnected mountain passes or peaks) in the network could possibly overcome this problem and will be considered in future studies. Visitors who do not cross the specified node locations cause “untightens” of the investigated network system. This problem is particularly visible by comparing the directed degree measures of network nodes (in-degree and out-degree). In transit locations, those values should be practically the same, but in the presented results in- and out-degree values sometimes differed from each other. Large differences in directed degree measures were observed in nodes 49 and 45. This fact is caused mainly by another reason: the data pre-processing algorithm deleting the first five records of each track, which were mainly located around the entrance node 49 (Kuznice). In this way, the network link “49, 45” was not considered in several skiing itineraries.
From the network analytics point of view, we only calculated well-established parameters such as network connectivity ( β , γ , α indices) and basic node centrality measures (degree, closeness, betweenness, and proximity prestige). Future work could use other calculations [6,8,10,29,32,48] that could extend our analysis. Next to the topological properties of the network, geographic dimension could be additionally considered by using spatial graphs [49]. In this way metric distances between nodes and terrain steepness could be included in distance calculations and accessibility measures.

4.4. Meaning of the Findings for Visitor Management in Protected Areas

The presented results deliver comprehensive information about the structural properties of the designated skiing network in TNP and its actual use over the winter season. Outcomes of the study can be practically used for evaluating the newly introduced regulations concerning backcountry skiing in this protected area and for supporting management decisions related to the strategic allocation of infrastructure and provisioning purposive tourist information.
Although designated skiing zones cover 13% of the total park area, most of the skiing traffic concentrated in one particular region: Kuznice-Kasprowy Wierch. Basically, the management strategy of TNP requires some improvements in the guidance of winter visitors. The first important aspect is the lack of signage dedicated to backcountry skiers in many strategic locations, such as the Kuznice trailhead and its surroundings, as well as the Kasprowy Wierch peak. The presented results indicated node locations with the highest centrality measures (especially those calculated for the functional network) which could be used as a background for further decisions concerning the locations of information boards and signposts in TNP. Node locations with high betweenness values should be especially carefully investigated, as their strategic position enables directing visitor flow to other regions of the national park. Experiences from other protected areas underline the importance of signposting for effective visitor guidance in protected areas [50,51]. It would also be desirable to promote certain backcountry skiing destinations through written information (e.g., maps, informative leaflets), participative events, and discussions in order to avoid skiing traffic in the most vulnerable nature conservation zones [50].
We conclude that that the newly designated system of backcountry skiing zones, largely based on the summer hiking trail network and the existing groomed pistes of downhill skiing, needs detailed functional analysis and partial adaptation in order to conform with winter recreation requirements in addition to nature protection objectives. The presented study based on graph theory is a first step to evaluate the whole winter recreation system, considering not only its structural properties but also its function.

Supplementary Materials

The following will be available online at www.mdpi.com/2073-8994/9/12/317/s1, Data: S1. Maps: Tracks; S2. Ski touring area maps; Code: S3. Code MATLAB; Files: S4. Pajek; Tables S1. Centrality parameters.

Acknowledgments

This study was supported by a research grant of the University of Valencia, Spain (Ayudas para estancias de investigacion: UV-INV EPDI15-276152) and the bilateral Scientific and Technical Cooperation Programme between Austria and Poland (S&T Cooperation/WTZ grant number PL01/2016). The authors wish to thank the Tatra National Park management, especially the director—Szymon Ziobrowski—for support, organizational help, provisioning of GPS loggers, and agreement to provide open access to the collected data. We also would like to thank TNP volunteers and the students from the Department of Tourism and Recreation, University School of Physical Education in Cracow, Poland involved in data collection.

Author Contributions

K.T., L.-M.G. and J.L.T.-H. came across the idea of linking GPS tracking data and graph theoretic analytical approaches in the field of outdoor recreation research. K.T. and L.-M.G. designed the general methodology and decided on network analytic methods being used. M.B. conceived, designed, and coordinated the field experiments (GPS tracking of backcountry skiers) in Tatra National Park and provided his expertise and critical comments at all stages of study design, data management, data processing, analysis, and interpretation of the results; L.-M.G. and X.G.-M. analyzed the data in MATLAB and Pajek; K.T. did calculations and results visualizations in GIS. K.T. wrote the paper, L.-M.G. and X.G.-M. contributed to the methodological part of the manuscript and the results description, L.-M.G. and M.B. contributed additionally to the discussion and conclusions section; J.L.T.-H. provided substantial advice at the conceptual and analytical stage of the study along with constructive comments on data presentation, discussion of the results, as well as the overall preparation of the manuscript.

Conflicts of Interest

The authors declare no conflict of interest. The founding sponsors had no role in the design of the study; in the collection, analyses, or interpretation of data; in the writing of the manuscript, and in the decision to publish the results.

References

  1. IUCN. Red List of Ecosystems. Available online: https://www.iucn.org/about/union/commissions/cem/cem_work/tg_red_list/ (accessed on 28 November 2017).
  2. Dudley, N. Guidelines for Applying Protected Area Management Categories; International Union for Conservation of Nature (IUCN): Gland, Switzerland, 2013. [Google Scholar]
  3. Newsome, D.; Moore, S.A.; Dowling, R.K. Natural Area Tourism: Ecology, Impacts and Management, 2nd ed.; Newsome, D., Moore, S.A., Dowling, R.K., Eds.; Channel View Publications: Bristol, UK; Tonawnda, NY, USA; North York, ON, Canada, 2012; ISBN 978-1-84541-381-1. [Google Scholar]
  4. Bell, S. Design for Outdoor Recreation; Taylor & Francis: Abingdon, UK, 2008; ISBN 978-1-134-10804-6. [Google Scholar]
  5. Cole, D.N.; Daniel, T.C. The science of visitor management in parks and protected areas: From verbal reports to simulation models. J. Nat. Conserv. 2003, 11, 269–277. [Google Scholar] [CrossRef]
  6. Barabási, A.-L.; Pósfai, M. Network Science; Cambridge University Press: Cambridge, UK, 2016; ISBN 978-1-107-07626-6. [Google Scholar]
  7. Newman, M. Networks: An Introduction; Oxford University Press: Oxford, UK, 2010; ISBN 978-0-19-920665-0. [Google Scholar]
  8. Scott, N.; Baggio, R.; Cooper, C. Network Analysis and Tourism: From Theory to Practice; Channel View Publications: Clevedon, UK; Buffalo, NY, USA, 2008; ISBN 978-1-84541-087-2. [Google Scholar]
  9. Baggio, R. Network science and tourism—The state of the art. Tour. Rev. 2017, 72, 120–131. [Google Scholar] [CrossRef]
  10. Rodrigue, J.-P.; Comtois, C.; Slack, B. The Geography of Transport Systems, 3rd ed.; Routledge: New York, NY, USA, 2013; ISBN 978-0-415-82254-1. [Google Scholar]
  11. Cessford, G.; Muhar, A. Monitoring options for visitor numbers in national parks and natural areas. J. Nat. Conserv. 2003, 11, 240–250. [Google Scholar] [CrossRef]
  12. D’Agata, R.; Gozzo, S.; Tomaselli, V. Network analysis approach to map tourism mobility. Qual. Quant. 2013, 47, 3167–3184. [Google Scholar] [CrossRef]
  13. Stimson, R. (Ed.) Handbook of Research Methods and Applications in Spatially Integrated Social Science; Edward Elgar Publishing: Cheltenham, UK, 2014; ISBN 978-0-85793-297-6. [Google Scholar]
  14. Arnberger, A.; Hinterberger, B. Visitor monitoring methods for managing public use pressures in the Danube Floodplains National Park, Austria. J. Nat. Conserv. 2003, 11, 260–267. [Google Scholar] [CrossRef]
  15. Shoval, N.; Isaacson, M. Tracking tourists in the digital age. Ann. Tour. Res. 2007, 34, 141–159. [Google Scholar] [CrossRef]
  16. Thimm, T.; Seepold, R. Past, present and future of tourist tracking. J. Tour. Future 2016, 2, 43–55. [Google Scholar] [CrossRef]
  17. Beeco, J.A.; Hallo, J.C.; Brownlee, M.T.J. GPS Visitor Tracking and Recreation Suitability Mapping: Tools for understanding and managing visitor use. Landsc. Urban Plan. 2014, 127, 136–145. [Google Scholar] [CrossRef]
  18. Meijles, E.W.; de Bakker, M.; Groote, P.D.; Barske, R. Analysing hiker movement patterns using GPS data: Implications for park management. Comput. Environ. Urban Syst. 2014, 47, 44–57. [Google Scholar] [CrossRef]
  19. D’Antonio, A.; Monz, C. The influence of visitor use levels on visitor spatial behavior in off-trail areas of dispersed recreation use. J. Environ. Manag. 2016, 170, 79–87. [Google Scholar] [CrossRef] [PubMed]
  20. Rupf, R.; Wyttenbach, M.; Köchli, D.; Hediger, M.; Lauber, S.; Ochsner, P.; Graf, R. Assessing the spatio-temporal pattern of winter sports activities to minimize disturbance in capercaillie habitats. J. Prot. Mt. Areas Res. 2011, 3, 23–32. [Google Scholar] [CrossRef]
  21. Orellana, D.; Wachowicz, M. Exploring patterns of movement suspension in pedestrian mobility. Geogr. Anal. 2011, 43, 241–260. [Google Scholar] [CrossRef] [PubMed]
  22. Beeco, J.A.; Brown, G. Integrating space, spatial tools, and spatial analysis into the human dimensions of parks and outdoor recreation. Appl. Geogr. 2013, 38, 76–85. [Google Scholar] [CrossRef]
  23. Taczanowska, K.; Muhar, A.; Brandenburg, C. Potential and limitations of GPS tracking for monitoring spatial and temporal aspects of visitor behaviour in recreational areas. In Proceedings of the Fourth International Conference on Monitoring and Management of Visitor Flows in Recreational and Protected Areas, Montecatini Terme, Italy, 14–19 October 2008; Raschi, A., Trampetti, S., Eds.; CNR-Ibimet: Firenze, Italy, 2008; pp. 451–456. [Google Scholar]
  24. TNP—Tatra National Park Tatra National Park. Available online: http://tpn.pl/poznaj (accessed on 1 November 2017 ).
  25. Bielański, M. Skitouring in Tatra National Park and Its Environmental Impacts. Ph.D. Thesis, University School of Physical Education, Cracow, Poland, 2013. [Google Scholar]
  26. TNP—Tatra National Park Decree Nr 3/2017 of the Tatra National Park Director from 23.02.2017 on Hiking, Bicycling and Skiing in the Area of the Tatra National Park. (Zarzadzenie nr 3/2017 Dyrektora Tatrzanskiego Parku Narodowego z dnia 23 lutego 2017 roku w sprawie ruchu pieszego, rowerowego oraz uprawiania narciarstwa na terenie Tatrzanskiego Parku Narodowego) 2017.
  27. Adamski, P.; Bielański, M. Analiza Danych Dotyczących Ruchu Wejściowego Narciarzy Skiturowych w Tatrzańskim Parku Narodowym, w Sezonach Zimowych 2013 Oraz 2013/2014 (Report); Tatra National Park: Zakopane, Poland, 2014; p. 23. [Google Scholar]
  28. MATLAB; Mathworks Inc.: Natick, MA, USA, 2012.
  29. Mrvar, A.; Batagelj, V. Analysis and visualization of large networks with program package Pajek. Complex Adapt. Syst. Model. 2016, 4, 6. [Google Scholar] [CrossRef]
  30. United States Geological Survey. United States Geological Survey SRTM Elevation Data 2017; United States Geological Survey: Reston, VA, USA.
  31. Batagelj, V.; Mrvar, A. Pajek—Analysis and Visualization of Large Networks. In Graph Drawing Software; Jünger, M., Ed.; Springer: Berlin, Germany, 2003; pp. 77–103. [Google Scholar]
  32. Wasserman, S.; Faust, K. Social Network Analysis: Methods and Applications; Cambridge University Press: Cambridge, UK, 1994; ISBN 978-1-139-78861-8. [Google Scholar]
  33. Taaffe, E.J.; Gauthier, H.L. Geography of Transportation; Prentice-Hall foundations of economic geography series; Prentice-Hall: Englewood Cliffs, NJ, USA, 1973; ISBN 0133513955. [Google Scholar]
  34. Olliff, T.; Legg, K.; Kaeding, B. Effects of Winter Recreation on Wildlife of the Greater Yellowstone Area: A Literature Review and Assessment; Report to the Greater Yellowstone Coordinating Committee; National Park Service: Yellowstone National Park, WY, USA, 1999; p. 315.
  35. Andrienko, N.; Andrienko, G. Visual analytics of movement: An overview of methods, tools and procedures. Inf. Vis. 2013, 12, 3–24. [Google Scholar] [CrossRef]
  36. Andrienko, N.; Andrienko, G. V-Analytics. Available online: http://geoanalytics.net/V-Analytics/ (accessed on 9 December 2017).
  37. Burian, J.; Zajickova, L.; Popelka, S.; Rypka, M. Spatial Aspects of Movement of Olomuc and Ostrava Citizens. In SGEM2016 Conference Proceedings; 2016; Volume III, pp. 439–446. [Google Scholar]
  38. Fischer, M. GIS and Network Analysis. In Spatial Analysis and GeoComputation; Springer: Berlin/Heidelberg, Germany, 2006; pp. 43–60. ISBN 978-3-540-35729-2. [Google Scholar]
  39. Taczanowska, K.; González, L.-M.; Garcia-Massó, X.; Muhar, A.; Brandenburg, C.; Toca-Herrera, J.-L. Evaluating the structure and use of hiking trails in recreational areas using a mixed GPS tracking and graph theory approach. Appl. Geogr. 2014, 55, 184–192. [Google Scholar] [CrossRef]
  40. Kolodziejczyk, K. Hiking Trails for Tourists in the “Chelmy” Landscape Park—Assessment of Their Route and Infrastructure Development. Pol. J. Sport Tour. 2011, 18, 324–329. [Google Scholar] [CrossRef]
  41. Styperek, J. Tourist hiking trails in Polish National Parks. Turyzm 2001, 11, 25–37. (In Polish) [Google Scholar]
  42. Li, W.; Ge, X.; Liu, C. Hiking trails and tourism impact assessment in protected area: Jiuzhaigou Biosphere Reserve, China. Environ. Monit. Assess. 2005, 108, 279–293. [Google Scholar] [CrossRef] [PubMed]
  43. Derezińska, M. Pochwala skialpinizmu, czyli o filozofii zacisnietych zebow. In Tatry; Tatra National Park: Zakopane, Poland, 2007; p. 30. (In Polish) [Google Scholar]
  44. Sejm of the Republic of Poland. Nature Conservation Act (Ustawa z dnia 16 Kwietnia 2004 r. o Ochronie Przyrody); Sejm of the Republic of Poland: Warsaw, Poland, 2004.
  45. Hofmann-Wellenhof, B.; Lichtenegger, H.; Collins, J. Global Positioning System—Theory and Practice; Springer: New York, NY, USA, 2001; ISBN 978-3-7091-6199-9. [Google Scholar]
  46. Shoval, N. Tracking technologies and urban analysis. Cities 2008, 25, 21–28. [Google Scholar] [CrossRef]
  47. Korpilo, S.; Virtanen, T.; Lehvävirta, S. Smartphone GPS tracking—Inexpensive and efficient data collection on recreational movement. Landsc. Urban Plan. 2017, 157, 608–617. [Google Scholar] [CrossRef]
  48. Luke, D.A. A User’s Guide to Network Analysis in R, 1st ed.; Springer: New York, NY, USA, 2016; ISBN 978-3-319-23882-1. [Google Scholar]
  49. Fall, A.; Fortin, M.-J.; Manseau, M.; O’Brien, D. Spatial graphs: Principles and applications for habitat connectivity. Ecosystems 2007, 10, 448–461. [Google Scholar] [CrossRef]
  50. Sterl, P.; Eder, R.; Arnberger, A. Exploring factors in influencing the attitude of on-site ski mountaineers towards the ski touring management measures of the Gesäuse National Park. J. Prot. Mt. Areas Res. 2006, 2/1, 31–38. [Google Scholar] [CrossRef]
  51. Zeidenitz, C.; Mosier, H.J.; Hunziker, M. Outdoor recreation: From analysing motivations to furthering ecologically responsible behaviour. For. Snow Landsc. Res. 2007, 81, 175–190. [Google Scholar]
Figure 1. Characteristics of the study area: designated backcountry skiing zones within the border of Tatra National Park (TNP), Poland.
Symmetry 09 00317 g001
Figure 2. Translation of the designated backcountry skiing areas system into a structural network (undirected graph). The geographic coordinates (longitude and latitude) were defined in WGS84 spatial reference system and are expressed in decimal degrees.
Symmetry 09 00317 g002
Figure 3. Three-dimensional visualization of the structural skiing network (undirected graph). The geographic coordinates (longitude and latitude) were defined in WGS84 spatial reference system and are expressed in decimal degrees. Altitude is expressed in meters above sea level (m.a.s.l.). The elevation data was used only for visualization purposes.
Symmetry 09 00317 g003
Figure 4. Example of a skiing route. (a) Recorded GPS track of a TNP visitor; (b) representation of the corresponding directed graph G = (V,E) where the vertices are V = {44,…,66} and the edges are E = {(50, 49), (49, 51), (51, 59), (59,62), (62, 61), (61, 66), (66, 61), (61,54), (54, 53), (53, 58), (58, 60), (60, 54), (54, 48), (48, 44), (44, 45), (45, 49), (49, 50)}. In the final graph the loop, (66, 66) was deleted, since a property of directed graphs is vi ≠ vj.
Symmetry 09 00317 g004
Figure 5. Structural network (undirected graph) depicting the designated backcountry skiing system in TNP. The network is composed of 93 nodes and 133 links.
Symmetry 09 00317 g005
Figure 6. Functional network (directed graph) of the designated backcountry skiing system; graph based on the recorded visitors’ trip itineraries. Arrows indicate movement direction; color scale (grey scale) illustrates the intensity of skiing traffic. A darker color means higher use intensity.
Symmetry 09 00317 g006
Figure 7. Node centrality measures in the structural (a) and functional networks (b) of designated backcountry skiing zones in TNP.
Symmetry 09 00317 g007
Table 1. Overview of node centrality measures used in the study.
Centrality MeasureDescriptionMathematical Equation
Input degreeNumber of edges entering to vertex i. d i + =   j G x i j
x i j signal the position between node i and node j.
Output degreeNumber of edges leaving vertex i. d i =   j G x i j
Degree (all)Total number of edges connected to the vertex i. D i = d + + d
ClosenessInverse sum of distances from a given vertex to all other vertices in the graph. C i = j   i G ( d ( i , j ) ) 1
where d ( i , j ) is a topological distance between vertices i   and   j .
BetweennessA number of times a vertex is crossed by shortest paths in the graph. B ( i ) = j   <   k g j k ( i ) / g j k
where g j k is the number of geodesics connecting jk, and g j k ( i ) is the number that geodesics i is on.
Proximity prestigeExpresses the influence domain of a vertex by the average distance from all vertices in the influence domain. Pp value of 0 indicates that node i is unreachable; whereas Pp = 1 if all nodes are directly connected to node i. P p i = I i g 1 j   i G ( d ( i , j ) / I i ) 1
Equations based on References [10,32].
Table 2. Structural network node centrality measures of the 10 nodes with the highest “all degree” values.
Node NumberDegreeClosenessBetweenness
7960.140.14
2450.150.08
4850.180.43
6150.170.30
6950.140.02
1640.110.12
1840.120.17
2740.150.09
4440.170.09
4540.150.14
Table 3. Functional network node centrality and prestige measures of the 10 nodes with the highest “weighted all degree” values.
Node NumberWeighted Input DegreeWeighted Output DegreeWeighted All DegreeClosenessBetweennessProximity Prestige
453505328820.190.080.19
493511495000.200.130.20
481971943910.190.060.19
441521493010.180.010.17
61109901990.170.100.17
62931001930.150.050.15
4186841700.170.040.17
5482881700.170.060.17
779781570.120.070.12
5156831390.170.020.17

