
Matching Visual and Acoustic Mirror Forms


Abstract
:1. Introduction
2. Materials and Methods
2.1. Participants
2.2. Procedure
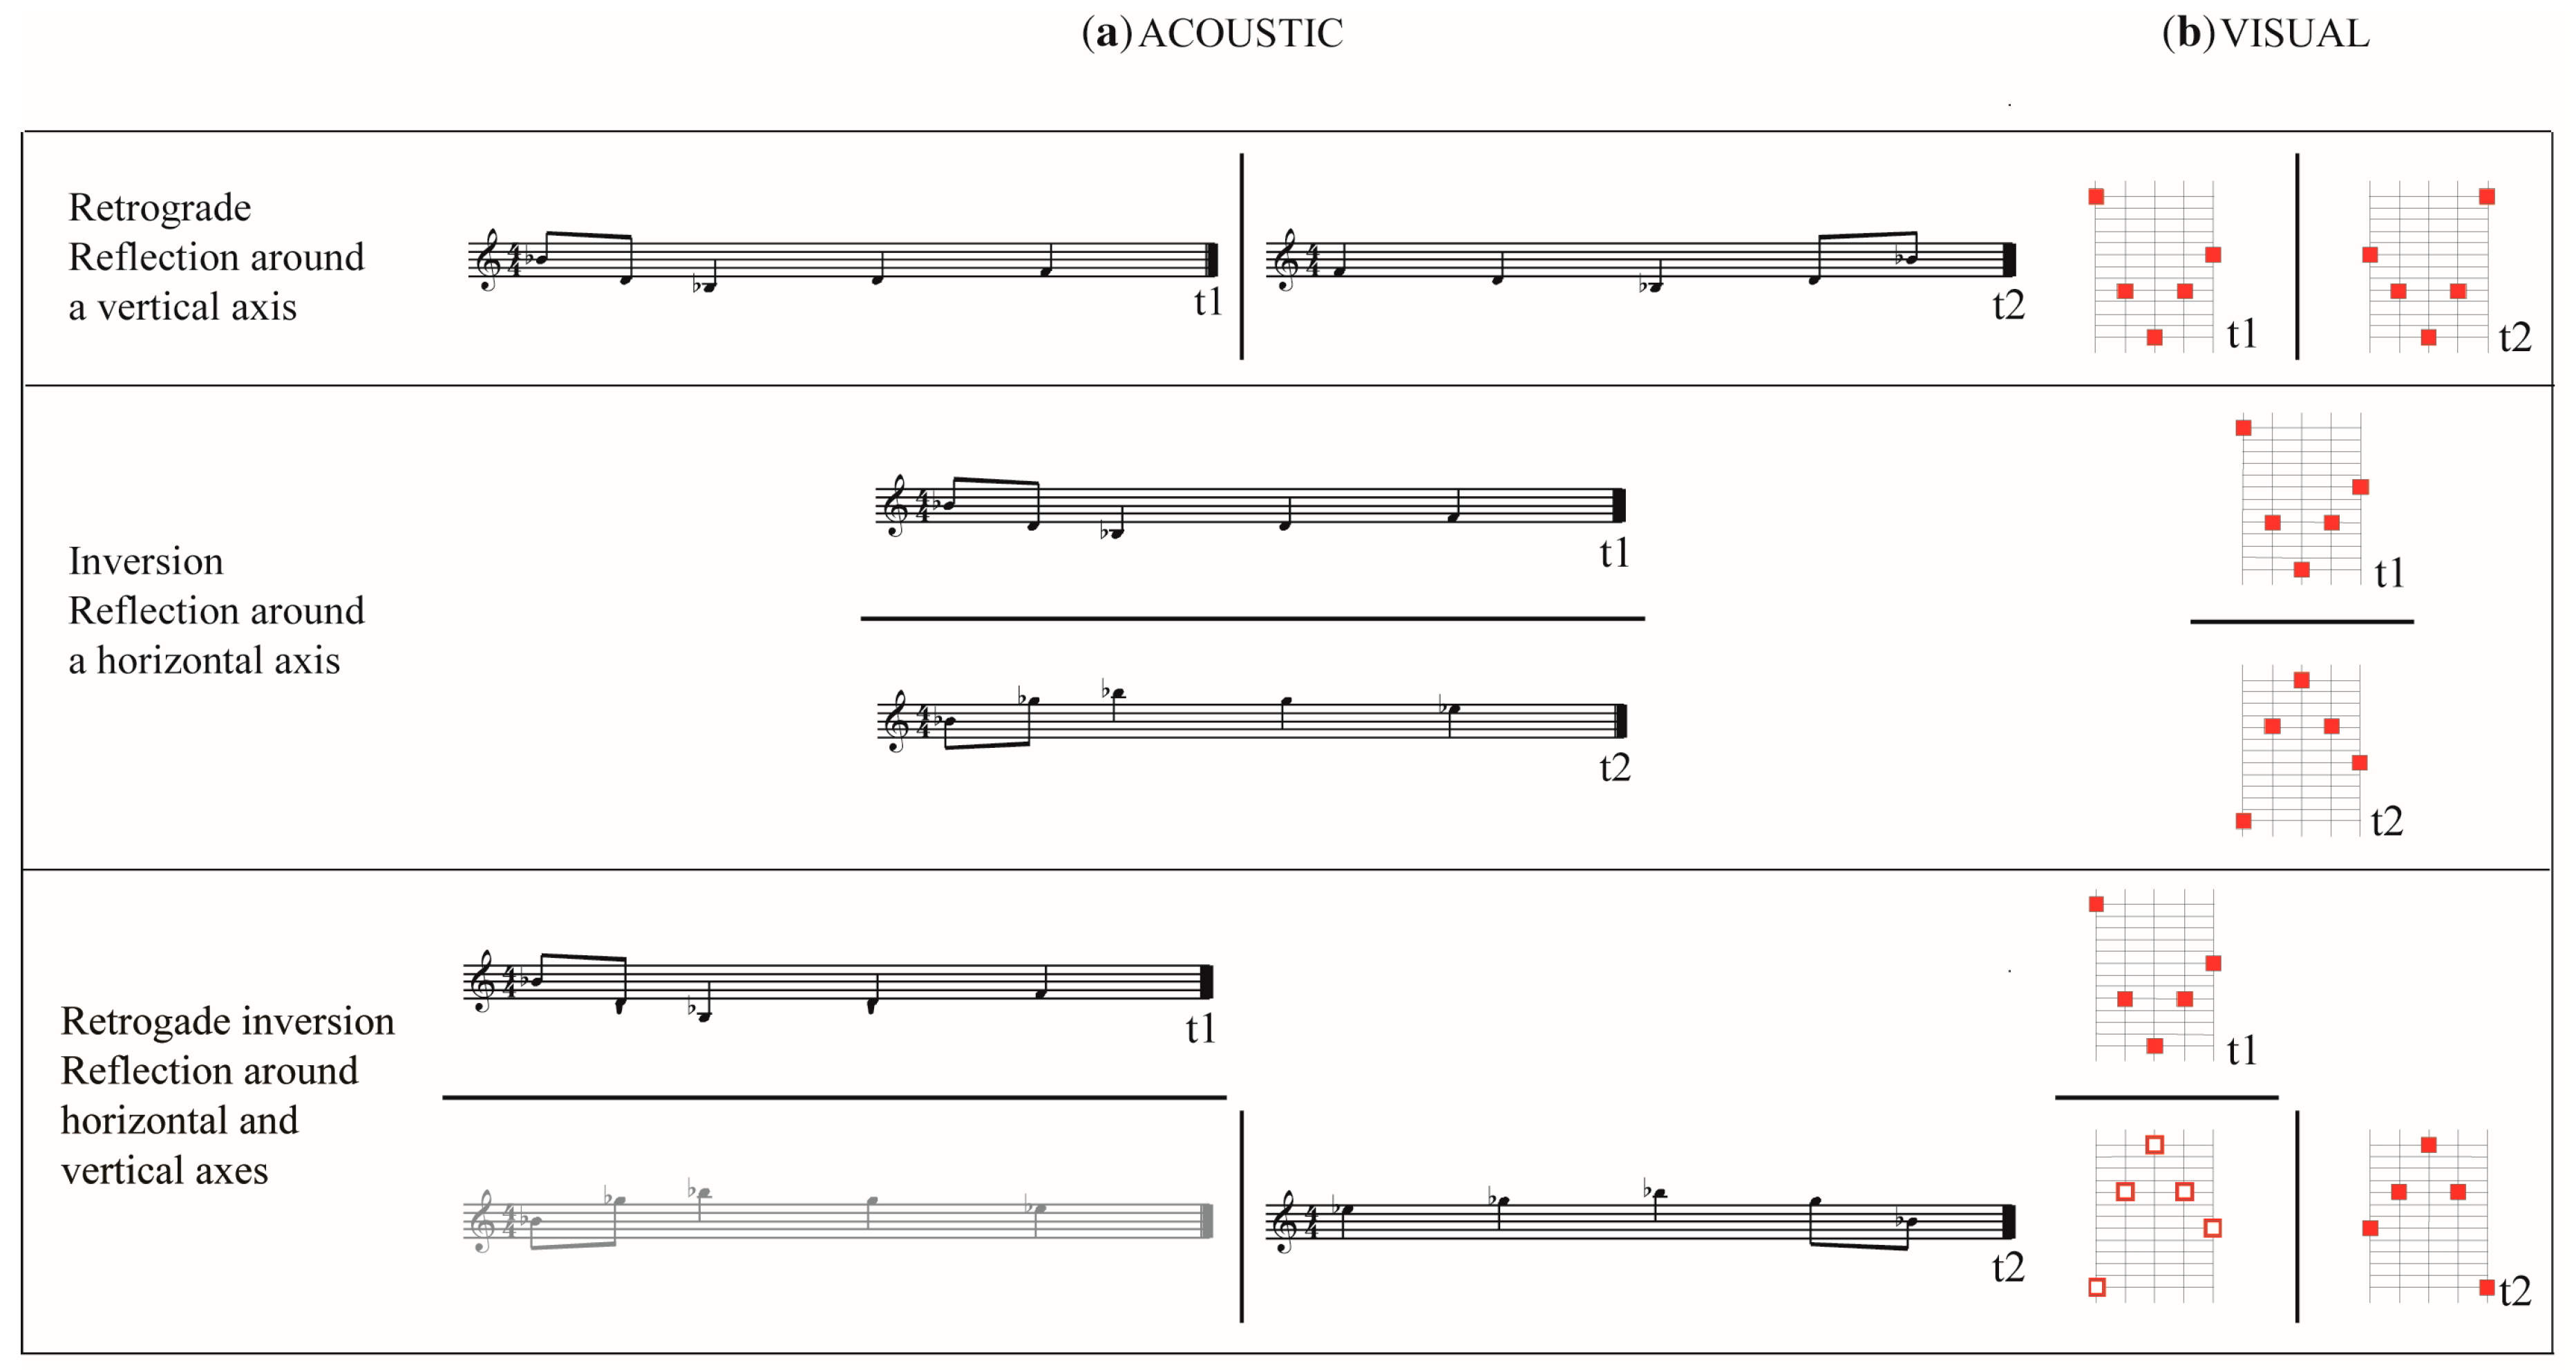
2.3. Stimuli
- (i)
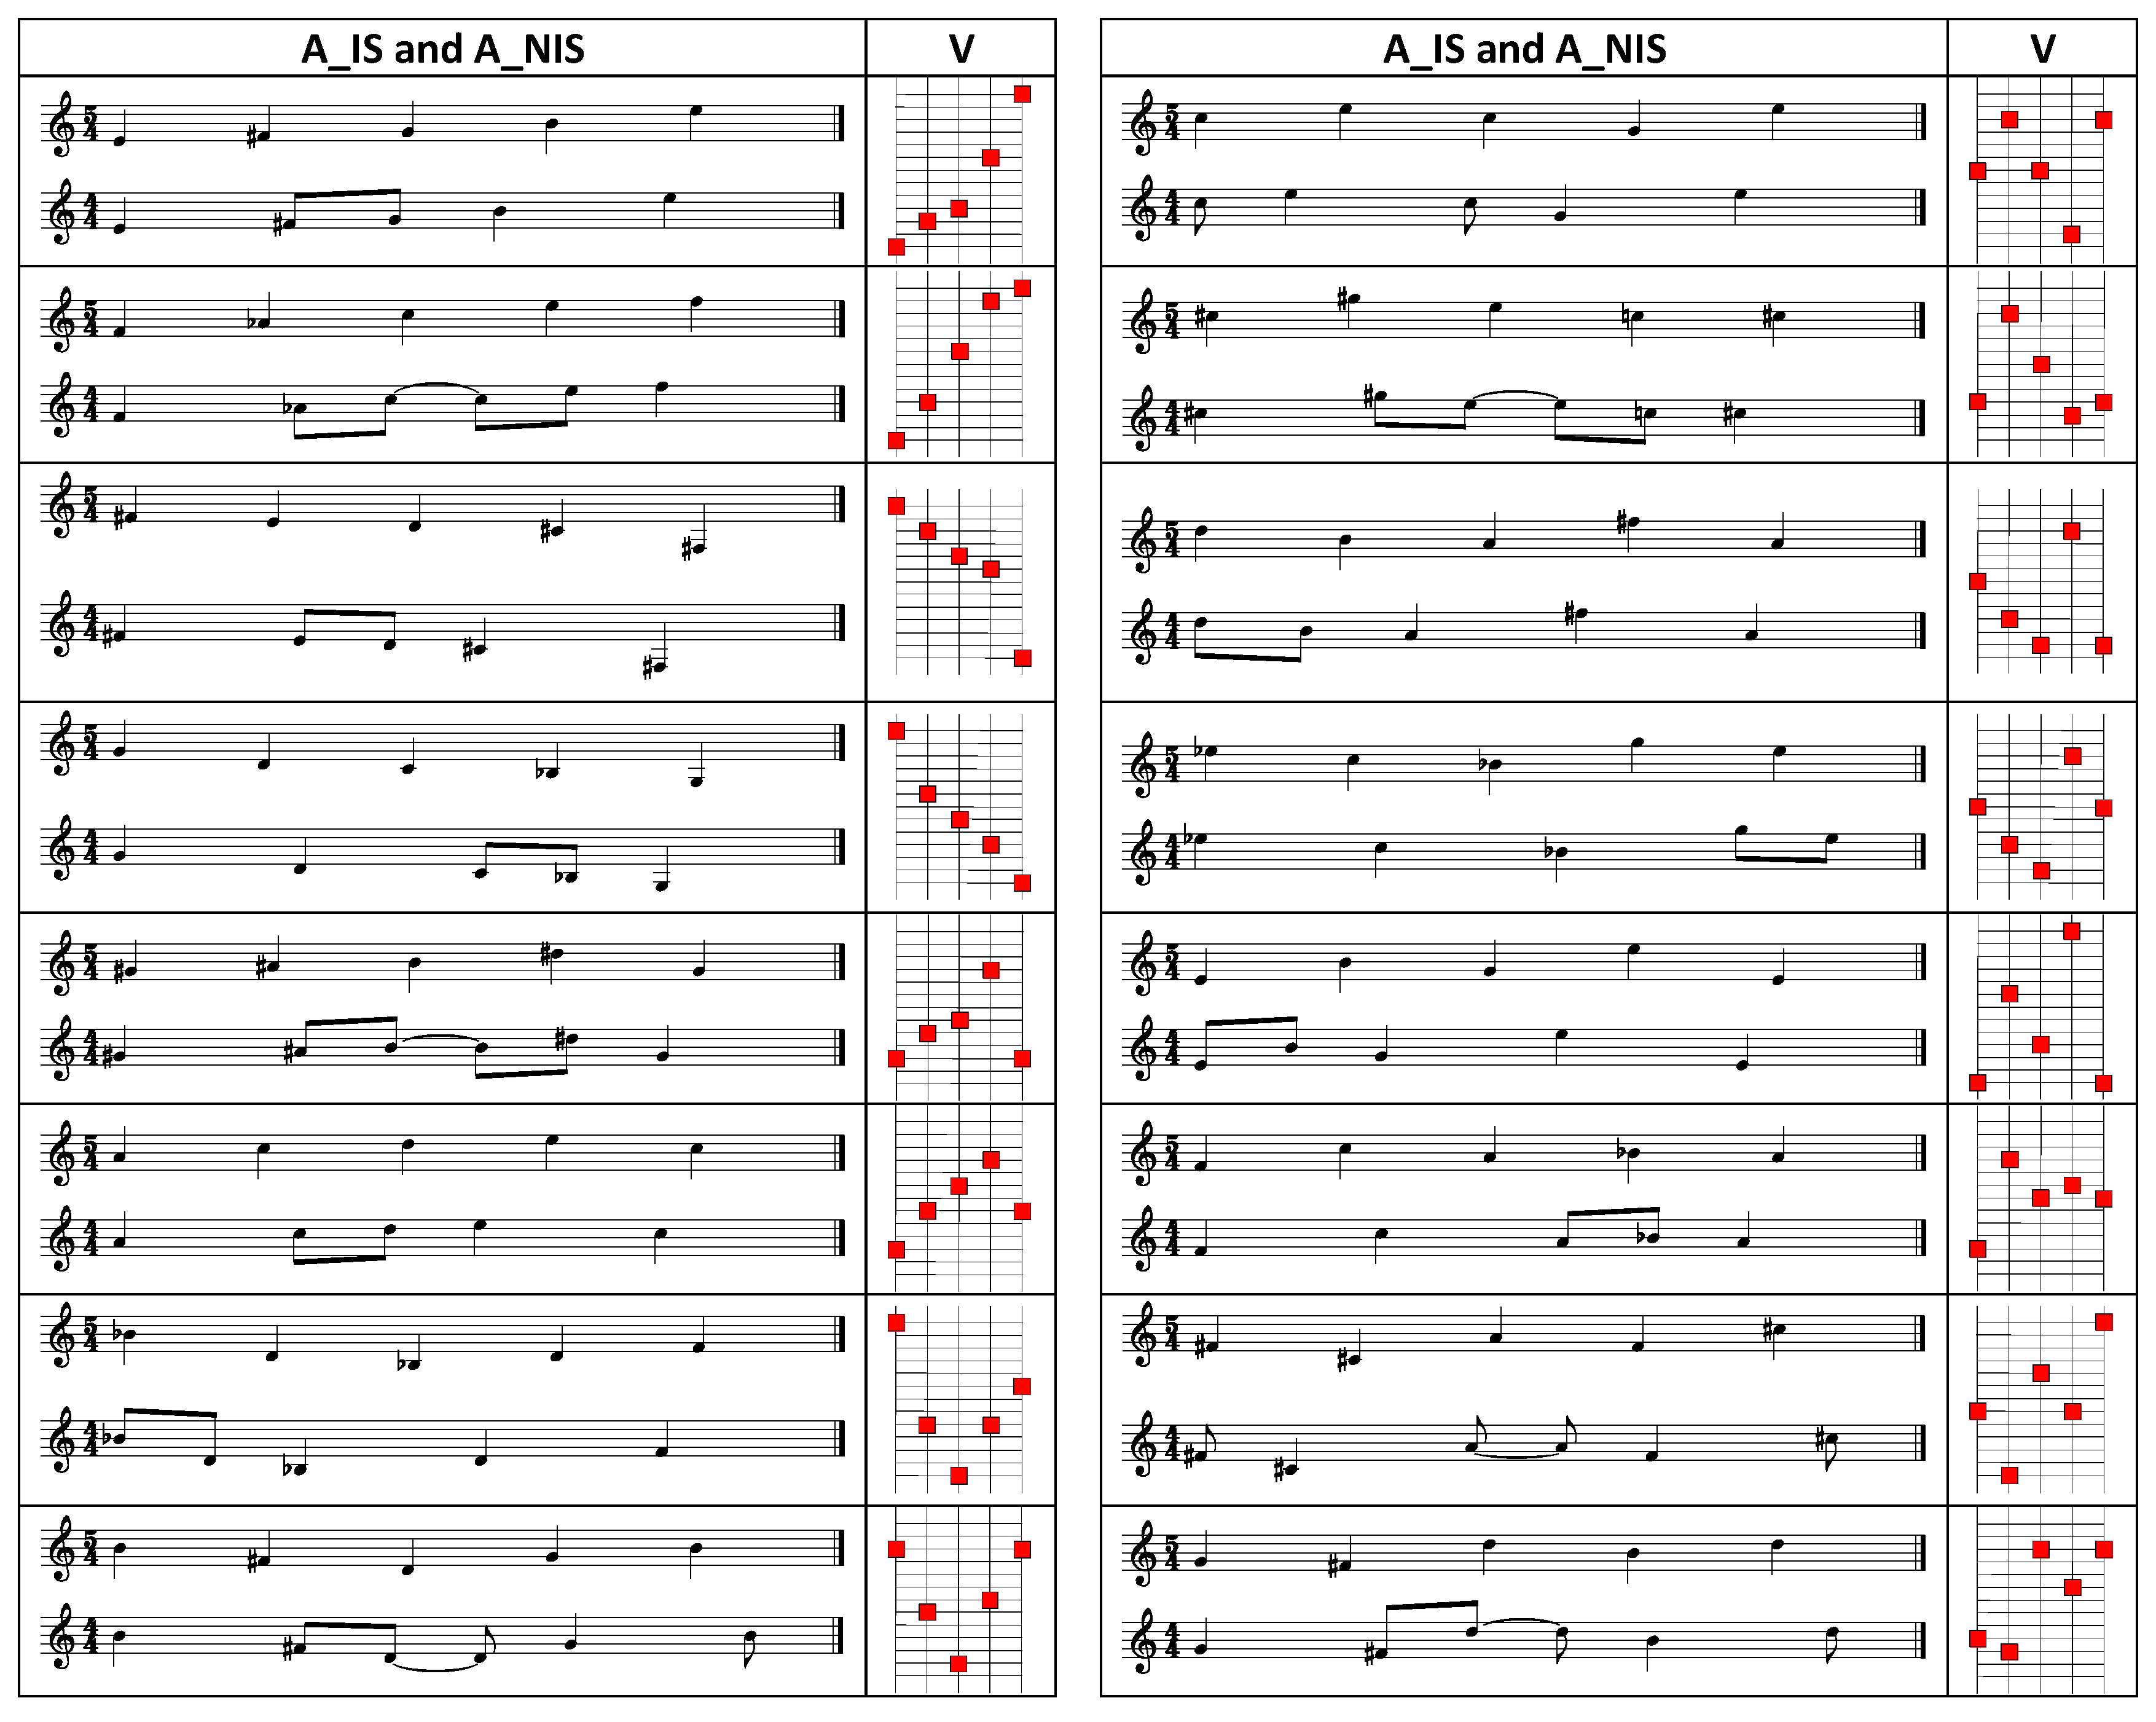
- Sense modality: acoustic (A), visual (V). The stimuli consisted of a short sequence of five tones in the acoustic task and of five square dots appearing in sequence in the visual task. The latter “corresponded” to a visual representation of the acoustic stimuli (see Appendix A).
- (ii)
- Mirror Form: inversion (INV), retrograde (RET), retrograde inversion (RETINV). Three comparison stimuli were obtained for each standard stimulus by means of applying one of the three mirror form transformations: inversion, retrograde or retrograde inversion.
- (iii)
- Rhythm: isochronous (ISO), non-isochronous (N-ISO). The stimuli presented in the isochronous condition were the same as those presented in the non-isochronous condition in terms of the shape of the configuration. What varied was the duration of each of the five tones (A) or dots (V) in the configuration. The duration was fixed at 600 ms in the isochronous condition while in the non-isochronous condition, three elements had a duration of 800 ms (half-notes) and two elements had a duration of 400 ms (quarter-notes). In the non-isochronism condition a grouping effect emerged which meant that the participants perceived a kind of “rhythm” in the succession of the tones or dots. The overall duration of the stimulus (3–3.2 s) made the condition comparable to Dowling’s best performance condition (2.5 s).
- (iv)
- Contour. The shape of the contour was determined by the number of inversion points, as in [30,31], i.e., the points where increments in pitch height (for the acoustic stimuli) or spatial height (for the visual stimuli) are followed by a decrement; or, vice versa, decrements in pitch height (for the acoustic stimuli) or spatial height (for the visual stimuli) are followed by an increment. Given that each stimulus was formed of five notes (or dots), the maximum number of points where there could be an inversion was three, giving a maximum of 14 different possible contours (see Table 1). In order to contain the levels of this variable, we selected only eight out of the 14 contours (those which are not in parentheses in Table 1). The eight types of contour used in the experiment thus contained 0, 1, 2 or 3 inversion points. In the statistical analyses, contour was a random effect.
- (v)
- Final interval: long or short. In [31], the length of the final interval impacted on the participants’ ability to recognize the acoustic mirror forms. Despite the fact that in their experiment the stimuli used were different to those used in the present study as they were longer and characterized by wider octave extensions and a greater tonal and temporal complexity, a decision was made to take this variable into account in the creation of the stimuli with the result that there were two versions of the final interval for each of the eight contours: long (L), i.e., between seven and twelve semitones, and short (S), i.e., less than four semitones. This variable was considered as a random effect in our statistical analyses.
2.4. Statistics and Data Analysis
3. Results
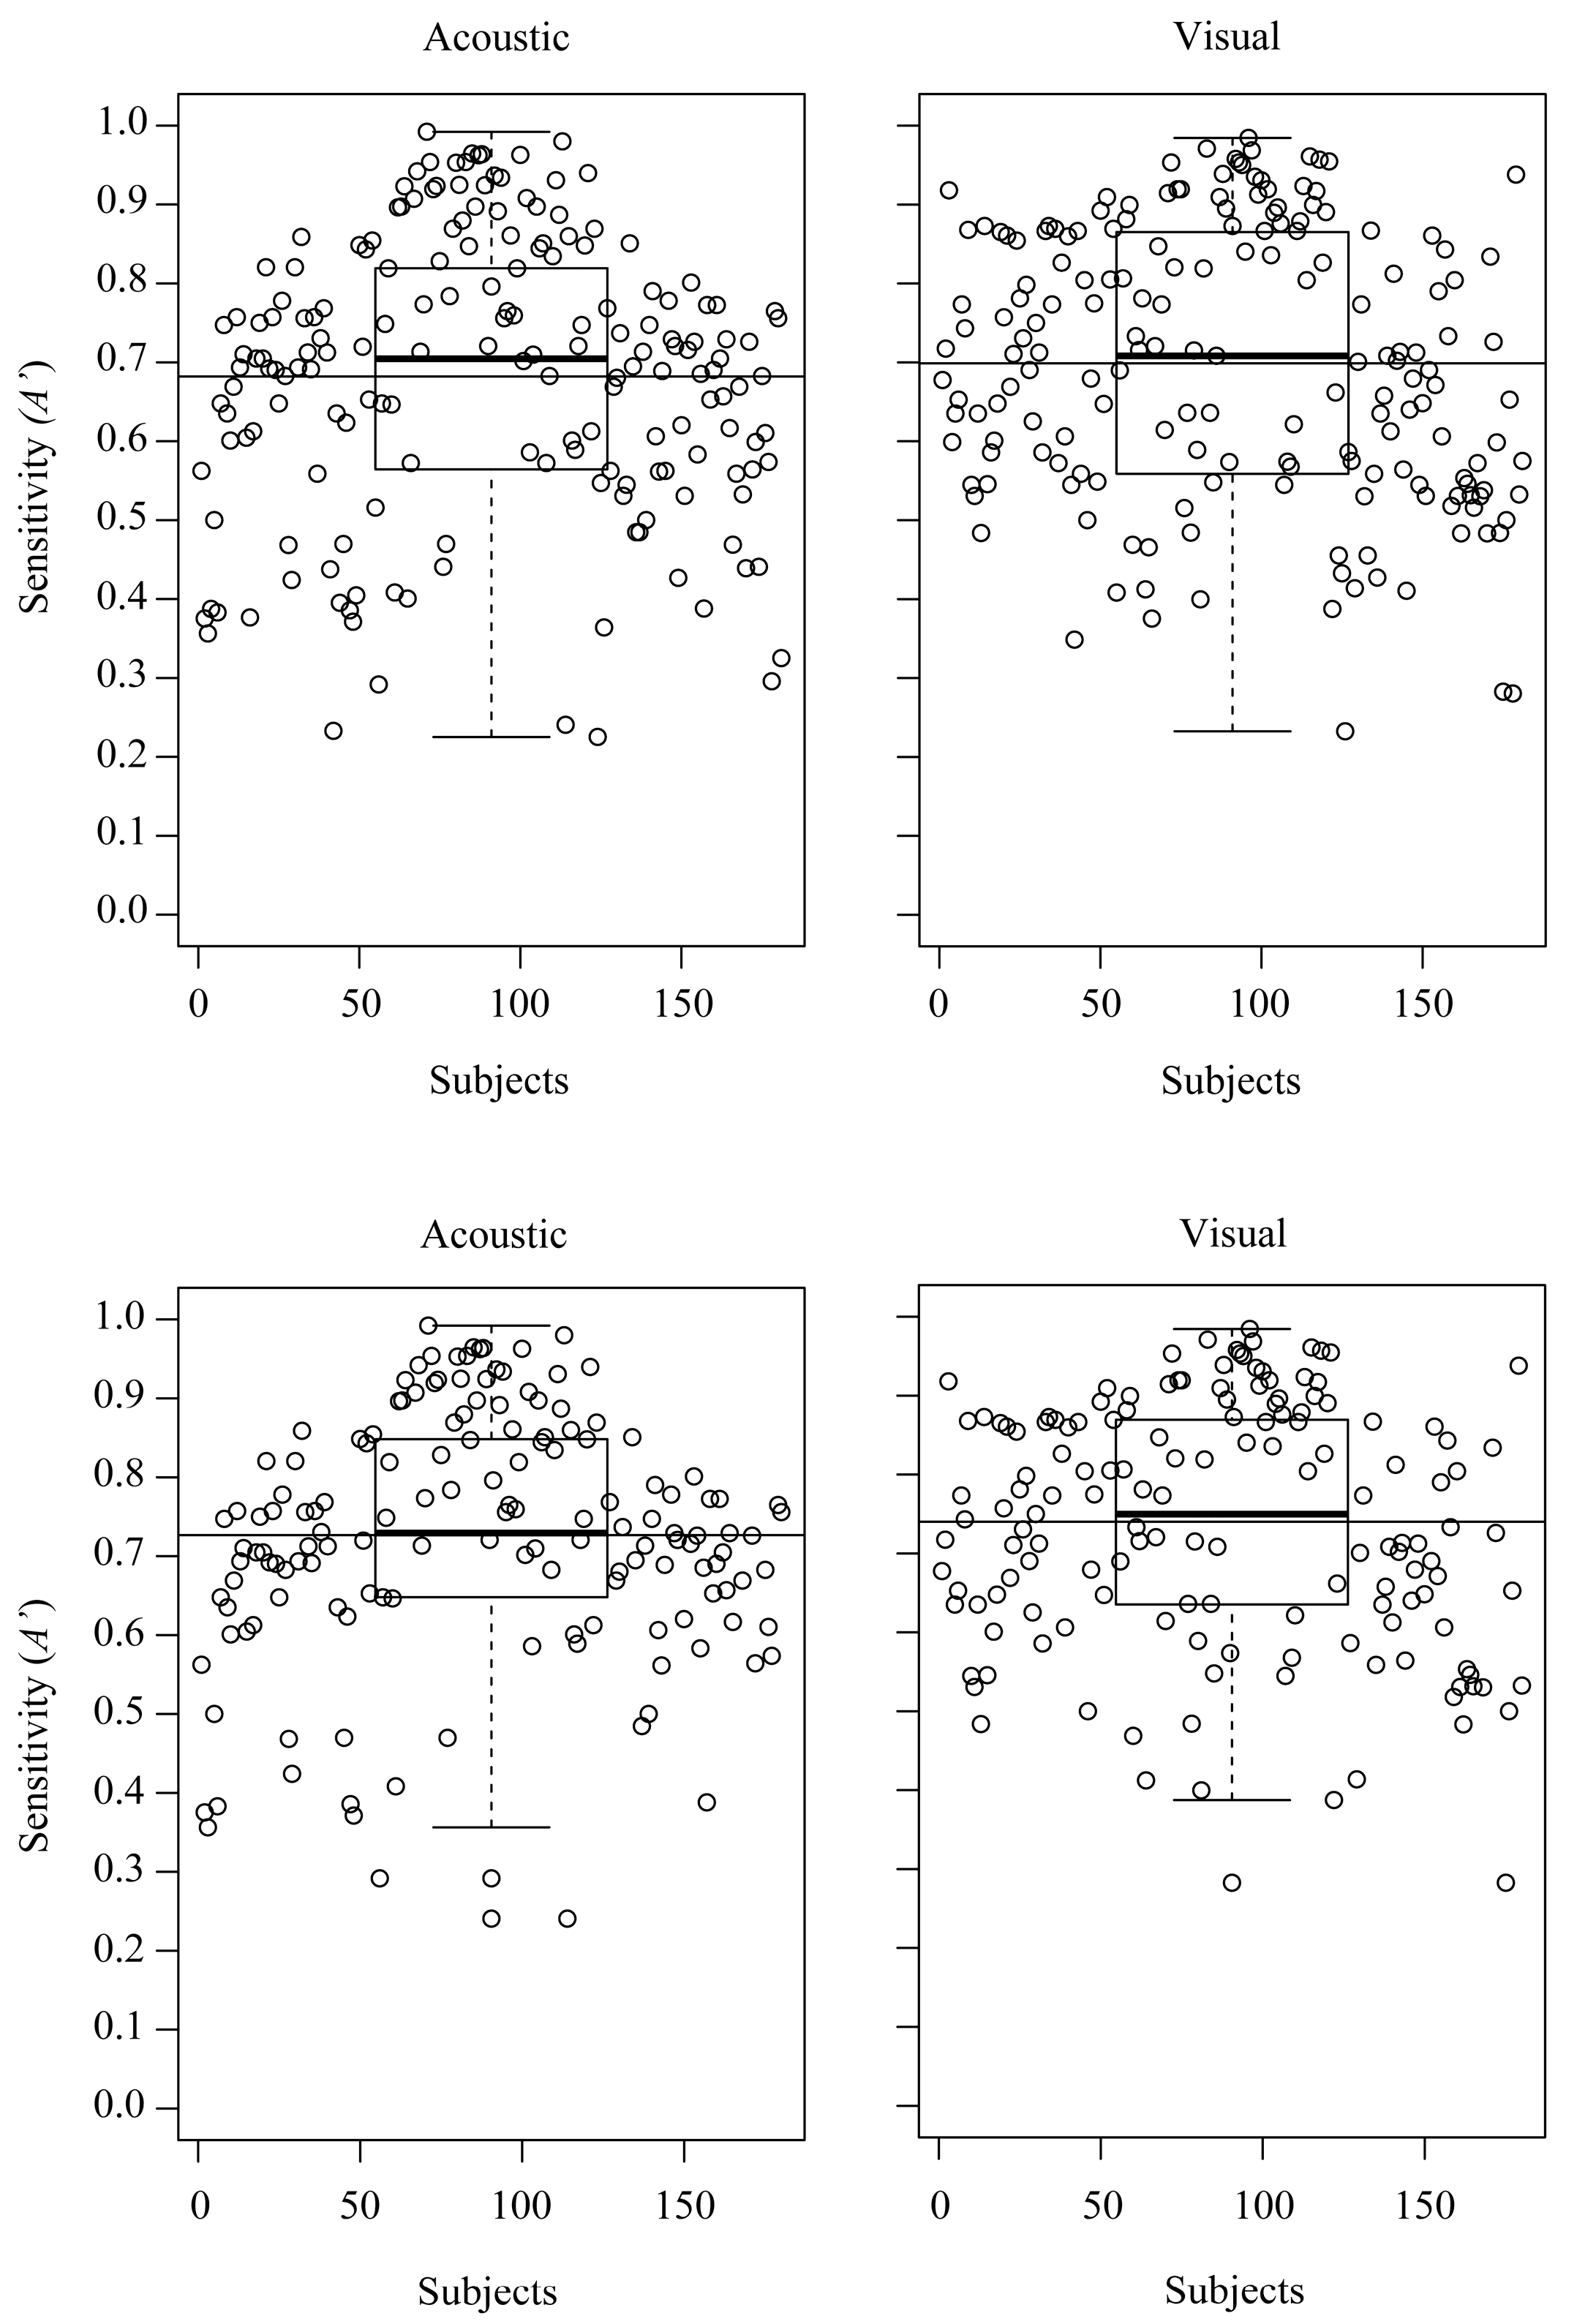
3.1. Ease of Recognition
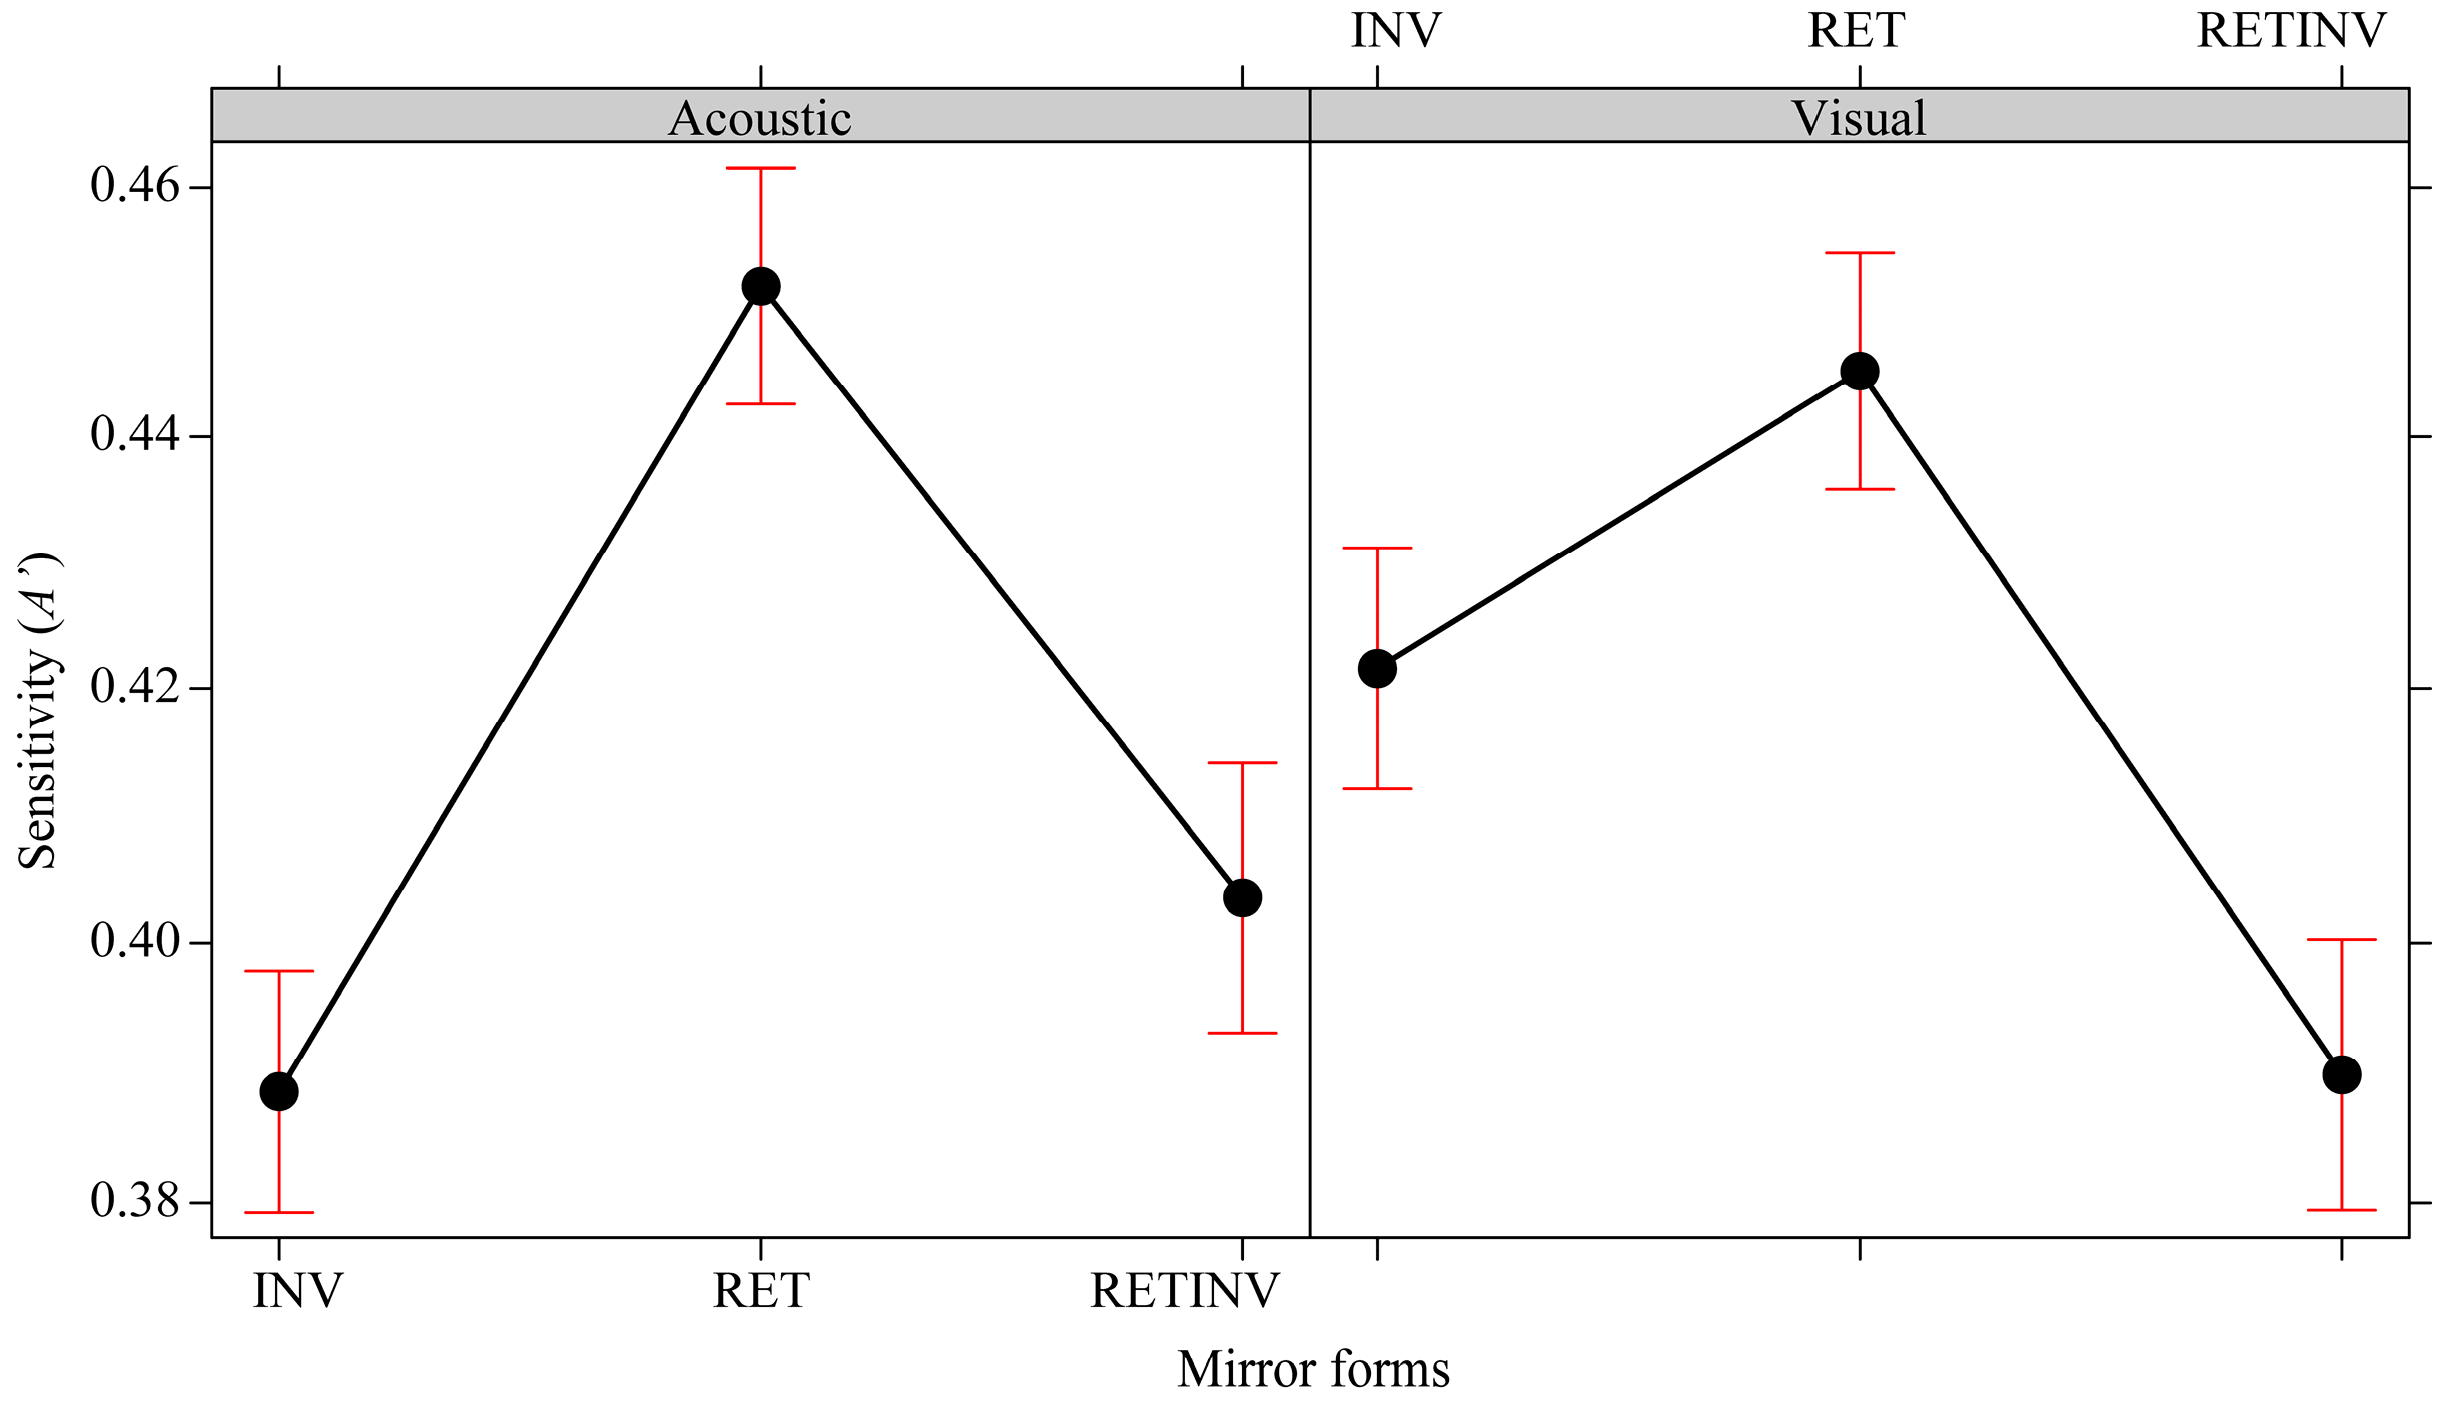
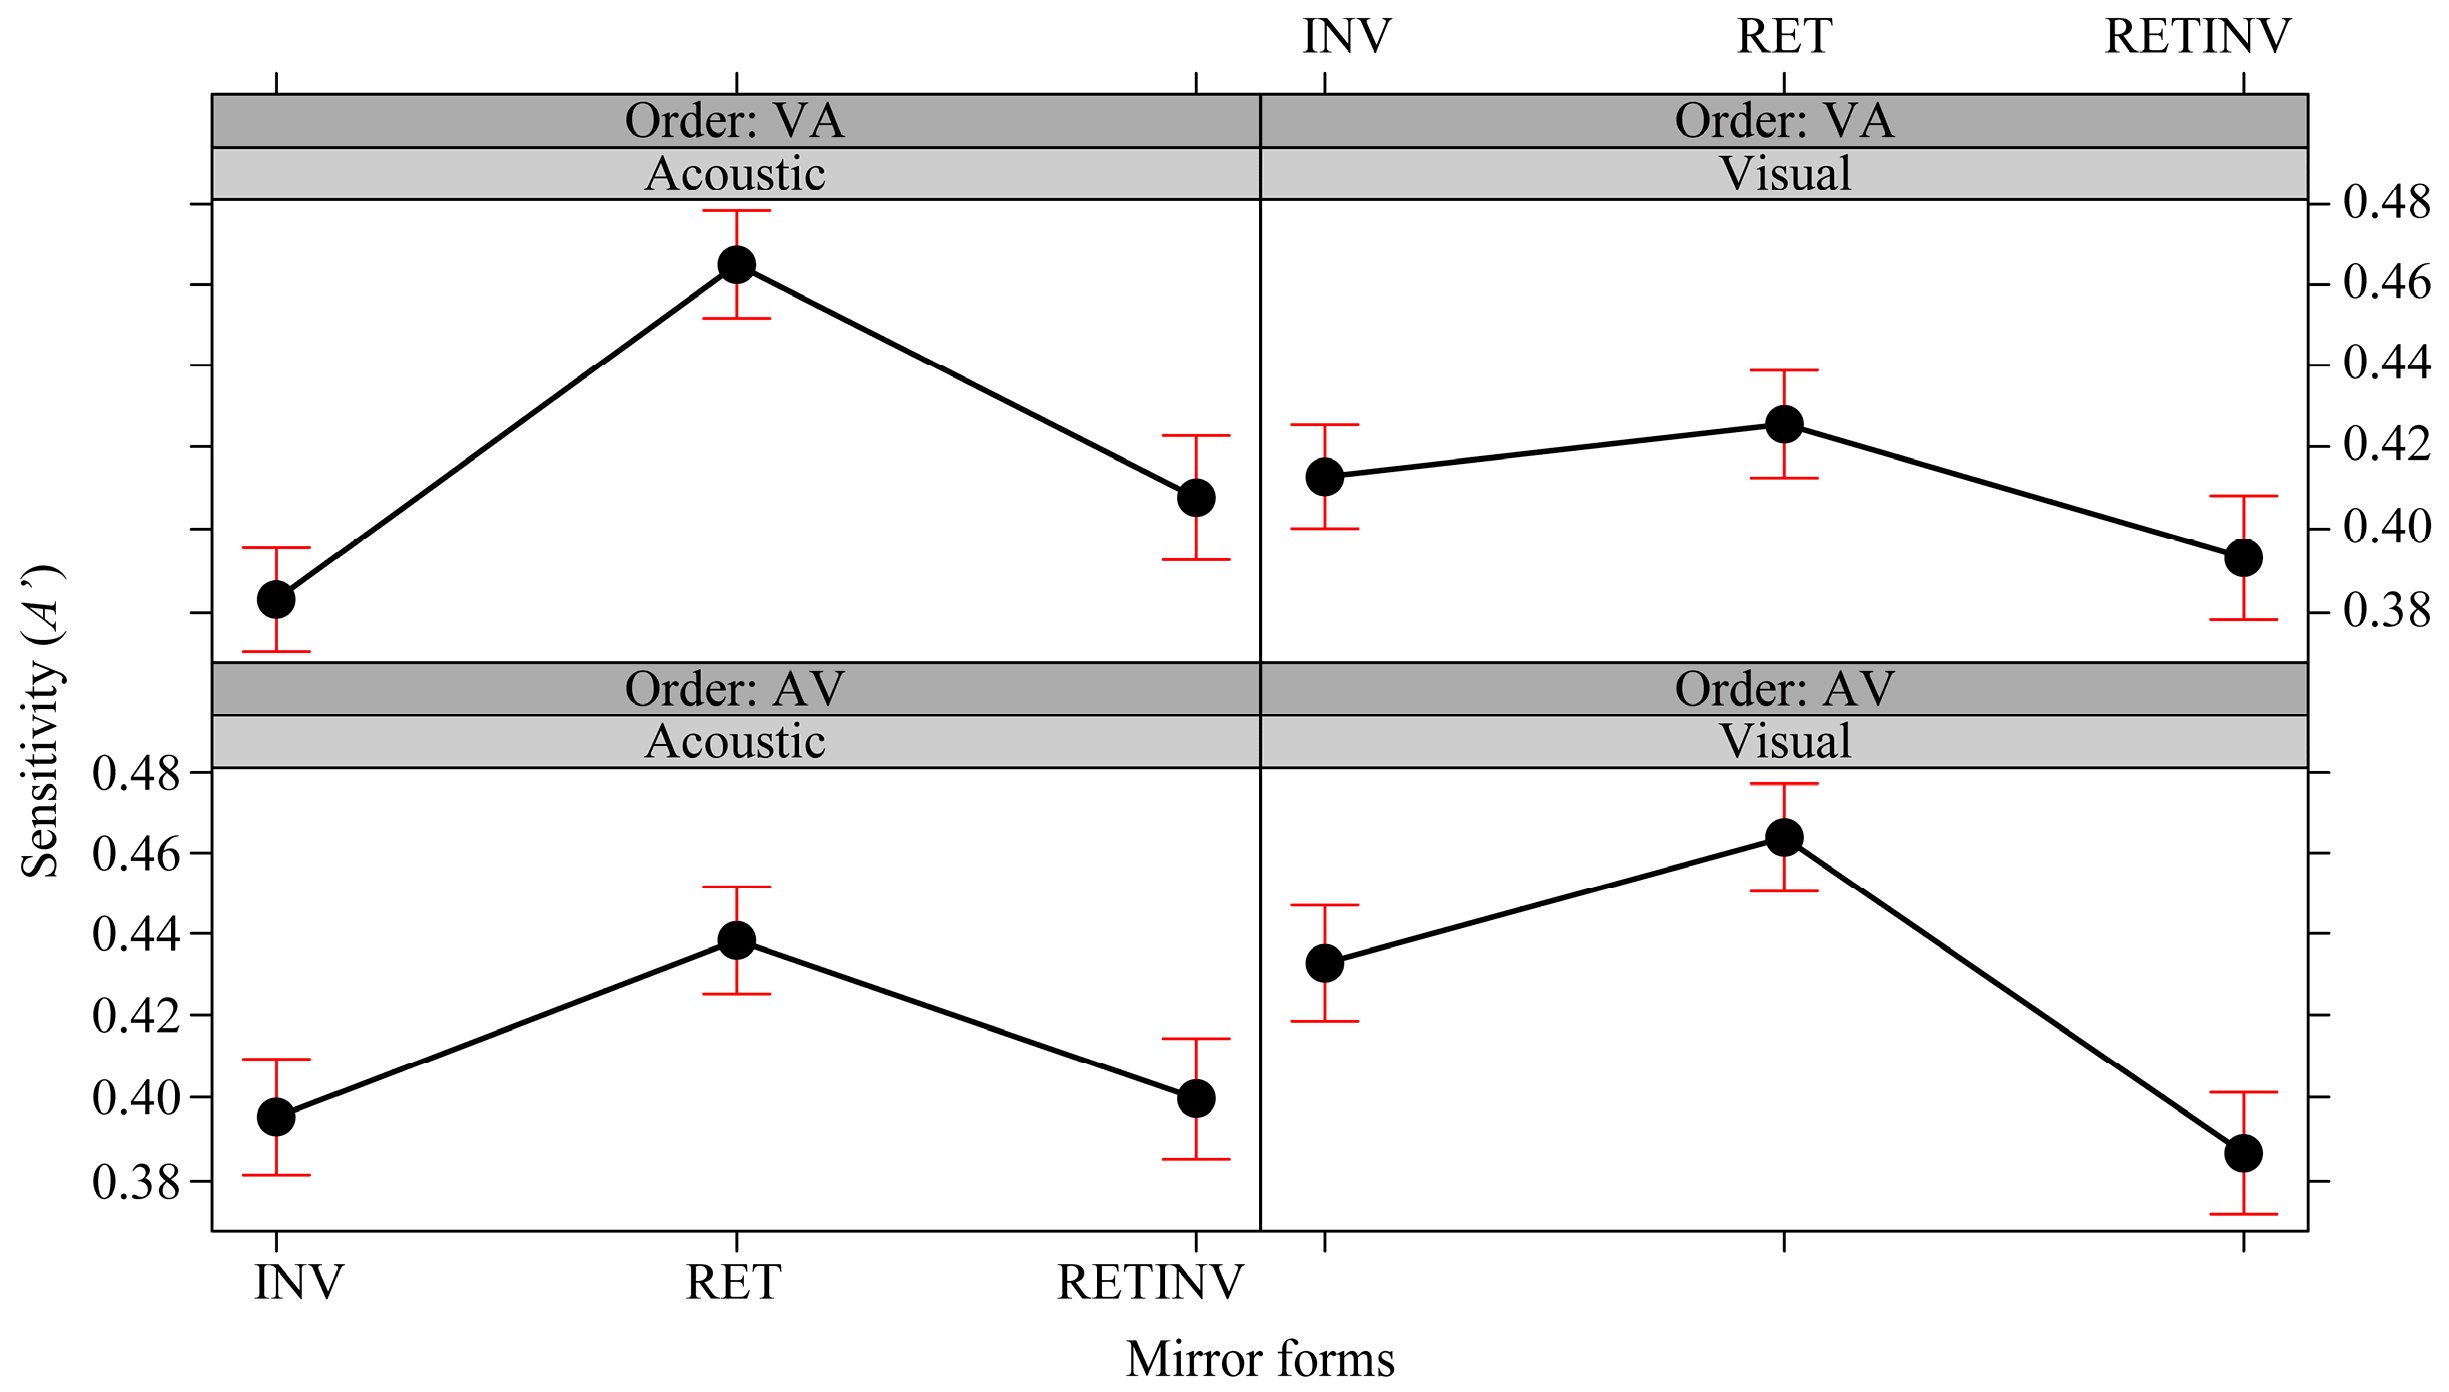
3.2. Ease of Recognition of the Three Mirror Forms in the Two Sense Modalities
3.3. Cross Modality Facilitation Effects
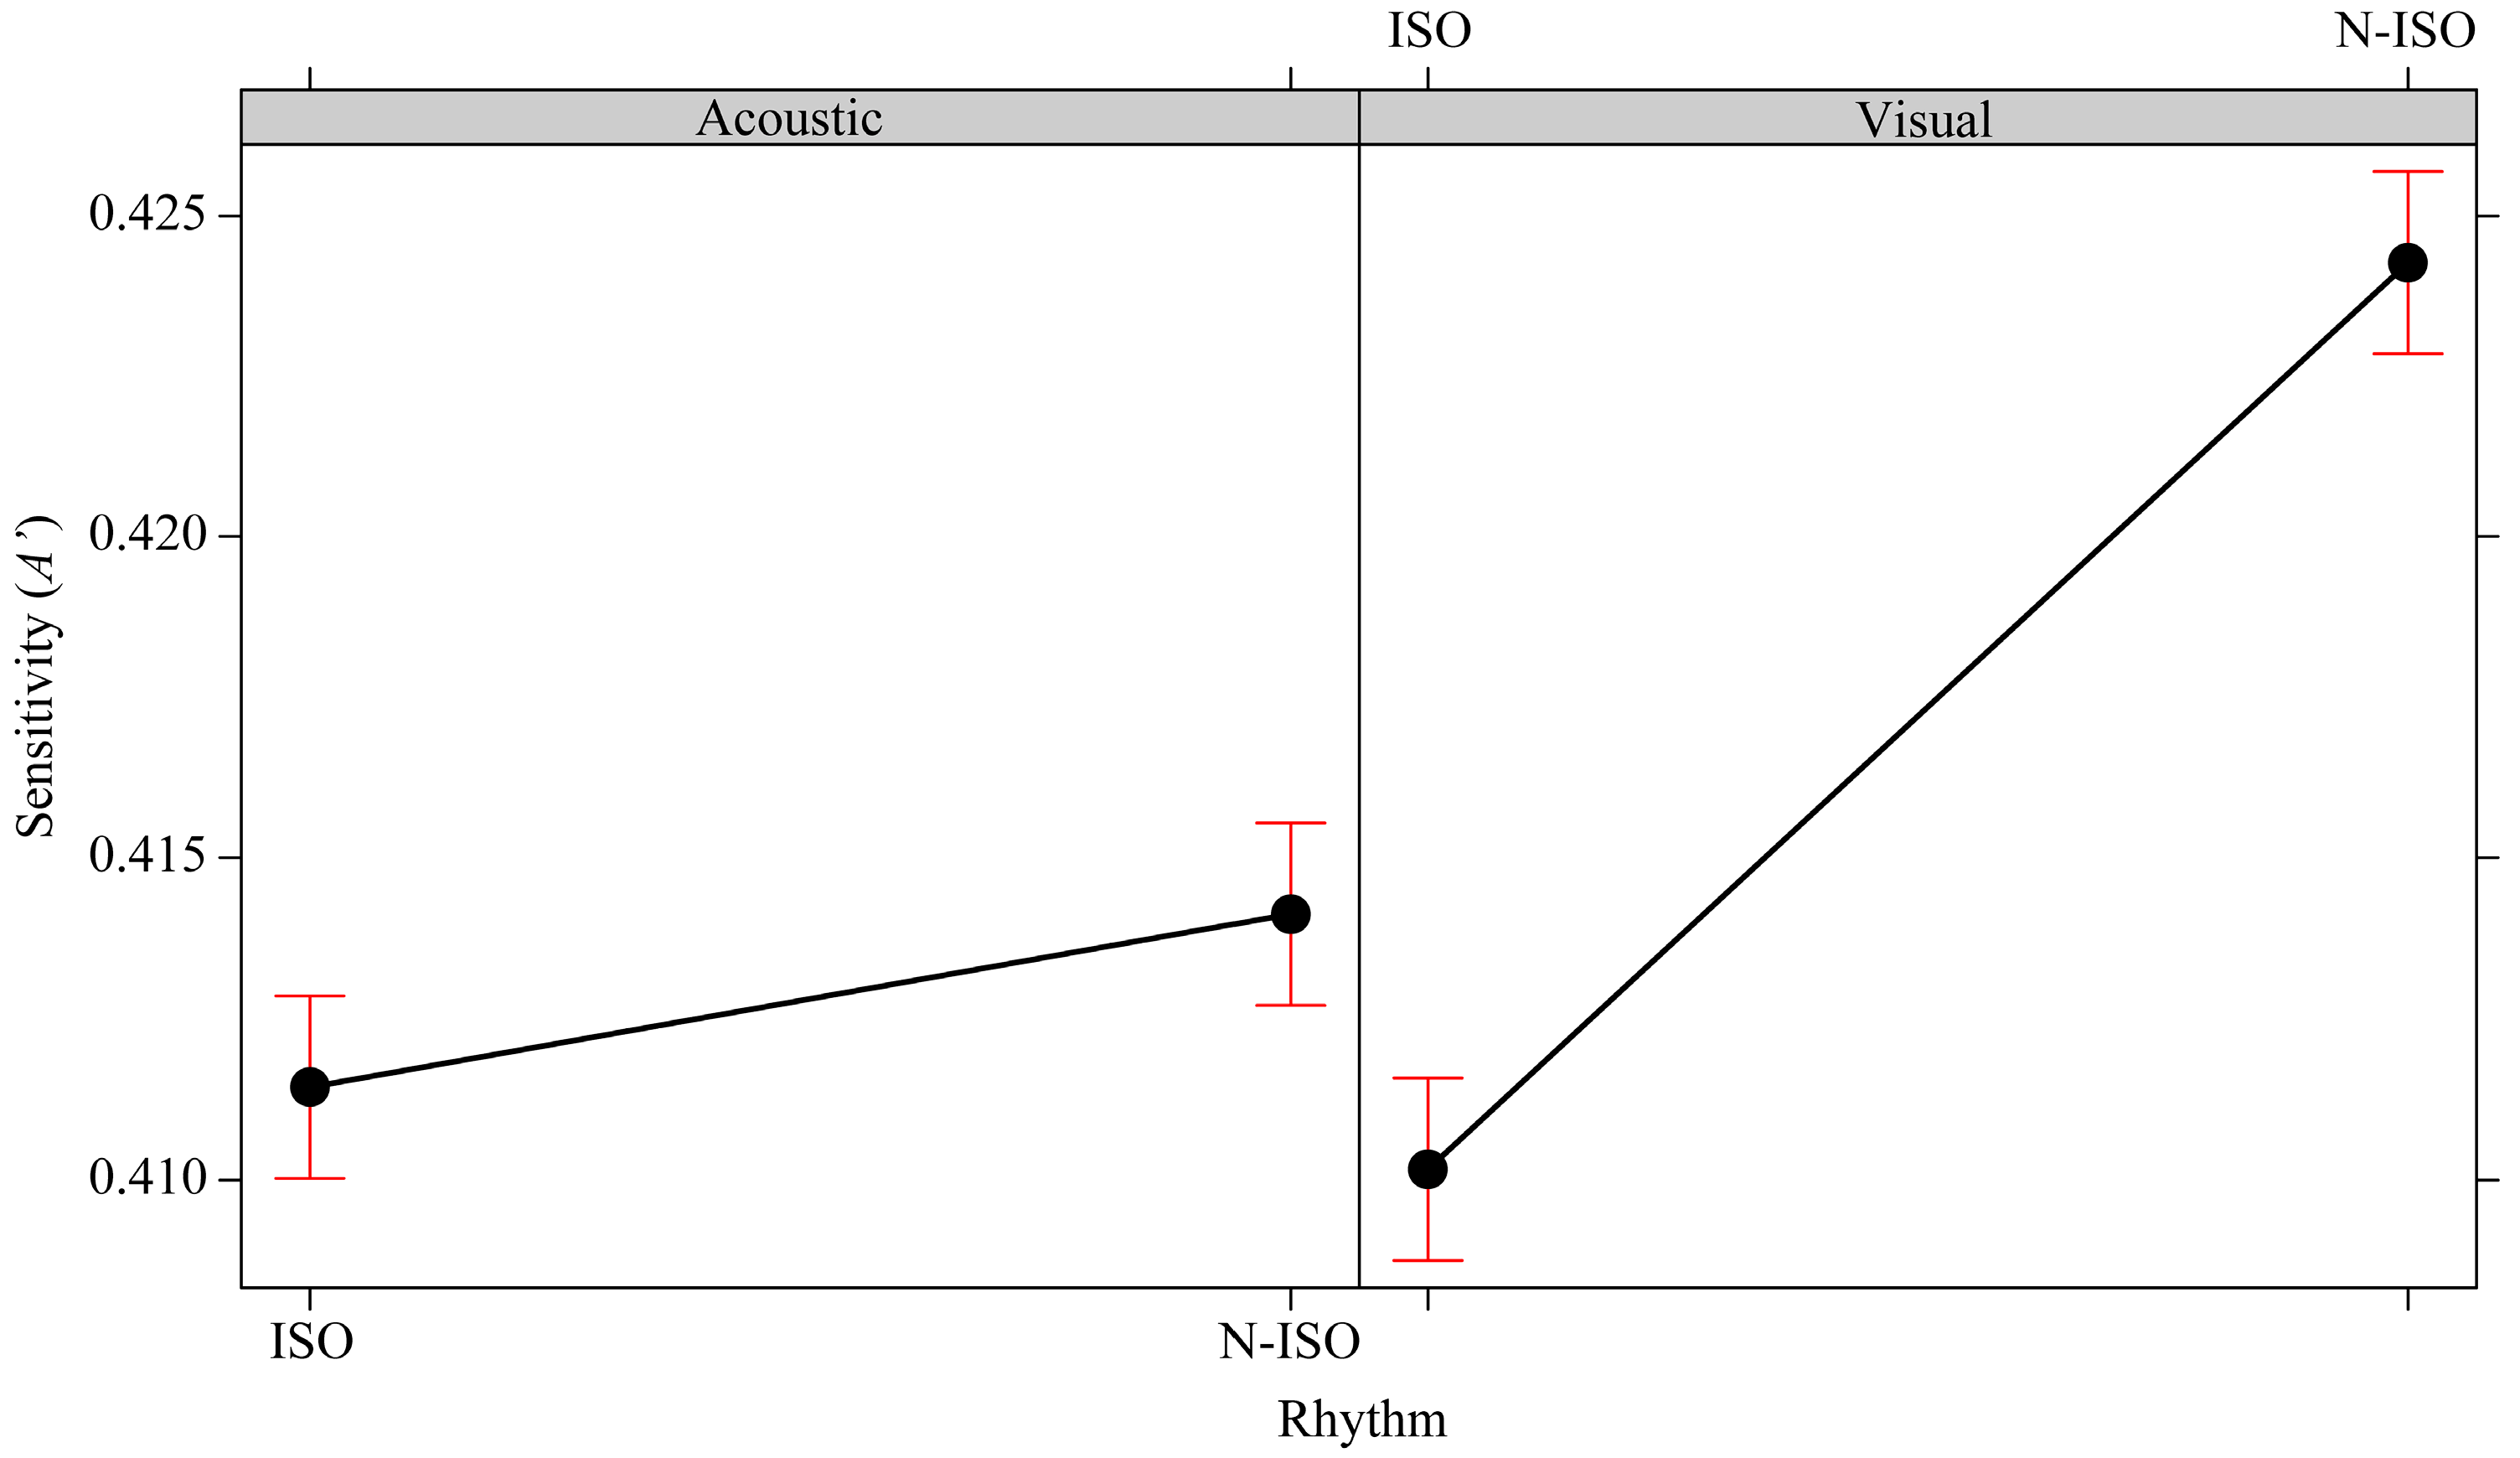
3.4. The Effects of the Isochronism versus Non-Isochronism (Rhythm)
4. Discussion and Conclusions
Supplementary Materials
Acknowledgments
Author Contributions
Conflicts of Interest
Appendix A

References
- Van der Helm, P.A. Symmetry perception. In The Oxford Handbook of Perceptual Organization; Wagemans, J., Ed.; Oxford University Press: Oxford, UK, 2014; pp. 108–128. [Google Scholar]
- Giannouli, V. Visual symmetry perception. Encephalos 2013, 50, 31–42. [Google Scholar]
- Treder, M.S. Behind the looking-glass: A review on human symmetry perception. Symmetry 2010, 2, 1510–1543. [Google Scholar] [CrossRef]
- Carmody, D.P.; Nodine, C.F.; Locher, P.J. Global detection of symmetry. Percept. Mot. Skills 1977, 45, 1267–1273. [Google Scholar] [CrossRef] [PubMed]
- Corballis, B.; Beale, I. The Psychology of Left and Right; Lawrence Erlbaum Associates: Hillsdale, NJ, USA, 1976. [Google Scholar]
- Goldmeier, E. Similarity in visually perceived forms. Psychol. Issues 1972, 8, 1–136. [Google Scholar] [PubMed]
- Herbert, A.M.; Humphrey, G.K. Bilateral symmetry detection: Testing a ‘callosal’ hypothesis. Perception 1996, 25, 463–480. [Google Scholar] [CrossRef] [PubMed]
- Wagemans, J. Detection of visual symmetries. Spat. Vis. 1995, 9, 9–32. [Google Scholar] [CrossRef] [PubMed]
- Locher, P.; Nodine, C. The perceptual value of symmetry. Comput. Math. Appl. 1989, 17, 475–484. [Google Scholar] [CrossRef]
- Locher, P.; Wagemans, J. The effects of element type and spatial grouping on symmetry detection. Perception 1990, 22, 565–587. [Google Scholar] [CrossRef] [PubMed]
- Rock, I.; Leaman, R. An experimental analysis of visual symmetry. Acta Psychol. 1963, 21, 171–183. [Google Scholar] [CrossRef]
- Royer, F.L. Detection of symmetry. J. Exp. Psychol. Hum. Percept. Perform. 1981, 7, 1186–1210. [Google Scholar] [CrossRef] [PubMed]
- Wagemans, J. Characteristics and models of human symmetry detection. Trends Cogn. Sci. 1997, 1, 346–352. [Google Scholar] [CrossRef]
- Wenderoth, P. The salience of vertical symmetry. Perception 1994, 23, 221–236. [Google Scholar] [CrossRef] [PubMed]
- Wenderoth, P. The effects of dot pattern parameters and constraints on the relative salience of vertical bilateral symmetry. Vis. Res. 1996, 36, 2311–2320. [Google Scholar] [CrossRef]
- Zimmer, A.C. Foundations for the measurement of phenomenal symmetry. Gestalt Theory 1984, 6, 118–157. [Google Scholar]
- Barlow, H.B.; Reeves, B.C. The versatility and absolute efficiency of detecting mirror symmetry in random dot displays. Vis. Res. 1979, 19, 783–793. [Google Scholar] [CrossRef]
- Julesz, B. Figure and ground perception in briefly presented isodipole textures. In Perceptual organization; Kubovy, M., Pomerantz, M., Eds.; Erlbaum: Hillsdale, NJ, USA, 1981; pp. 27–57. [Google Scholar]
- Palmer, S.E.; Hemenway, K. Orientation and symmetry: Effects of multiple, rotational, and near symmetries. J. Exp. Psychol. Hum. Percept. Perform. 1978, 4, 691–692. [Google Scholar] [CrossRef] [PubMed]
- Tyler, C.W.; Hardage, L.; Miller, R.T. Multiple mechanisms for the detection of mirror symmetry. Spat. Vis. 1995, 9, 79–100. [Google Scholar] [CrossRef] [PubMed]
- Wagemans, J.; Van Gool, L.; Dydewalle, G. Detection of symmetry in tachistoscopically presented dot patterns: Effects of multiple axes and skewing. Percept. Psychophys. 1991, 50, 413–427. [Google Scholar] [CrossRef] [PubMed]
- Baylis, G.C. Visual parsing and object-based attention: A developmental perspective. In Cognitive Neuroscience of Attention; Richards, J.E., Ed.; Lawrence Erlbaum Associates, Inc.: Mahwah, NJ, USA, 1998; pp. 251–286. [Google Scholar]
- Bornstein, M.H.; Ferdinandsen, K.; Gross, C.G. Perception of symmetry in infancy. Dev. Psychol. 1981, 17, 82–86. [Google Scholar] [CrossRef]
- Bornstein, M.H.; Krinsky, S.J. Perception of symmetry in infancy—The salience of vertical symmetry and the perception of pattern wholes. J. Exp. Child Psychol. 1985, 39, 1–19. [Google Scholar] [CrossRef]
- Fisher, C.B.; Ferdinandsen, K.; Bornstein, M.H. The role of symmetry in infant form discrimination. Child Dev. 1981, 52, 457–462. [Google Scholar] [CrossRef] [PubMed]
- Humphrey, G.K.; Humphrey, D.E. The role of structure in infant visual pattern perception. Can. J. Psychol. 1989, 43, 165–182. [Google Scholar] [CrossRef] [PubMed]
- Rhodes, G.; Geddes, K.; Jeffery, L.; Dziurawiec, S.; Clark, A. Are average and symmetric faces attractive to infants? Discrimination and looking preferences. Perception 2002, 31, 315–321. [Google Scholar] [CrossRef] [PubMed]
- Balch, W.R. The role of symmetry in the good continuation ratings of two-part tonal melodies. Percept. Psychophys. 1981, 29, 47–55. [Google Scholar] [CrossRef] [PubMed]
- Dowling, W.J. Recognition of interventions of melodies and melodic contours. Percept. Psychophys. 1971, 9, 348–349. [Google Scholar] [CrossRef]
- Dowling, W.J. Recognition of melodic transformations: Invertion, retrograde and retrograde inversion. Percept. Psychophys. 1972, 12, 417–421. [Google Scholar] [CrossRef]
- Krumhansl, C.L.; Sandell, G.J.; Sergeant, D.C. The perception of tone hierarchies and mirror forms in twelve-tone serial music. Music Percept. 1987, 5, 31–77. [Google Scholar] [CrossRef]
- Tovey, D. The Forms of Music; Meridian Books: Cleveland, OH, USA, 1956. [Google Scholar]
- Dowling, W.J.; Fujitani, D.S. Contour, interval, and pitch recognition in memory for melodies. Acoust. Soc. Am. 1971, 49, 524–531. [Google Scholar] [CrossRef]
- Marks, L. The Unity of the Senses: Interrelations Among the Modalities; Academic Press: New York, NY, USA, 1978. [Google Scholar]
- Marks, L.E. Cross-modal interactions in speeded classification. In Handbook of Multisensory Processes; Calvert, G.A., Spence, C., Stein, B.E., Eds.; MIT Press: Cambridge, MA, USA, 2004; pp. 85–105. [Google Scholar]
- Spence, C. Crossmodal correspondences: A tutorial review. Atten. Percept. Psychophys. 2011, 73, 971–995. [Google Scholar] [CrossRef] [PubMed]
- Sperry, R.W. Hemisphere deconnection and unity in conscious awareness. Am. Psychol. 1968, 23, 723–733. [Google Scholar] [CrossRef] [PubMed]
- Köhler, W. Gestalt Psychology; Liveright Publication: New York, NY, USA, 1929. [Google Scholar]
- Köhler, W. Gestalt Psychology: An introduction to New Concepts in Modern Psychology; Liveright Publication: New York, NY, USA, 1947. [Google Scholar]
- Bahrick, L.E. Infants’ perception of substance and temporal synchrony in multimodal events. Infant. Behav. Dev. 1983, 6, 429–451. [Google Scholar] [CrossRef]
- Bahrick, L.E. Intermodal learning in infancy: Learning on the basis of two kinds of invariant relations in audible and visible events. Child. Dev. 1988, 59, 197–209. [Google Scholar] [CrossRef] [PubMed]
- Lewkowicz, D.J. Infants’ response to temporally based intersensory equivalence: The effect of synchronous sounds on visual preferences for moving stimuli. Infant. Behav. Dev. 1992, 15, 297–323. [Google Scholar] [CrossRef]
- Spelke, E.S.; Born, W.S.; Chu, F. Perception of moving, sounding objects by four-month-old infants. Perception 1983, 12, 719–732. [Google Scholar] [CrossRef] [PubMed]
- Barrack, L.E.; Netto, D.; Hernandez-Reif, M. Intermodal perception of adult and child faces and voices by infants. Child. Dev. 1998, 69, 1263–1275. [Google Scholar]
- Walker-Andrews, A.S.; Bahrick, L.E.; Raglioni, S.S.; Diaz, I. Infant’s bimodal perception of gender. Ecol. Psychol. 1991, 3, 55–75. [Google Scholar] [CrossRef]
- Allen, T.W.; Walker, K.; Symonds, L.; Marcell, M. Intrasensory and intersensory perception of temporal sequences during infancy. Dev. Psychol. 1977, 3, 225–229. [Google Scholar] [CrossRef]
- Mendelson, M.J.; Ferland, M.B. Auditory-visual transfer in four month old infants. Child. Dev. 1982, 3, 1022–1027. [Google Scholar] [CrossRef]
- Pickens, J.N.; Bahrick, L.E. Do infants perceive invariant tempo and rhythm in auditory-visual events? Infant. Behav. Dev. 1997, 20, 349–357. [Google Scholar] [CrossRef]
- Bahrick, L.E.; Pickens, J.N. Amodal relations: The basis for intermodal perception and learning. In The Development of Intersensory Perception: Comparative Perspectives; Lewkowicz, D., Ed.; Erlbaum: Hillsdale, NJ, USA, 1994; pp. 205–233. [Google Scholar]
- Stumpf, K. Tonpsychologie [Psychology of Tones]; S. Hirzel: Leipzig, Germany, 1883. [Google Scholar]
- Pratt, C.C. The spatial character of high and low tones. J. Exp. Psychol. 1930, 13, 278–285. [Google Scholar] [CrossRef]
- Carnevale, M.J.; Harris, L.R. Which direction is up for a high pitch? Multisens. Res. 2016, 29, 113–132. [Google Scholar] [CrossRef] [PubMed]
- White, B.W. Recognition of distorted melodies. Am. J. Psychol. 1960, 73, 100–107. [Google Scholar] [CrossRef] [PubMed]
- Frances, R. La Perception de la Musique, 2nd ed.; Librairie Philosophique J. Vrin: Paris, France, 1972. (In French) [Google Scholar]
- Pedersen, P. The perception of octave equivalence in twelve-tone rows. Psychol. Music 1975, 3, 3–8. [Google Scholar] [CrossRef]
- Wertheimer, M. Untersuchungen zur Lehre von der Gestalt. II. Psychol. Forsch. 1923, 4, 301–350. (In German) [Google Scholar] [CrossRef]
- Green, D.M.; Swets, J.A. Signal Detection Theory and Psychophysics; Wiley: New York, NY, USA, 1966. [Google Scholar]
- Stanislaw, H.; Todorov, N. Calculation of signal detection theory measures. Behav. Res. Methods Instrum. Comput. 1999, 31, 137–149. [Google Scholar] [CrossRef] [PubMed]
- Donaldson, W. Measuring recognition memory. J. Exp. Psychol. Gen. 1992, 121, 275–277. [Google Scholar] [CrossRef] [PubMed]
- Nelson, T.O. A comparison of current measures of the accuracy of feeling-of-knowing predictions. Psychol. Bull. 1984, 95, 109–133. [Google Scholar] [CrossRef] [PubMed]
- Smith, W.D. Clarification of sensitivity measure A′. J. Math. Psychol. 1995, 39, 82–89. [Google Scholar] [CrossRef]
- Pollack, I.; Norman, D.A. A nonparametric analysis of recognition experiments. Psychon. Sci. 1964, 1, 125–126. [Google Scholar] [CrossRef]
- Macmillan, N.A.; Creelman, C.D. Triangles in ROC space: History and theory of “nonparametric” measures of sensitivity and bias. Psychon. Bull. Rev. 1996, 3, 164–170. [Google Scholar] [CrossRef] [PubMed]
- Papke, L.E.; Wooldridge, J. Econometric methods for fractional response variables with an application to 401(k) plan participation rates. J. Appl. Econ. 1996, 11, 619–632. [Google Scholar] [CrossRef]
- Baum, C.F. Modeling proportions. Stata J. 2008, 8, 299–303. [Google Scholar]
- Bates, D.; Machler, M.; Bolker, B.M.; Walker, S.C. Fitting linear mixed-effects models using lme4. arXiv, 2015; arXiv:1406.5823. [Google Scholar]
- Fox, J.; Weisberg, S. An R Companion to Applied Regression, 2nd ed.; Sage: Thousand Oaks, CA, USA, 2011. [Google Scholar]
- Lenth, R.V. Least-squares means: The R package lsmeans. J. Stat. Softw. 2016, 69. [Google Scholar] [CrossRef]
- Fox, J. Effect Displays in R for Generalised Linear Models. 2003. Available online: http://psfaculty.ucdavis.edu/bsjjones/effectdisplays.pdf (accessed on 7 March 2017).
- Barr, D.J. Random effects structure for testing interactions in linear mixed-effects models. Front. Psychol. 2013, 4. [Google Scholar] [CrossRef] [PubMed]
- Barr, D.J.; Levy, R.; Scheepers, C.; Tily, H.J. Random effects structure for confirmatory hypothesis testing: Keep it maximal. J. Mem. Lang. 2013, 68, 255–278. [Google Scholar] [CrossRef] [PubMed]
- Bates, D.; Kliegl, R.; Vasishth, S.; Baayen, H. Parsimonious mixed models. arXiv, 2015; arXiv:150604967. [Google Scholar]
- Singmann, H.; Bolker, B.M.; Westfall, J. AFEX: Analysis of Factorial Experiments. R Package Version 0.16-1. R Foundation for Statistical Computing, Ed.; Vienna. Available online: http://CRAN.R-project.org/package=afex (accessed on 26 January 2017).
- Von Ehrenfels, C. Über Gestaltqualitäten. Vierteljahrsschr. Wiss. Philos. 1890, 14, 249–292. (In German) [Google Scholar]
- Wagemans, J.; Van Gool, L.; Swinnen, V.; Van Horebeek, J. Higher-order structure in regularity detection. Vis. Res. 1993, 33, 1067–1088. [Google Scholar] [CrossRef]
- Huang, L.; Pashler, H. Symmetry detection and visual attention: A “binary-map” hypothesis. Vis. Res. 2002, 42, 1421–1430. [Google Scholar] [CrossRef]
- Niimi, R.; Watanabe, K.; Yokosawa, K. The dynamic-stimulus advantage of visual symmetry perception. Psychol. Res. 2008, 72, 567–579. [Google Scholar] [CrossRef] [PubMed]
- Baylis, G.C.; Driver, J. Obligatory edge assignment in vision: The role of figure and part segmentation in symmetry detection. J. Exp. Psychol. Hum. Percept. Perform. 1995, 21, 1323–1342. [Google Scholar] [CrossRef]
- Bertamini, M.; Friedenberg, J.D.; Kubovy, M. Detection of symmetry and perceptual organization: The way a lock-and-key process works. Acta Psychol. 1997, 95, 119–140. [Google Scholar] [CrossRef]
- Koning, A.; Wagemans, J. Detection of symmetry and repetition in one and two objects: Structures versus strategies. Exp. Psychol. 2009, 56, 5–17. [Google Scholar] [CrossRef] [PubMed]
- Öğmen, H.; Herzog, M.H. A new conceptualization of human visual sensory-memory. Front. Psychol. 2016, 7, 830–845. [Google Scholar] [CrossRef] [PubMed]
- Winkler, I.; Cowan, N. From sensory to long-term memory: Evidence from auditory memory reactivation studies. Exp. Psychol. 2005, 52, 3–20. [Google Scholar] [CrossRef] [PubMed]
- Bianchi, I.; Savardi, U. The Perception of Contraries; Aracne: Roma, Italy, 2008. [Google Scholar]
- Bianchi, I.; Savardi, U. The relationship perceived between the real body and the mirror image. Perception 2008, 37, 666–687. [Google Scholar] [CrossRef] [PubMed]
- Diamond, R.; Carey, S. Why faces are and are not special. An effect of expertise. J. Exp. Psychol. Gen. 1986, 115, 107–117. [Google Scholar] [CrossRef] [PubMed]
- Wright, A.A.; Roberts, W.A. Monkey and human face perception: Inversion effects for human faces but not for monkey faces or scenes. J. Cogn. Neurosci. 1996, 8, 278–290. [Google Scholar] [CrossRef] [PubMed]
- Troje, F.N.; Westhoff, C. The inversion effect in biological motion perception: Evidence for a “life detector”? Curr. Biol. 2006, 16, 821–824. [Google Scholar] [CrossRef] [PubMed]
- Dakin, S.C.; Watt, R.J. Detection of bilateral symmetry using spatial filters. Spat. Vis. 1994, 8, 393–413. [Google Scholar] [CrossRef] [PubMed]
- Labonte, F.; Shapira, Y.; Cohen, P.; Faubert, J. A Model for global symmetry detection in dense images. Spat. Vis. 1995, 9, 33–55. [Google Scholar] [CrossRef] [PubMed]
- Jenkins, B. Component processes in the perception of bilaterally symmetric dot textures. Percept. Psychophys. 1983, 34, 433–440. [Google Scholar] [CrossRef] [PubMed]
- Ballesteros, S.; Manga, D.; Reales, J.M. Haptic discrimination of bilateral symmetry in 2-dimensional and 3-dimensional unfamiliar displays. Percept. Psychophys. 1997, 59, 37–50. [Google Scholar] [CrossRef] [PubMed]
- Ballesteros, S.; Millar, S.; Reales, J.M. Symmetry in haptic and in visual shape perception. Percept. Psychophys. 1998, 60, 389–404. [Google Scholar] [CrossRef] [PubMed]
- Ballesteros, S.; Reales, J.M. Visual and haptic discrimination of symmetry in unfamiliar displays extended in the z-axis. Perception 2004, 33, 315–327. [Google Scholar] [CrossRef] [PubMed]
- Bauer, C.; Yazzolino, L.; Hirsch, G.; Cattaneo, Z.; Vecchi, T.; Merabet, L.B. Neural correlates associated with superior tactile symmetry perception in the early blind. Cortex 2015, 63, 104–117. [Google Scholar] [CrossRef] [PubMed]
- Cattaneo, Z.; Bona, S.; Bauer, C.; Silvanto, J.; Herbert, A.M.; Vecchi, T.; Merabet, L.B. Symmetry detection in visual impairment: Behavioral evidence and neural correlates. Symmetry 2014, 6, 427–443. [Google Scholar] [CrossRef]
- Cattaneo, Z.; Fantino, M.; Silvanto, J.; Tinti, C.; Pascual-Leone, A.; Vecchi, T. Symmetry perception in the blind. Acta Psychol. 2010, 134, 398–402. [Google Scholar] [CrossRef] [PubMed]
- Cattaneo, Z.; Vecchi, T.; Fantino, M.; Herbert, A.M.; Merabet, L.B. The effect of vertical and horizontal symmetry on memory for tactile patterns in late blind individuals. Atten. Percept. Psychophys. 2013, 75, 375–382. [Google Scholar] [CrossRef] [PubMed]
- Driver, J.; Baylis, G.C.; Rafal, R.D. Preserved figure-ground segregation and symmetry perception in visual neglect. Nature 1992, 360, 73–75. [Google Scholar] [CrossRef] [PubMed]
- Verma, A.; Van der Haegen, L.; Brysbaert, M. Symmetry detection in typically and atypically speech lateralized individuals: A visual half-field study. Neuropsychologia 2013, 51, 2611–2619. [Google Scholar] [CrossRef] [PubMed]
- Wagemans, J. Parallel visual processes in symmetry perception: Normality and pathology. Doc. Ophthalmol. 1998, 95, 359–370. [Google Scholar] [CrossRef] [PubMed]
- Bertamini, M.; Makin, A.D.J. Brain activity in response to visual symmetry. Symmetry 2014, 6, 975–996. [Google Scholar] [CrossRef]
- Merabet, L.B.; Thut, G.; Murray, B.; Andrews, J.; Hsiao, S.; Pascual-Leone, A. Feeling by sight or seeing by touch? Neuron 2004, 42, 173–179. [Google Scholar] [CrossRef]


| Number of Points of Inversion | Contour |
|---|---|
| 0 | ++++ |
| 0 | −−−− |
| 1 | +++− |
| 1 | (−−−+) |
| 1 | (+−−−) |
| 1 | (−+++) |
| 1 | (++−−) |
| 1 | −−++ |
| 2 | (−++−) |
| 2 | +−−+ |
| 2 | (++−+) |
| 2 | −−+− |
| 3 | +−+− |
| 3 | −+−+ |
| MIRROR FORM_Sense Modality | A′ | B″ |
|---|---|---|
| RET_acoustic | M = 0.833 (SD = 0.139) | M = 0.154 (SD = 0.464) |
| INV_acoustic | M = 0.645 (SD = 0.148) | M = 0.167 (SD = 0.288) |
| RETINV_acoustic | M = 0.681 (SD = 0.096) | M = 0.381 (SD = 0.286) |
| RET_visual | M = 0.811 (SD = 0.154) | M = −0.124 (SD = 0.454) |
| INV_visual | M = 0.736 (SD = 0.122) | M = 0.019 (SD = 0.311) |
| RETINV_visual | M = 0.646 (SD = 0.136) | M = 0.228 (SD = 0.356) |
| MIRROR FORM_Sense Modality | A′ | B″ |
|---|---|---|
| ISO_acoustic | M = 0.726 (SD = 0.165) | M= 0.213 (SD = 0.415) |
| N-ISO_acoustic | M = 0.722 (SD = 0.172) | M = 0.219 (SD = 0.421) |
| ISO_visual | M = 0.722 (SD = 0.171) | M = 0.010 (SD = 0.430) |
| N-ISO visual | M = 0.752 (SD = 0.168) | M = −0.026 (SD = 0.467) |
© 2017 by the authors. Licensee MDPI, Basel, Switzerland. This article is an open access article distributed under the terms and conditions of the Creative Commons Attribution (CC BY) license ( http://creativecommons.org/licenses/by/4.0/).
Share and Cite
Bianchi, I.; Burro, R.; Pezzola, R.; Savardi, U. Matching Visual and Acoustic Mirror Forms. Symmetry 2017, 9, 39. https://doi.org/10.3390/sym9030039
Bianchi I, Burro R, Pezzola R, Savardi U. Matching Visual and Acoustic Mirror Forms. Symmetry. 2017; 9(3):39. https://doi.org/10.3390/sym9030039
Chicago/Turabian StyleBianchi, Ivana, Roberto Burro, Roberta Pezzola, and Ugo Savardi. 2017. "Matching Visual and Acoustic Mirror Forms" Symmetry 9, no. 3: 39. https://doi.org/10.3390/sym9030039
APA StyleBianchi, I., Burro, R., Pezzola, R., & Savardi, U. (2017). Matching Visual and Acoustic Mirror Forms. Symmetry, 9(3), 39. https://doi.org/10.3390/sym9030039