Using Knowledge Transfer and Rough Set to Predict the Severity of Android Test Reports via Text Mining


College of Information Science and Technology, Dalian Maritime University, Dalian 116026, China
*
Authors to whom correspondence should be addressed.
Symmetry 2017, 9(8), 161; https://doi.org/10.3390/sym9080161
Submission received: 5 June 2017
/
Revised: 10 August 2017
/
Accepted: 16 August 2017
/
Published: 17 August 2017
(This article belongs to the Special Issue Emerging Approaches and Advances in Big Data)
Abstract
:Crowdsourcing is an appealing and economic solution to software application testing because of its ability to reach a large international audience. Meanwhile, crowdsourced testing could have brought a lot of bug reports. Thus, in crowdsourced software testing, the inspection of a large number of test reports is an enormous but essential software maintenance task. Therefore, automatic prediction of the severity of crowdsourced test reports is important because of their high numbers and large proportion of noise. Most existing approaches to this problem utilize supervised machine learning techniques, which often require users to manually label a large number of training data. However, Android test reports are not labeled with their severity level, and manual labeling is time-consuming and labor-intensive. To address the above problems, we propose a Knowledge Transfer Classification (KTC) approach based on text mining and machine learning methods to predict the severity of test reports. Our approach obtains training data from bug repositories and uses knowledge transfer to predict the severity of Android test reports. In addition, our approach uses an Importance Degree Reduction (IDR) strategy based on rough set to extract characteristic keywords to obtain more accurate reduction results. The results of several experiments indicate that our approach is beneficial for predicting the severity of android test reports.
1. Introduction
Crowdsourcing techniques have recently gained broad popularity in the research domain of software engineering [1]. One of the key advantages of crowdsourcing techniques is that they provide engineers with information on the operations of real users, and those users provide data from tasks performed on real, diverse software and hardware platforms. For example, crowdsourced testing (e.g., GUI testing [2]) provides user experience results for a large population of widely varying users, hardware, and operating systems and versions.
The Android bug tracker system [3] is a crowdsourced testing tool that manages test reports collected from various sources, including development teams, testing teams, and end users, who are regarded as crowdsourced workers. Then, the Android development team manually analyzes the test reports and assigns a priority to each test report to represent how urgent it is from a business perspective that the bug gets fixed. This test report priority is an important assessment that depends on the severity of the test report, namely, the severity of impact of the bug on the successful execution of the software system. Some test reports are labeled as severe test reports (i.e., “severe” in testing parlance), whose associated bugs are found to be severe problems. Severe test reports generally have a higher fix priority than non-severe test reports (i.e., “non-severe”), the subset of test reports that are believed not to have any severe impact. In this way, crowdsourced workers help the centralized developers to reveal faults. However, the Android bug tracker system does not maintain severity labels for test reports. Because of the large number of test reports generated in crowdsourced testing, manually marking the severity of test reports can be a time-consuming and tedious task. Thus, the ability to automatically classify the severity of large numbers of test reports would significantly facilitate this process.
Several previous studies have been conducted to investigate the classification of issue reports for open-source projects using supervised machine learning algorithms [4,5,6,7]. Feng et al. [8,9] proposed test report prioritization methods for use in crowdsourced testing. They designed strategies for dynamically selecting the riskiest and most diversified test reports for inspection in each iteration. Wang et al. [10,11] proposed a cluster-based classification approach for effective classification of crowdsourced reports that addresses the local bias problem. Unfortunately, the Android bug reports do not have the severity labels for use as training data, and these approaches often require users to manually label a large number of training data, which is both time-consuming and labor-intensive in practice. Therefore, it is crucial to reduce the onerous burden of manual labeling while still being able to achieve good performance.
In this paper, we propose a Knowledge Transfer Classification (KTC) approach based on text mining and machine learning methods for predicting the severity of test reports generated in crowdsourced testing. To address the lack of severity-labeled training data available for Android test reports, our approach obtains labeled training data from bug repositories and uses knowledge transfer to predict the severity of Android test reports. We apply natural language processing (NLP) techniques, namely, tokenization, stop-word removal, and stemming [12], to extract keywords from the test reports. These keywords are used to predict the severity of the test reports. Although consensus methods are effective in practice, it cannot be denied that a level of noise still exists in the set of keyword labels. In this study, an Importance Degree Reduction (IDR) strategy based on rough set is used to extract characteristic keywords, reduce the noise in the integrated labels, and, consequently, enhance the training data and model quality. Several experiments are designed and performed to demonstrate that the presented approach can be used to effectively predict the severity of Android test reports. We attempt to evaluate the performance of the proposed KTC method in a crowdsourced environment based on the measures of accuracy, precision, and recall.
The main contributions of this paper are as follows:
- We propose a KTC approach based on text mining and machine learning methods to predict the severity of test reports from crowdsourced testing. Our approach obtains labeled training data from bug repositories and uses knowledge transfer to predict the severity of Android test reports.
- We use an IDR strategy based on rough set to extract characteristic keywords, reduce the noise in the integrated labels, and, consequently, enhance the training data and model quality.
- We use two bug repository datasets (Eclipse, Mozilla) for knowledge transfer to predict the severity of Android test reports. Several experiments demonstrate the prediction accuracy of our approach in various cases.
The remainder of this paper is organized as follows: the design of our proposed approach is discussed in Section 2, the experimental design and results are presented in Section 3 and Section 4, related studies are discussed in Section 5, the shortcomings of the IDR strategy are illustrated in Section 6, and conclusions and plans for future studies are discussed in Section 7.
2. Methodology
In this section, we present our method of using the knowledge gained from bug repositories to predict the severity of Android bugs in detail.
2.1. Overview
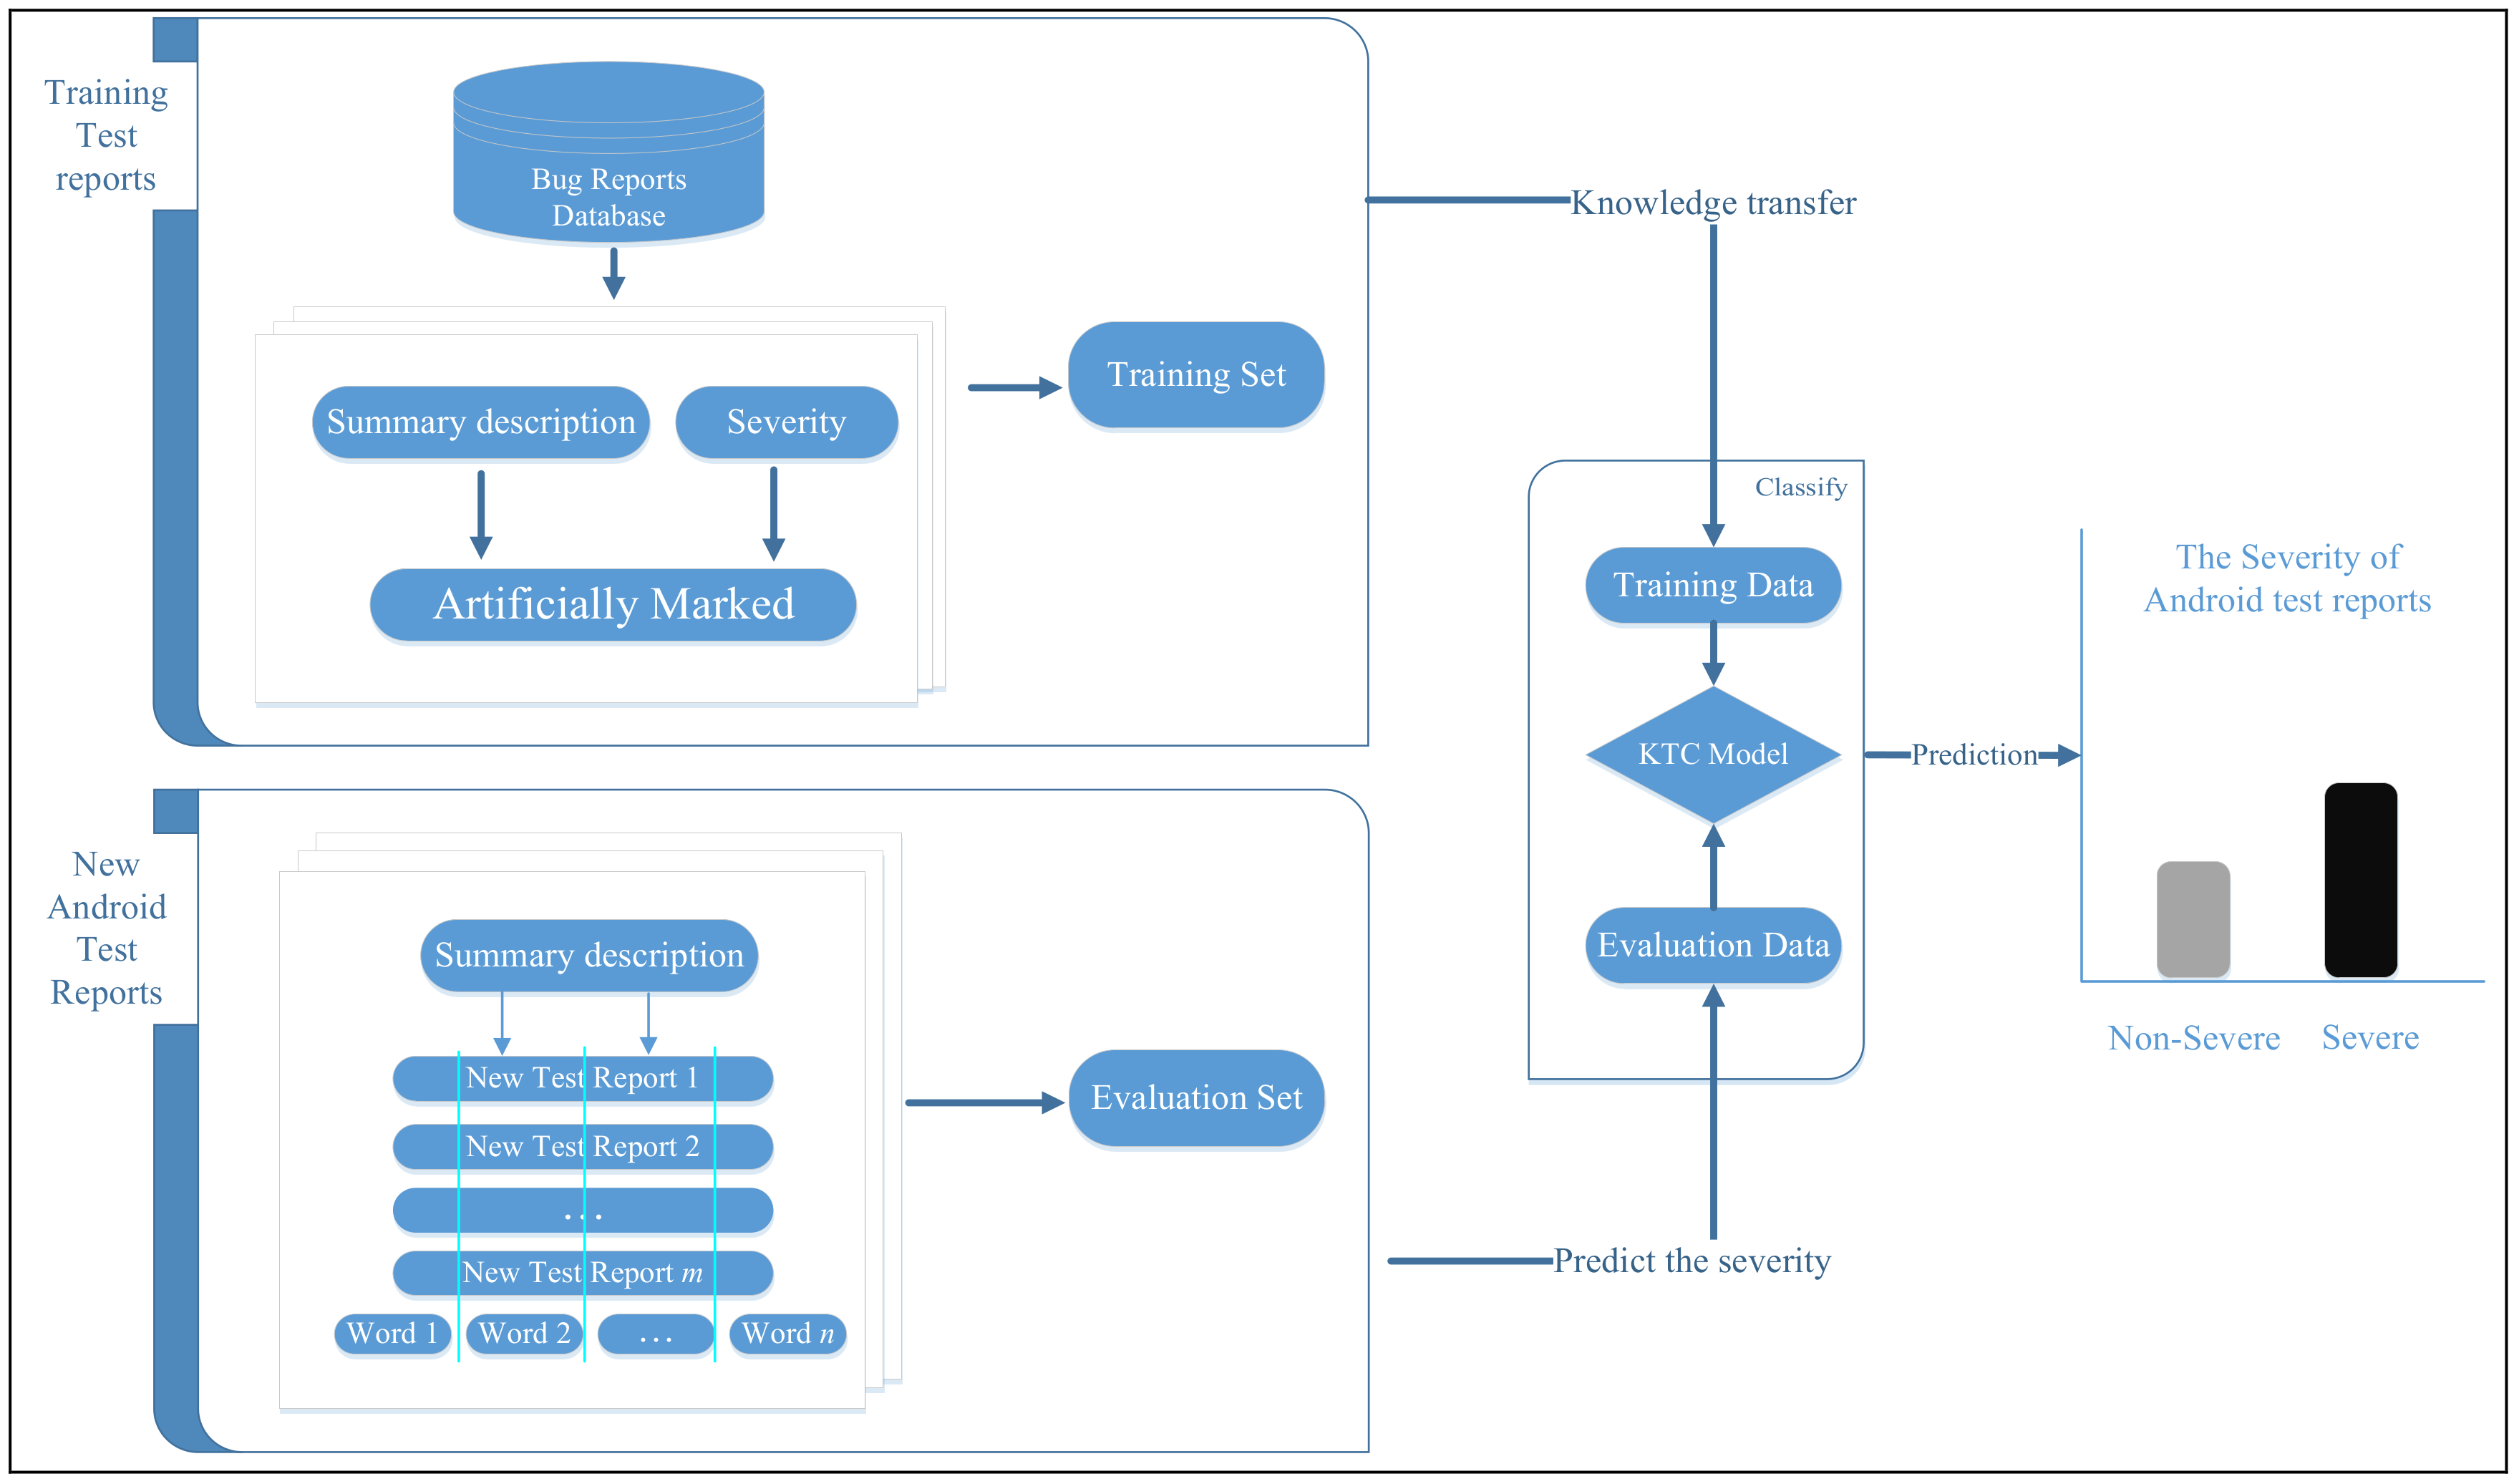
An Android bug report goes through several resolution statuses over its lifetime. When a bug is first reported, the bug report is marked as Unconfirmed. When a triager has verified that the bug is not duplicate and indeed a new bug, the status is set to New. Then, the triager assigns the bug report to one proper developer, and the status is changed to Assigned. Then, the assigned developer reproduces the bug, localizes it, and tries to fix it. When the bug has been solved, the bug report is marked as Resolved. After that, if a tester is not satisfied with the solution, the bug should be reopened with the status set to Reopen; if a tester has verified that the solution worked, the status is changed to Verified. The final status of a bug report is Closed, which is set when no occurrence of the bug is reported. The severe test reports generally have a higher fix priority than non-severe bug reports, which the non-severe bug reports that are believed not to have any severe impact. Due to the large number of bug reports, the ability to automatically classify the severity of large numbers of test reports would significantly facilitate this process. Unfortunately, the Android bug tracker system does not maintain severity labels for use as training data. Because of the large number of test reports generated in crowdsourced testing, manually marking the severity of Android bug reports can be a time-consuming and tedious task. In order to solve this problem, we extract and preprocess bug reports from the bug report database to generate a training set, which has been artificially marked with severity levels. We also mine the available unlabeled bug reports from the Android bug tracker [3] to generate an evaluation set. The new bug reports are visualized as a text matrix. Each row of the matrix represents one bug report, whereas each column of the matrix represents one word.
In the next step, we use the proposed KTC approach to predict the severity of the evaluation data based on the training data, as shown in Figure 1. However, the number of bug reports is quite high. And, because the reporters fill in the reports according to their understanding, it is not guaranteed that the expression in these reports are entered correctly. This may generate some low quality bug reports in the dataset. Moreover, because each word occurring in a document is treated as an additional dimension, textual data can be of a very high dimensionality. To solve these two issues, the KTC approach uses a rough-set-based method to reduce noise and unnecessary words in the data, thereby reducing the dimensionality of the textual data and improving the prediction accuracy.
2.2. Model Description
In this section, we present our KTC model in detail. Figure 2 shows the KTC workflow for predicting the severity of test reports, which consists of six main steps: (1) tokenization; (2) stop-word removal; (3) stemming; (4) IDR; (5) keyword vector modeling; and (6) classification result.
- (1).
- Tokenization: The process of tokenization consists of dividing a large textual string into a set of tokens, where a single token corresponds to a single term. This step also includes filtering out all meaningless symbols such as punctuation because these symbols do not contribute to the classification task. Also, all capitalized characters are replaced with their lower-case versions.
- (2).
- Stop-word removal: Human languages commonly use constructive terms such as conjunctions, adverbs, prepositions and other language structures for the building of sentences. Terms such as “the”, “in” and “that”, also known as stop words, carry little specific information in the context of a bug report. Moreover, these terms appear frequently in bug report descriptions and thus increase the dimensionality of the data, which could, in turn, cause the performance of classification algorithms to decrease. This is sometimes referred to as the curse of dimensionality. Therefore, all stop words are removed from the set of tokens, based on a list of known stop words.
- (3).
- Stemming: The purpose of the stemming step is to reduce each term appearing in a description to its most basic form. Each single term can be expressed in various forms while still carrying the same specific information. For example, the terms “computerized”, “computerize”, and “computation” all share the same morphological base: “computer”. A stemming algorithm such as the Porter stemmer [12] transforms each term into its basic form.
Example: Since each term occurring in a document is treated as an additional dimension, textual data can be of a very high dimensionality. The introduction of the preprocessing steps described above partially overcomes this problem by reducing the number of terms to be considered. An example of the effects of these preprocessing steps is shown in Table 1.
- (4).
- IDR: Keywords extracted from test reports play an important role in the prediction of test report severity. To summarize the information contained within the keywords, we count their frequencies (i.e., numbers of occurrences) to estimate their degrees of importance. However, the keywords are described in natural language by crowdsourced workers, who may have various different backgrounds (i.e., expertise, reliability, performance, location). This can result in a large number of keyword dimensions and considerable noise. In this study, an IDR strategy based on rough set is used to extract characteristic keywords, reduce the noise in the integrated labels, and, consequently, enhance the training data and model quality. The IDR strategy is described in detail in the next section. In this way, a keyword dictionary is built.
- (5).
- Keyword vector modeling: This step involves the construction of a keyword vector model (KV). Based on the keyword dictionary, we construct a keyword vector for each test report, tri = (ei1, ei2, …, eim), where m is the number of keywords in the keyword dictionary. We set eij = 1 if the ith test report contains the j-th keyword in the keyword dictionary and eij = 0 otherwise.
- (6).
- Classification results: A variety of classification algorithms have been proposed in the data mining community. In this study, we apply the four most important of these algorithms (Naïve Bayes (NB), K-Nearest Neighbour (KNN), Support Vector Machines (SVM), and Decision Tree (J48)) to our problem to verify the accuracy of our approach.
2.3. Description of IDR Strategy
In this section, the definitions of keyword vectors and the degree of importance of a keyword are given. The importance degree reduction algorithm is explained in detail.
In our study, the condition attribute set C is the set of all keywords, B (B C) is a subset of the condition set. The decision attribute set D is the set of bug reports’ severity. REDC(D) represents the collection of all relative reduce of C with respect to D. The core of C (CORED(C)) is defined as [13]. The value set V represents the frequencies with which keywords are contained in the test reports. So the problem of keywords reduction is changed into the problem of decision table reduction [14].
Definition 1.
For a decision system KV = (U, C ∪ D, V, f), where U is the finite set of objects, the condition attribute set C is the set of all keywords, B (B C) is a subset of the condition set. The decision attribute set D is the set of bug reports’ severity. The value set V represents the frequencies with which keywords are contained in the test reports. f represents the information function. For any B C, the indiscernibility relation, denoted by IND(B), is defined as follows [14,15]:
where a(x) denotes the value of feature a of object x. If (x, y)
IND(B), x, and y are said to be indiscernible with respect to B. The equivalence classes of the B-indiscernibility relation are denoted by . For any concept X U and attribute set B C, X could be approximated by the lower approximation and upper approximation.
Definition 2.
The lower approximation of X is the set of objects of U that are surely in X, defined as:
The upper approximation of X is the set of objects of U that are possibly in X, defined as:
Definition 3.
C-positive region of D is the set of all objects from the universe U which can be classified with certainty into classes of U/D employing attributes from B (B C), that is:
Definition 4.
The quantitative γ measure can be extended to indicate the quality of a probabilistic classification. A straightforward transformation of the γ measure is denoted as follows:
Definition 5.
For a decision system KV = {U, C D, V, f}, B (B C) is a subset of the condition set and a (a C, but a B) is any condition attribute. The degree of importance of a relative to the decision set D is as follows:
| Algorithm 1. Importance Degree Reduction (IDR) Algorithm |
| Input: KV = {U, C D, V, f} |
| Output: The reduction set B ((B C) (B REDC(D))) of KV |
|
The algorithm of IDR is shown in Algorithm 1. In Step 1, we calculate the core C relative to the D. In Step 2, let B (B C), which is a subset of the condition set equal to CORED(C), if the positive region of decision attribute set D under the condition attribute set B is equal to the positive region of decision attribute set D under the condition attribute set B, output the reduction set B. In Step 3 and Step 4, the new attribute is added based on the core of the decision table. For each time of finding the attribute, the attribute which has the highest importance degree is always is chosen, until the C does not change.
3. Experimental Design
The experimental design for predicting the severity of Android bug reports is described in this section.
3.1. Experimental Setup
For the experiment, we randomly selected 600 Android test reports from the Android bug tracker system [3] as evaluation data, as shown in Table 2. In addition, we manually labeled the severity of the Android test report according to the rules defined for the bug repositories. To ensure that the classifier is not affected by the distribution of the bugs according to their severities, we make sure that we select just as many reports in the training and evaluation set for each severity. To validate the proposed approach, we used bug reports from bug repositories for two major open-source projects, namely Mozilla and Eclipse, as training data, as shown in Table 3.
Android test reports [3]: The Android bug tracker system is a crowdsourced testing tool that manages a large number of test reports collected from various sources, including development teams, testing teams, and end users, who are regarded as crowdsourced workers. In the context of software maintenance, high severity typically corresponds to fatal errors and crashes, whereas the no-severity status is mostly assigned to cosmetic issues. However, Android test reports do not have severity labels in the current Android bug tracker system. We randomly selected 600 Android test reports and manually labeled their severity according to the rules defined for the bug repositories, as shown in Table 2.
The Eclipse and Mozilla bug repository datasets are obtained from Bugzilla bug-tracking system, which is a famous bug management platform. Clear guidelines exist regarding how to assign the severity of a bug. And, the severity of bug reports, which are manual labeled by the professional triager. Although, the triager may label the wrong severity of bug reports, due to the large number of bug reports. After the life-cycle of a bug report in Bugzilla bug-tracking system, the triager could change the true severity status of bug reports according to the developers’ comments. In order to ensure the severity status of bug reports are stable, we select the bug reports, which are submitted during the period of 1997–2008. The bug reports we studied originated from bug repositories in which the severity statuses are designated as trivial, minor, normal, major, critical, and blocker. Bugzilla also allows users to request features using the reporting mechanism in the form of a report with a “severity” enhancement. These reports are not considered in this study since they technically do not represent real bug reports. In our approach, we treat bugs with trivial and minor severities as non-severe, whereas reports with major, critical, and blocker severities are considered to represent severe bugs. Herraiz et al. [16] proposed a similar grouping of severities. In our study, the normal severity status is deliberately not considered. One reason for this is that such bugs represent a gray zone and hence might confuse the classifier. However, a more important reason is that in the cases we investigated, the “normal” severity was the default option for selecting the severity when reporting a bug, and we suspected that many reporters simply did not bother to consciously assess the bug severity. A manual sampling of the bug reports confirmed this suspicion. The training data obtained from the bug repositories is shown in Table 3.
Mozilla: (http://bugzilla.mozilla.org) Mozilla is an open-source software project that hosts several popular products, such as Firefox and Thunderbird. The copy of the bug database that we obtained contains all reports submitted during the period of 1997–2008, corresponding to approximately 400,000 reported bugs.
Eclipse: (http://bugs.eclipse.org/bugs) Eclipse is an open-source integrated development environment that is widely used in both open-source and industrial settings. The corresponding bug database contains over 200,000 bug reports submitted during the period of 2001–2008. Eclipse is a technical application used by developers themselves, so we expect the bug reports to be quite detailed and of “good” quality.
Our approach was implemented in the JAVA programming language for JDK 1.7 and executed on a machine with the following configuration: Intel® Pentium® CPU G645 processor @ 2.90 GHz, 6 G of RAM, running Windows 7. We used four classifiers, namely, Naïve Bayes (NB), K-Nearest Neighbor (KNN), Decision Tree (J48), and Support Vector Machines (SVM), as implemented in the Weka toolkit [17].
3.2. Evaluation Metrics
We now define the measures of correct classifications and misclassifications for the natural-language model. A true positive (TP) is a verified severe test report that is correctly classified by the model. A false positive (FP) is a verified non-severe test report that is incorrectly classified as a severe test report. A false negative (FN) is a verified severe test report that is incorrectly classified as a non-severe test report. A true negative (TN) is a verified non-severe test report that is correctly classified as a non-severe test report.
In information retrieval, natural language processing and classification problem, Precision is a measure of result relevancy, while Recall is a measure of how many truly relevant results are returned. Both Precision and Recall are therefore based on an understanding and measure of relevance. These quantities are also related to the F-measure, which is defined as the harmonic mean of Precision and Recall. When the results with high Recall but low Precision return many results, most of its predicted labels are incorrect when compared to the training labels. The results with high Precision but low Recall are just the opposite, returning very few results, but most of its predicted labels are correct when compared to the training labels. The results with high Precision and high Recall will return many results, with all results labeled correctly.
Accuracy: The accuracy of the model is the number of correct classifications divided by the total number of classifications. We define accuracy more formally as:
Precision: The precision is the percentage of bug reports predicted to be severe that are correctly predicted. We thus consider the precision for each severity status separately. More formally, we define the precision as follows:
Recall: The recall is the percentage of all severe bug reports that are correctly predicted to be severe. Here, we also consider the recall for each precision separately. More formally, we define the recall as follows:
F-measure: Usually, the precision and recall scores are not discussed in isolation. Instead, either the values of one measure are compared for a fixed value of the other measure, or both are combined into a single measure, such as the F-measure, which is the weighted harmonic mean of precision and recall. The F-measure has the property that if either the precision or the recall is low, the F-measure also decreases. In this case study, we define the F-measure such that recall and precision are equally weighted:
4. Experimental Results
In this section, the experimental results are discussed in relation to the specific research question.
RQ1: Can the IDR improve the accuracy of predicting the severity of android test reports?
In the first experiment, we compare the accuracy for each of selected components from Eclipse and Mozilla to predict the severity of android bug reports, as shown in Table 4. In this table here, we highlighted the best results in bold. The Project column and Product + Component column show the products and components, which we selected from the projects to predict the severity of android bug reports; and the other columns show the accuracy of predicting the severity of android test reports by the four classifiers and the four classifiers with our approach.
Table 4 shows the accuracy of using the Mozilla and Eclipse components to predict the severity of android bug reports. For example, for the UI component of the JDT product from the Eclipse project, the accuracy of NB classification to predict the severity of android test reports is 0.632, and the accuracy of NB classification with our approach (IDR + NB) to predict the severity of android test reports is 0.683. In addition, the average accuracy of NB classification for Eclipse to predict the severity of android test reports is 0.725, and the average accuracy of NB classification with our approach (IDR + NB) for Eclipse to predict the severity of android test reports is 0.758.
From these results, we indeed notice that for most of predicting the severity of android bug reports, the classifier with our approach is more accurate than the standard classifier. Also, the average accuracy of standard classifiers with our approach is higher than the standard classifier to predict the accuracy of android bug reports. In addition, in this table we can see that the NB classification with our approach (IDR + NB) has the highest accuracy of using Eclipse and Mozilla to predict the severity of android test reports. The classifiers based on SVM and KNN with our approach have an accuracy nearly as good as the NB classifier with our approach. Furthermore, we see that the J48 classifier is a less accurate approach.
We use two bug repository datasets (Eclipse, Mozilla) for knowledge transfer to predict the severity of Android test reports. However, the different expressions of the test reports with natural language and the different reliability of the crowdsourced worker, which may have caused the noise in the prediction of the severity of test reports. In this case, the number of high-quality bug reports for training is rather low and thus we are dealing with an insufficiently trained classifier, resulting naturally in poor accuracy. In order to solve this problem, our approach uses IDR strategy based on rough set for the extraction of characteristic keywords to reduce the noise. Firstly, we apply natural language processing (NLP) techniques to get feature keywords from the bug reports. And, we use a bunch of feature keywords to represent the bug reports and the severity of bug reports. Secondly, we use the feature keywords to build a decision information table. Finally, we use an IDR approach to the decision information table for keywords reduction. And, we could remove the redundant keywords and get the classification rules under without affecting the classification ability. This result shows that the NB classification with our approach (IDR + NB) is suitable for using two bug repository datasets (Eclipse, Mozilla) for knowledge transfer to predict the severity of Android test reports.
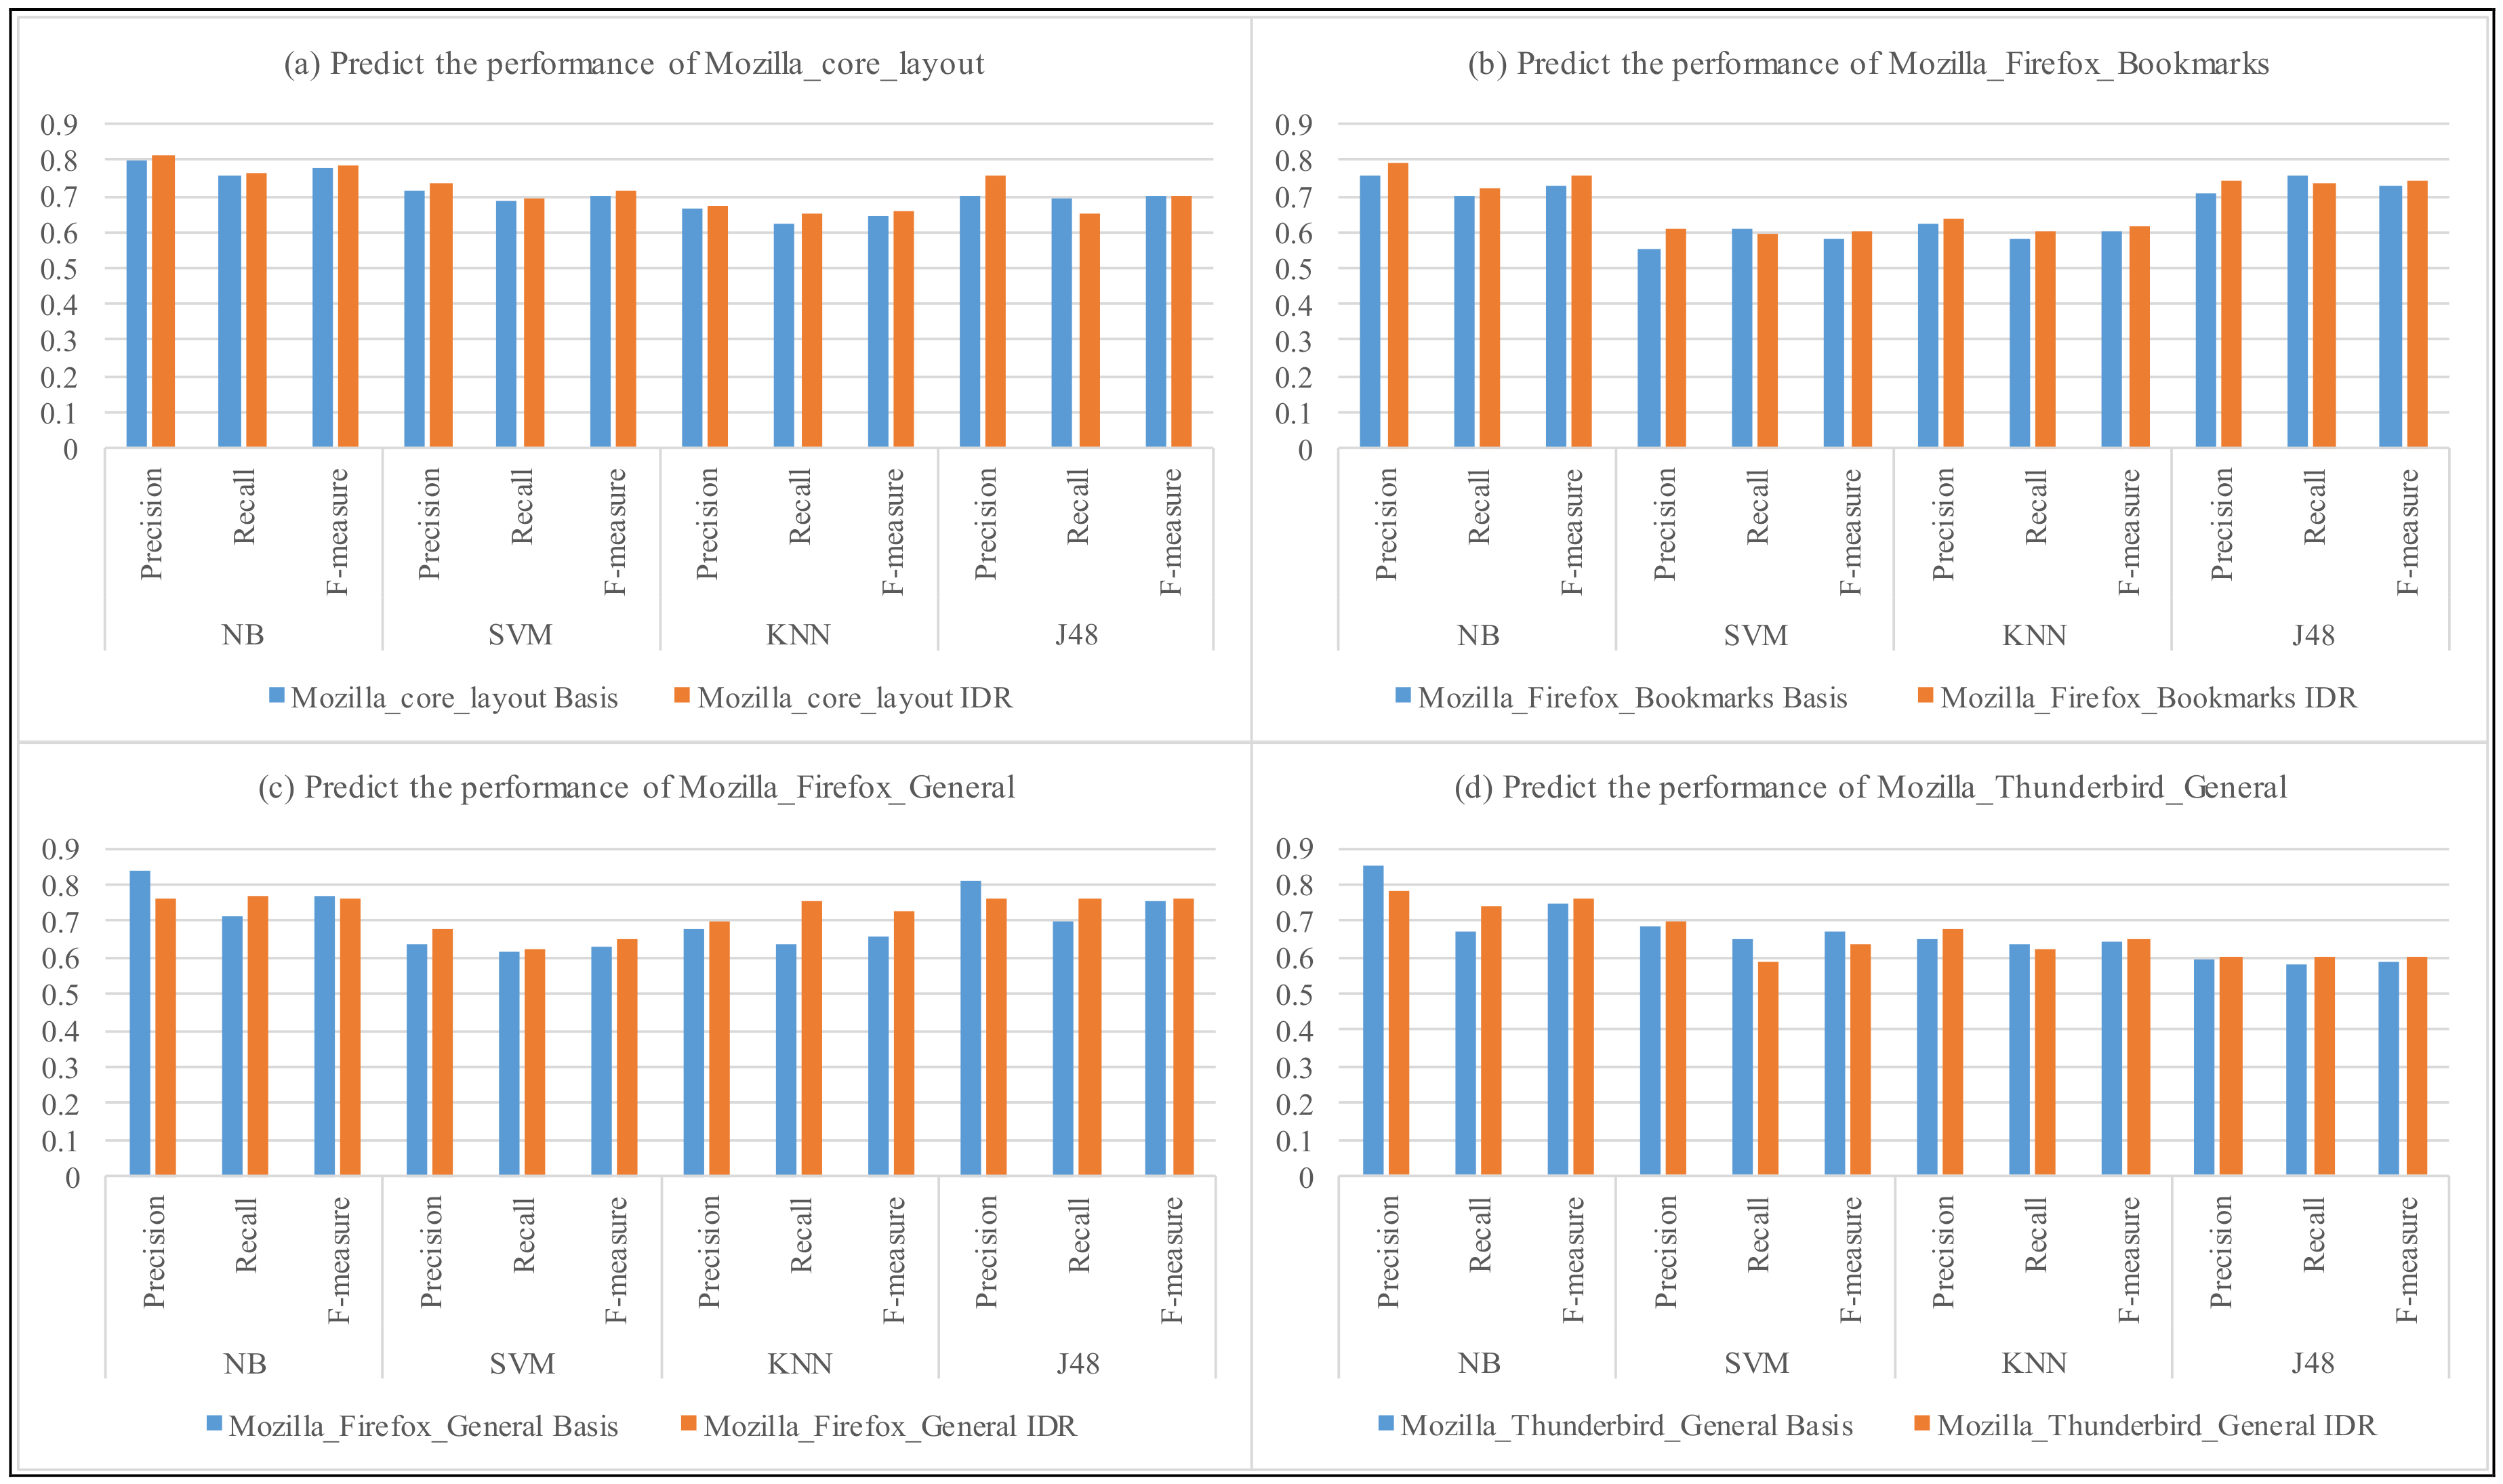
RQ2: what is the performance of our approach (IDR)?
In Figure 3 and Figure 4, we compare the precision and recall for each of selected components from Eclipse and Mozilla to predict the severity of Android bug reports. The vertical axis represents the precision and recall of predicting the severity of Android bug reports by the four classifiers and the four classifiers with our approach (IDR). The horizontal axis represents the results of classifiers (Basic) and the four classifiers with our approach (IDR), respectively.
As we see in Figure 3 and Figure 4, the precision and recall of using the Mozilla and Eclipse components to predict the severity of android bug reports are similar, where we note that both the four classifiers and the four classifiers with our approach vary between the values 0.58–0.85. For example, for component Layout of Core product, in Figure 4a, the precision and recall of NB classification to predict the severity of android test reports is 0.801 and 0.755, respectively; and the precision and recall of NB classification with our approach (IDR + NB) to predict the severity of android test reports is 0.812 and 0.763. In addition, the F-measure of NB classification for Eclipse to predict the severity of android test reports is 0.777, and the F-measure of NB classification with our approach (IDR + NB) for Eclipse to predict the severity of Android bug reports is 0.787. The average F-measure of NB, SVM, KNN, J48 classifiers to predict the severity of Android bug reports is 0.712, 0.661, 0.621, 0.654, respectively. And, the average F-measure of the four classifiers with our approach is 0.725, 0.674, 0.648, 0.671, respectively.
From these results, we indeed notice that the classifier with our approach is more effective than the standard classifier for the most cases. Meanwhile, the average performance of the four classifiers with our approach are all higher than the four classifiers. The results show that our approach could reduce the noise in the bug reports, and, consequently, enhance the training data and model quality.
The general way of calculating the accuracy is by calculating the percentage of bug reports from the evaluation set that are correctly classified. Similarly, Precision and Recall are widely used as evaluation measures.
However, these measures are not fit when dealing with data that has an unbalanced category distribution because of the dominating effect of the major category. Furthermore, most classifiers also produce probability estimations of their classifications. These estimations also contain interesting evaluation information but unfortunately are ignored when using the standard Accuracy, Precision, and Recall approaches [18].
The Receiver Operating Characteristic (ROC) was used as an evaluation method as this is a better way for not only evaluating classifier accuracy, but also for easier comparison of different classification algorithms [19]. However, comparing curves visually can be a cumbersome activity, especially when the curves are close together. Therefore, the area beneath the ROC curve is calculated which serves as a single number expressing the accuracy. If the Area Under Curve (AUC) is close to 0.5 then the classifier is practically random, whereas a number close to 1.0 means that the classifier makes practically perfect predictions. This number allows more rational discussions when comparing the accuracy of different classifiers [20].
The same conclusions can also be drawn from the other selected cases based on an analysis of the Area Under Curve measures in Table 5. In this table here, we highlighted the best results in bold. From these results, we indeed notice that the NB classifier with our approach (IDR + NB) is the most accurate to predict the severity of android test reports.
In addition, Table 5 shows that the AUC values of IDR + NB using Eclipse components to predict the severity of android test reports is 0.758, 0.739, 0.647, and 0.66, respectively. And, the AUC for all Eclipse components are approximately 0.701. The AUC values of IDR + NB using Mozilla components to predict the severity of android test reports is 0.778, 0.725, 0.647, 0.621, respectively. We notice an improvement with the Mozilla components where we observe an AUC of approximately 0.72. In this case, this means that our approach performs around 22% better than if we would randomly guess the severity of each bug.
Therefore, we conclude that our approach efficiently obtains training data from bug repositories and uses knowledge transfer to predict the severity of Android test reports, which is based on the provided information, particularly the one-line summary using the NB classifier with our approach (IDR + NB). The accuracy of the approach is reasonable, yet it depends on the case.
5. Related Work
5.1. Automatic Bug Classification in Software Engineering
Issue reports are valuable resources during software maintenance activities. Automated support for issue report classification can facilitate understanding, resource allocation, and planning. Menzies and Marcus [21] proposed a new approach for extracting general conclusions from PITS data based on text mining and machine learning methods, which are low cost, automatic, and rapid. They designed and built a tool named SEVERIS (SEVERity Issue assessment) to automatically review issue reports and alert when a proposed severity is anomalous. The way SEVRIS is built provides the probabilities that the assessment is correct. These probabilities can be used to guide decision making in this process. Tian et al. [5] proposed a framework named DRONE (PreDicting PRiority via Multi-Faceted FactOrs ANalysEs) to predict the priority levels of bug reports in Bugzilla. They consider multiple factors including: temporal, textual, author, related-report, severity, and product. These features are then fed to a classification engine named GRAY (ThresholdinG and Linear Regression to ClAssifY Imbalanced Data) built by combining linear regression with a thresholding approach to address the issue with imbalanced data and to assign priority labels to bug reports. Wang et al. [6] proposed an approach using both natural language information and execution information in the detection of duplicate bug reports. They basic idea is as follows. First, based on information retrieval, we calculate two similarities between the new bug report and each existing bug report using natural language information and execution information, respectively. Second, we use some heuristics to determine the suggested list using the preceding similarities. Zanetti et al. [22] proposed a method of classifying valid bug reports based on nine measures quantifying the social embeddedness of bug reporters in the collaboration network. Zhou et al. [7] proposed a hybrid approach of combining text mining and data mining techniques of bug report data to identify corrective bug reports. This way could reduce the noise of misclassification (i.e., filtering bug reports that are not corrective) and support better performance of bug prediction. Their work is essentially a multi-stage classification approach—a particular kind of ensemble learning techniques—composed by a set of specific learning algorithms with the aim of outperforming the constituent individual ones. Wang et al. [23] proposed a hybrid approach by combining both text mining and data mining techniques of bug report data to automate the prediction process. The first stage leverages text mining techniques to analyze the summary parts of bug reports and classifies them into three levels of probability. The extracted features and some other structured features of bug reports are then fed into the machine learner in the second stage. Data grafting techniques are employed to bridge the two stages. Mao et al. [24] proposed a content-based recommendation technique to automatically match tasks and developers. The approach learns particular interests from registration history and mines winner history to favor appropriate developers. Yu et al. [25] used neural networks to predict the priority of bug reports. Their technique also employs a reused data set from similar systems to accelerate the evolutionary training phase. Antoniol et al. also applied text mining techniques to the descriptions of reported bugs to predict whether a report represented a real bug or a feature request [26]. They used techniques such as decision trees and logistic regression as well as a Naïve Bayes classifier for this purpose. Menzies et al. predicted bug severity based on a rule learning technique that also used the textual descriptions of reported bugs [27]. Their approach was applied to five projects supplied by NASA’s Independent Verification and Validation Facility. Hooimeijer et al. [28] established a predictive model for identifying high-quality bug reports. In their model, they consider a bug report to be of high quality when the bug is repairable within a given timeframe. This predictive model can effectively differentiate between high-quality and low-quality bug reports by extracting descriptive information regarding the bug report, product, operating system, and report submitter. When there are a large number of redundant bug reports in a repository, redundant bug reports can overburden developers (primarily potential fix developers), delay project schedules, and increase project costs. Runeson et al. [29] proposed a redundancy detection method based on information retrieval technology. This method treats each bug report as a document, and returns a batch of reports that are similar to the current report by calculating the similarity between the current report and the existing reports. Sun et al. [30] proposed a new approach to detecting duplicate bug reports by building a discriminative model that answers the question “Are two bug reports duplicates of each other”? The model would report a score on the probability of A and B being duplicates. This score is then used to retrieve similar bug reports from a bug report repository for user inspection. We have investigated the utility of our approach on 3 sizable bug repositories from 3 large open-source applications including OpenOffice, Firefox, and Eclipse. Subsequently, Sun et al. [31] proposed a multi-feature information retrieval model that can continue to match the most similar features of reports between which a similarity has been detected, thereby effectively identifying redundant reports by obtaining additional information from them.
5.2. Crowdsourced Software Testing
Crowdsourcing techniques are widely used in industrial software testing and have gained popularity in usability testing, localization testing, GUI testing, user-experience testing, and stress & performance testing. Mao et al. conducted a comprehensive survey on crowdsourced software engineering [1]. Chen and Kim [32] applied crowdsourced testing to test case generation. They investigated the object mutation and constraint solving issues underlying existing test generation tools, and based on their findings, they developed a puzzle-based automatic testing environment. Musson et al. [33] proposed an approach in which crowd workers were used to measure the real-world performance of software products. The approach was demonstrated for a case study of the Lync communication tool at Microsoft. In Ref. [34], a deterministic automaton is presented with the purpose of automatic detection of hesitation, which qualifies it to be applied in different computational platforms, including tablets and smartphones. Besides, it does not require obstructive sensors because user’s movements are gathered and processed by means of traditional interfaces. Adams et al. [35] proposed MoTIF for the detection and reproduction of context-related crashes in mobile apps after their deployment in the wild. All of the studies listed above used crowdsourced testing to solve various problems in traditional software testing activities. By contrast, the intent of our approach is to solve a newly encountered problem in crowdsourced testing. Liu et al. [36] investigated both methodological differences and empirical contrasts between crowdsourced usability testing and traditional face-to-face usability testing. To solve the oracle problem, Pastore et al. [37] applied the crowdsourcing technique to generate test inputs depending on a test oracle that required human input in one form or another. Dolstra et al. [2] used virtual machines to run the system under test to enable crowd workers to perform expensive and semi-automatic GUI testing tasks. By means of crowdsourced testing, Nebeling et al. [38] conducted an experiment to evaluate the usability of web sites and web-based services, and the results showed that crowdsourced testing is an effective method of validating web interfaces. Feng et al. [8] proposed a novel test report prioritization method, DivRisk, to reduce the cost of inspection in crowdsourced testing. The keywords are extracted from test reports by using NLP techniques. These keywords construct a keyword vector model KV. They calculate the risk vector RV based on KV to predict failure risk of tests. We construct the distance matrix DM based on KV to design the diversity strategy for prioritization. The risk strategy and the diversity strategy are combined to a hybrid strategy, DivRisk, to fulfill effective test report prioritization. Three crowdsourced testing projects from industry have been used to evaluate the effectiveness of test report prioritization methods. The results of empirical study encourage us to use DivRisk for test report prioritization in practice, especially for mobile application testing. They also provide guidelines to extend our prioritization methods to deal with test reports written in other languages. In their subsequent article, Feng et al. [39] proposed a novel technique for prioritizing test reports for inspection by software developers in which image-understanding techniques are used in combination with traditional text-based techniques, specifically for the crowdsourced testing of mobile applications. They proposed prioritization approaches based on text descriptions, screenshot images, and a combination of both sources of information. Wang et al. [10] proposed a cluster-based classification approach for effectively classifying crowdsourced reports when plentiful training data are available. However, sufficient training data often are not available. Subsequently, Wang et al. [11] proposed an approach called Local-based Active Classification (LOAF) to address the two main challenges facing the automation of crowdsourced test report classification, i.e., the local bias problem and the lack of labeled historical data.
The purpose of our work is to classify test reports generated via crowdsourced testing, which differs from the focus of the aforementioned studies in two ways. First, Android bug reports are not tagged with their degree of severity and thus require manual effort to label, leading to a heavy workload. In this sense, classifying these reports is a more valuable task but also poses more challenges. Second, in the aforementioned studies, the classification and the verification of the classification results were both performed based on the same project. By contrast, our approach involves obtaining training data from various other bug repositories and using knowledge transfer to predict the severity of Android test reports. In other words, the bug reports from the other bug repositories are used as the training data, and the Android test reports are used as the evaluation data. Our proposed approach can effectively reduce the burden of manual labeling while still being able to achieve good performance.
6. Threats to Validity
In this part, we discuss some potential threats to the validity of our experiment based on the guidelines proposed in [40].
- Conclusion Validity: Since we use the bug reports submitted by the community both as training data, it is not guaranteed that the severities in these reports are entered correctly. Users fill in the reports according to their understanding and therefore assess severities corresponding to their experience, which does not necessarily correspond with the guidelines. We explicitly omitted the bugs reported with severity “normal” since this category corresponded to the default option when submitting a bug and thus likely to be unreliable [20]. In addition, we manually labeled their severity according to the rules defined for the bug repositories. Then, we use the majority vote to ensure the severity of Android bug reports. Finally, we selected the Android bug reports to relabel because the labeling results of Android bug reports are vary widely. The tools we used to process the data might contain errors. We implemented our approach using the widely used open-source data mining tool WEKA (http://www.cs.waikato.ac.nz/ml/weka/).
- Internal Validity: Our approach relies heavily on the presence of a causal relationship between the contents of the fields in the bug report and the severity of the bug. There is empirical evidence that this causal relationship indeed holds [4]. We only use the short summary descriptions of the test report to build our classifiers, without including other features of bug reports (e.g., the product of the bug report). However, we will consider adding the others’ features to investigate the influence of these features on model performance.
- Construct Validity: We have trained our classifier for each component, assuming that special terminology used for each component will result in a better prediction. However, bug reporters have confirmed that providing the “component” field in a bug report is notoriously difficult [21], hence we risk that the users interpreted these categories in different ways than intended. We alleviated the risk by selecting those components with a significant number of bug reports. In addition, we use standard metrics used in classification and prediction, namely: precision, recall, and F-measure. These measures have been used before by Menzies and Marcus to evaluate SEVERIS [27].
- External Validity: In this study, we focused on the bug reports of two software projects: Eclipse and Mozilla. Like in other empirical studies, the results obtained from our presented approach are therefore not guaranteed to hold with other software projects. However, we selected the cases to represent worthwhile points in the universe of software projects, representing sufficiently different characteristics to warrant comparison. For instance, Eclipse was selected because its user base exists mostly of developers hence it is likely to have “good” bug reports. Our experimental evaluation data consisted of randomly selected test reports from the Android bug tracker system. We cannot assume a priori that the results of our study can be generalized beyond the environment in which it was conducted. However, the diverse nature of the projects and the size of the datasets somewhat reduce this risk.
7. Conclusions and the Further Work
A critical item of a bug report is the so-called “severity”, and consequently tool support for the person reporting the bug in the form of a recommender or verification system is desirable. In this paper, we propose a Knowledge Transfer Classification (KTC) approach based on text mining and machine learning methods. Our approach obtains training data from bug repositories and uses knowledge transfer to predict the severity of Android test reports. Keywords are extracted from the test reports using NLP techniques. Thus, KV may contain a large number of keyword dimensions and considerable noise. To solve this problem, we propose an Importance Degree Reduction (IDR) strategy based on rough set for the extraction of characteristic keywords to obtain more accurate reduction results. Experimental results indicate that the proposed KTC method can be used to accurately predict the severity of Android test reports.
This paper compares four well-known document classification algorithms (namely, Naïve Bayes (NB), K-Nearest Neighbor (KNN), Decision Tree (J48), and Support Vector Machines (SVM)) to find out which particular algorithm is best suited for classifying Android bug reports in either a “severe” or a “non-severe” category. We found out that for the cases under investigation, the average accuracy of predicting the Android bug reports severity by classifiers is 0.715, 0.716, 0.721, 0.659, respectively. However, the average accuracy of predicting the Android bug reports severity by classifiers with our approach (IDR) is 0.735, 0.731, 0.734, 0.663, respectively. The results shown that our approach (IDR) could be beneficial for predicting the severity of Android bug reports. Therefore, the NB classifier with our approach (IDR + NB) is the most suitable for predicting Android bug report severity.
Future work is aimed at including additional sources of data to support our predictions. Information from the (longer) description will be more thoroughly preprocessed so that it can be used for the predictions. Also, we will investigate other cases, where fewer bug reports get submitted but where the bug reports get reviewed consciously. Meanwhile, we may use topic model to label the severity of Android bug reports.
Acknowledgments
This work is supported by the National Natural Science Foundation of China (No. 61672122, No. 61402070, No. 61602077, No.61771087), the Natural Science Foundation of Liaoning Province of China (No. 2015020023), the Educational Commission of Liaoning Province of China (No. L2015060) and the Fundamental Research Funds for the Central Universities (No. 3132016348).
Author Contributions
Shikai Guo conceived the research subject and background, Rong Chen contributed to the two revisions of original evidences, Hui Li contributed on the knowledge transfer classification approach and carried out the experiments. All authors have read and approved the final manuscript.
Conflicts of Interest
The authors declare no conflict of interest.
References
- Mao, K.; Capra, L.; Harman, M.; Jia, Y. A Survey of the Use of Crowdsourcing in Software Engineering; Technical Report RN/15/01; Department of Computer Science, University College London: London, UK, 10 May 2015. [Google Scholar]
- Dolstra, E.; Vliegendhart, R.; Pouwelse, J. Crowdsourcing gui tests. In Proceedings of the 2013 IEEE Sixth International Conference on Software Testing, Verification and Validation (ICST), Luxembourg, 18–22 March 2013; pp. 332–341. [Google Scholar]
- Google Code. Available online: https://code.google.com (accessed on 16 August 2017).
- Ko, A.J.; Myers, B.A.; Chau, D.H. A linguistic analysis of how people describe software problems. In Proceedings of the Visual Languages and Human-Centric Computing, Brighton, UK, 4–8 September 2006; pp. 127–134. [Google Scholar]
- Tian, Y.; Lo, D.; Sun, C. Drone: Predicting priority of reported bugs by multi-factor analysis. In Proceedings of the 29th IEEE International Conference on Software Maintenance (ICSM 2013), Eindhoven, The Netherlands, 22–28 September 2013; pp. 200–209. [Google Scholar]
- Wang, X.; Zhang, L.; Xie, T.; Anvik, J.; Sun, J. An approach to detecting duplicate bug reports using natural language and execution information. In Proceedings of the 30th International Conference on Software Engineering (ICSE 2008), Leipzig, Germany, 10–18 May 2008; pp. 461–470. [Google Scholar]
- Zhou, Y.; Tong, Y.; Gu, R.; Gall, H. Combining text mining and data mining for bug report classification. In Proceedings of the 30th IEEE International Conference on Software Maintenance (ICSM 2014), Victoria, BC, Canada, 29 September–3 October 2014; pp. 311–320. [Google Scholar]
- Feng, Y.; Chen, Z.; Jones, J.A.; Fang, C.; Xu, B. Test report prioritization to assist crowdsourced testing. In Proceedings of the 10th Joint Meeting of the European Software Engineering Conference and the ACM SIGSOFT Symposium on The Foundations of Software Engineering (FSE 2015), Bergamo, Italy, 30 August–4 September 2015; pp. 225–236. [Google Scholar]
- Kao, A.; Poteet, S.R. Natural Language Processing and Text Mining; Springer Science & Business Media: Berlin/Heidelberg, Germany, 2007. [Google Scholar]
- Wang, J.; Cui, Q.; Wang, Q.; Wang, S. Towards effectively test report classification to assist crowdsourced testing. In Proceedings of the ACM/IEEE International Symposium on Empirical Software Engineering and Measurement (ESEM 2016), Ciudad Real, Spain, 8–9 September 2016. [Google Scholar]
- Wang, J.; Wang, S.; Cui, Q.; Wang, Q. Local-Based Active Classification of Test Report to Assist Crowdsourced Testing. In Proceedings of the 31st IEEE/ACM International Conference on Automated Software Engineering, Singapore, 3–7 September 2016; pp. 190–201. [Google Scholar]
- Porter, M.F. An algorithm for suffix stripping. Program 1980, 14, 130–137. [Google Scholar] [CrossRef]
- Wang, G.Y. Calculation Methods for Core Attributes of Decision Table. Chin. J. Comput. 2003, 26, 611–615. [Google Scholar]
- Pawlak, Z. Rough Sets-Theoretical Aspects of Reasoning about Data; Kluwer Academic Publishers: Dordrecht, The Netherlands, 1991; pp. 11–52. [Google Scholar]
- Lei, S.; Weng, M.; Ma, X.M.; Xi, L. Rough Set Based Decision Tree Ensemble Algorithm for Text Classification. J. Comput. Inf. Syst. 2010, 6, 89–95. [Google Scholar]
- Herraiz, I.; German, D.M.; Gonzalez-Barahona, J.; Robles, G. Towards a Simplification of the Bug Report Form in Eclipse. In Proceedings of the 5th International Working Conference on Mining Software Repositories, Leipzig, Germany, 10–11 May 2008; pp. 145–148. [Google Scholar]
- Weka. Available online: http://www.cs.waikato.ac.nz/ml/weka/ (accessed on 16 August 2017).
- Weng, C.G.; Poon, J. A new evaluation measure for imbalanced datasets. In Proceedings of the Seventh Australasian Data Mining Conference, Glenelg, Australia, 27–28 November 2008; Volume 87, pp. 27–32. [Google Scholar]
- Ling, C.; Huang, J.; Zhang, H. Auc: A better measure than accuracy in comparing learning algorithms. In Advances in Artificial Intelligence; Lecture Notes in Computer Science; Xiang, Y., Chaib-draa, B., Eds.; Springer: Berlin/Heidelberg, Germany, 2003; Volume 2671, p. 991. [Google Scholar]
- Ahmed, L.; Serge, D.; David, S.Q.; Tim, V. Comparing mining algorithms for predicting the severity of a reported bug. In Proceedings of the European Conference on Software Maintenance and Reengineering, Oldenburg, Germany, 1–4 March 2011; pp. 249–258. [Google Scholar]
- Bettenburg, N.; Just, S.; Schröter, A.; Weiss, C.; Premraj, R.; Zimmermann, T. What makes a good bug report? In Proceedings of the 16th ACM SIGSOFT International Symposium on Foundations of Software Engineering, Atlanta, GA, USA, 9–14 November 2008; pp. 308–318. [Google Scholar]
- Zanetti, M.S.; Scholtes, I.; Tessone, C.J.; Schweitzer, F. Categorizing bugs with social networks: A case study on four open source software communities. In Proceedings of the International Conference on Software Engineering (ICSE 2013), San Francisco, CA, USA, 18–26 May 2013; pp. 1032–1041. [Google Scholar]
- Wang, S.; Zhang, W.; Wang, Q. FixerCache: Unsupervised caching active developers for diverse bug triage. In Proceedings of the International Symposium on Empirical Software Engineering and Measurement (ESEM 2014), Torino, Italy, 18–19 September 2014. [Google Scholar]
- Mao, K.; Yang, Y.; Wang, Q.; Jia, Y.; Harman, M. Developer recommendation for crowdsourced software development tasks. In Proceedings of the IEEE Symposium on Service-Oriented System Engineering (SOSE 2015), San Francisco Bay, CA, USA, 30 March–3 April 2015; pp. 347–356. [Google Scholar]
- Yu, L.; Tsai, W.T.; Zhao, W.; Wu, F. Predicting defect priority based on neural networks. In Proceedings of the Advanced Data Mining and Applications—6th International Conference Lecture (ADMA 2010), Chongqing, China, 19 November 2010; pp. 356–367. [Google Scholar]
- Antoniol, G.; Ayari, K.; di Penta, M.; Khomh, F.; Guéhéneuc, Y.-G. Is it a bug or an enhancement? A text based approach to classify change requests. In Proceedings of the CASCON ’08 Conference of the Center for Advanced Studies on Collaborative Research, Richmond Hill, ON, Canada, 27–30 October 2008; ACM: New York, NY, USA, 2008; pp. 304–318. [Google Scholar]
- Menzies, T.; Marcus, A. Automated severity assessment of software defect reports. In Proceedings of the IEEE International Conference on Software Maintenance (ICSM 2008), Beijing, China, 28 September–4 October 2008; pp. 346–355. [Google Scholar]
- Hooimeijer, P.; Weimei, W. Modeling bug report quality. In Proceedings of the 22nd IEEE/ACM International Conference on Automated Software Engineering (ASE), Atlanta, GA, USA, 5–9 November 2007; pp. 34–43. [Google Scholar]
- Runeson, P.; Alexandersson, M.; Nyolm, O. Detection of duplicate defect reports using natural language processing. In Proceedings of the International Conference on Software Engineering (ICSE), Minneapolis, MN, USA, 20–26 May 2007; pp. 499–510. [Google Scholar]
- Sun, C.; Lo, D.; Wang, X.; Jiang, J.; Khoo, S.C. A discriminative model approach for accurate duplicate bug report retrieval. In Proceedings of the 32nd International Conference on Software Engineering (ICSE), Cape Town, South Africa, 1–8 May 2010; pp. 45–54. [Google Scholar]
- Sun, C.; Lo, D.; Khoo, S.C.; Jiang, J. Towards more accurate retrieval of duplicate bug reports. In Proceedings of the 26th IEEE/ACM International Conference on Automated Software Engineering (ASE), Lawrence, KS, USA, 6–10 November 2011; pp. 253–262. [Google Scholar]
- Chen, N.; Kim, S. Puzzle-based automatic testing: Bringing humans into the loop by solving puzzles. In Proceedings of the 27th IEEE/ACM International Conference on Automated Software Engineering (ASE 2012), Essen, Germany, 3–7 September 2012; pp. 140–149. [Google Scholar]
- Musson, R.; Richards, J.; Fisher, D.; Bird, C.; Bussone, B.; Ganguly, S. Leveraging the crowd: How 48,000 users helped improve lync performance. IEEE Softw. 2013, 30, 38–45. [Google Scholar] [CrossRef]
- Gomide, V.H.M.; Valle, P.A.; Ferreira, J.O.; Barbosa, J.R.G.; da Rocha, A.F.; Barbosa, T. Affective crowdsourcing applied to usability testing. Int. J. Comput. Sci. Inf. Technol. 2014, 5, 575–579. [Google Scholar]
- Gomez, M.; Rouvoy, R.; Adams, B.; Seinturier, L. Reproducing context-sensitive crashes of mobile apps using crowdsourced monitoring. In Proceedings of the IEEE/ACM International Conference on Mobile Software Engineering and Systems (MOBILESoft), Austin, TX, USA, 16–17 May 2016; pp. 88–99. [Google Scholar]
- Liu, D.; Bias, R.G.; Lease, M.; Kuipers, R. Crowdsourcing for usability testing. Proc. Am. Soc. Inf. Sci. Technol. 2012, 49, 1–10. [Google Scholar] [CrossRef]
- Pastore, F.; Mariani, L.; Fraser, G. Crowdoracles: Can the crowd solve the oracle problem? In Proceedings of the 2013 IEEE Sixth International Conference on Software Testing, Verification and Validation (ICST), Luxembourg, 18–22 March 2013; pp. 342–351. [Google Scholar]
- Nebeling, M.; Speicher, M.; Grossniklaus, M.; Norrie, M.C. Crowdsourced web site evaluation with crowdstudy. In Proceedings of the 12th International Conference on Web Engineering, Berlin, Germany, 23–27 July 2012; pp. 494–497. [Google Scholar]
- Feng, Y.; Chen, Z.; Jones, J.A.; Fang, C. Multi-objective Test Report Prioritization using Image Understanding. In Proceedings of the 31st IEEE/ACM International Conference on Automated Software Engineering, Singapore, 3–7 September 2016; pp. 202–213. [Google Scholar]
- Wohlin, C.; Runeson, P.; Host, M.; Ohlsson, M.C.; Regnell, B.; Wesslen, A. Experimentation in Software Engineering; Springer: Berlin/Heidelberg, Germany, 2012. [Google Scholar]
Figure 1.
The framework for predicting the severity of test reports.

Figure 2.
The workflow of the KTC Model to predict the severity of test reports.
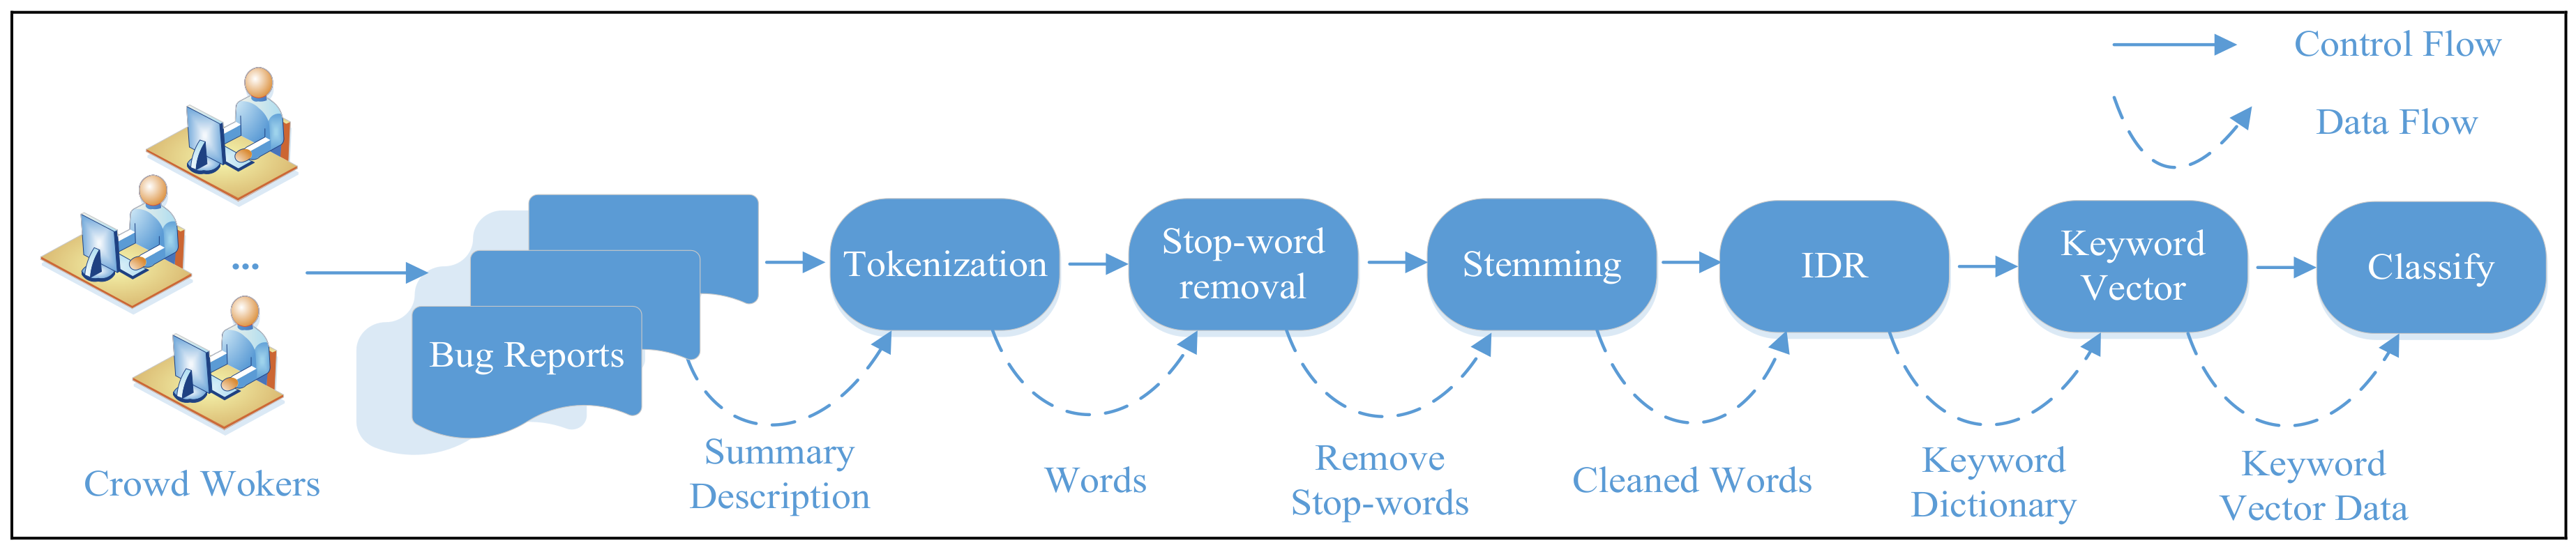
Figure 3.
The performance of predicting bug severity with the Eclipse project.
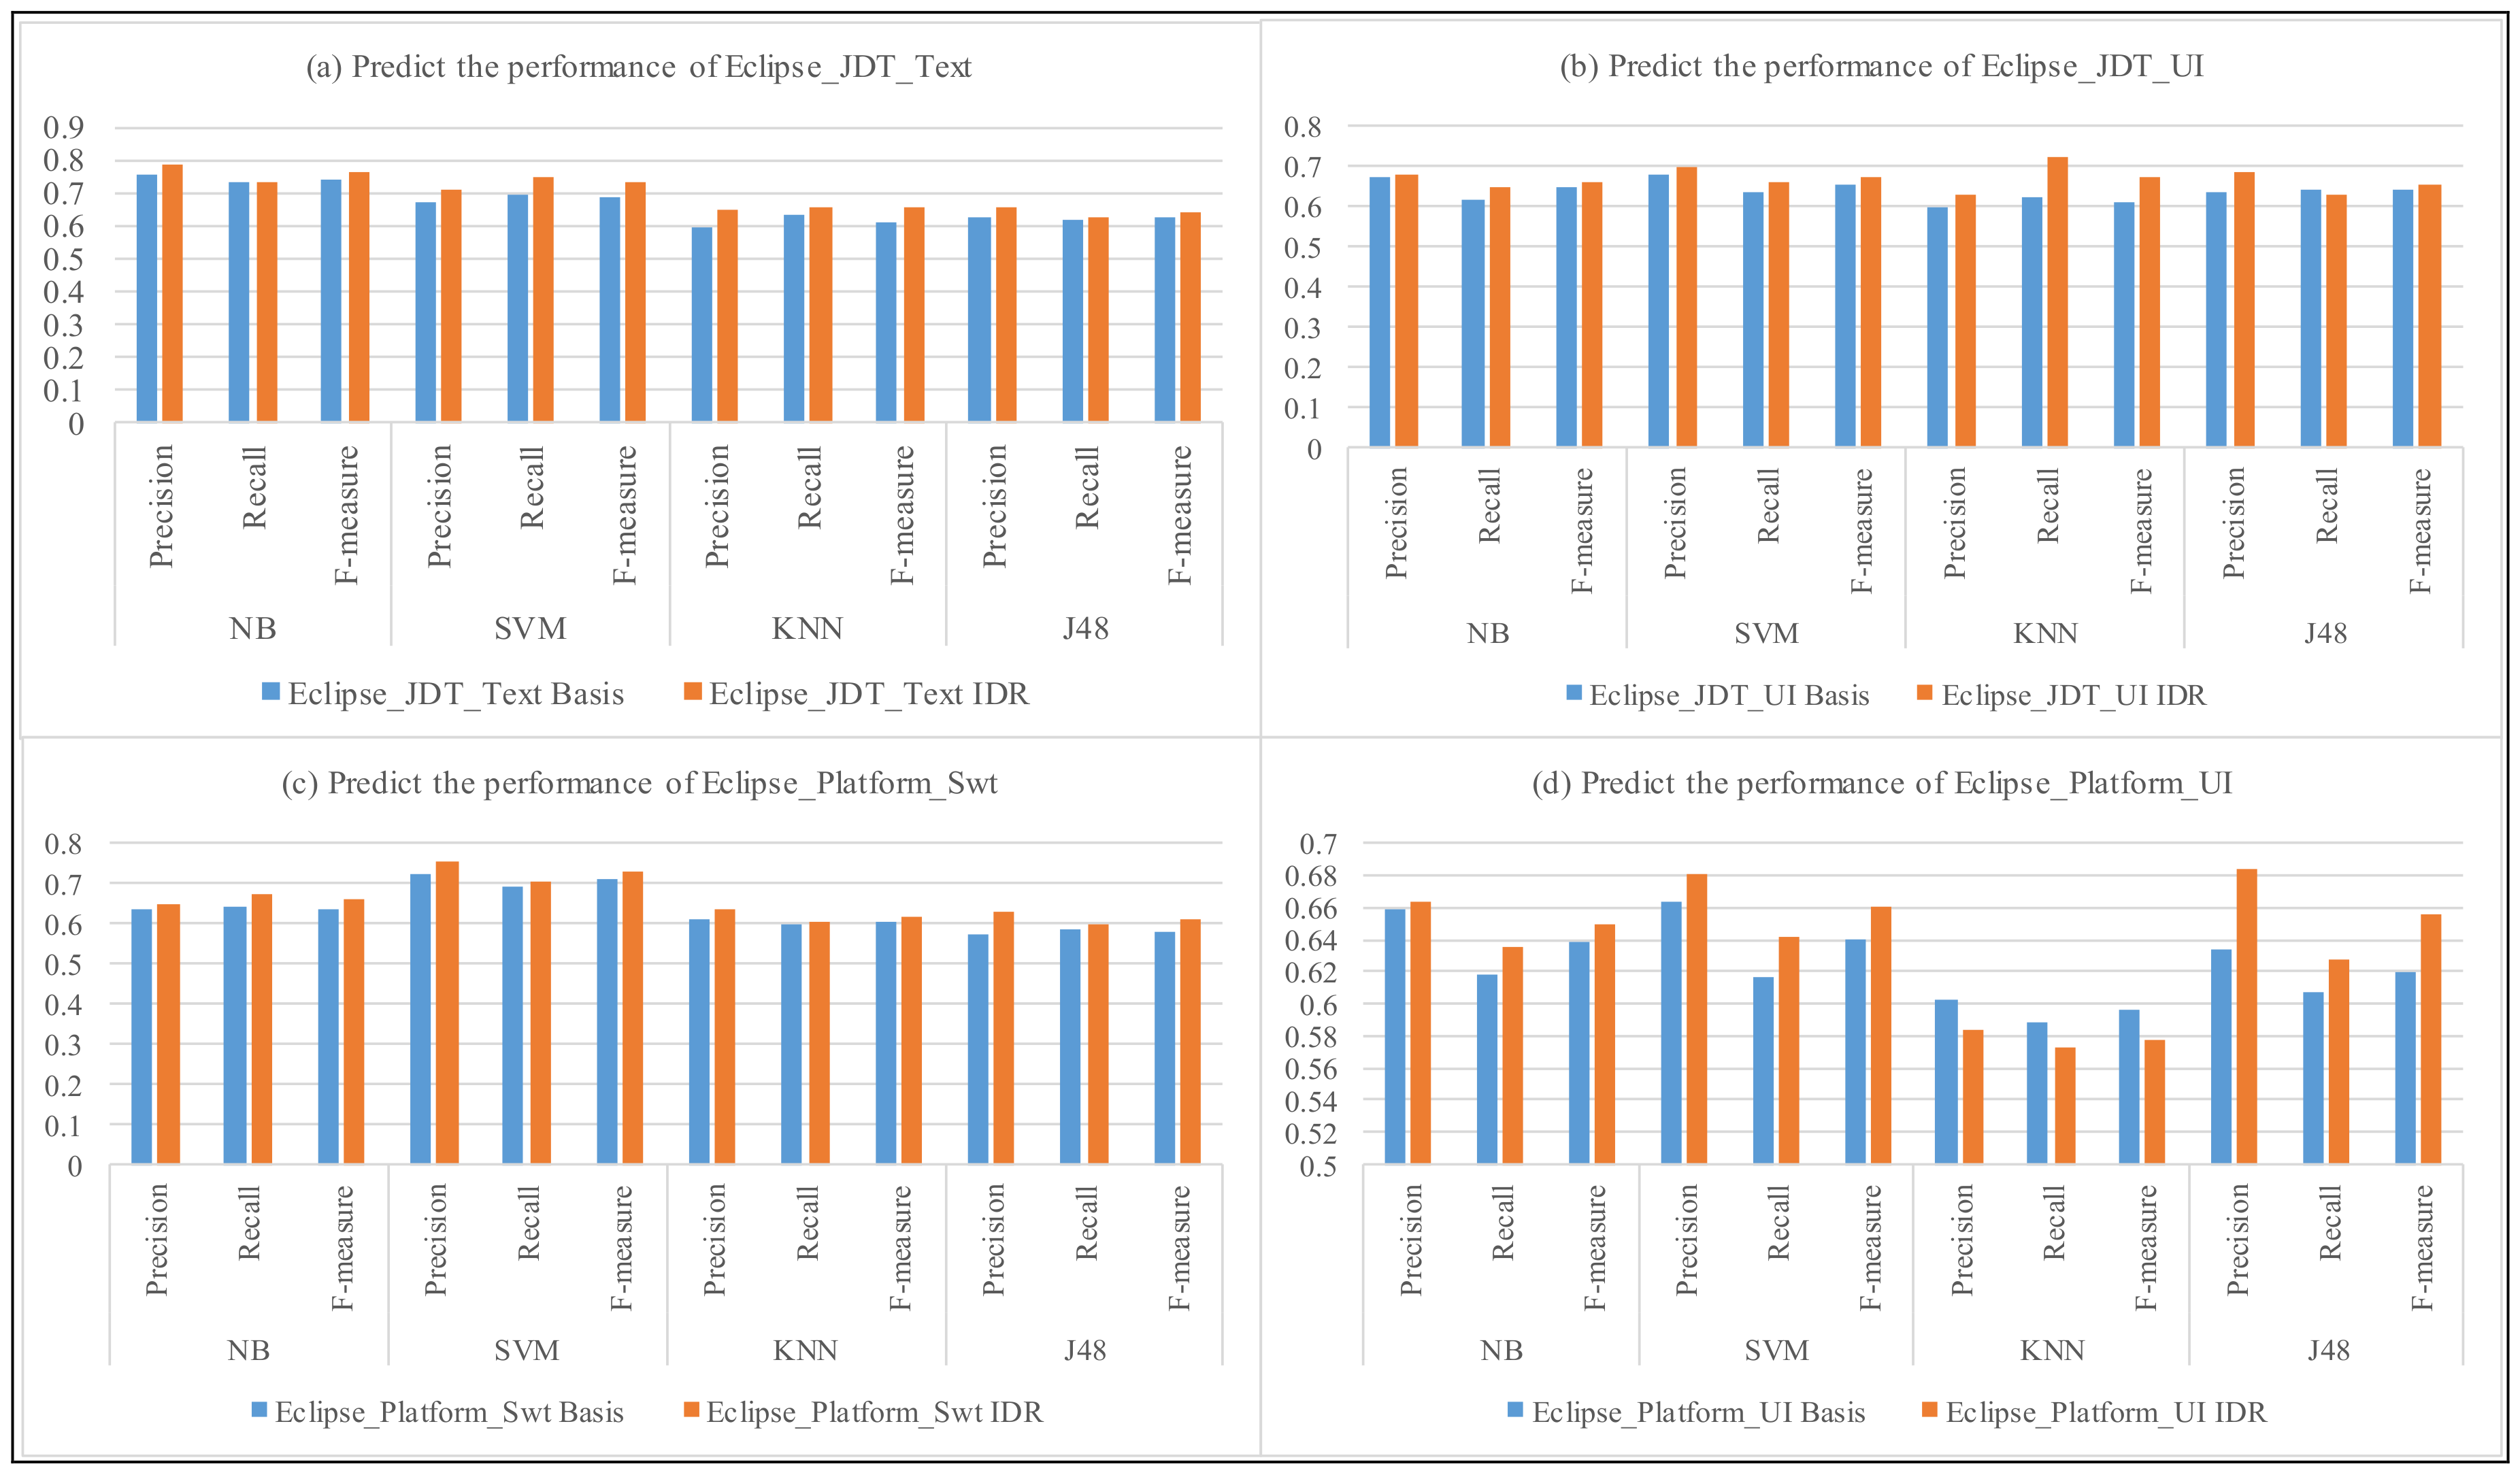
Figure 4.
The performance of predicting the severity with Mozilla project.


Table 1.
Effects of the preprocessing steps.
| Summary Description | Android Studio crashes upon launch on Linux |
| After stop-words removal | Android Studio crashes launch Linux |
| After stemming | android studio crash launch linux |
Table 2.
The evaluation data of android test reports.
| Project | Non-Severe Bugs | Severe Bugs |
|---|---|---|
| Android | 289 | 311 |
Table 3.
The training data obtained from the bug repositories.
| Project | Product-Component | Non-Severe Bugs | Severe Bugs |
|---|---|---|---|
| Eclipse | Platform-UI | 1173 | 2982 |
| JDT-UI | 1216 | 1436 | |
| JDT-Text | 712 | 515 | |
| Platform-SWT | 521 | 2565 | |
| Mozilla | Core-Layout | 960 | 2747 |
| Firefox-General | 2142 | 6378 | |
| Firefox-Bookmarks | 511 | 656 | |
| Thunderbird-General | 313 | 1268 |
Table 4.
The accuracy of predicting the severity with different project.
| Project | Product + Component | NB | IDR + NB | SVM | IDR + SVM | KNN | IDR + KNN | J48 | IDR + J48 |
|---|---|---|---|---|---|---|---|---|---|
| Eclipse | JDT_Text | 0.717 | 0.713 | 0.68 | 0.698 | 0.62 | 0.634 | 0.684 | 0.654 |
| JDT_UI | 0.632 | 0.683 | 0.641 | 0.667 | 0.605 | 0.625 | 0.627 | 0.657 | |
| Platform_Swt | 0.785 | 0.825 | 0.831 | 0.827 | 0.834 | 0.834 | 0.738 | 0.734 | |
| Platform_UI | 0.708 | 0.721 | 0.717 | 0.724 | 0.731 | 0.748 | 0.633 | 0.627 | |
| Eclipse_Avg. | 0.725 | 0.758 | 0.721 | 0.739 | 0.632 | 0.647 | 0.643 | 0.66 | |
| Mozilla | Core_Layout | 0.711 | 0.764 | 0.741 | 0.761 | 0.736 | 0.725 | 0.749 | 0.749 |
| Firefox_Bookmarks | 0.708 | 0.738 | 0.562 | 0.678 | 0.631 | 0.697 | 0.684 | 0.695 | |
| Firefox_General | 0.745 | 0.749 | 0.748 | 0.743 | 0.756 | 0.672 | 0.769 | 0.794 | |
| Thunderbird_General | 0.774 | 0.794 | 0.802 | 0.812 | 0.786 | 0.826 | 0.602 | 0.683 | |
| Mozilla_Avg. | 0.723 | 0.748 | 0.715 | 0.739 | 0.712 | 0.720 | 0.686 | 0.699 | |
| All_Avg. | 0.715 | 0.735 | 0.716 | 0.731 | 0.721 | 0.734 | 0.659 | 0.663 |
Table 5.
The area under curve (AUC) of predicting severity with different projects.
| Project | Product + Component | NB | IDR +NB | SVM | IDR + SVM | KNN | IDR + KNN | J48 | IDR + J48 |
|---|---|---|---|---|---|---|---|---|---|
| Eclipse | JDT_Text | 0.781 | 0.775 | 0.756 | 0.759 | 0.69 | 0.713 | 0.707 | 0.738 |
| JDT_UI | 0.686 | 0.793 | 0.69 | 0.711 | 0.634 | 0.664 | 0.651 | 0.625 | |
| Platform_Swt | 0.732 | 0.744 | 0.74 | 0.767 | 0.597 | 0.606 | 0.542 | 0.631 | |
| Platform_UI | 0.702 | 0.721 | 0.701 | 0.717 | 0.607 | 0.603 | 0.674 | 0.645 | |
| Eclipse_Avg. | 0.725 | 0.758 | 0.722 | 0.739 | 0.632 | 0.647 | 0.643 | 0.66 | |
| Mozilla | Core_Layout | 0.774 | 0.792 | 0.72 | 0.736 | 0.675 | 0.759 | 0.749 | 0.759 |
| Firefox_Bookmarks | 0.772 | 0.783 | 0.593 | 0.695 | 0.695 | 0.724 | 0.74 | 0.721 | |
| Firefox_General | 0.787 | 0.775 | 0.684 | 0.782 | 0.703 | 0.763 | 0.763 | 0.773 | |
| Thunderbird_General | 0.762 | 0.778 | 0.73 | 0.725 | 0.635 | 0.647 | 0.596 | 0.621 | |
| Mozilla_Avg. | 0.75 | 0.77 | 0.702 | 0.737 | 0.655 | 0.685 | 0.678 | 0.689 | |
| All_Avg. | 0.737 | 0.764 | 0.712 | 0.738 | 0.643 | 0.666 | 0.661 | 0.674 |
© 2017 by the authors. Licensee MDPI, Basel, Switzerland. This article is an open access article distributed under the terms and conditions of the Creative Commons Attribution (CC BY) license (http://creativecommons.org/licenses/by/4.0/).
Share and Cite
MDPI and ACS Style
Guo, S.; Chen, R.; Li, H. Using Knowledge Transfer and Rough Set to Predict the Severity of Android Test Reports via Text Mining. Symmetry 2017, 9, 161. https://doi.org/10.3390/sym9080161
AMA Style
Guo S, Chen R, Li H. Using Knowledge Transfer and Rough Set to Predict the Severity of Android Test Reports via Text Mining. Symmetry. 2017; 9(8):161. https://doi.org/10.3390/sym9080161
Chicago/Turabian StyleGuo, Shikai, Rong Chen, and Hui Li. 2017. "Using Knowledge Transfer and Rough Set to Predict the Severity of Android Test Reports via Text Mining" Symmetry 9, no. 8: 161. https://doi.org/10.3390/sym9080161
Note that from the first issue of 2016, this journal uses article numbers instead of page numbers. See further details here.