Risk Evaluation in Failure Mode and Effects Analysis Using Fuzzy Measure and Fuzzy Integral


School of Electronics and Information, Northwestern Polytechnical University, Xi’an 710072, China
*
Authors to whom correspondence should be addressed.
Symmetry 2017, 9(8), 162; https://doi.org/10.3390/sym9080162
Submission received: 30 July 2017
/
Revised: 13 August 2017
/
Accepted: 14 August 2017
/
Published: 17 August 2017
(This article belongs to the Special Issue Fuzzy Sets Theory and Its Applications)
Abstract
:Failure mode and effects analysis (FMEA) is a popular and useful approach applied to examine potential failures in different products, designs, processes, and services. As a vital index, the risk priority number (RPN) can determine the risk priorities of failure modes by some risk factors such as occurrence (O), severity (S), and detection (D). However, in FMEA, the traditional risk priority number approach has some shortcomings, especially in setting the weight of risk factors. This paper presents an improved risk priority number approach based on a fuzzy measure and fuzzy integral. A fuzzy measure is used to reflect the importance of the individual indicators and the indicator set and a fuzzy integral is a nonlinear function defined on the basis of fuzzy measure. The weights of risk factors given by domain experts are seen as fuzzy densities to generate a -fuzzy measure which can reflect the weights’ difference and relevance about risk factors. Then, the Choquet integral is used to fuse every value of risk factors about failure modes so as to obtain the comprehensive evaluation result. The result can reflect the comprehensive risk level, so it has a definite physical significance. Finally, an illustrative example and a comparison with another approach are given to show the effectiveness of the proposed approach in the paper.
1. Introduction
As an important branch of reliability analysis, failure mode and effects analysis (FMEA) is a methodical way to examine a proposed design in which failure is possible [1,2,3,4]. Failure mode refers to a form of system failure or system malfunction and effects analysis is used to research the impact on the total system when a local system is unable to work [5]. The main purpose of FMEA is to define, identify, and eliminate potential failure or problems in different products, designs, systems, and services [6,7]. FMEA not only can provide a basis to help designers improve or upgrade their scheme to reduce the loss but also can help decision makers to formulate corresponding preventive measures or improve the emergency response capability [8,9,10]. Nowadays FEMA has been widely used in many industry fields including aerospace, chemical, engineering, design mechanical, medical, and so on [11,12,13,14,15,16,17,18].
Risk priority number (RPN) is a popular way to evaluate risk priority in traditional FMEA [19,20,21]. RPN is usually expressed as : OSD, where O, S, and D are three main risk factors which denote the occurrence (O) of a failure mode, the severity (S) of a failure effect, and the probability of not being detected (D), respectively [22]. A failure mode should be paid more attention and be more important if the value of RPN is higher than others. However, RPN has some shortcomings especially in transforming linguistic variable and considering the difference of weight about risk factors. Therefore, lots of methods are proposed to improve FMEA, such as evidence theory [23,24,25], expert system [26,27], uncertainty measure [28], hybrid approaches [29], fuzzy set theory [30,31], and so on [32].
The issue with linguistic variable transforming is how to precisely evaluate the three risk factors by RPN. In many cases, the risk factors given by experts are expressed as a linguistic variable rather than the exact numbers [33]. Fuzzy set theory, proposed by Zadeh in 1965 [34,35], makes use of membership to measure the degree of fuzzy linguistic variables and is a precise way to solve the uncertainty of information [36,37,38,39]. For the issue of setting the weight of risk factors by RPN, the three risk factors are multiplied, which means occurrence, severity, and detection have the same weight. It can be thought that the three factors are independent and equally important. However, in many practical situations the difference in weight must be considered. For example, to some extent the failure mode with a high frequency is easily detected, so the weights of risk factors are related; in some systems decision makers pay more attention to the severity of a failure effect. Therefore, the difference and relevance of risk factors’ weights should be considered.
In this paper, a method is proposed to improve risk priority number based on a fuzzy measure and fuzzy integral, which can effectively reflect the weights’ difference and relevance of risk factors. The weights of risk factors given by domain experts are regarded as fuzzy densities to generate a -fuzzy measure that can take the difference and relevance of risk factors’ weights into consideration. Then, the Choquet integral is applied to fuse every value of the risk factors in order to obtain the comprehensive evaluation result. When the proposed method is applied to FMEA, it has achieved desired results. The proposed method provides a more reasonable and effective method for FMEA.
The rest of this paper is organized as follows. We give a literature review of the traditional FMEA method, fuzzy set theory, fuzzy measure, and fuzzy integral in Section 2. Section 3 is about the proposed method of FMEA under a fuzzy environment, using a fuzzy measure and fuzzy integral. An illustrative example and the comparison with another approach are given to show the effectiveness of the proposed approach in Section 4. Section 5 provides a brief conclusion.
2. Preliminaries
2.1. Risk Priority Number
RPN is a widely used evaluation method in FMEA. In the traditional RPN method, it only considers the three factors occurrence (O), Severity (S) and Detection (D), and these factors are mutually independent. Therefore, multiplication is used in the original RPN equation [19,40]. The three risk factors are divided to 10 levels, as shown in Table 1, Table 2 and Table 3. FMEA process based on the RPN approach is as follows. (1) First, the domain experts sort out some types of failure mode that the system may exist in according to the system’s design methods, materials, structure, and other information. (2) Then, the experts evaluate a potential failure model and give the evaluation results about occurrence frequency, severity degree, and detection difficulty, expressed as an integer from 1–10 and described in Table 1, Table 2 and Table 3, which are denoted as , and . (3) Next, the three evaluation indexes of every failure mode are multiplied:
the V represents the final evaluation result of the failure mode. The higher the value of V is, the higher the risk is. According to the value of V, we can sort all failure modes to identify the high risk failure mode. (4) Finally, the domain experts or decision makers can develop preventive measures and an emergency response plan for every failure model depending on the degree of risk and importance. By repeating the above steps (1)–(4), we can realize continuous optimization to improve the reliability and risk resistance capacity of the whole system.
It can be found that the risk priority number is a simple, intuitive, and easy way to realize FMEA. However, there are some shortcomings and problems needing to be solved further, which mainly includes the following aspects:
- PRN only considers three risk factors including occurrence (O), severity (S), and detection (D) but it ignores some impacts of the other risk factors.
- PRN does not consider the frequency of occurrence, degree of severity, and difficulty of detection to have different importance. It simply assumes that they have the same weight or importance.
- The evaluation of the failure model is only based on the evaluation level from 1–10, without considering that uncertainty will impact the assessment process.
- The final evaluation result (V) is only used to sort the failure mode, without a clear physical quantity that can actually react to the specific risk level of the failure mode.
- Different values of the risk factors may lead to the same V. It hides the potential risk type’s difference about failure modes.
2.2. Fuzzy Set Theory
Fuzzy set theory is an effective approach developed by Zadeh to solve some problems of fuzzy concept and fuzzy phenomenon which can not be described by boolean logic or finite multivalued logic [42]. Now fuzzy set theory has been extensively applied in many fields [43,44,45,46]. It has some advantages over classical set theory when estimating vagueness of concepts by subjective judgments [47,48].
Definition 1.
Let X be the universe of discourse, X = , a fuzzy set  defined on a universe X is characterized by a membership function Â, which can be denoted as:
where ⟶ [0,1] is the membership function of . The membership value describes the degree of x∈ X in . The bigger , the stronger the degree of membership for x in .
2.3. Fuzzy Measure and Fuzzy Integral
A fuzzy measure, also known as a non-additive measure, is a concept that is relative to the classical additive measure or probability measure. A fuzzy measure was first proposed as a set function to use monotonicity to instead of additivity [51,52]. Fuzzy measure can represent the importance of the individual indicators and the indicator set, so it can exactly describe the subjective evaluation and cognition of human beings [53]. The -fuzzy measure and 2-order additive fuzzy measure are common fuzzy measures. The fuzzy measure removes the columnable additivity conditions in the probability measure, which is defined as follows.
Definition 2.
Let X be a nonempty finite set. P(X) represents the power set of X. μ: P(X)→[0,1] is defined a set function in P(X) as a fuzzy measure, when μ meets the following conditions:
- (i)
- μ(∅) = 0
- (ii)
- μ(X) = 1
- (iii)
- μ(A) ≤ μ(B), ∀A,B ∈ P(X), A ⊆ B
The monotonicity of fuzzy measure (the last condition in the definition) can replace the additive in the classical measure. In a fuzzy measure, a -fuzzy measure is defined as follows.
Definition 3.
Let μ be a fuzzy measure defined on P(X), We define μ is a λ-fuzzy measure if μ meets the following conditions:
of which A, B ∈ P(X), A ∩ B ≠ ∅, λ > −1. The measure μ () of singleton set on X is defined as important measure or fuzzy density,|X| = n, i = 1,…,n.
It is easy to obtain the corresponding unique -fuzzy measure according to a set of fuzzy density by the following equation
of which > −1 and ≠ 0. When = 0, the fuzzy measure degenerates into a classical additive measure.
A fuzzy integral is a nonlinear function defined on the basis of a fuzzy measure [54]. A fuzzy integral was proposed as an integrated operator based on the index fuzzy measure. Because fuzzy integral operators do not need to assume that the indicators are independent, they are widely used in subjective evaluation of correlation among evaluation indexes. The common fuzzy integrals are the Choquet integral and the Sugeno integral [55,56,57], which can be used to achieve data fusion based on a fuzzy measure. The Choquet integral is a strict generalization of the Lebesgue integral and it is more stable when applied to fuse data [58]. The definition of the Choquet integral is given below.
Definition 4.
Define f is a nonempty finite set non-negative function of a nonempty finite set X = , …, , f: X→[0,+∞]. μ is the fuzzy measure on P(X) and the Choquet integral of f about μ is defined as:
of which f() = 0, and = {,, …,}. Without loss of generality, we assume f() ≤ f() ≤ … ≤ f(). If the assumption is not satisfied, the element of X is reordered as {, , …, } so as to make the corresponding function value f() meet the assumation.
3. The Proposed Model
As we known, RPN is used to determine the risk priorities in FMEA. However, the RPN approach is difficult in accurately evaluating the relevance of the three risk factors and does not consider the difference of risk factors weights. We need obtain the weights’ values but the weight of risk factors are often expressed as vague linguistic variables such as important, very high, and so on. So we need to transform them into values. Fuzzy set theory is a useful approach to get specific values from vague linguistic variables. Then we should consider the relevance and weights’ difference of risk factors.
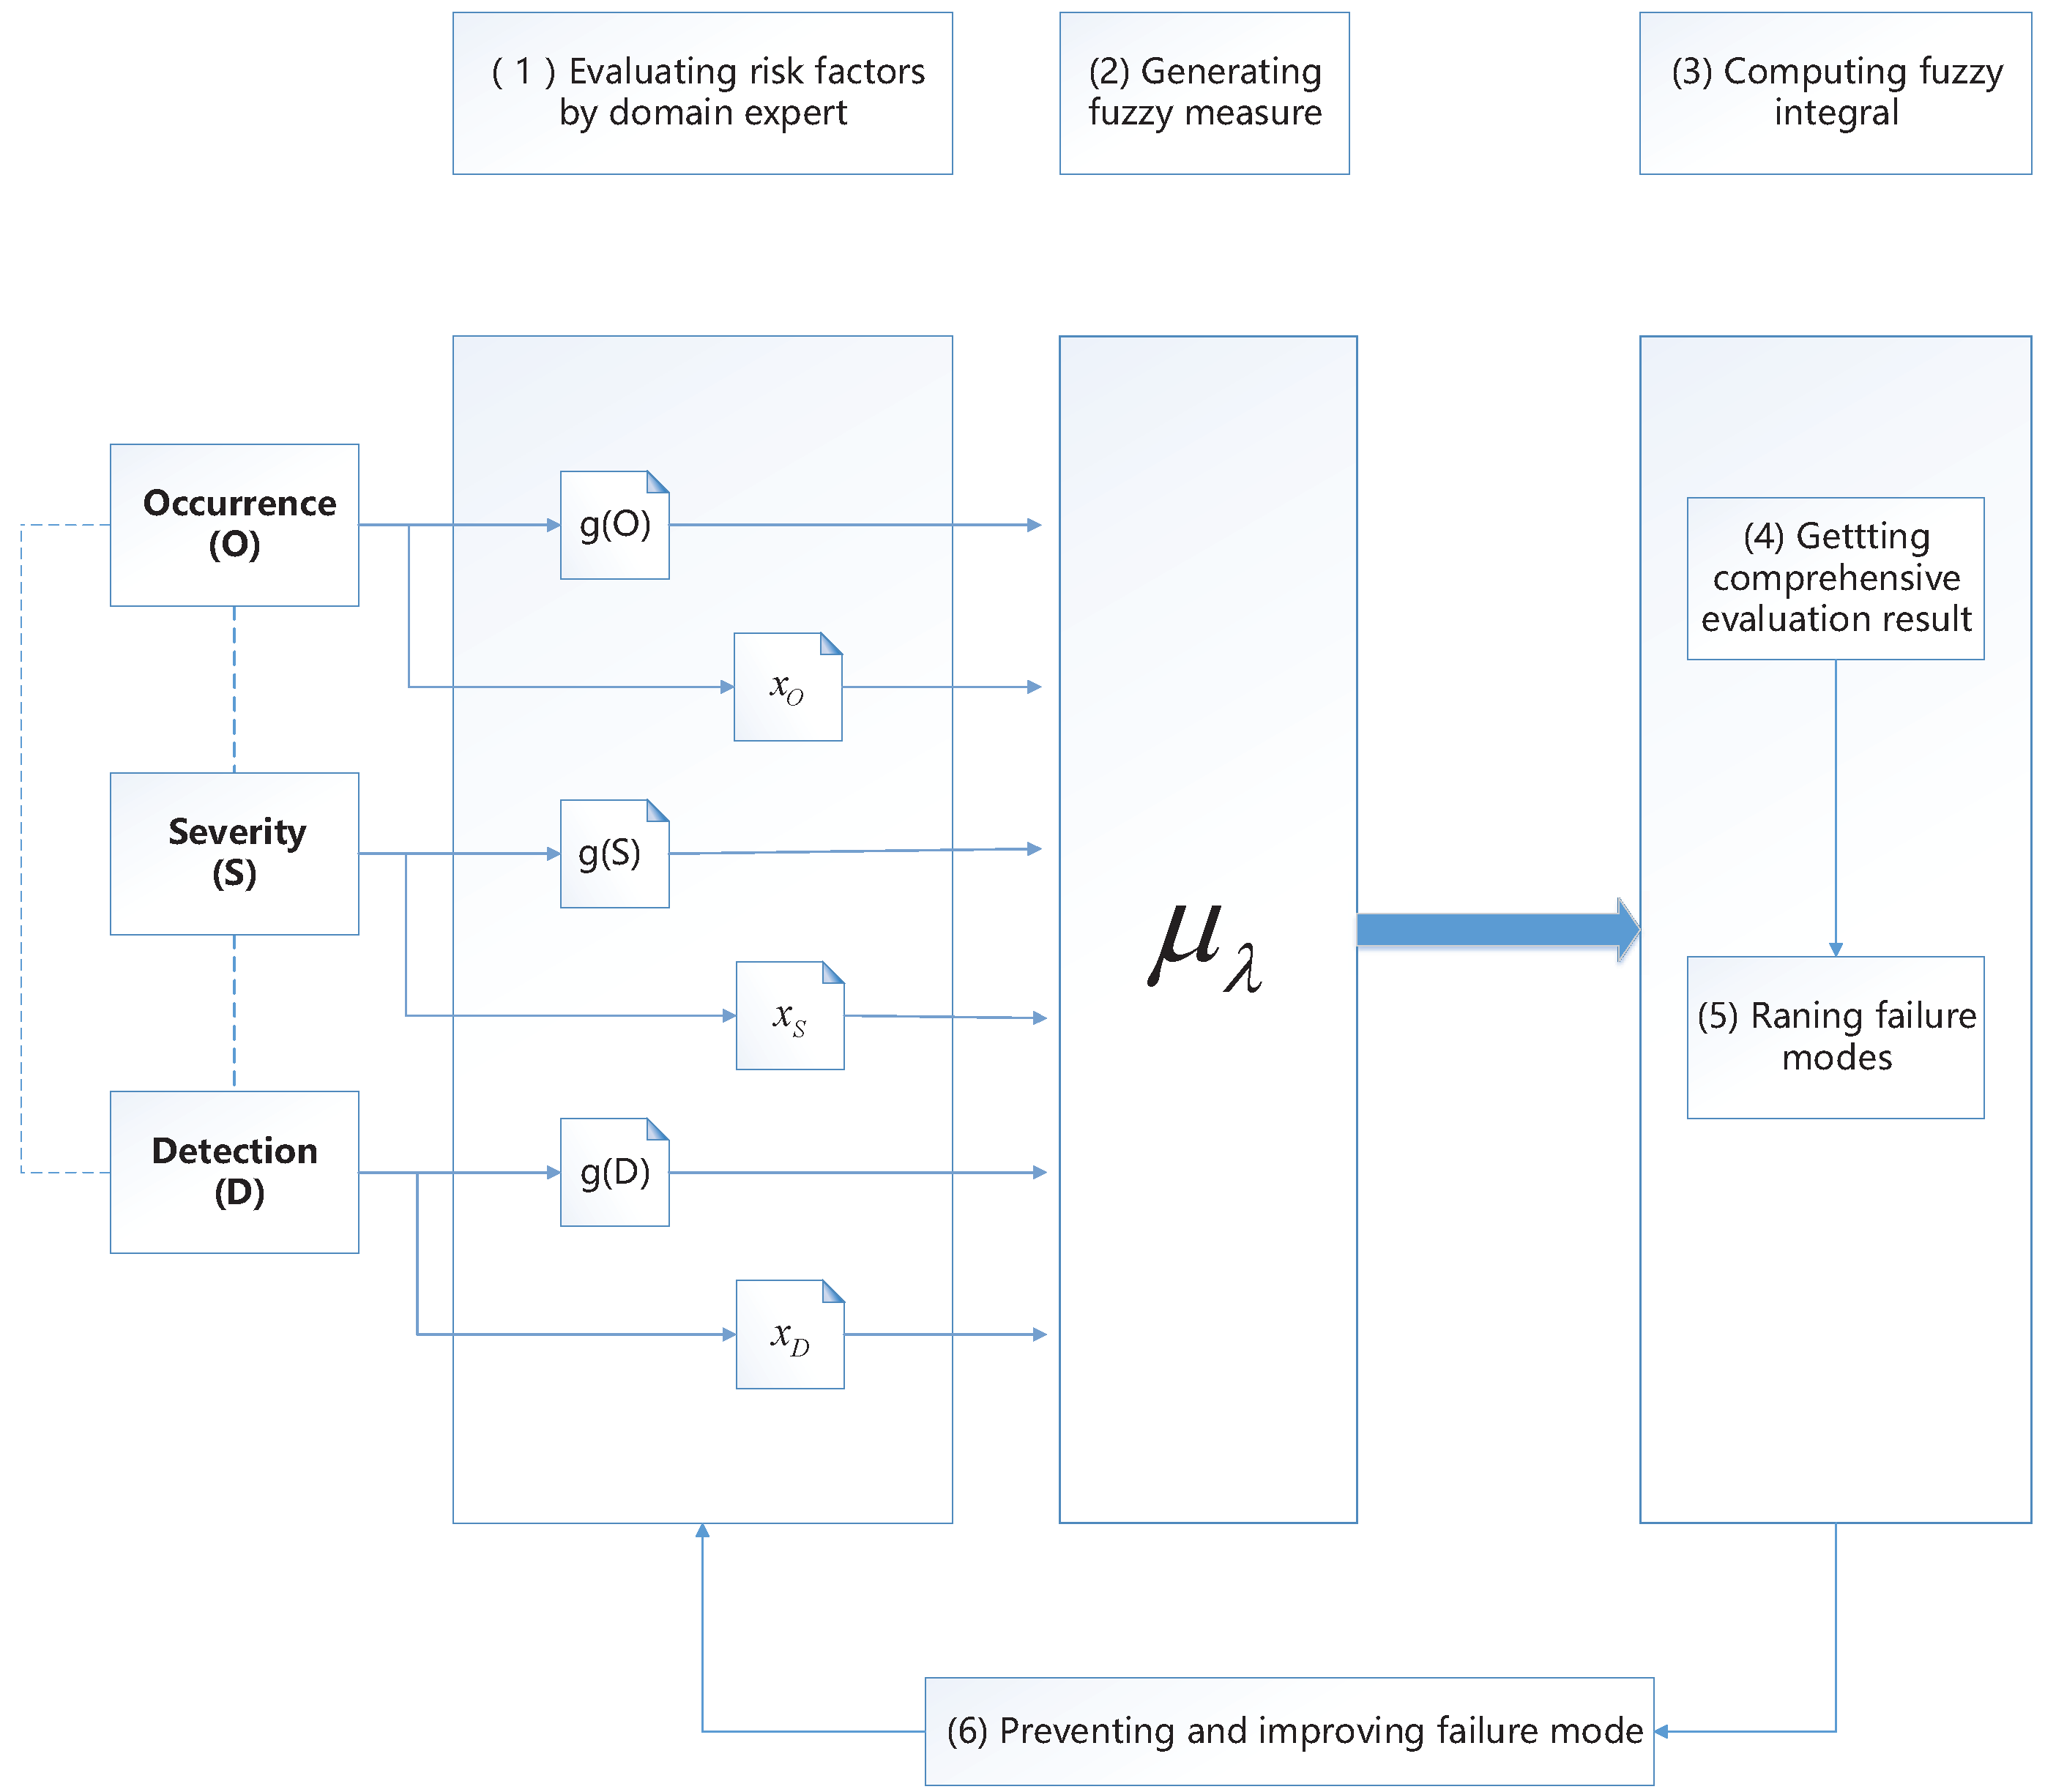
This paper proposes a method to improve RPN approach based on a fuzzy measure and fuzzy integral. Because fuzzy integrals do not need to assume the indicators are independent of each other, so a fuzzy integral is widely used in subjective evaluation problems where evaluation indexs are associated. In order to precisely and reasonably simulate the weights’ difference of the risk factors in FMEA, this paper uses a fuzzy measure to build a model for the weights of the occurrence, severity, and detection. The weights of risk factors given by domain experts are seen as fuzzy densities to generate a -fuzzy measure which can take the relevance and weights’ difference of risk factors into consideration. Then, the Choquet integral is used to fuse the evaluation results of the three factors and we can get the final comprehensive evaluation value of the failure mode. The main process is shown in Figure 1.
As shown in Figure 1, the method proposed in this paper mainly includes four key steps.
- Evaluate the three risk factors by domain experts including occurrence, severity, and detection and their weights. The results of the assessment include two aspects: one is the importance of each factor, which are defined as g(O), g(S), and g(D) and they are in the range of 0–1; the other is the value of every risk factor in failure modes, which are defined as , , and .
- Generate a fuzzy measure and use the fuzzy measure to generate a -fuzzy measure. The g(O), g(S), and g(D) are regarded as the fuzzy density of the three risk factors. Then generate the of the -fuzzy measure according to Equation (4).
- Fuse evaluation values using the Choquet integral and rank the comprehensive evaluation value. The Choquet integral, by Equation (5), is applied to fuse , , and based on and the evaluation value by domain experts. Then we can obtain the comprehensive evaluation value , which reflects the comprehensive risk level of the failure mode. Next, rank the failure mode by to find the high-risk failure mode.
- Prevent and improve failure mode. Domain expert and decision makers can formulate corresponding preventive measures by the ranking. Repeating above steps, the system will be optimized continuously and the reliability will be improved.
4. An Illustrative Example
In this section, the proposed method is applied to FMEA to prove its effectiveness. The example and data are from the literature [59]. The example is about a grade A class three hospital that uses FMEA for its medical risk management in order to reduce medical accident and iatrogenic disease. Literature [59] used an extended VIKOR method under a fuzzy environment to get the matrix and weight of every risk factors. The steps of risk evaluation in FMEA are shown as follows:
Step 1: Identify the risk assessment objective. The hospital wants to identify some important failure modes in the general anaesthesia process. After discussion and screening, it identified six possible failure modes which are denoted as FM 1, FM 2, FM 3, FM 4, FM 5, and FM 6.
Step 2: Organize five experts as a team. The five experts are denoted as DM 1, DM 2, DM 3, DM 4, and DM 5 to evaluate the values and weights of occurrence, severity, and detection by linguistic variable. The results are shown in Table 4 and Table 5.
Step 3: Transform linguistic variables into detailed numerical values by trapezoidal fuzzy numbers. Then weights of risk factors and fuzzy rating of failure modes are aggregated to get the fuzzy decision matrix and fuzzy weight of risk factors, as in Table 6.
Step 4: Aggregate these evaluations given by five experts to obtain an integrated evaluation of the three risk factors. In this paper, we directly use the results of literature [59], as shown in Table 7.
Step 5: Define the weight of three risk factors as g(O), g(S), and g(D), in the range of 0–1.
- g(O) = 0.768
- g(S) = 0.787
- g(D) = 0.650
Step 6: Generate the fuzzy measure. The g(O), g(S), and g(D) are regarded as fuzzy density of the three risk factors:
- (O) = g(O) = 0.768
- (S) = g(S) = 0.787
- (O) = g(D) = 0.650
1 + = (1 + 0.768)(1 + 0.878)(1 + 0.650)
Solve the formula: = {−2.911, −0.989, 0}
Because > −1 and ≠ 0, so the value of is −0.989. Therefore we obtain the following -fuzzy measure
- (∅) = 0,
- ({O}) = 0.768,
- ({S}) = 0.878,
- ({D}) = 0.650,
- ({O,S}) = 0.979,
- ({O,D}) = 0.924,
- ({S,D}) = 0.964,
- ({O,S,D}) = 1.
Step 7: Use the Choquet integral to fuse the evaluations of all risk factors and rank the six failure modes. The comprehensive evaluation value of every failure mode can be found with Equation (5). The comprehensive evaluation values are shown in Table 8. It can be seen that the comprehensive evaluation value of every failure mode is still between 1 and 10, which reflects the specific risk level of the failure mode (between 1 and 10) and the fuzzy integral value has a clear physical significance.
Step 8: Prevent and improve the failure mode. Domain experts or decision makers can give priority to making the effective precautionary measures and emergency response schemes.
As a comparison, the literature [59] gives the failure model risk evaluation results and ranking based on the VIKOR method, as shown in Table 9 and Table 10. Among them, S, R, and Q are represented the three ranking indexes of VIKOR method, respectively. It can be seen in the ranking of failure modes based on VIKOR method, the ranking of S index is FM 3, FM 2, FM 6, FM 1, FM 5, and FM 4; the ranking of R index is FM 6, FM 3, FM 2, FM 5, FM 1, and FM 4; and the ranking of Q index is FM 3, FM 6, FM 2, FM 5, FM 1, and FM 4. The ranking result by the Choquet integral is as same as the ranking result by R index and is only different with the first and second ranking by Q index. Every method can draw a conclusion that FM4 is the lowest risk mode of failure. It can prove the method we propose is effective by comparison with the VIKOR method. What is more important, the comprehensive evaluation value by fuzzy integral fusion has a more definite physical significance and can be regarded as the risk degree of failure mode. The risk of the six failure modes is ranked by FM 6, FM 3, FM 2, FM 5, FM 1, and FM 4, using the proposed method. It is no doubt that FM 4 has the lowest degree of risk, because occurrence and detection both are the lowest, and severity is only slightly higher than the lowest one. The highest occurrence of the occurrence failure mode is FM 3, the highest degree of severity is FM 6, and the most difficult of detection is FM 3. Although FM 3 has the highest value in both occurrence and detection, FM 6 has the highest value only in severity but the weight of the severity factor is the highest. Therefore, the final ranking of FM 3 and FM 6 depends on both the weight of the risk factor and the crisp evaluation value. Using the fuzzy integral fusion method given in this paper, we find that FM 6 has the highest risk degree, which shows the effectiveness of the proposed method.
5. Conclusions
FMEA is a useful and important approach to examine potential failure by the risk priority number. The traditional RPN approach is criticized in many aspects, especially in transforming linguistic variable and considering no difference among risk factors’ weights. Fuzzy set theory is a classical method to transform linguistic variables into crisp values. Also, a fuzzy measure and fuzzy integral are appropriate methods to take the difference and relevance of weights into consideration. In this paper, a new method based on fuzzy integral fusion is proposed to solve the issue of the weights’ difference and relevance about risk factors. In the proposed method, the -fuzzy measure is generated according to the weights of the risk factors given by the domain expert and then the Choquet integral is used to fuse the crisp evaluation values to obtain the comprehensive evaluation results. Finally, the effectiveness of the proposed method is shown by comparing the result of a medical risk management system with different methods. By using the proposed method, the comprehensive result can reflect the specific risk level of the failure mode because in the model the comprehensive evaluation value of the fuzzy integral is in the range of 1–10. So the result has a definite physical significance and is easy to be understood and applied. In addition, the proposed method can be effectively used in a group decision question, uncertain decision making environment, and so on.
Further research will focus on the following directions. Firstly, we need future research to perform a comparative study with the obtained results. Secondly, the uncertain information should be considered in FMEA. A fuzzy measure and fuzzy integral can be used when we can obtain the evaluation value and weights of the three risk factors. However, in some situations, diversity and uncertainty of the risk factors can not be ignored. We need to develop a new method to obtain the evaluation value and weights of uncertain information and fuse them by a fuzzy measure and fuzzy integral.
Acknowledgments
The work is partially supported by National Natural Science Foundation of China (Grant No. 61671384), Natural Science Basic Research Plan in Shaanxi Province of China (Program No. 2016JM6018), Aviation Science Foundation (Program No. 20165553036), Fundamental Research Funds for the Central Universities (Program No. 3102017OQD020).
Author Contributions
H.L. and X.D. proposed the method; H.L., X.D. and W.J. analyzed the results of experiment; H.L. wrote the paper. X.D. and W.J. revised and improved the paper.
Conflicts of Interest
The authors declare that there is no conflict of interests regarding the publication of this paper.
References
- Bowles, J.B.; Pelaez, C.E. Fuzzy logic prioritization of failures in a system failure mode, effects and criticality analysis. Reliab. Eng. Syst. Saf. 1995, 50, 142–149. [Google Scholar] [CrossRef]
- Stamatis, D.H. Failure Mode and Effect Analysis: FMEA from Theory to Execution; ASQ Quality Press: Milwaukee, WI, USA, 2003; Volume 38, p. 80. [Google Scholar]
- Liu, H.C.; Liu, L.; Lin, Q.L. Fuzzy failure mode and effects analysis using fuzzy evidential reasoning and belief rule-based methodology. IEEE Trans. Reliab. 2013, 62, 23–36. [Google Scholar] [CrossRef]
- Du, Y.; Lu, X.; Su, X.; Hu, Y.; Deng, Y. New failure mode and effects analysis: An evidential downscaling method. Qual. Reliab. Eng. Int. 2016, 32, 737–746. [Google Scholar] [CrossRef]
- Chai, K.C.; Jong, C.H.; Tay, K.M.; Lim, C.P. A perceptual computing-based method to prioritize failure modes in failure mode and effect analysis and its application to edible bird nest farming. Appl. Soft Comput. 2016, 49, 734–747. [Google Scholar] [CrossRef]
- Pillay, A.; Wang, J. Modified failure mode and effects analysis using approximate reasoning. Reliab. Eng. Syst. Saf. 2003, 79, 69–85. [Google Scholar] [CrossRef]
- Chin, K.S.; Chan, A.; Yang, J.B. Development of a fuzzy FMEA based product design system. Int. J. Adv. Manuf. Technol. 2008, 36, 633–649. [Google Scholar] [CrossRef]
- Chang, K.H.; Cheng, C.H. Evaluating the risk of failure using the fuzzy OWA and DEMATEL method. J. Intell. Manuf. 2011, 22, 113–129. [Google Scholar] [CrossRef]
- Zafiropoulos, E.P.; Dialynas, E.N. Reliability prediction and failure mode effects and criticality analysis (FMECA) of electronic devices using fuzzy logic. Int. J. Qual. Reliab. Manag. 2013, 22, 183–200. [Google Scholar] [CrossRef]
- Chanamool, N.; Naenna, T. Fuzzy FMEA application to improve decision-making process in an emergency department. Appl. Soft Comput. 2016, 43, 441–453. [Google Scholar] [CrossRef]
- Kim, K.M.; Yun, N.; Yun, H.J.; Dong, H.L.; Cho, H.H. Failure analysis in after shell section of gas turbine combustion liner under base-load operation. Eng. Fail. Anal. 2010, 17, 848–856. [Google Scholar] [CrossRef]
- Jiang, W.; Zhan, J. A modified combination rule in generalized evidence theory. Appl. Intell. 2017, 46, 630–640. [Google Scholar] [CrossRef]
- Silveira, E.; Atxaga, G.; Irisarri, A.M. Failure analysis of two sets of aircraft blades. Eng. Fail. Anal. 2010, 17, 641–647. [Google Scholar] [CrossRef]
- Sharma, R.K.; Kumar, D.; Kumar, P. Systematic failure mode effect analysis (FMEA) using fuzzy linguistic modelling. Int. J. Qual. Reliab. Manag. 2005, 22, 986–1004. [Google Scholar] [CrossRef]
- Xu, S.; Jiang, W.; Deng, X.; Shou, Y. A modified Physarum-inspired model for the user equilibrium traffic assignment problem. Appl. Math. Model. 2017, in press. [Google Scholar] [CrossRef]
- Braglia, M.; Frosolini, M.; Montanari, R. Fuzzy TOPSIS approach for failure mode effects and criticality analysis. Qual. Reliab. Eng. Int. 2003, 19, 425–443. [Google Scholar] [CrossRef]
- Zheng, Y.; Johnson, R.; Larson, G. Minimizing treatment planning errors in proton therapy using failure mode and effects analysis. Int. J. Radiat. Oncol. Biol. Phys. 2016, 43, 2904–2910. [Google Scholar] [CrossRef] [PubMed]
- Manger, R.P.; Paxton, A.B.; Pawlicki, T.; Pawlicki, T.; Kim, G.Y. Failure mode and effects analysis and fault tree analysis of surface image guided cranial radiosurgery. Med. Phys. 2015, 42, 2449–2461. [Google Scholar] [CrossRef] [PubMed]
- Wang, Y.M.; Chin, K.S.; Poon, G.K.K.; Poon, G.; Yang, J.B. Risk evaluation in failure mode and effects analysis using fuzzy weighted geometric mean. Expert Syst. Appl. 2009, 36, 1195–1207. [Google Scholar] [CrossRef]
- Liu, H.C.; You, J.X.; Li, P.; Su, Q. Failure mode and effect analysis under uncertainty: An integrated multiple criteria decision making approach. IEEE Trans. Reliab. 2016, 65, 1380–1392. [Google Scholar] [CrossRef]
- Bozdag, E.; Asan, U.; Soyer, A.; Serdarasan, S. Risk prioritization in failure mode and effects analysis using interval type-2 fuzzy sets. Expert Syst. Appl. 2015, 42, 4000–4015. [Google Scholar] [CrossRef]
- Prakash, A.M.J.; Senthilvelan, T.; Gnanadass, R. Optimization of process parameters through fuzzy logic and genetic algorithm—A case study in a process industry. Appl. Soft Comput. 2015, 30, 94–103. [Google Scholar]
- Jiang, W.; Wang, S.; Liu, X.; Zheng, H.; Wei, B. Evidence conflict measure based on OWA operator in open world. PLoS ONE 2017, 12, e0177828. [Google Scholar] [CrossRef] [PubMed]
- Qian, J.; Guo, X.; Deng, Y. A novel method for combining conflicting evidences based on information entropy. Appl. Intell. 2017, 46, 876–888. [Google Scholar] [CrossRef]
- Deng, X.; Jiang, W.; Zhang, J. Zero-Sum matrix game with payoffs of Dempster-Shafer belief structures and its applications on Sensors. Sensors 2017, 17, 922. [Google Scholar] [CrossRef] [PubMed]
- Yang, Z.; Bonsall, S.; Wang, J. Fuzzy rule-based bayesian reasoning approach for prioritization of failures in FMEA. IEEE Trans. Reliab. 2008, 57, 517–528. [Google Scholar] [CrossRef]
- Kai, M.T.; Lim, C.P. Fuzzy FMEA with a guided rules reduction system for prioritization of failures. Int. J. Qual. Reliab. Manag. 2006, 23, 1047–1066. [Google Scholar]
- Deng, X.; Xiao, F.; Deng, Y. An improved distance-based total uncertainty measure in belief function theory. Appl. Intell. 2017, 46, 898–915. [Google Scholar] [CrossRef]
- Gargama, H.; Chaturvedi, S.K. Criticality assessment models for failure mode effects and criticality analysis using fuzzy logic. IEEE Trans. Reliab. 2011, 60, 102–110. [Google Scholar] [CrossRef]
- Jiang, W.; Xie, C.; Zhuang, M.; Tang, Y. Failure mode and effects analysis based on a novel fuzzy evidential method. Appl. Soft Comput. 2017, 57, 672–683. [Google Scholar] [CrossRef]
- Wu, H.C. Existence and uniqueness for the construction of fuzzy sets from a solidly nested family. Fuzzy Optim. and Decis. Mak. 2015, 14, 1–41. [Google Scholar] [CrossRef]
- Jiang, W.; Xie, C.; Zhuang, M.; Shou, Y.; Tang, Y. Sensor data fusion with z-numbers and its application in fault diagnosis. Sensors 2016, 16, 1509. [Google Scholar] [CrossRef] [PubMed]
- Efe, B.; Efe, Ö.F. An Application of Value Analysis for Lean Healthcare Management in an Emergency Department. Int. J. Comput. Intell. Syst. 2016, 9, 689–697. [Google Scholar] [CrossRef]
- Zadeh, L.A. Fuzzy sets. Inf. Control 1965, 8, 338–353. [Google Scholar] [CrossRef]
- Zadeh, L.A. The concept of a linguistic variable and its application to approximate reasoning. Inf. Sci. 1975, 8, 199–249. [Google Scholar] [CrossRef]
- Deng, X.; Han, D.; Dezert, J.; Deng, Y.; Yu, S. Evidence combination from an evolutionary game theory perspective. IEEE Trans. Cybern. 2016, 46, 2070–2082. [Google Scholar] [CrossRef] [PubMed]
- Liu, H.C.; You, J.X.; You, X.Y.; Shan, M.M. A novel approach for failure mode and effects analysis using combination weighting and fuzzy VIKOR method. Appl. Soft Comput. 2016, 28, 579–588. [Google Scholar] [CrossRef]
- Wu, H.C. Optimality conditions for linear programming problems with fuzzy coefficients. Comput. Math. Appl. 2008, 55, 2807–2822. [Google Scholar] [CrossRef]
- Deng, X.; Jiang, W. An evidential axiomatic design approach for decision making using the evaluation of belief structure satisfaction to uncertain target values. Int. J. Intell. Syst. 2017, in press. [Google Scholar] [CrossRef]
- Kara-Zaitri, C.; Keller, A.Z.; Barody, I.; Fleming, P.V. An improved FMEA methodology. Reliab. Maintainab. Symp. 1991, 248–252. [Google Scholar] [CrossRef]
- Ford Motor Company. Potential Failure Mode and Effects Analysis (FMEA) Reference Manual; Ford Motor Company: Dearborn, MI, USA, 1988. [Google Scholar]
- Liu, X.; Wang, Z.; Zhang, S. A modification on the hesitant fuzzy set lexicographical ranking method. Symmetry 2016, 8, 153–159. [Google Scholar] [CrossRef]
- Salarzadeh, J.H.; Babashamsi, P.; Yusoff, N.I.M. The combination of a fuzzy analytical hierarchy process and the taguchi method to evaluate the malaysian user willingness to pay for public transportation. Symmetry 2016, 8, 90–106. [Google Scholar] [CrossRef]
- Hong, H.G.; Lee, W.O.; Kim, Y.G.; Kim, K.W.; Nguyen, D.T.; Kang, R.P. Fuzzy system-based face detection robust to in-plane rotation based on symmetrical characteristics of a face. Symmetry 2016, 8, 75–102. [Google Scholar] [CrossRef]
- Efe, B. An integrated fuzzy multi criteria group decision making approach for ERP system selection. Appl. Soft Comput. 2016, 38, 106–117. [Google Scholar] [CrossRef]
- Wu, H.C. Decomposition and construction of fuzzy sets and their applications to the arithmetic operations on fuzzy quantities. Fuzzy Sets Syst. 2013, 233, 1–25. [Google Scholar] [CrossRef]
- Lu, N.; Liang, L. Correlation coefficients of extended hesitant fuzzy sets and their applications to decision making. Symmetry 2017, 9, 47–67. [Google Scholar] [CrossRef]
- Jiang, W.; Wang, S. An uncertainty measure for interval-valued evidences. Int. J. Comput. Commun. Control 2017, 12, 631–644. [Google Scholar]
- Boran, F.E.; Efe, B.; Akay, D.; Akay, D.; Henson, B. Understanding customers’ affective needs with linguistic summarization. In Proceedings of the KEER 2014—International Conference on Kansei Engineering and Emotion Research, Linkoping, Sweden, 10–13 June 2014; pp. 1235–1245. [Google Scholar]
- Mo, H.; Deng, Y. A new aggregating operator for linguistic information based on D numbers. Int. J. Uncertain. Fuzziness Knowl.-Based Syst. 2016, 24, 831–846. [Google Scholar] [CrossRef]
- Leszczynski, K.; Penczek, P.; Grochulski, W. Sugeno’s fuzzy measure and fuzzy clustering. Fuzzy Sets Syst. 1985, 35, 147–158. [Google Scholar] [CrossRef]
- Wang, Z.; Klir, G.J. Fuzzy Measure Theory; Springer: Berlin, Germany, 1992; Volume 35, pp. 3–10. [Google Scholar]
- Mane, A.M.; Dongale, T.D.; Bapat, M.S. Application of fuzzy measure and fuzzy integral in students failure decision making. Am. J. Math. 2014, 10, 47–53. [Google Scholar]
- Grabisch, M.; Murofushi, T.; Sugeno, M. Fuzzy measure of fuzzy events defined by fuzzy integrals. Fuzzy Sets Syst. 1992, 50, 293–313. [Google Scholar] [CrossRef]
- Narukawa, Y.; Torra, V. Fuzzy measures and Choquet integral on discrete spaces. Comput. Intell. Theory Appl. 2005, 33, 573–581. [Google Scholar]
- Murofushi, T.; Sugeno, M. An interpretation of fuzzy measures and the Choquet integral as an integral with respect to a fuzzy measure. Fuzzy Sets Syst. 1989, 29, 201–227. [Google Scholar] [CrossRef]
- Sugeno, M. Theory of Fuzzy Integrals and Its Applications. Ph.D. Thesis, Tokyo Institute of Technology, Tokyo, Japan, 1974. [Google Scholar]
- Zhang, J.; Deng, Y. A method to determine basic probability assignment in the open world and its application in data fusion and classification. Appl. Intell. 2017, 46, 934–951. [Google Scholar] [CrossRef]
- Liu, H.C.; Liu, L.; Liu, N.; Mao, L.-X. Risk evaluation in failure mode and effects analysis with extended VIKOR method under fuzzy environment. Expert Syst. Appl. 2012, 39, 12926–12934. [Google Scholar] [CrossRef]
Figure 1.
The process of proposed method


Table 1.
Traditional FMEA scale for occurrence [41].
Table 1.
Traditional FMEA scale for occurrence [41].
| Probability of Failure | Possible Failure Rates | Rank |
|---|---|---|
| Extremely high: Failure almost inevitable | ≥in 2 | 10 |
| Very high | 1 in 3 | 9 |
| Repeated failures | 1 in 8 | 8 |
| High | 1 in 20 | 7 |
| Moderately high | 1 in 80 | 6 |
| Moderate | 1 in 400 | 5 |
| Relatively low | 1 in 2000 | 4 |
| Low | 1 in 15,000 | 3 |
| Remote | 1 in 150,000 | 2 |
| Nearly impossible | 1 in 1,500,000 | 1 |
Table 2.
Traditional FMEA scale for severity [41].
Table 2.
Traditional FMEA scale for severity [41].
| Effect | Criteria: Severity of Effect | Rank |
|---|---|---|
| Hazardous | Failure is hazardous and occurs without warning. It suspends operation of the system and/or involves noncompliance with government regulations | 10 |
| Serious | Failure involves hazardous outcomes and/or noncompliance with government regulations or standards | 9 |
| Extreme | Failure is hazardous and occurs without warning. It system is inoperable | 8 |
| Major | Product performance is severely affected but functions. The system may not operate | 7 |
| Significant | Product performance is degraded. Comfort or convince functions may not operate | 6 |
| Moderate | Moderate effect on product performance. The product requires repair | 5 |
| Low | Small effect on product performance. The product does not require repair | 4 |
| Minor | Minor effect on product or system performance | 3 |
| Very mintor | Very minor effect on product or system performance | 2 |
| None | No effect | 1 |
Table 3.
Traditional FMEA scale for detection [41].
Table 3.
Traditional FMEA scale for detection [41].
| Detection | Criteria: Likelihood of Detection by Design Control | Rank |
|---|---|---|
| Absolute uncertainty | Design control does not detect a potential cause of failure or subsequent failure mode, or there is no design control | 10 |
| Very remote | Very remote chance the design control will detect a potential cause of failure or subsequent failure mode | 9 |
| Remote | Remote chance the design control will detect a potential cause of failure or subsequent failure mode | 8 |
| Very low | Very low chance the design control will detect a potential cause of failure or subsequent failure mode | 7 |
| Low | Low chance the design control will detect a potential cause of failure or subsequent failure mode | 6 |
| Moderate | Moderate chance the design control will detect a potential cause of failure or subsequent failure mode | 5 |
| Moderately high | Moderately high chance the design control will detect a potential cause of failure or subsequent failure mode | 4 |
| High | High chance the design control will detect a potential cause of failure or subsequent failure mode | 3 |
| Very high | Very high chance the design control will detect a potential cause of failure or subsequent failure mode | 2 |
| Almost certain | Design control will almost certainty detect a potential cause of failure or subsequent failure mode | 1 |
Table 4.
Importance weight of risk factors from five FMEA team members.
| Risk Factors | Team Members | ||||
|---|---|---|---|---|---|
| DM 1 | DM 2 | DM 3 | DM 4 | DM 5 | |
| O | H | H | VH | H | MH |
| S | VH | VH | H | VH | VH |
| D | MH | MH | M | H | MH |
Table 5.
Judgments on six failure modes by FMEA team members under risk factors.
| Team Members | FM 1 | FM 2 | FM 3 | FM 4 | FM 5 | FM 6 |
|---|---|---|---|---|---|---|
| O | ||||||
| DM 1 | M | H | VH | M | M | MH |
| DM 2 | M | MH | MH | M | ML | H |
| DM 3 | M | H | VH | L | M | M |
| DM 4 | MH | MH | VH | M | M | MH |
| DM 5 | M | MH | VH | M | M | M |
| S | ||||||
| DM 1 | ML | H | MH | M | M | H |
| DM 2 | ML | MH | MH | M | MH | H |
| DM 3 | ML | H | MH | ML | MH | H |
| DM 4 | M | H | MH | M | M | H |
| DM 5 | M | H | MH | M | M | H |
| D | ||||||
| DM 1 | M | M | MH | VL | L | L |
| DM 2 | ML | M | M | ML | ML | M |
| DM 3 | ML | ML | MH | VL | L | L |
| DM 4 | ML | M | MH | ML | L | L |
| DM 5 | ML | M | M | VL | L | VL |
Table 6.
Aggregated fuzzy rating of six failure modes and aggregated fuzzy weight of risk factors.
| Failure Modes | O | S | D |
|---|---|---|---|
| FM 1 | (4, 5.2, 5.4, 8) | (2, 3.8, 4.4, 6) | (2, 3.4, 4.2, 6) |
| FM 2 | (5, 6.8, 7.4, 9) | (5, 7.6, 7.8, 9) | (2, 4.6, 4.8, 6)) |
| FM 3 | (5, 8.4, 9.4, 10) | (5, 6, 7, 8) | (4, 5.6, 6.2, 8) |
| FM 4 | (1, 4.4, 4.4, 6) | (2, 4.6, 4.8, 6) | (0, 1.2, 2.2, 5) |
| FM 5 | (2, 4.6, 4.8, 6) | (4, 5.4, 5.8, 8) | (1, 2.2, 2.4, 5) |
| FM 6 | (4, 6, 6.4, 9) | (7, 8, 8, 9) | (0, 2.2, 2.4, 6) |
| Weight | (0.5, 0.78, 0.82, 1) | (0.7, 0.88, 0.96, 1) | (0.4, 0.62, 0.68, 0.9) |
Table 7.
Crisp values for the decision matrix and weight of each risk factor.
| Failure Modes | O | S | D |
|---|---|---|---|
| FM 1 | 5.756 | 4.038 | 3.922 |
| FM 2 | 7.038 | 7.244 | 4.244 |
| FM 3 | 8.044 | 6.500 | 5.962 |
| FM 4 | 3.800 | 4.244 | 2.189 |
| FM 5 | 4.244 | 5.855 | 2.756 |
| FM 6 | 6.393 | 8.000 | 2.759 |
| Weight | 0.768 | 0.878 | 0.650 |
Table 8.
Crisp values for the fuzzy integral and ranking of each failure mode.
| Failure Modes | Values of the Fuzzy Integral | Ranking |
|---|---|---|
| FM 1 | 5.355 | 5 |
| FM 2 | 7.161 | 3 |
| FM 3 | 7.675 | 2 |
| FM 4 | 4.157 | 6 |
| FM 5 | 5.628 | 4 |
| FM 6 | 7.729 | 1 |
Table 9.
The values of S, R, and Q for all failure modes based on extended VIKOR method under a fuzzy environment [59].
Table 9.
The values of S, R, and Q for all failure modes based on extended VIKOR method under a fuzzy environment [59].
| Failure Modes | S | R | Q |
|---|---|---|---|
| FM 1 | 0.653 | 0.354 | 0.343 |
| FM 2 | 1.650 | 0.710 | 0.817 |
| FM 3 | 1.964 | 0.768 | 0.943 |
| FM 4 | 0.046 | 0.046 | 0 |
| FM 5 | 0.581 | 0.403 | 0.354 |
| FM 6 | 1.445 | 0.878 | 0.865 |
Table 10.
The ranking of the failure modes by S, R, and Q in decreasing order based on extended the VIKOR method under a fuzzy environment [59].
Table 10.
The ranking of the failure modes by S, R, and Q in decreasing order based on extended the VIKOR method under a fuzzy environment [59].
| Failure Modes | S | R | Q |
|---|---|---|---|
| FM 1 | 4 | 5 | 5 |
| FM 2 | 2 | 3 | 3 |
| FM 3 | 1 | 2 | 1 |
| FM 4 | 6 | 6 | 6 |
| FM 5 | 5 | 4 | 4 |
| FM 6 | 3 | 1 | 2 |
© 2017 by the authors. Licensee MDPI, Basel, Switzerland. This article is an open access article distributed under the terms and conditions of the Creative Commons Attribution (CC BY) license (http://creativecommons.org/licenses/by/4.0/).
Share and Cite
MDPI and ACS Style
Liu, H.; Deng, X.; Jiang, W. Risk Evaluation in Failure Mode and Effects Analysis Using Fuzzy Measure and Fuzzy Integral. Symmetry 2017, 9, 162. https://doi.org/10.3390/sym9080162
AMA Style
Liu H, Deng X, Jiang W. Risk Evaluation in Failure Mode and Effects Analysis Using Fuzzy Measure and Fuzzy Integral. Symmetry. 2017; 9(8):162. https://doi.org/10.3390/sym9080162
Chicago/Turabian StyleLiu, Haibin, Xinyang Deng, and Wen Jiang. 2017. "Risk Evaluation in Failure Mode and Effects Analysis Using Fuzzy Measure and Fuzzy Integral" Symmetry 9, no. 8: 162. https://doi.org/10.3390/sym9080162
Note that from the first issue of 2016, this journal uses article numbers instead of page numbers. See further details here.