Article

Fits and Misfits in Organic Matrix Analyses: Case of the Soluble Matrices of the Nacreous Layer of Pinctada margaritifera (Mollusca)

UMR 8148 Interactions et Dynamique des Environnements de Surface, Bat. 504, Université Paris Sud, Orsay Cedex 91405, France
*
Author to whom correspondence should be addressed.
Minerals 2012, 2(1), 40-54; https://doi.org/10.3390/min2010040
Submission received: 17 January 2012 / Revised: 16 February 2012 / Accepted: 17 February 2012 / Published: 27 February 2012
(This article belongs to the Special Issue Advances in Biominerals)

Abstract

:
Mollusk shells, especially the nacre, are of commercial interest as well as palaeoenvironmental proxies. They are also investigated as biomaterials for medical purposes and biomimetics. Although the mineralogy is well-known and unique (aragonite tablets), the organic components are various. However, determination of the precise composition of the soluble organic matrix (SOM) of the nacreous layer is difficult. Among the range of possible techniques, 1D electrophoresis and High-performance liquid chromatography (HPLC) have previously been applied separately to differentiate pI and molecular weights. To date, no clear correlation has been established between the two parameters obtained in such conditions. Here, we report the use of preparative electrophoresis, coupled with HPLC, to determine the molecular weights of the pI fractions. The results are compared with 2D gel electrophoresis. It is shown that both methods have drawbacks and advantages, and are not redundant. The complexity of the composition of the nacreous tablet shown by scanning electron microscope (SEM) and Atomic Force Microscope (AFM) observations is also evidenced by electrophoresis and HPLC.

1. Introduction

Mollusk shells are collected for their beautiful shapes and colors. Shape, ornamentation and color are the main criteria used for taxonomy and phylogeny. However, Boggild [1] and Taylor et al. [2] have shown that the mineralogy and the arrangement of the shell layers (microstructure) are related to taxonomy. Detailed works have confirmed the potential use of microstructures for taxonomy and phylogeny [3,4]. Among the various layers known in mollusk shells, some have complex 3D arrangements (crossed lamellar layers), whereas others are simple (prism, nacre). Thus, despite the crossed lamellar layer in the more abundant layer, the nacre is the better-known layer. Not only are the brick and wall structure easy to decipher, but nacre is used in jewelry and pearl farming.
The nacreous layer is present in the three main classes: Bivalvia, Gastropoda and Cephalopoda, and Wise [5] and Erben [6] have shown that the arrangement of the tablets differs in these taxa. Using transmission (TEM) and scanning electron microscopes (SEM), Mutvei [7,8,9] has shown that the inner structure of the tablets also differs in the three classes. Topography and structure of the interlamellar and intercrystalline organic components have been studied by Grégoire [10,11,12], Nakahara [13,14]. At this stage, few data are available on the intracrystalline organic matrix, due to the decalcification processes used for transmission electron microscopes. Interlamellar membranes comprise three layers in gastropod nacre, the middle one being soluble [13,14]. Thus, the soluble organic matrix has two components: the intracrystalline matrix and the middle layer of the membranes. Various fractionation procedures were used to characterize the composition of the nacre [15,16,17], but they were mainly focused on the insoluble components. The high contents of the soluble protein fraction in acidic amino acids were shown by Weiner [18]. Since numerous papers deal with the soluble proteins of the nacreous layer of Pinctada, and it is impossible to enter into detailed discussion of the results (see [19]).
Despite all these studies, few data are available on the relationships between the molecular weights and pI of the soluble matrix of the nacreous layer. Acidity was mainly inferred from amino acid analyses, and molecular weights from 1D electrophoresis. Unfortunately, efforts to relate pI to molecular weights have been rare. 1D electrophoresis gels have a limited molecular weights range, so that high molecular weights (>100 or
In this study, we used preparative electrophoresis and HPLC to estimate the molecular weights of the soluble organic matrices fractionated according to the pI of the nacreous layer of the pearl oyster. The results were compared with those of 2D electrophoresis.

2. Results and Discussion

In common with most mollusks, the shell of Pinctada margaritifera (Linnaeus, 1758) has several microstructural layers. The topographical relationships of the two main layers are simple, so that collecting the nacreous layer is easy. Moreover, the nacreous layer is thick, and comprises abundant organic matrices.

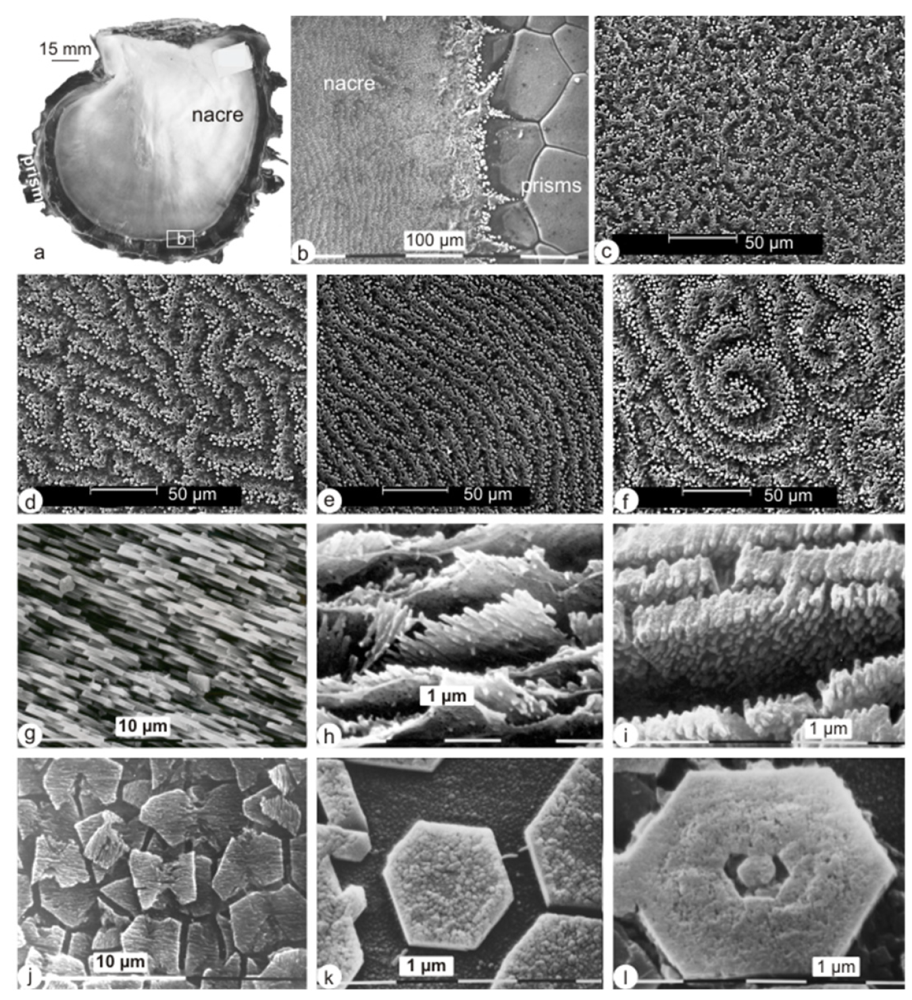
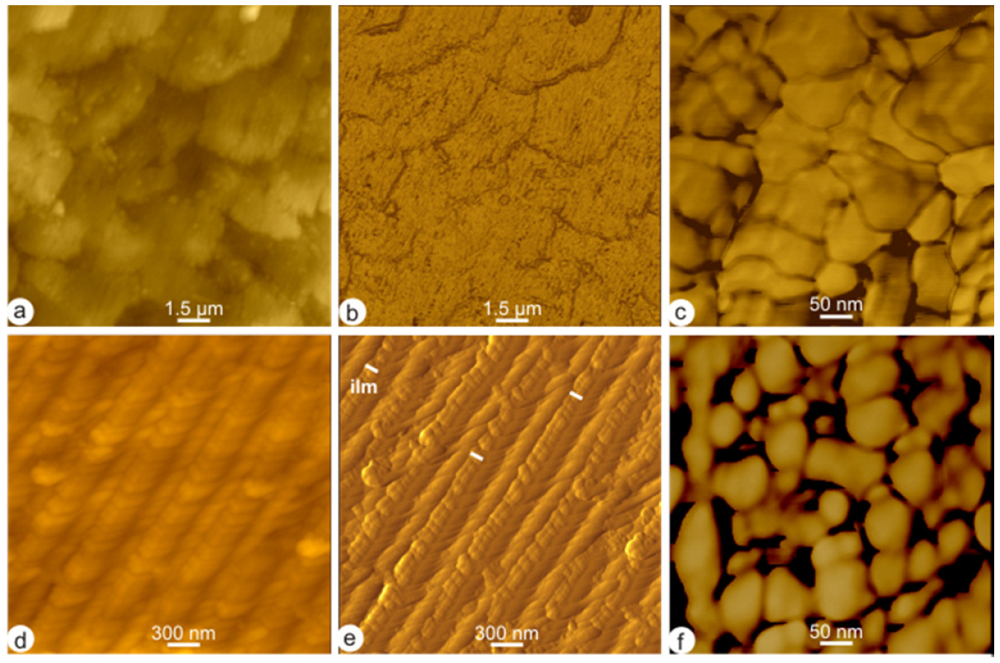
2.1. Micro- and Nanostructures

The thin outer shell layer is composed of calcitic prisms, while the thick inner layer is built by aragonitic nacreous tablets. While the prismatic layer is black, the nacreous layer is black at the first stage, then becomes white (Figure 1a). The first stage of the nacreous layer is an organic deposit on the prisms, mainly on the thick organic walls surrounding the prismatic units (Figure 1b). Mineralized nacreous tablets follow a three-stage pattern (Figure 1c–e) from an irregular to a linear drawing. At last, in the white part of the inner surface, the growth pattern shows the classical spiral arrangement (Figure 1f). The nacreous tablets are arranged in regular layers (Figure 1g) described as “bricks and mortar”, because tablets are separated by organic lamellae. However, tablets are not pure mineral: they are a mixture of mineral and organic materials, as shown by fixed and etched samples (Figure 1h–j). A polished surface etched with the Mutvei’s solution (acetic acid + glutaraldehyde [21]) shows that tablets comprise parallel acicular crystallites parallel to the surface of the tablets, while remains of the interlamellar membranes are visible (Figure 1h). When the organic components are destroyed by commercial NaClO for 20 min, before using the Mutvei’s solution, another arrangement is revealed: parallel acicular crystallites are visible, perpendicular to the surface of the tablets. However, the surface shows that these crystallites are aligned, and are composed of small granules. An enzymatic etching (trypsine) shows that a tablet is composed of two sectors, the solubility of which differs (Figure 1j). Sectors are built by acicular crystallites. Such sectors are not revealed with another enzymatic hydrolysis (pronase), but the granular surface of the tablets is visible, the outer edge being less etched (Figure 1k). The heterogenous composition of a tablet and the different composition of the central part are also shown (Figure 1l).
Unetched and etched surfaces evidence the complexity of the structure and composition of the nacreous layer. Moreover, despite the fact that used enzymes are not specific for a protein, the resulting images displayed various aspects. Thus it may be inferred that the organic components in the interlamellar membranes and within the tablets are numerous.
Atomic force microscope (AFM) images also show the overlapping tablets, the surrounding organic membranes and the inner acicular crystallites (Figure 2a,b). Acicular crystallites are built of aligned granules (Figure 2c). These granules are surrounded by a thin cortex, as shown by phase image. Changes in color within granules suggest their heterogeneous composition (Figure 2d).
Figure 1. Microstructure of the shell of Pinctada margaritifera. (a) Inner view, showing that a large part of the valve is covered with the nacreous layer. The outer prismatic layer is visible on the marginal scales; (b) Detail of the inner surface showing the transition between the outer calcitic prismatic layer and the inner aragonitic nacreous layer; (c) Inner surface: first stage of the nacre, with an irregular pattern, near the transition; (d) Inner surface: second stage of the nacreous layer, towards the inner part of the shell; (e) Inner surface: third stage of the nacreous layer, with parallel bands; (f) Inner surface: classical spiral pattern of the adult nacre; (g) Vertical section showing the layers of nacreous aragonitic tablets; (h) Vertical section showing the interlamellar organic membrane. The fixative-etching solution emphasizes the composite structure of the tablets. Polished, fixed and etched with Mutvei’s solution for 20 min, pH 4 at 15 °C; (i) Vertical fracture showing the inner structure of the nacreous tablets. The elongated crystallites displayed in Figure 1h are aligned. Dilute NaClO for 20 min at 15 °C. Mutvei’s solution for 40 min, pH 4 at 15 °C; (j) Tangential polished surface, showing the soluble and insoluble sectors with a tablet, as described by Mutvei [7,8]. Sectors are composed of elongated acicular crystallites. Etched with trypsine in HEPES buffer, 1 mg/mL for 19 h, 38 °C, pH 7.5; (k) Inner surface showing growing hexagonal tablets with a “soluble” center and a granular structure. Pronase in Ca acetate buffer, 2 mg/mL, 5h 30, pH 8 at 38 °C;(l)Inner surface of the nacreous layer, showing the nodular center of a growing tablet, surrounded by a soluble zone. Unpolished surface, pronase 1 mg/mL for 3 h at 38.2 °C, pH 7.4.
Minerals 02 00040 g001
Figure 2. Nanostructure of the shell of Pinctada margaritifera. Inner surface of the shell, showing the partially superimposed tablets. Muvei’s solution 10 min, room temperature. Critical point drying. AFM height image; (b) AFM phase image of the same. Elongated crystallites within the tablets are visible; (c) Granular structure; granules are surrounded by a cortex (amorphous CaCO3 or amorphous CaCO3 + organic components). Detail of Figure 2a, b; (d) Vertical section showing the layers of tablets. Etched (acetic acid 0.1% + glutaraldehyde 2%) for 10 s at room temperature. AFM height image; (e) AFM phase image of the same, showing the interlamellar organic membrane (ilm); (f) Granular structure of the juvenile nacreous layer. AFM phase image.
Minerals 02 00040 g002

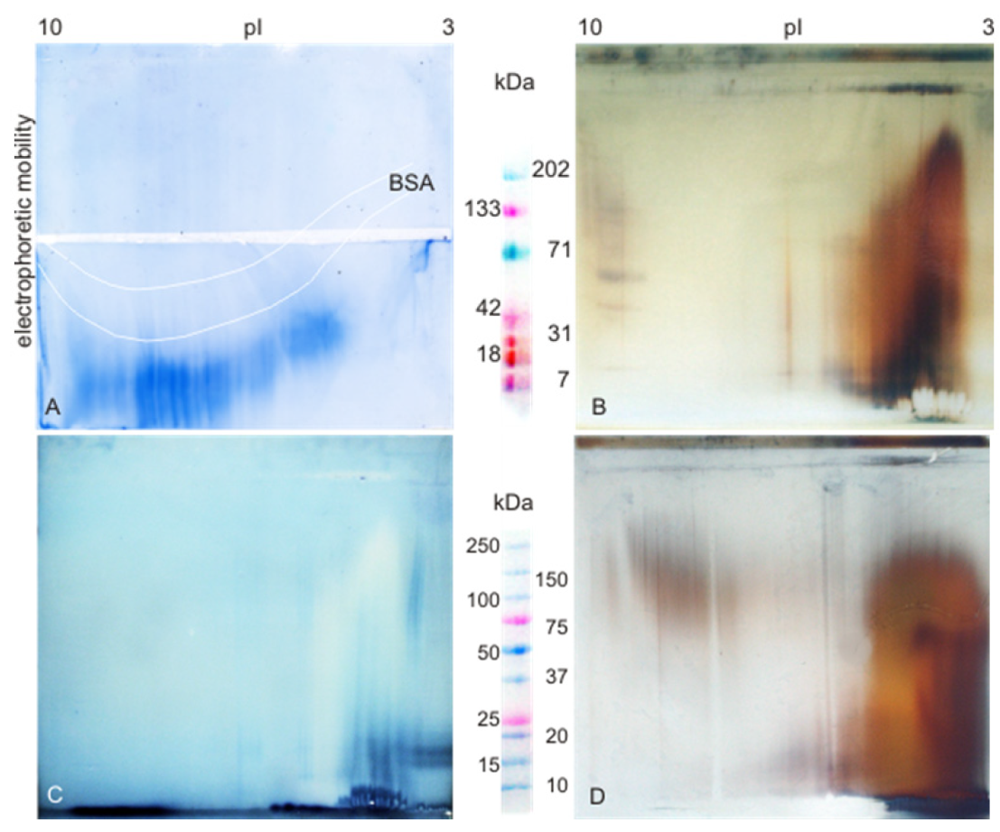
2.2. Bulk Analyses of the Soluble Organic Matrix

In an electrophoretic analysis, the pI of a component equals the pH of its zero mobility. In electrophoretic titration curves (ETC), this corresponds to the pH at which the component curve crosses the trough. Electrophoretic titration curves of bovine serum albumin (BSA) display two pI (4.6 and 5.6) (Figure 3a, white lines). Soluble nacreous matrix shows different electrophoretic mobilities at different pH values (Figure 3a). Coomassie blue stain of the nacreous components is more intense in the basic part of the gel, where the greatest difference in mobilities occurs. Discontinuities in the blue color confirm the heterogeneity and complexity of the nacreous matrix, the pI of which is acidic.

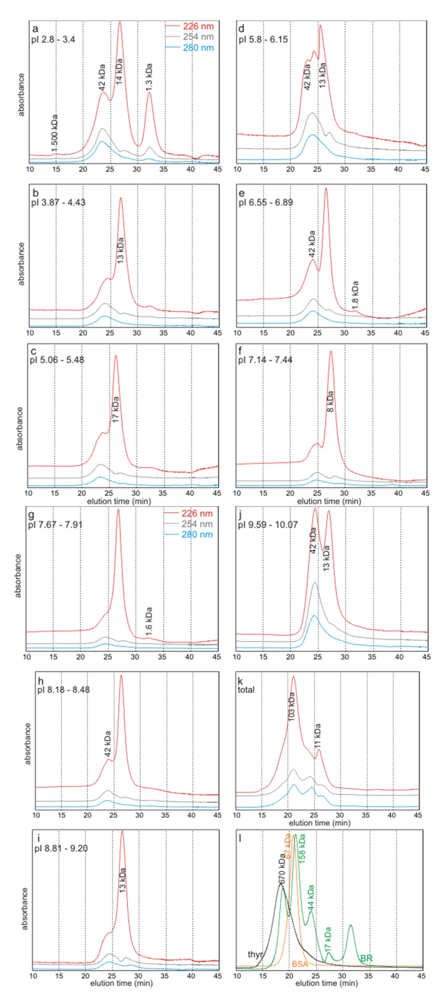
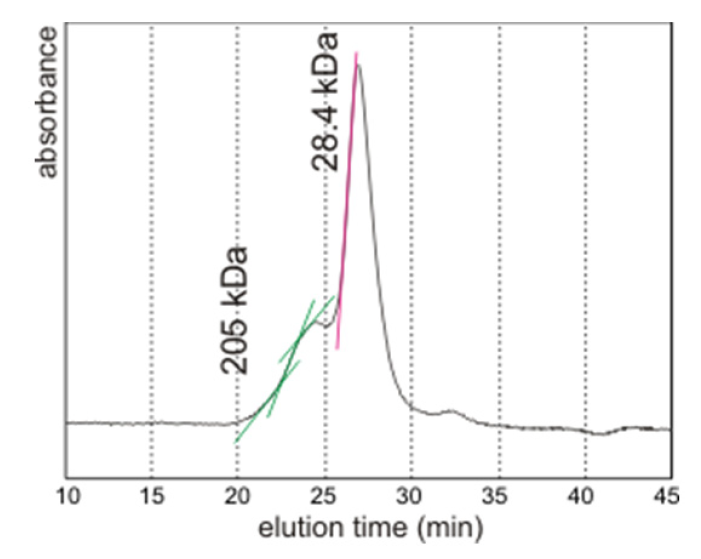
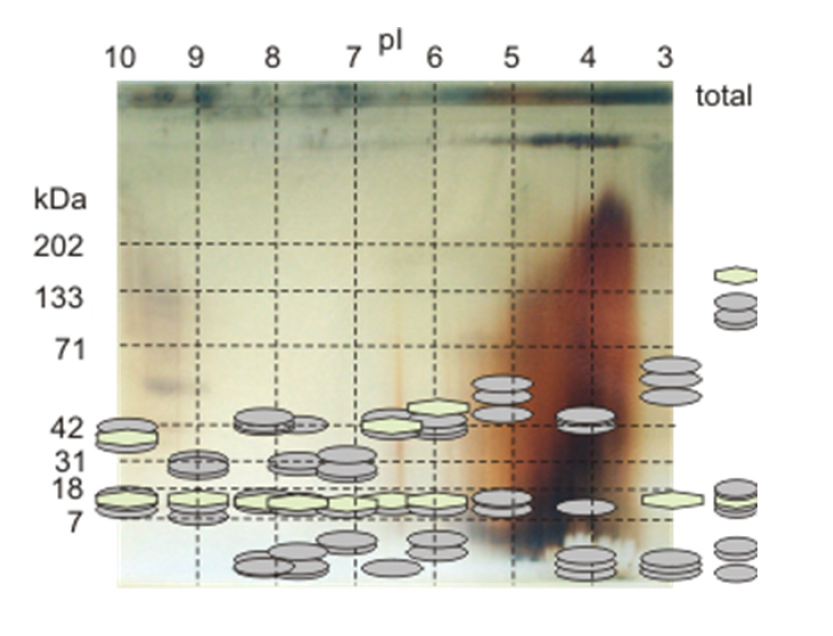
2.3. Molecular Weights Versus pI

IPG strips are stained in 2D electrophoresis, showing that a part of the soluble matrix has high molecular weights (between 250 and 500 kDa) and does not penetrate into the second gel (Figure 3B, D). Using the usual fixative procedure, the immobilized pH gradient strip (IPG strip) is heavily stained in the acidic part (Figure 3b). The acidic part of the 2D gel is heavily stained, with discrete thin lines according to the pl, but with large smears according to the molecular weights. Some discrete faint bands are visible in the basic part of the gel. In the acidic—low molecular weights of the gel, a specific zone with no staining and a “cauliflower” pattern is present. Due to the Coomassie blue stain, the background of the Zn stain gel is blue. However, the discrete thin lines according to the pI, the “cauliflower pattern” and the smears in molecular weights are visible (Figure 3c). The patterns in the acidic parts of the Ag and Zn stained gels are similar. However, pI bands are more visible in the Zn stained gel. The second Ag stained gel, with the special fixative procedure [20], has a slightly different pattern (Figure 3d). IPG strip is stained also in the acidic part. In the second dimension gel, discrete bands are visible according to the pI, while only smears are visible for molecular weights. However, the “cauliflower” pattern of the gel 3b is absent, and a stained zone is shown in the basic—high molecular weights. More acidic components are stained on the right part of the gel. In this gel, a small band in the middle part of the pI range is not visible, as well as the basic part stained in Figure 3b.
Figure 3. Electrophoreses of the soluble organic matrix extracted from the nacreous layer. (a) Titration curve (ETC), showing the acidity of the matrix. Coomassie blue stain; (b) Two dimensional gel: conventional fixing procedure, Ag staining; (c) Two dimensional gel: conventional fixing procedure, Zn staining for proteins; (d) Two dimensional gel: improved fixing procedure, Ag staining.
Minerals 02 00040 g003
HPLC profiles of the soluble matrix pI fractions vary from 1,500 kDa to 1 kDa (Figure 4a–j). The main peak is at 14 kDa (8–17 kDa range) in all the fractions, the second one being at about 42 kDa at 226 nm. However, ratios between the two peaks differ all along the pI range. Small peaks at about 1–2 kDa are also present. At 254 and 280 nm, the main peak is at about 42 kDa (Figure 4a–j). Some fractions show several strong peaks at 226 nm: the first acidic (pI 2.8–3.4, Figure 4a), the last basic (pI 9.59–10.07, Figure 4j), and an intermediate one (pI 5.8–6.15, Figure 4d). However, the main peak at 254 and 280 nm is also at about 42 kDa in these three fractions.
The main peak of the bulk soluble matrix is at about 103 kDa (Figure 4k), the second peak is at about 11 kDa at 226 nm. At 254 and 280 nm, the profiles are similar. An intermediate third peak is well marked at 254 and 280 nm, but appears as a shoulder at 226 nm. A weak shoulder is also present at about 1,500 kDa.
Figure 4. HPLC profiles of SOM after the pI fractionation with preparative electrophoreses (ai); l: standard proteins. Molecular weights differ in every fraction. However the asymmetry of the peaks shows that they are composed of several molecules.
Minerals 02 00040 g004

2.4. Discussion

2.4.1. Methods

The main features are similar in the three 2D gels, resulting from different fixative and staining procedures. However, details are different, especially in the low molecular weights—acidic pI.
Molecular weights can be estimated with HPLC and electrophoresis. However, these two methods are not redundant, as shown by the results on the soluble organic matrix extracted from the nacreous layer of Pinctada margaritifera. Some problems are common: because of the complexity and abundance of molecules, no discrete molecular weights were obtained in both HPLC and 2D electrophoresis. Moreover, the calibration was done with standard globular proteins (Figures 3, 4l). HPLC profiles show the difficult task of calibration. The BioRad standard contains thyroglobuline at 670 kDa. It can be seen that the peak is not at the same elution time when compared with an isolated thyroglobuline (Figure 4l); despite their having the same molecular weights according to the data sheets. Both HPLC and electrophoresis have advantages and disadvantages. Electrophoresis allows several successive staining procedures, so that several characteristics of the molecules are obtained in a single run. The exact position of acidic and neutral sugars and glycoproteins is visible. However, the range of the molecular weights is limited, and a part of the matrices does not penetrate in the first strip, as shown by the blue or brown color. The maximal molecular weights in these pI gels are about 500 kDa. HPLC allows a better range of molecular weights, with columns connected in a series. With several detectors, it is possible to estimate the composition of the matrices. However, only molecular weights are estimated. Protein molecular weights are also determined using time-of-flight mass spectrometry (TOF-MS). Despite a theoretical wide molecular weights range, these analytical systems are usually calibrated for a small range, so that only a part of the components is known. Moreover, they are often coupled with 2D electrophoresis or liquid chromatography, and the larger molecular weights are not included. It is also used to quantify proteins, sugars or lipids, or to identify proteins through proteomics techniques.
The fractionation according to the pI is a separate procedure. Concerns are high about the pH range of available ampholytes, especially for low-pH values; the ampholytes used for calibration (Biorad Bio-lytes 3/10) are only guaranteed for pH between 3.5 and 9.5: no relevant data can therefore be collected for very acidic molecules (pI
Absence of the high molecular weights of the total SOM is clearly visible in a diagram showing the HPLC profiles for every pI fraction for every wavelength (Figure 5).
Figure 5. HPLC profiles showing the molecular weights of every pI fraction and of the non‑fractionated SOM (total), displayed according to the UV wavelength detection and refractometric index. The diversity of the molecular weights in different fractions is visible.
Minerals 02 00040 g005
Moreover, HPLC and electrophoresis allow only an estimate of molecular weights. Smears are dominant in electrophoresis, whereas the shape and asymmetry of the peaks in HPLC clearly show that several molecules are included within a peak (Figure 6). Thus, the apparent discrepancy between the main molecular weights in fractionated matrices and the bulk matrix can be explained by poor separation in both techniques. A comparison of the HPLC and 2D electrophoresis has been attempted in the range of the electrophoresis molecular weights (Figure 7). Thus, the highest molecular weights detected with HPLC, at about 1,500 kDa, are not shown in this figure. Given that molecular weights are only estimated, there is no discrepancy in the molecular weights of the total organic matrix (HPLC) and electrophoresis. It must be noted that the number of SOM components is probably very high. Such a study has not been done on mollusk shells. However, it may be suggested that the “lost” molecular weights in the fractionated matrix are included in the asymmetric peaks in HPLC profiles due to “poor” separation.
Thus, depending on the selected parameters, there is neither a good nor a bad method.
Figure 6. Figure 6. HPLC profile showing that the slope is composed of several units; this is indicative of the presence of several molecular weights.
Minerals 02 00040 g006
Figure 7. Figure 7. Comparison of a 2D-electrophoresis gel and molecular weights as determined using HPLC (oval: UV detection, polygon: refractometric detection).
Minerals 02 00040 g007

2.5. Comparison with the Known Proteins in Nacre

Despite the fact that nacre is the best-known layer, few components are separated and identified. Among them, most are proteins. Sugars and lipids are also present [22,23], but they are not well known. Proteins extracted from the insoluble and soluble matrix have been identified in the nacreous layer of several Pinctada species. Because of the diversity of preparative extraction, data are confused. Moreover, soluble matrices have been extracted from the insoluble matrix using different etching processes such as alkali solution [24]. Such results confirm the TEM observations of Nakahara [13] on the structure of the interlamellar membranes of the nacreous structure.
Despite some proteins being named from their apparent molecular weights, they often comprise several variants, so that the small differences are visible as irregularities in HPLC spectra or electrophoreses with a wide range of molecular weights. Bédouet et al. [25] have observed several bands in the acetic-soluble matrix of P. maxima: a main band at 20 kDa, and several faint bands at 60, 15, 12 and 9 kDa. Pereira-Mouries et al. [26] have confirmed that the concept of insoluble and soluble matrices depends on the demineralizing procedures. Both water-soluble and EDTA-soluble matrices appear as smears in SDS PAGE electrophoresis. However, two faint bands are visible at about 14 and 20 kDa in the EDTA-soluble matrix. They suggested that the 14 kDa band is similar to the acidic N14 protein (pI 4.8) described by Kono et al. [27] in P. maxima. P14 is known in the acetic acid-soluble matrix [28]. The acetic-soluble matrix of P. fucata yields the P60 protein, a complex composed of several units [29]. The nacrein, N28 and N35 proteins are included in the P60. The EDTA-soluble matrix of P. fucata was also analyzed [30,31]. Smears were observed between 45–60 kDa, and below 43 kDa. The EDTA-soluble matrix band at 55 kDa (nacrein) was shown to be glycosylated and sulfated [32]. Faint bands at 35, 25 and 21 kDa were also detected in P. fucata.
Attempts to solubilize the insoluble acidic extracts were more or less successful and provide additional data. It must be noted that in most cases, the used electrophoretic gels allow only “low” molecular weights (
An exact correlation between the results obtained by different methods is not easy. However, the main features are similar: low sugar content, low organic sulfate content, numerous proteins, and moderate to high pI.

3. Experimental Section

3.1. Materials

Adult specimens of Pinctada margaritifera (Linnaeus, 1758) (Pteriomorpha, Pterioida, Pteriacea, Pteriidae) were collected in farms from French Polynesia. The shell is large, almost equivalve, with moderately convex valves. Concentric growth scales are present on the outer side of the valves. The outline is almost circular, and the outer color is greyish green. The inner part of the shell is white with black margins (Figure 1a).
Precision Plus standards (10–250 kDa), kaleidoscope pre-stained standards (6.9–202 kDa), gel filtration standards and ampholytes were from BioRad. Chondroitin sulfate A and trypsine were obtained from Sigma. Pronase was purchased from Merck.

3.2. Organic Matrix Extraction

To remove contaminants and residual tissues, samples were immersed in 3% NaClO for 1 hour. The samples were then rinsed with Milli-Q water, dried, and ground into powder. Powdered samples were immersed in 5 mL of Milli-Q water, then decalcified by progressive addition of 50% acetic acid to maintain the pH above 4. The entire extract was centrifuged at 20,000 g for 15 min to yield a soluble (SOM) and an insoluble (IOM) fraction. The soluble fraction was desalted by exchange with Milli-Q water on a micro-concentrator (Filtron) using a 3-kDa cut-off membrane and lyophilized.

3.3. Scanning Electron (SEM) and Atomic Force (AFM) Microscopes

Fractured and polished surfaces were used. Polished sections were etched with various acids and enzymes to reveal microstructural features; details of sample preparations are given in the figure legends. SEM observations were conducted using a Philips SEM 505 and XL30 microscopes. AFM observations were obtained with a Veeco Nanoscope III Dimension 3100. Samples were imaged at room temperature and in air. The probe consisted of a cantilever with an integrated silicon nitride tip. Micron scale images were acquired using tapping mode and phase imaging.

3.4. Electrophoreses

Electrophoretic titration curves (ETC): Non-denaturing electrophoresis was done to estimate the acidity of the soluble organic matrices. The charge intensity curve of proteins was determined with carrier ampholyte gels. Homogeneous polyacrylamide gels (T 4.2%, C 3%) with 3% ampholytes BioLyte pH 3–10, were prepared [33]. Components with molecular weights near 500 kDa can be detected with such gels. Following the electrophoretic run, the gels were placed in a fixing and staining colloidal Coomassie solution. Because of the absence of SDS in the gel and buffer, a washing phase is not necessary. Gels were then washed in water for 1h to remove the acid.
2D gel electrophoresis was done using the procedure described in Dauphin [34,35]. After electrophoresis and before Ag staining, two fixative procedures were used on two other gels: (1) the gel was placed in 40% methanol with 10% acetic acid for 24 h to fix the proteins and to remove the SDS; (2) the gel was fixed according to Gotliv et al. [20].
Preparative isoelectric focusing (IEF) was performed on a Rotofor cell (Biorad). A 5 W pre-run was done to allow the system to come to thermal equilibrium, so that the chiller was adjusted at 5 °C. The sample was mixed with ampholytes (pH 3–10) and Milli-Q water. Electrolyte buffers were: (1) anode NaOH 0.1M and cathode: H3PO4 0.1M. The power supply was set to 15 W constant power and the run was stopped when the voltage reached a constant value (total time ~4 h). Twenty fractions were obtained, fraction 1 at the anode pole and fraction 20 at the cathode pole. After focusing, the solution in each compartment is collected. Ampholytes were removed using 3 kDa Microsep centrifugated for 75 min at 5,000 g; then, purified samples were lyophilized.
Chromatographic analyses were performed using two TSK G5000PW and G3000PW columns. These columns were used in series allowing the separation of proteins from 200 to 1 × 10⁶ Da. They were eluted with 0.2 mM Tris, pH 7.5 at a flow rate of 0.75 mL/min using a high sensitivity refractive index detector PE 200 (Perkin-Elmer), and a multiple wavelength—diode array detector Agilent series1200 and monitored at 210, 226, 254 and 278 nm. The quantity of soluble matrices in each of the 20 fractions resulting from IEF was low. Thus, two successive fractions were mixed to obtain 10 fractions. The lyophilized SOM was dissolved in the buffer overnight, and all analyses were performed at ambient temperature.

4. Conclusions

Only a small number of individual components are known in the most studied structure of invertebrate skeletons: the nacreous layer of mollusk shells. Moreover, most of these are proteins. The comparison of preparative electrofocusing (pI)—HPLC (molecular weights) and 2D electrophoresis data shows that high molecular weight components exist, despite the fact that only low molecular weights proteins have been identified. The observed smears in 2D electrophoresis correspond to the asymmetric peaks in HPLC, despite the different buffers used in these methods. Thus, it may be inferred that the SOM of the nacreous layer of Pinctada comprises numerous individual components, perhaps hundreds as for the chicken eggshell. Such hypothesis is strengthened by the variety of figures obtained with different fixative and etching procedures. The special composition of the central part of the tablets has been previously shown [36,37,38], and also the differential solubility of the sectors [36]. However, a precise localization of these different molecules is not yet known.
Similar data are not available for other Pinctada species used in pearl farming. As for the SOM role in the biomineralization process, data are scarce despite that in vitro CaCO3 crystallization experiments show that proteins of the soluble and “insoluble organic matrices can modify the shape of the resulting crystals.

Acknowledgements

Funding from ANR Pnano under Project No. ANR-07-NANO-061-02-MONOPOLY is gratefully acknowledged.

References

  1. Boggild, O.B. The shell structure of the Mollusks. Det Kongelige Danske Videnskabernes Selskabs Skrifter Naturvidenskabelig Og Mathematisk Afdeling 1930, 9, 231–326. [Google Scholar]
  2. Hall, A.; Kennedy, W.J.; Taylor, J.D. The shell structure and mineralogy of the Bivalvia. II. Lucinacea-Clavagellacea. Bull. Br. Mus. Nat. hist. Zool. 1973, 22, 253–294. [Google Scholar]
  3. Kobayashi, I. Internal microstructure of the shell of Bivalve Molluscs. Am. Zool. 1969, 9, 663–672. [Google Scholar]
  4. Kobayashi, I. Various patterns of biomineralization and its phylogenetic significances in Bivalve mollusks. In The Mechanisms of Biomineralization in Animals and Plants; Eds., Watabe, N., Omori, M., Eds.; 1980; Tokai University Press: Tokyo, Japan. [Google Scholar]
  5. Wise, S.W., Jr. Microarchitecture and mode of formation of nacre (mother-of-pearl) in Pelecypods, Gastropods, and Cephalopods. Ecolog. Geol. Helv. 1970, 63, 775–797. [Google Scholar]
  6. Erben, H.K. Uber die Bildung und das Wachstum von Perlmutt. Biomineralization 1972, 4, 16–36. [Google Scholar]
  7. Mutvei, H. The nacreous layer in Mytilus, Nucula, and Unio (Bivalvia)—Crystalline composition and nucleation of nacreous tablets. Calc. Tiss. Res. 1977, 24, 11–18. [Google Scholar] [CrossRef]
  8. Mutvei, H. Ultrastructural characteristics of the nacre in some Gastropods. Zool. Scripta 1978, 7, 287–296. [Google Scholar] [CrossRef]
  9. Mutvei, H. Ultrastructural research on molluscan nacre. In. In Proceedings of the 27th International Geological Congress, Moscow, Russia, 1984.
  10. Grégoire, C. Topography of the organic components in mother-of-pearl. J. Biophys. Bioch. Cytol. 1957, 3, 798–808. [Google Scholar]
  11. Grégoire, C. Further studies on structure of the organic components in mother-of-pearl, especially in pelecypods (part 1). Bull. Inst. Roy. Sci. Nat. Belg. 1960, 36, 1–22. [Google Scholar]
  12. Grégoire, C. Sur la structure des matrices organiques des coquilles de Mollusques. Biol. Rev. 1967, 42, 653–688. [Google Scholar] [CrossRef] [PubMed]
  13. Nakahara, H. An electron microscope study of the growing surface of nacre in two gastropod species, Turbo cornutus Tegula pfeifferi. Venus 1979, 38, 205–211. [Google Scholar]
  14. Nakahara, H. Calcification in gastropod nacre. In Biomineralization and Biological Metal Accumulation; Eds., de Jong, E.W., Westbroek, P., Eds.; 1983; Reidel Pub.: Dordrecht, The Netherlands. [Google Scholar]
  15. Itasaka, O.; Hatano, H.; Tanaka, S. Biochemical Studies on pearl. IX. Amino acid composition of conchiolin in pearl and shell. Bull. Chem. Soc. Jpn. 1960, 33, 543–545. [Google Scholar] [CrossRef]
  16. Voss-Foucart, F. Essais de solubilisation et de fractionnement d'une conchioline (nacre murale de Nautilus pompilus, mollusque céphalopode). Comp. Biochem. Physiol. 1968, 26, 877–880. [Google Scholar] [CrossRef]
  17. Voss-Foucart, F. Constituants organiques des coquilles de mollusques actuels et fossiles. Haliotis 1972, 2, 81–88. [Google Scholar]
  18. Weiner, S.W. Aspartic acid-rich proteins: Major components of the soluble organic matrix of mollusk shells. Calcif. Tissue Int. 1979, 29, 167–193. [Google Scholar]
  19. Bonucci, E. Biological Calcification. Normal and Pathological Processes in the Early Stages; 2007; p. 592. Springer-Verlag: Berlin, Germany. [Google Scholar]
  20. Weiner, S.; Addadi, L.; Gotliv, B.A. Mollusk shell acidic proteins: in search of individual functions. Biochemistry 2003, 4, 522–529. [Google Scholar]
  21. Dunca, E.; Fiebig, E.; Pfeiffer, P.; Schöne, B.R. Mutvei’s solution: An ideal agent for resolving microgrowth structures of biogenic carbonates. Paleoegeogr. Palaeoclim. Palaeoecol. 2005, 228, 149–166. [Google Scholar] [CrossRef]
  22. Dauphin, Y.; Farre, B. Lipids from the nacreous and prismatic layers of two Pteriomorpha Mollusk shells. Comp. Biochem. Physiol. 2009, B152, 103–109. [Google Scholar]
  23. Lopez, E.; Le Ny, K.; Gasser, P.; Lati, E.; Bédouet, L.; Rousseau, M. Restoration of stratum corneum with nacre lipids. Comp. Biochem. Physiol. 2006, B145, 1–9. [Google Scholar]
  24. Akera, S.; Horita, C.; Hasegawa, K.; Kono, M.; Hayashi, N.; Samata, T. A new matrix protein family related to the nacreous layer formation of Pinctada fucata. FEBS Lett. 1999, 462, 225–229. [Google Scholar] [CrossRef] [PubMed]
  25. Giraud, M.; Lopez, E.; Milet, C.; Marin, F.; Schuller, M.J.; Bédouet, L. Soluble proteins of the nacre of the giant oyster Pinctada maxima and of the abalone Haliotis tuberculata: Extraction and partial analysis of nacre proteins. Comp. Biochem. Physiol. 2001, B128, 389–400. [Google Scholar]
  26. Lopez, E.; Milet, C.; Barthelemy, M.; Peduzzi, J.; Ribeiro, C.; Almeida, M.J.; Pereira-Mouries, L. Soluble silk-like organic matrix in the nacreous layer of the bivalve Pinctada maxima. Eur. J. Biochem. 2002, 269, 4994–5003. [Google Scholar] [CrossRef] [PubMed]
  27. Samata, T.; Hayashi, N.; Kono, M. Molecular mechanism of the nacreous layer formation in Pinctada maxima. Biochem. Biophys. Res. Com. 2000, 269, 213–218. [Google Scholar] [CrossRef] [PubMed]
  28. Nie, Y.; Xie, L.; Zhang, R.; Zhang, C.; Ma, C. Extraction and purification of matrix protein from the nacre of pearl oyster Pinctada fucata. TSINGHUA Sci. Tech. 2005, 10, 499–503. [Google Scholar] [CrossRef]
  29. Xu, Z.F.; Zhou, W.; Wang, Y.; Chen, R.; Su, W.; Zhou, J.; Zhang, X.; Lao, Y. Characterization and in vitro mineralization function of a soluble protein complex P60 from the nacre of Pinctada fucata. Comp. Biochem. Physiol. 2007, B148, 201–208. [Google Scholar]
  30. Zhang, R.; Xie, L.; Ma, Z.; Yan, Z.; Liu, X.; Shangguan, J.; Gong, N. Immunolocalization of matrix proteins in nacre lamellae and their in vivo effects on aragonitic tablet growth. J. Struct. Biol. 2008, 164, 33–40. [Google Scholar] [CrossRef] [PubMed]
  31. Zhang, R.; Xie, L.; Yan, Z.; Li, Q.; Li, Q.; Ma, Z.; Gong, N. Characterization of calcium deposition and shell matrix protein secretion in primary mantle tissue culture from the marine pearl oyster Pinctada fucata. Biotechnology 2008, 10, 457–465. [Google Scholar]
  32. Samata, T.; Ishikawa, F.; Norizuki, M.; Takakura, D. Isolation and characterization of the N-linked oligosaccharides in nacrein from Pinctada fucata. Mar. Biotechnol. 2008, 10, 290–296. [Google Scholar] [CrossRef] [PubMed]
  33. Westermeier, R. Electrophoresis in practice. In A Guide to Methods and Applications of DNA and Protein Separations; 1997; p. 331. VCH Verlagsgesellschaft mbH: Weinhiem, Germany. [Google Scholar]
  34. Dauphin, Y. Comparative studies of skeletal soluble matrices from some scleractinian corals and mollusks. Int. J. Biol. Macromol. 2001, 28, 293–304. [Google Scholar] [CrossRef] [PubMed]
  35. Dauphin, Y. Comparison of the soluble matrices of the calcitic prismatic layer of Pinna nobilis (Mollusca, Bivalvia, Pteriomorpha). Comp. Biochem. Physiol. 2002, A132, 577–590. [Google Scholar]
  36. Mutvei, H. On the micro- and ultrastructure of the conchiolin in the nacreous layer of some recent and fossil mollusks. Stockholm Contr. Geol. 1969, XX, 1–16. [Google Scholar]
  37. Ristedt, H.; Crenshaw, M.A. The histochemical localization of reactive groups in septal nacre from Nautilus pompilius L. In The Mechanisms of Mineralization in the Invertebrates and Plants; Wilbur, K.M., Eds., Watabe, N., Eds.; 1976; Volume 5, pp. 355–367. The University of South Carolina Press: Columbia, SC, USA. [Google Scholar]
  38. Weiner, S.; Addadi, L.; Gotliv, B.A.; Nudelman, F. Mollusk shell formation: mapping the distribution of organic matrix components underlying a single aragonitic tablet in nacre. J. Struct. Biol. 2006, 153, 176–187. [Google Scholar] [CrossRef] [PubMed]

