Article

Mechanisms of Vanadium Recovery from Stone Coal by Novel BaCO3/CaO Composite Additive Roasting and Acid Leaching Technology

1
School of Resource and Environmental Engineering, Wuhan University of Science and Technology, Wuhan 430081, China
2
Hubei Provincial Engineering Technology Research Center of High Efficient Cleaning Utilization for Shale Vanadium Resource, Wuhan 430081, China
3
Hubei Collaborative Innovation Center for High Efficient Utilization of Vanadium Resources, Wuhan 430081, China
*
Authors to whom correspondence should be addressed.
Minerals 2016, 6(2), 26; https://doi.org/10.3390/min6020026
Submission received: 14 December 2015 / Revised: 22 March 2016 / Accepted: 22 March 2016 / Published: 29 March 2016

Abstract

:
In this report, the vanadium recovery mechanisms by novel BaCO3/CaO composite additive roasting and acid leaching technology, including the phase transformations and the vanadium leaching kinetics, were studied. The purpose of this manuscript is to realize and improve the vanadium recovery from stone coal using BaCO3/CaO as the composite additive. The results indicated that during the composite additive BaCO3/CaO roasting process, the monoclinic crystalline structure of muscovite (K(Al,V)2[Si3AlO10](OH)2) was converted into the hexagonal crystalline structure of BaSi4O9 and the tetragonal crystalline structure of Gehlenite (Ca2Al2SiO7), which could, therefore, facilitate the release and extraction of vanadium. Vanadium in leaching residue was probably in the form of vanadate or pyrovanadate of barium and calcium, which were hardly extracted during the sulfuric acid leaching process. The vanadium leaching kinetic analysis indicated that the leaching process was controlled by the diffusion through a product layer. The apparent activation energy could be achieved as 46.51 kJ/mol. The reaction order with respect to the sulfuric acid concentration was 1.1059. The kinetic model of vanadium recovery from stone coal using novel composite additive BaCO3/CaO could be finally established.

1. Introduction

Vanadium plays important roles in many fields, such as ferrous and nonferrous alloy production [1], thermistors [2], and catalysts [3]. More than 87% of the vanadium resources exist in the form of stone coal in China [4]. To meet the ever-increasing demand of vanadium resources and the exhaustion of stone coal with high-grade vanadium, the utilization, and exploitation of refractory stone coal becomes more and more important.
There are two different kinds of additives utilized for vanadium recovery: roasting additives and leaching additives. Compared to the leaching additives, including Na2CO3 [5,6], H2O2 [7,8], FeSO4 [9], NaClO [10], CaF2 [11], and H2SiF6 [12], the roasting additives are more effectively employed due to their good applicability and availability.
Wang [13] studied different effects on the vanadium leaching efficiency of stone coal. The results indicate that the roasting additive NaCl must be added to destroy vanadium-bearing crystalline form so as to acquire high vanadium leaching efficiency. Zeng [14] studied the NaCl/CaO oxidizing roasting in a laboratory fluidized bed reactor for stone coal. The results indicated that the maximum vanadium leaching rate reached 91% under the optimal conditions. Aarabi-Karasgani [15] studied the Na2CO3 alkaline roasting-acid leaching technology for vanadium recovery from LD (Linz–Donawitz) converter slag. The results indicated that the maximum vanadium recovery of 95% was achieved under the optimum conditions.
Although the results of the above investigations are convincing, a novel composite additive is expected to be found for the high effective extraction of vanadium, especially from the refractory stone coal. At the same time, it should have good availability and be favorable for the optimization of the whole extraction process.
In our previous report, a novel composite additive BaCO3/CaO, based on their similar characteristics in the same main group element, was used for the vanadium recovery from the representative refractory stone coal [16]. However, further investigations on the vanadium recovery mechanisms, based on the intensive systematic discussion of the experimental conditions, are definitely required to explain and promote the application of the composite additive, including the analysis of the crystal transformation relationship and the vanadium leaching kinetics.
The main purpose of this paper is to investigate the different effects on the vanadium leaching efficiency from refractory stone coal for the rate-controlling step determination during the leaching process. Meanwhile, the phase transformations were studied and the leaching kinetic model was established to reveal the vanadium recovery mechanisms and, thus, further improve the recovery effect.

2. Materials and Methods

2.1. Materials

The sample of raw stone coal was obtained from Hubei, China. The ore sample was crushed and ground into powder with the particle size of −0.106 mm. The chemical multi-elemental analysis of the raw stone coal was listed in Table 1. The main mineral phase compositions of the raw ore sample, which were determined by X-ray diffraction analysis (XRD, D/MAX 2500PC, Rigaku, Tokyo, Japan) (Figure 1), included quartz, muscovite, phlogopite, calcite, and pyrite.
The elemental distribution of raw stone coal, which was analysed by energy disperse X-ray spectrometry (EDS or BEI, INCA Energy 350, Oxford Instruments, Oxford, UK), is shown in Figure 2. The EDS spectra analysis of the (i) point showed that the aluminium content was 10.67%, which was close to the theoretical aluminium content 12.80% of muscovite containing vanadium. Meanwhile, the relevance of V, O, Al, Si, and K in the raw stone coal indicated that the vanadium probably existed in muscovite.
Chemical compositions of samples were determined by X-ray Fluorescence (XRF, XRF-1800, Shimadzu, Kyoto, Japan) or Inductively Coupled Plasma-Atomic Emission Spectroscopy (ICP-AES, Optima-4300DV, PerkinElmer, Boston, MA, USA). Phase compositions of solid samples were identified by X-ray diffraction analysis (XRD, D/MAX 2500PC, Rigaku, Tokyo, Japan) using Cu Kα radiation. Microscopic observation and analysis of element distribution in samples were conducted by scanning electron microscopy (SEM, VEGA III, TESCAN, Brno, Czech Republic) equipped with energy disperse X-ray spectrometry (EDS or BEI, INCA Energy 350, Oxford Instruments).

2.2. Experimental Procedure

Twenty grams of stone coal (with a fixed particle size fraction, except for its effect study) was added into the corundum crucible. Then, a certain amount of BaCO3 and CaO was put into it and mixed completely. After the crucible was placed into the muffle furnace, the roasting process started at a required temperature for a certain period of time. When the roasting process was complete, the roasted product was transferred into a leaching pod containing a required amount of sulfuric acid solution according to the liquid-to-solid ratio of 5 mL/g. This ratio refers to the ratio of the leaching agent (mL) to the raw material (g). This means that the volume of the leaching agent was always fixed at 100 mL during the experiments. The solution was stirred continuously for a certain period. After the sample was filtrated, vanadium in filtrate was analyzed to calculate the vanadium leaching efficiency. The vanadium leaching efficiency can be calculated as follows:
η = V β m α × 100 %
where η is the vanadium leaching efficiency (wt %), V is the volume of the filtrate (mL), β is the vanadium content in filtrate (g/mL), m is the mass of raw stone coal (g), and α is the vanadium content in raw stone coal (wt %).
Although the mass change occurred through the roasting process, the vanadium total content was not changed after the roasting process. This means it did not take effect to the investigation of the vanadium leaching efficiency. When the leaching conditions were studied, the change of the mass after the roasting process didn’t need to be adjusted. Therefore, the vanadium leaching efficiency was only investigated for the whole process (from the roasting process to the leaching process).

3. Results and Discussion

3.1. Roasting Process

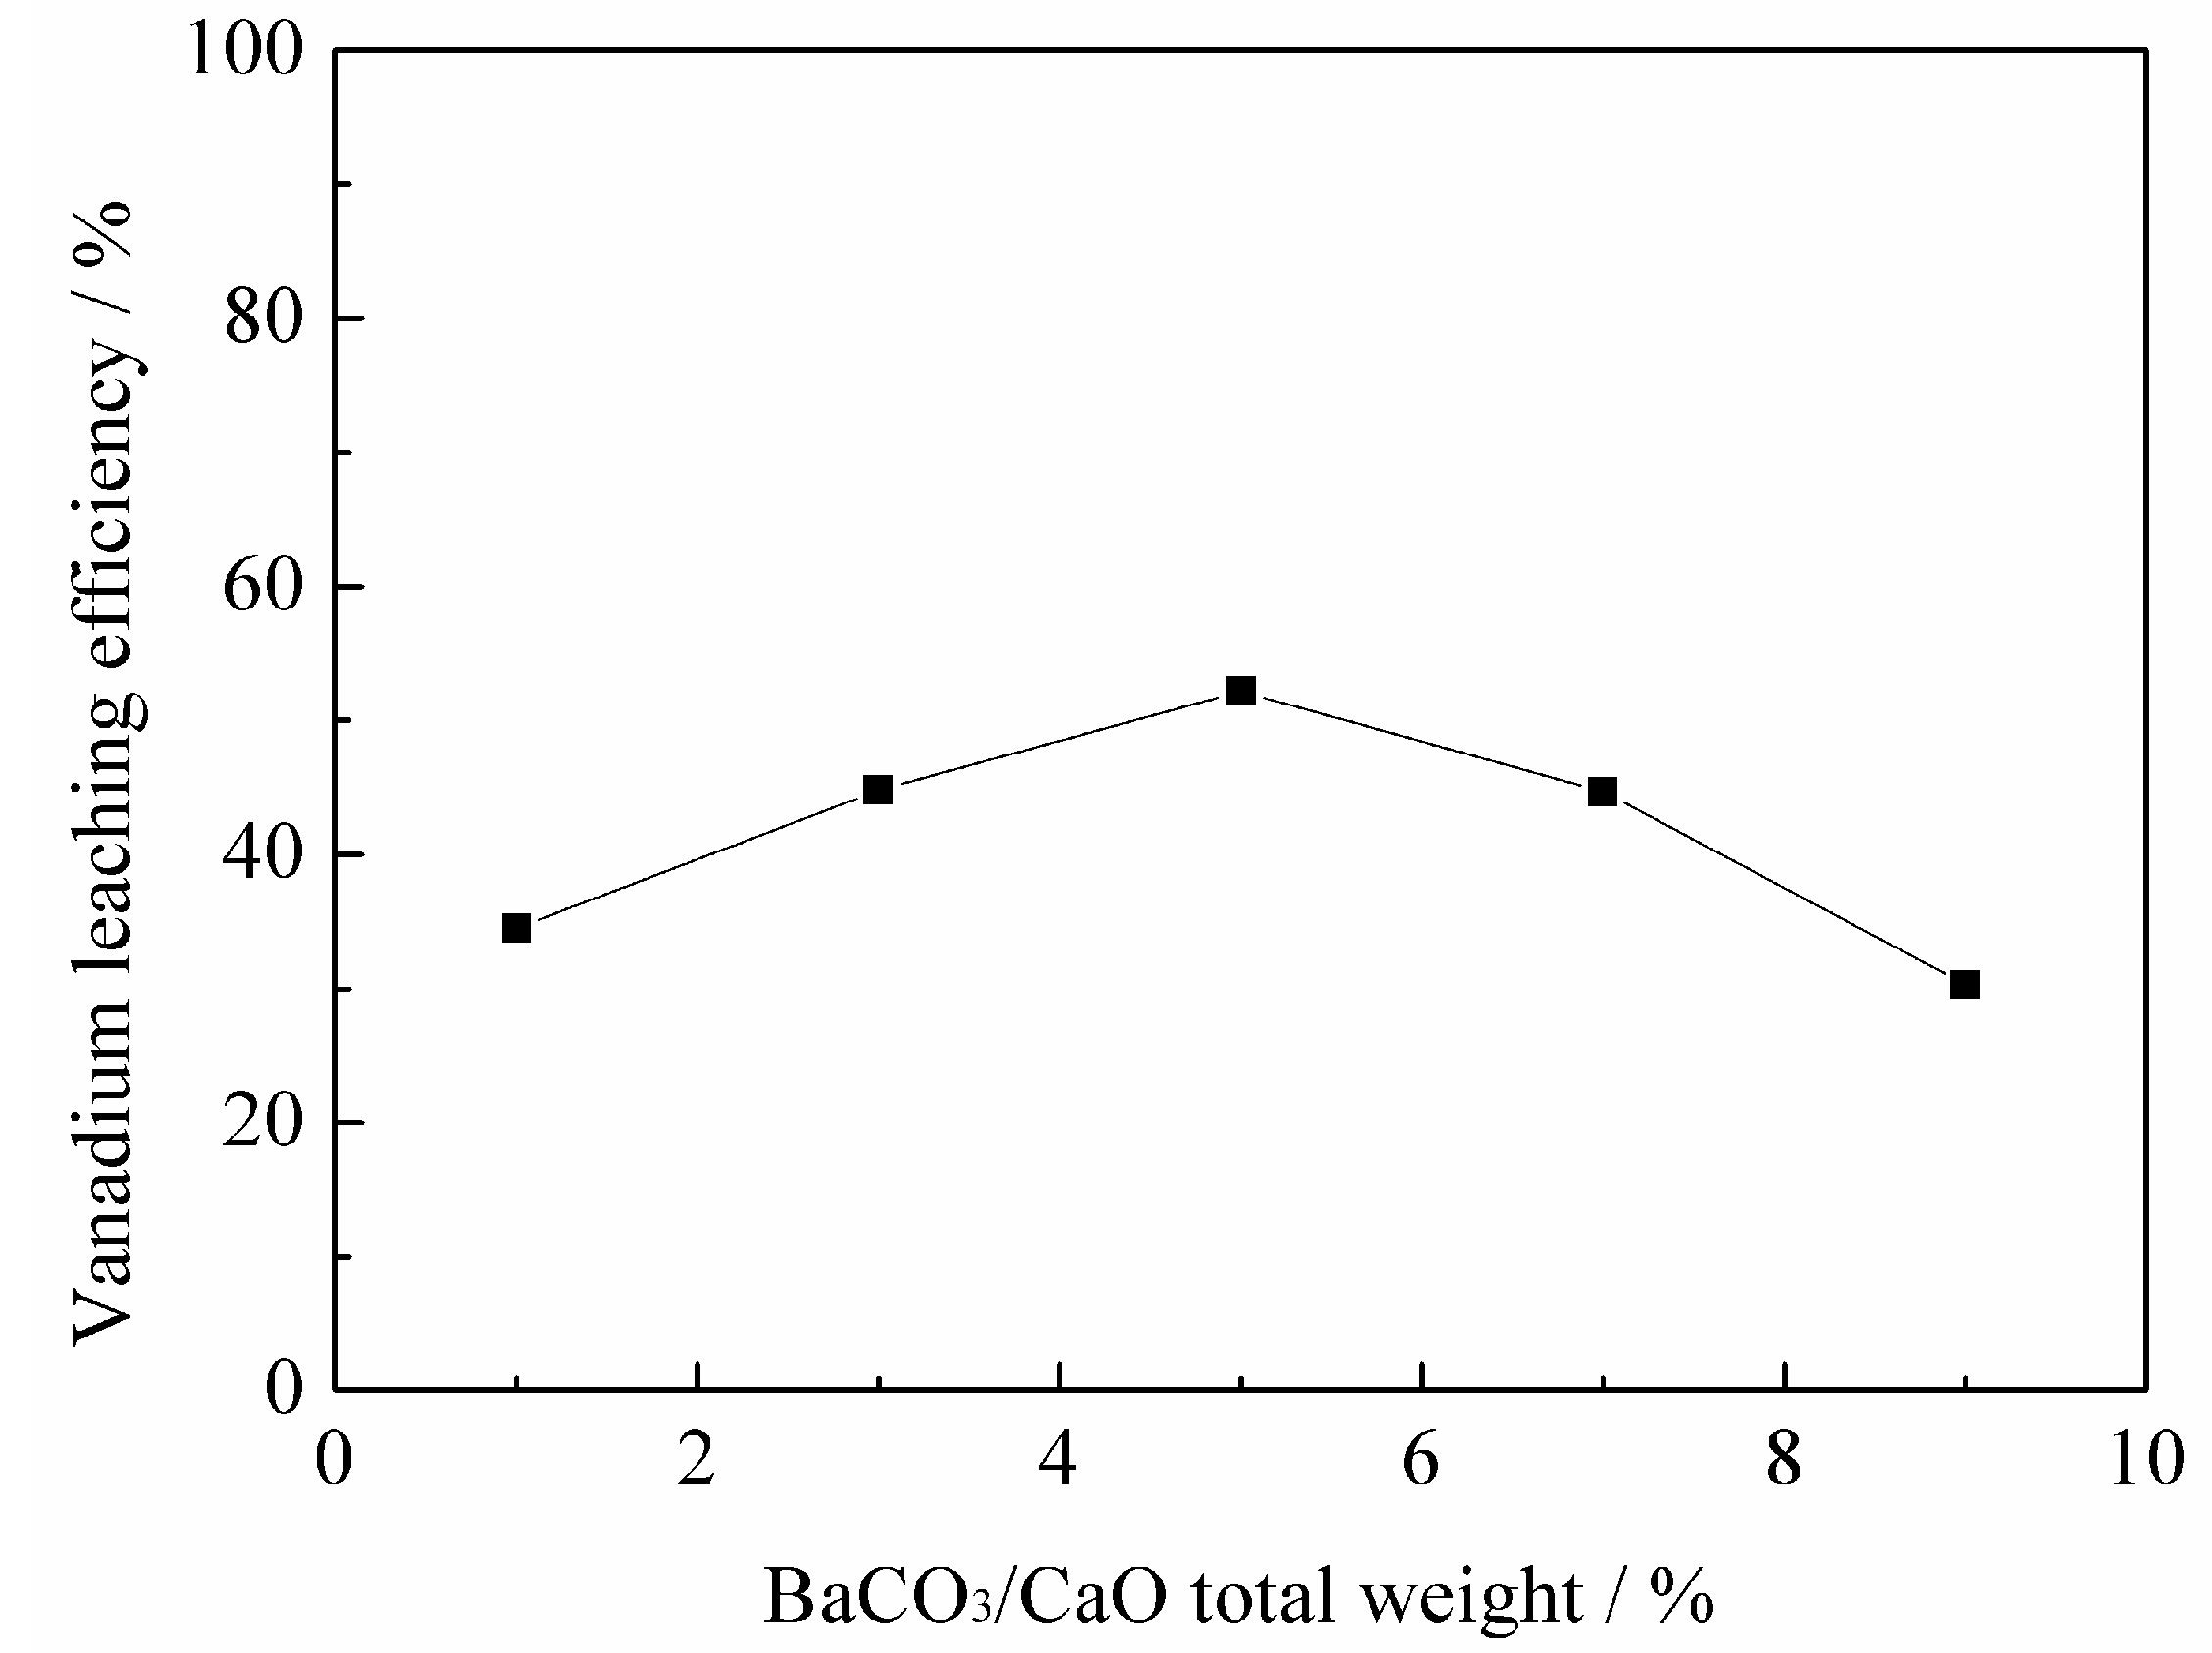
3.1.1. Effect of BaCO3/CaO Total Weight on Vanadium Leaching Efficiency

The effect of BaCO3/CaO total weight from 1 to 9 wt % on the vanadium leaching efficiency was studied (Figure 3), with the BaCO3/CaO mass ratio at 1:9, the roasting temperature at 850 °C, the roasting time for 2 h, the sulfuric acid concentration at 10% (v/v), the leaching temperature at 80 °C, the leaching time for 3 h, and the liquid-to-solid ratio at 5 mL/g. The results indicated that the vanadium leaching efficiency increased with the increase of the BaCO3/CaO total weight from 1 to 5 wt %. A further increase of the BaCO3/CaO total weight will result in the sharp decrease of the vanadium leaching efficiency. The reason was probably that the vanadate or pyrovanadate of barium and calcium were formed, which prohibited the vanadium from being effctively extracted in the following sulfuric acid leaching process. Thus, the optimum BaCO3/CaO total weight should be 5 wt %.

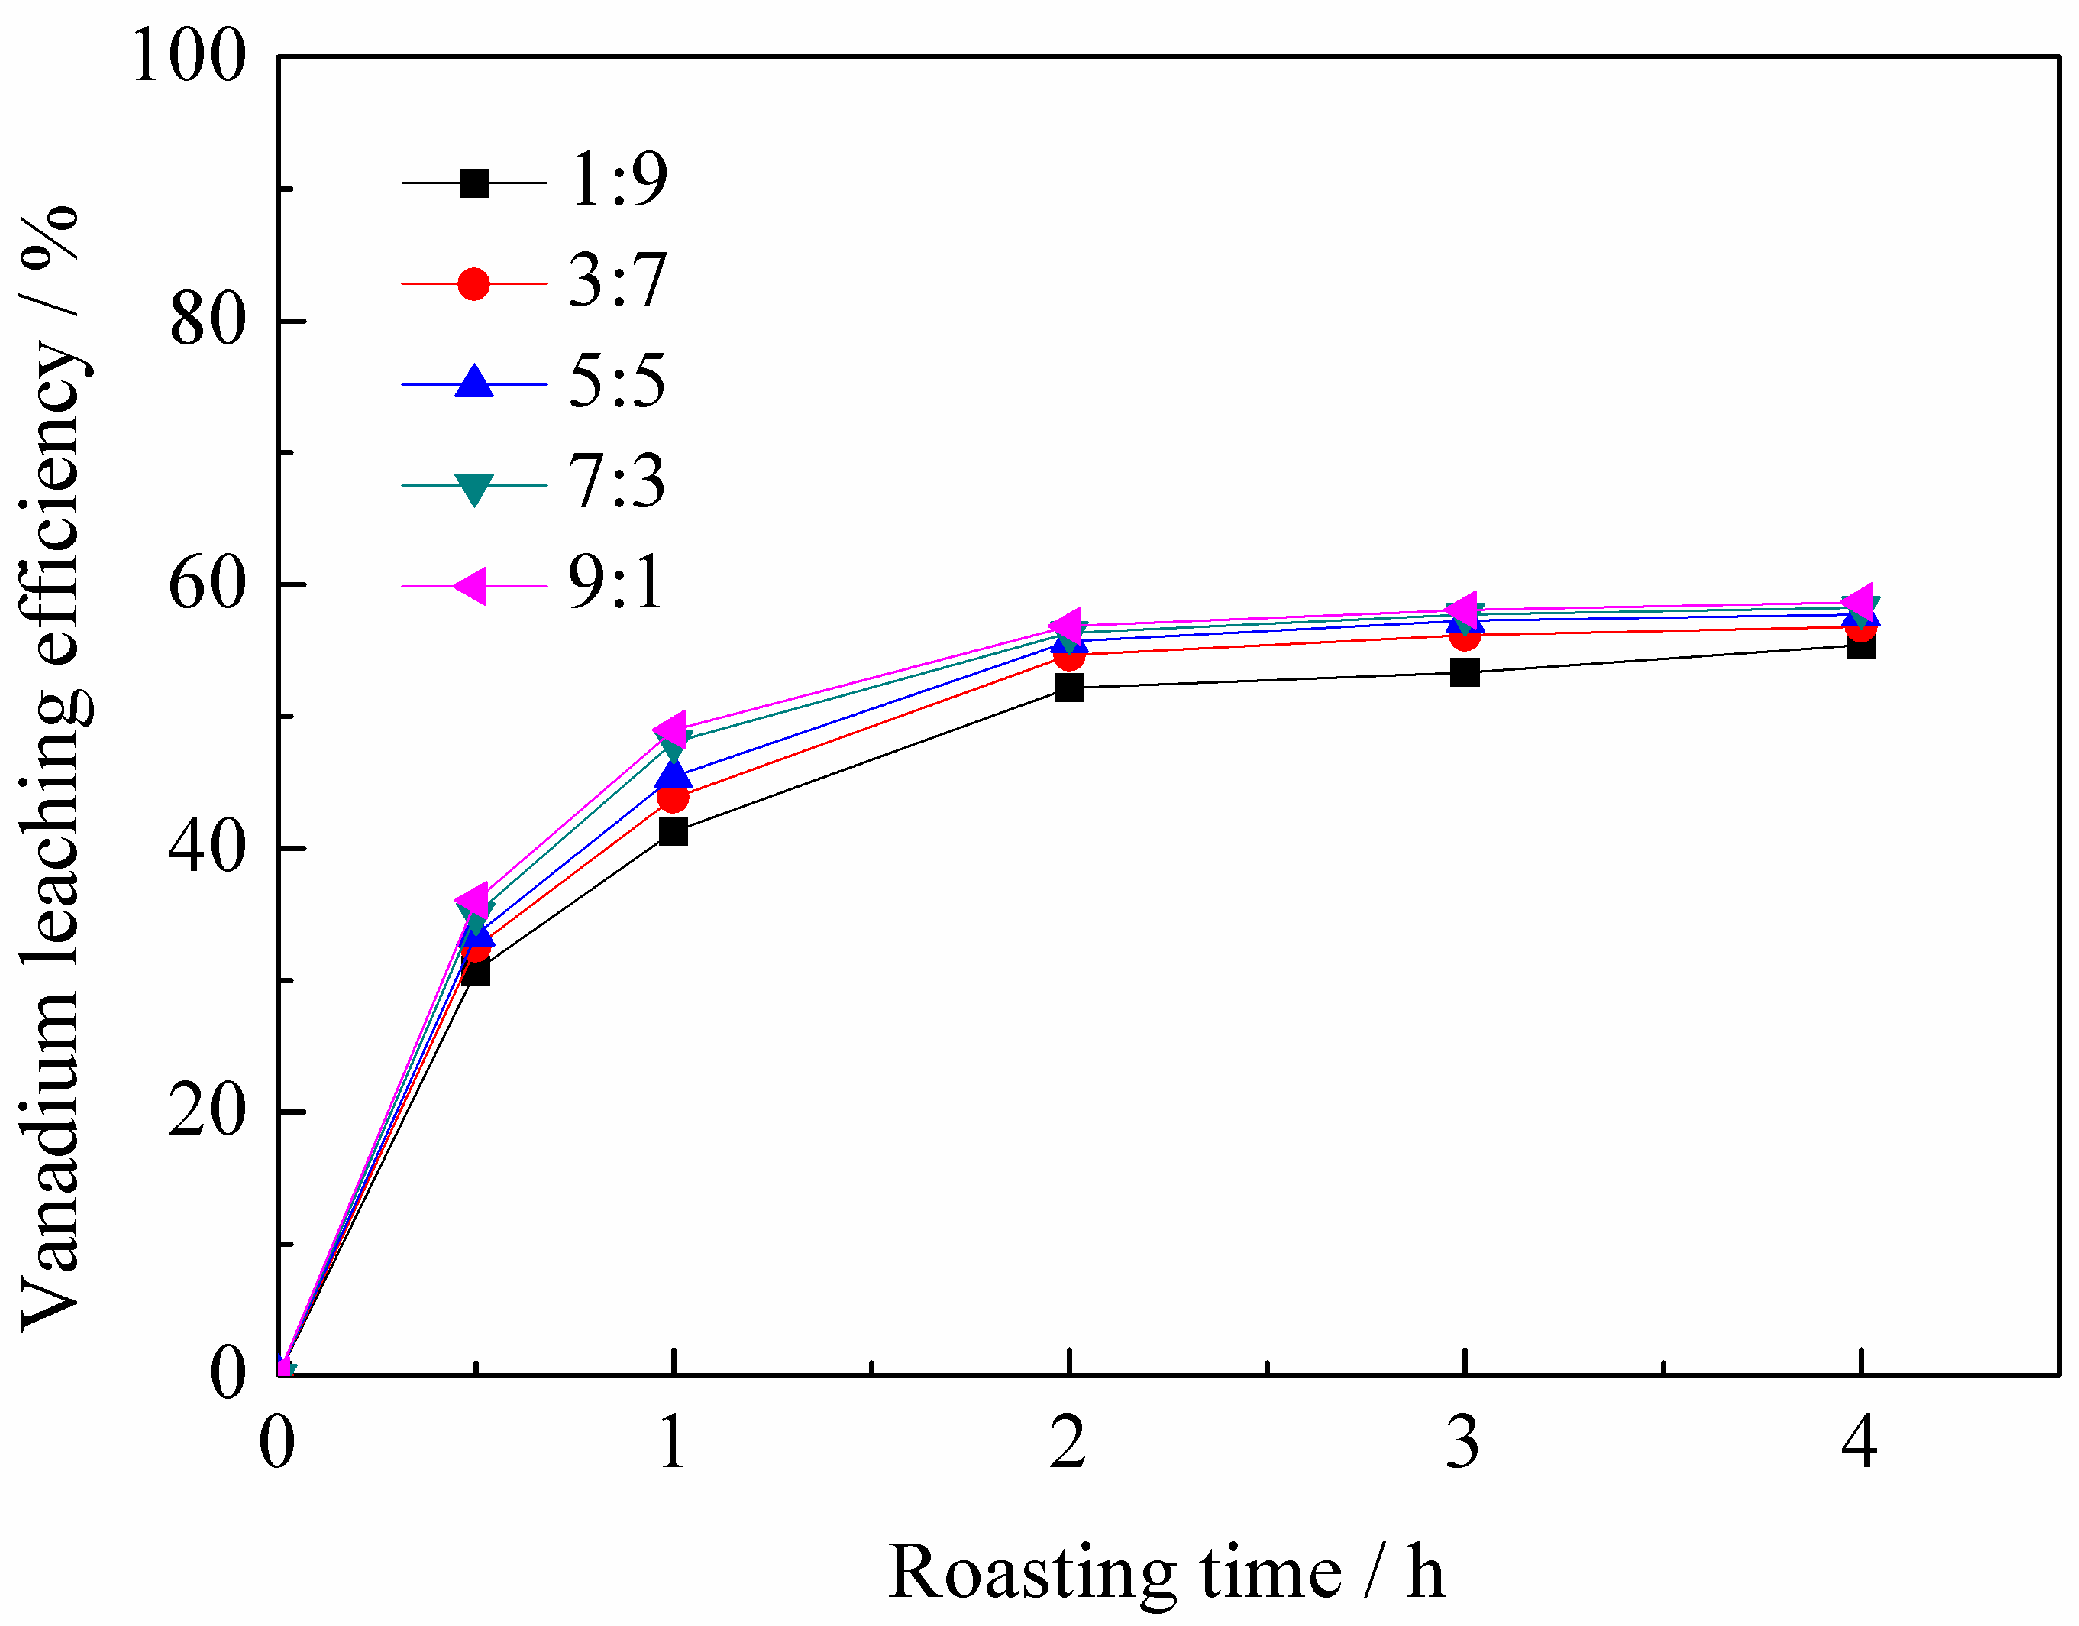
3.1.2. Effect of Mass Ratio of BaCO3 to CaO on Vanadium Leaching Efficiency

The effect of the mass ratio of BaCO3 to CaO from 1:9 to 9:1 on the vanadium leaching efficiency was studied, with the BaCO3/CaO total weight at 5 wt % and the roasting temperature at 850 °C. From Figure 4, it can be observed that when the mass ratio increased from 1:9 to 9:1 for 4 h, it had trival impact on the vanadium leaching efficiency. Meanwhile, the increase of the mass ratio means the greater utilization of BaCO3, which will bring more difficult operations and environmental risks. With the increase of the roasting time from 0.5 to 2 h, the vanadium leaching efficiency increased sharply from 30.71% to 52.16% with the mass ratio of 1:9, but no significant improvement on the vanadium leaching efficiency could be obtained when the roasting time was over 2 h. Therefore, the optimum mass ratio of BaCO3 to CaO should be 1:9, and the optimum roasting time should be 2 h.

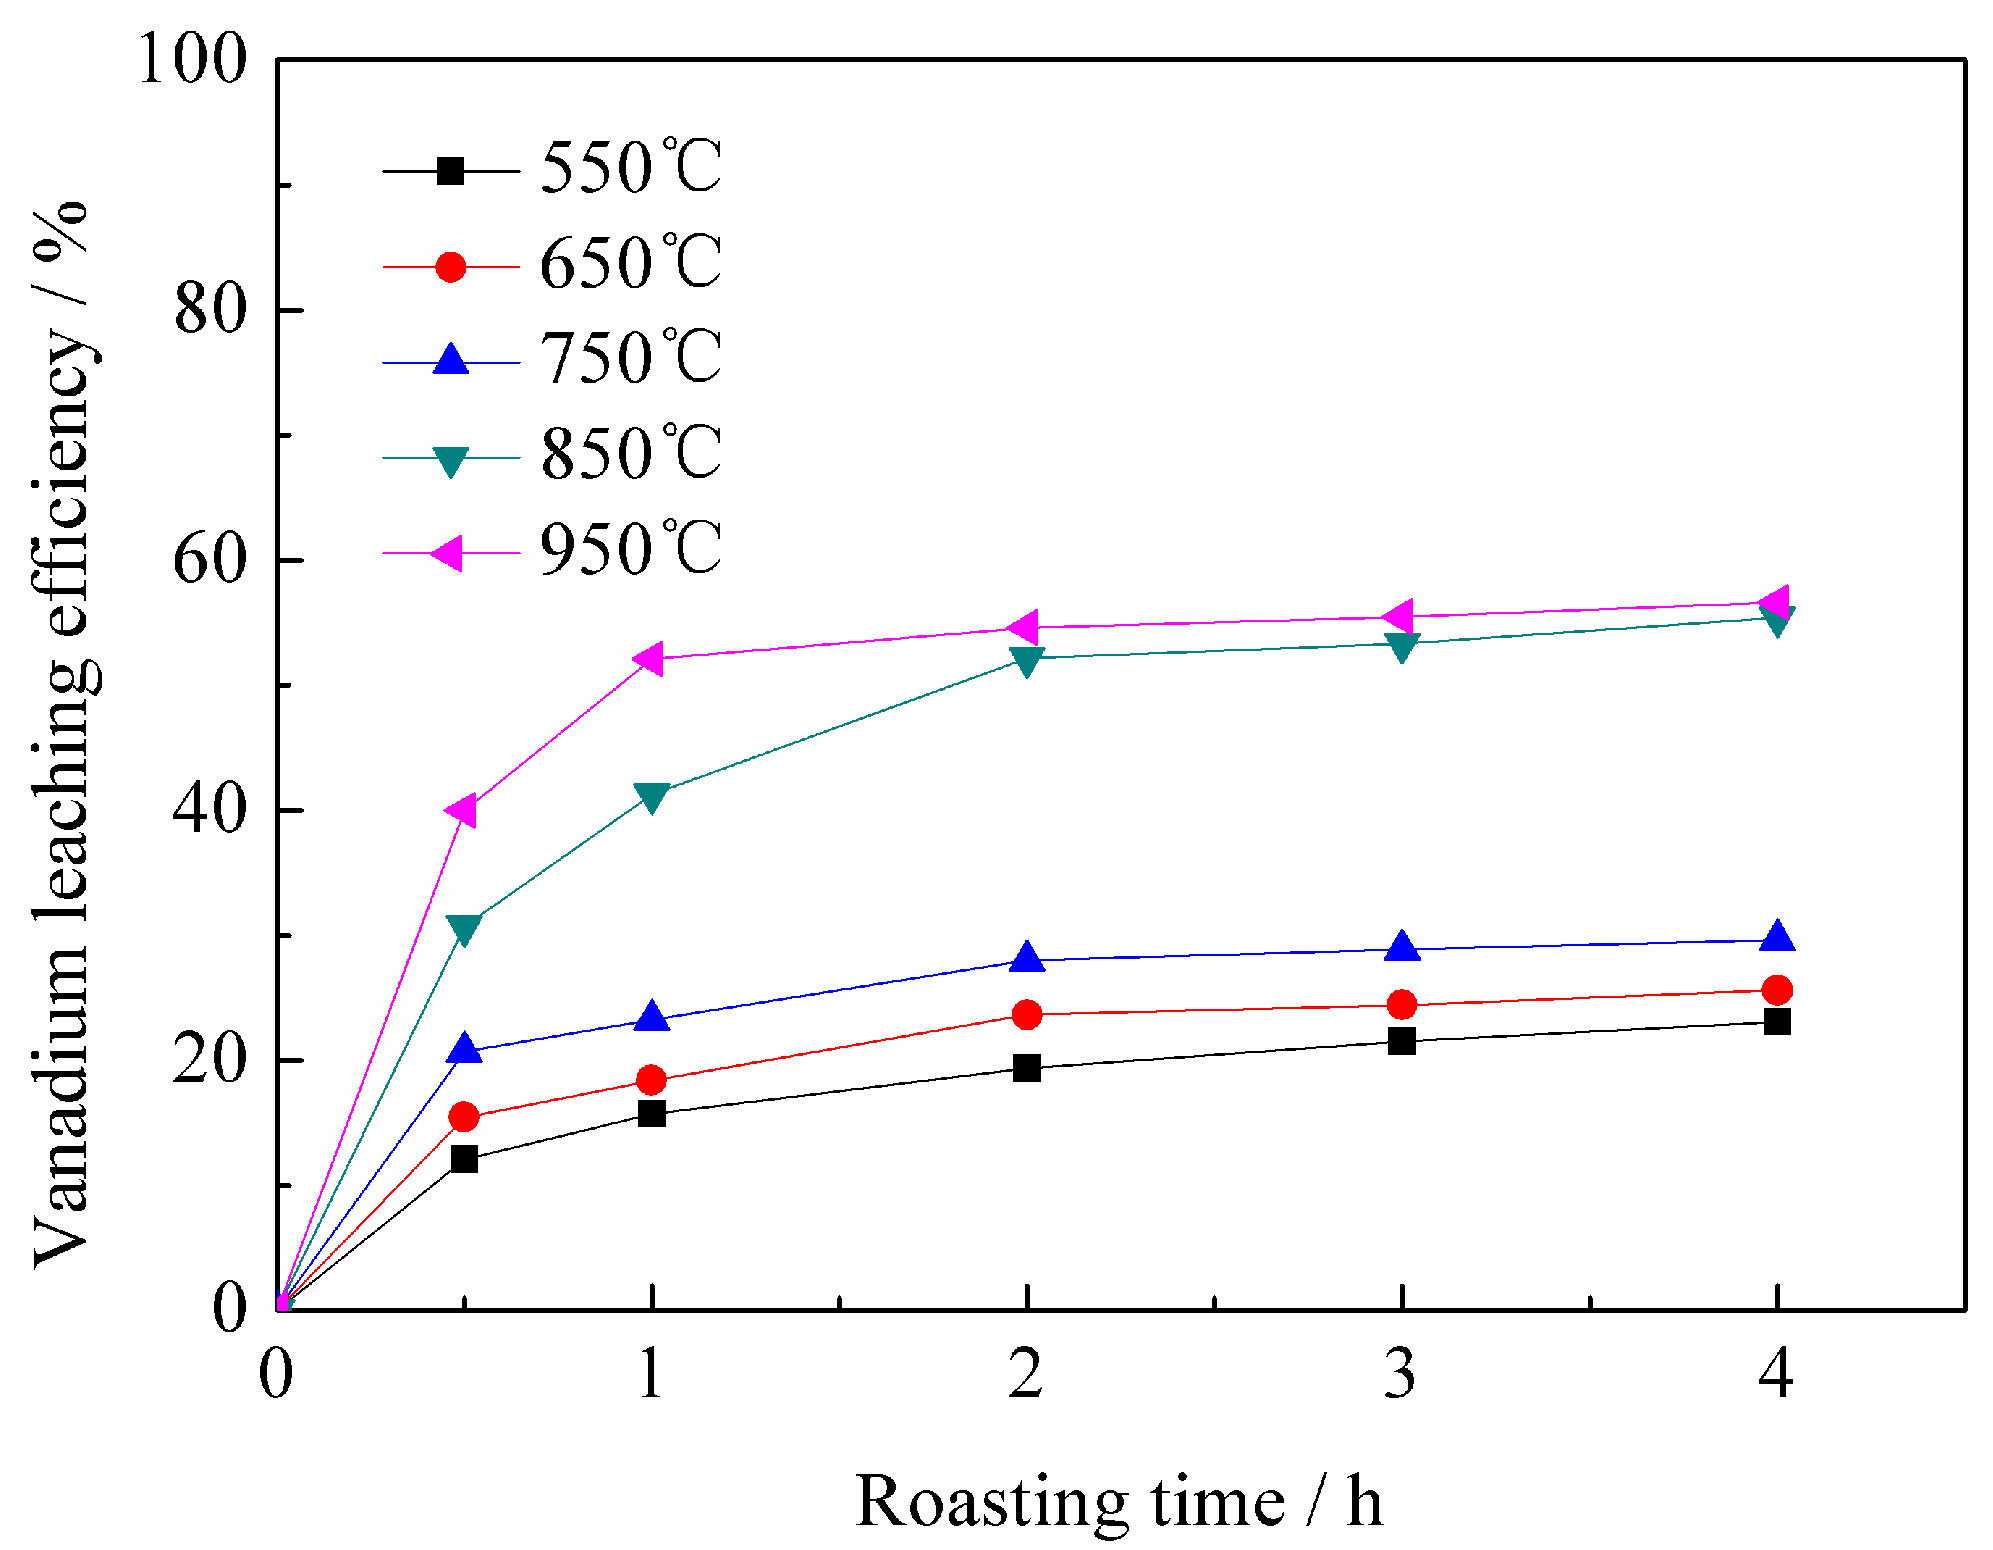
3.1.3. Effect of Roasting Temperature on Vanadium Leaching Efficiency

The effect of the roasting temperature from 550 to 950 °C, with the BaCO3/CaO total weight at 5 wt % and the BaCO3/CaO mass ratio at 1:9, on the vanadium leaching efficiency was investigated (Figure 5). The results indicated that the vanadium leaching efficiency increased remarkably from 19.35% to 52.16% as the roasting temperature increased from 550 to 850 °C for 2 h, but when the roasting temperature exceeded 850 °C for 2 h, only a slight improvement of the vanadium leaching efficiency could be observed. The vanadium leaching efficiency increased with the increase of the roasting time from 0.5 to 2 h at 850 °C. A further increase of the roasting time made little impact on the vanadium leaching efficiency at 850 °C. Hence, the optimum roasting temperature should be 850 °C, and the optimum roasting time should be 2 h.

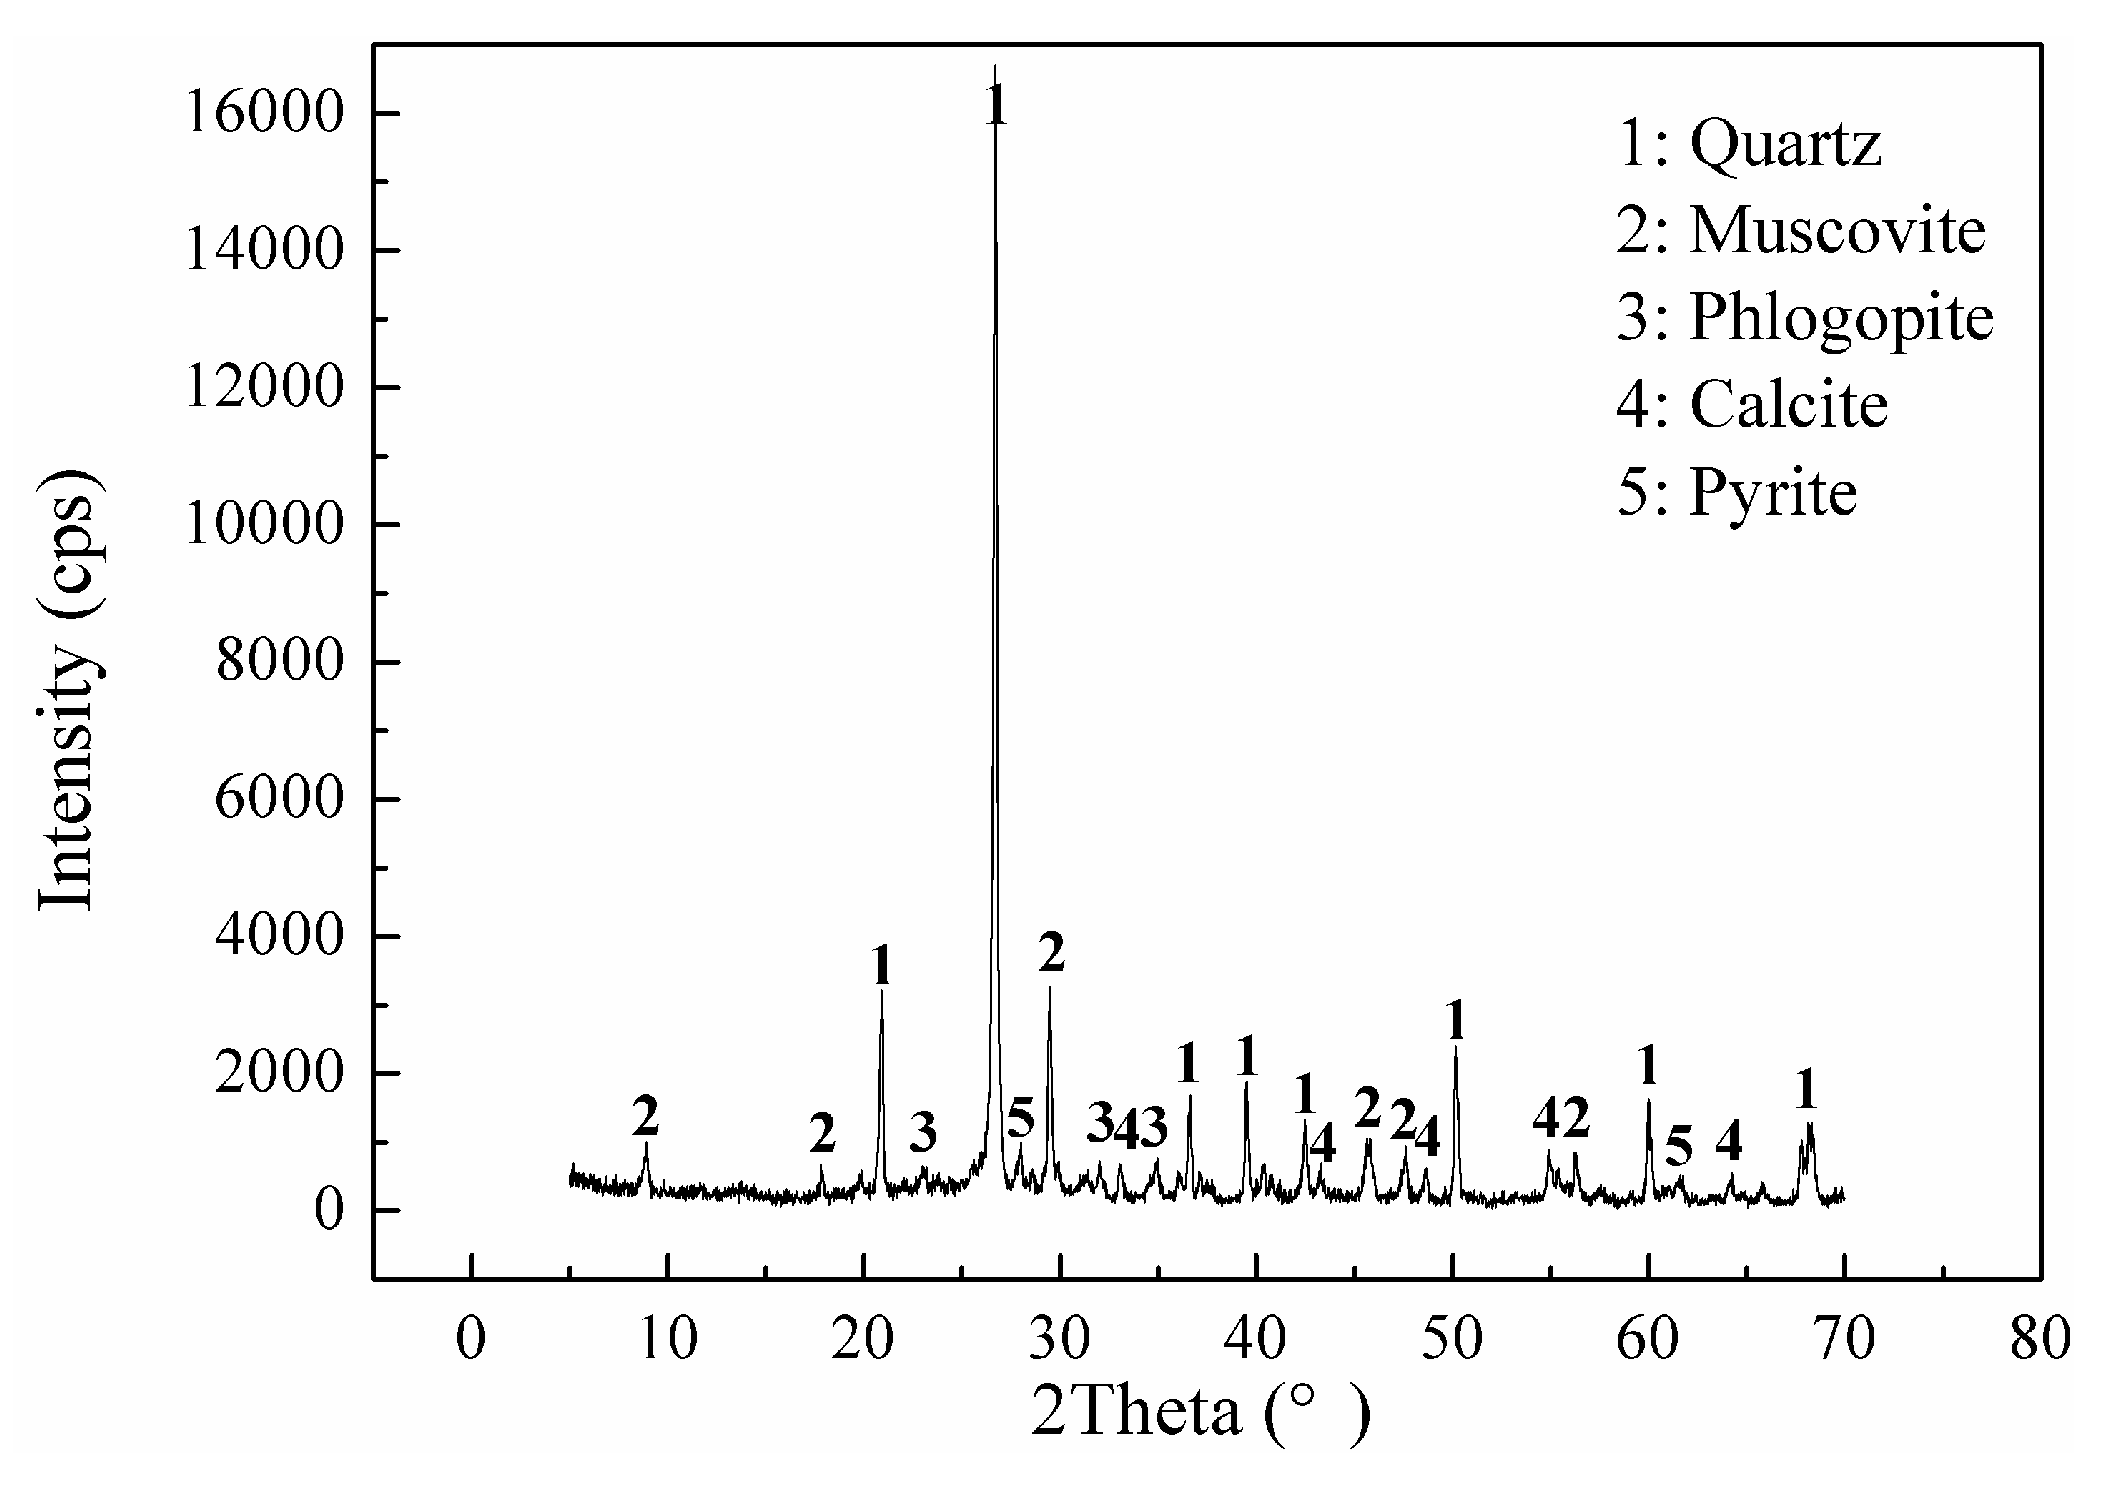
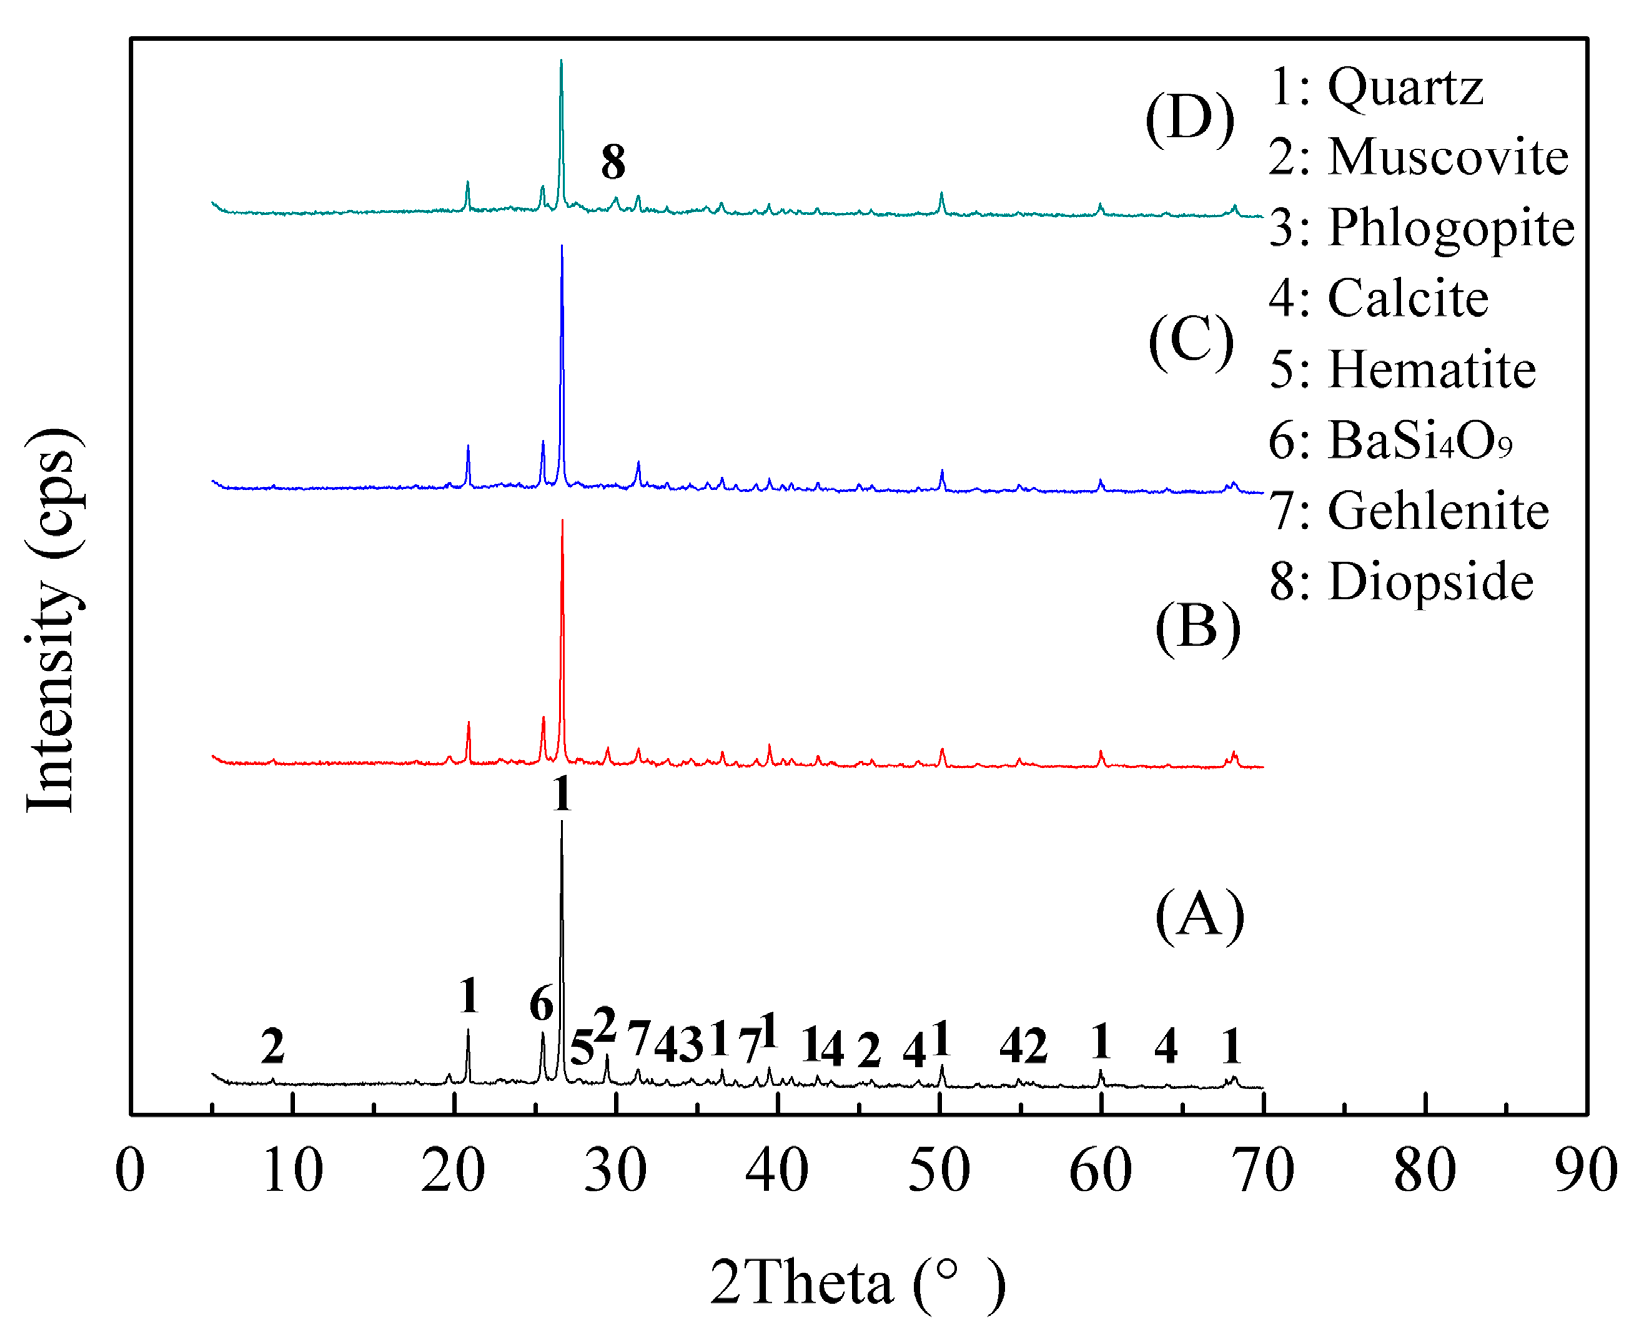
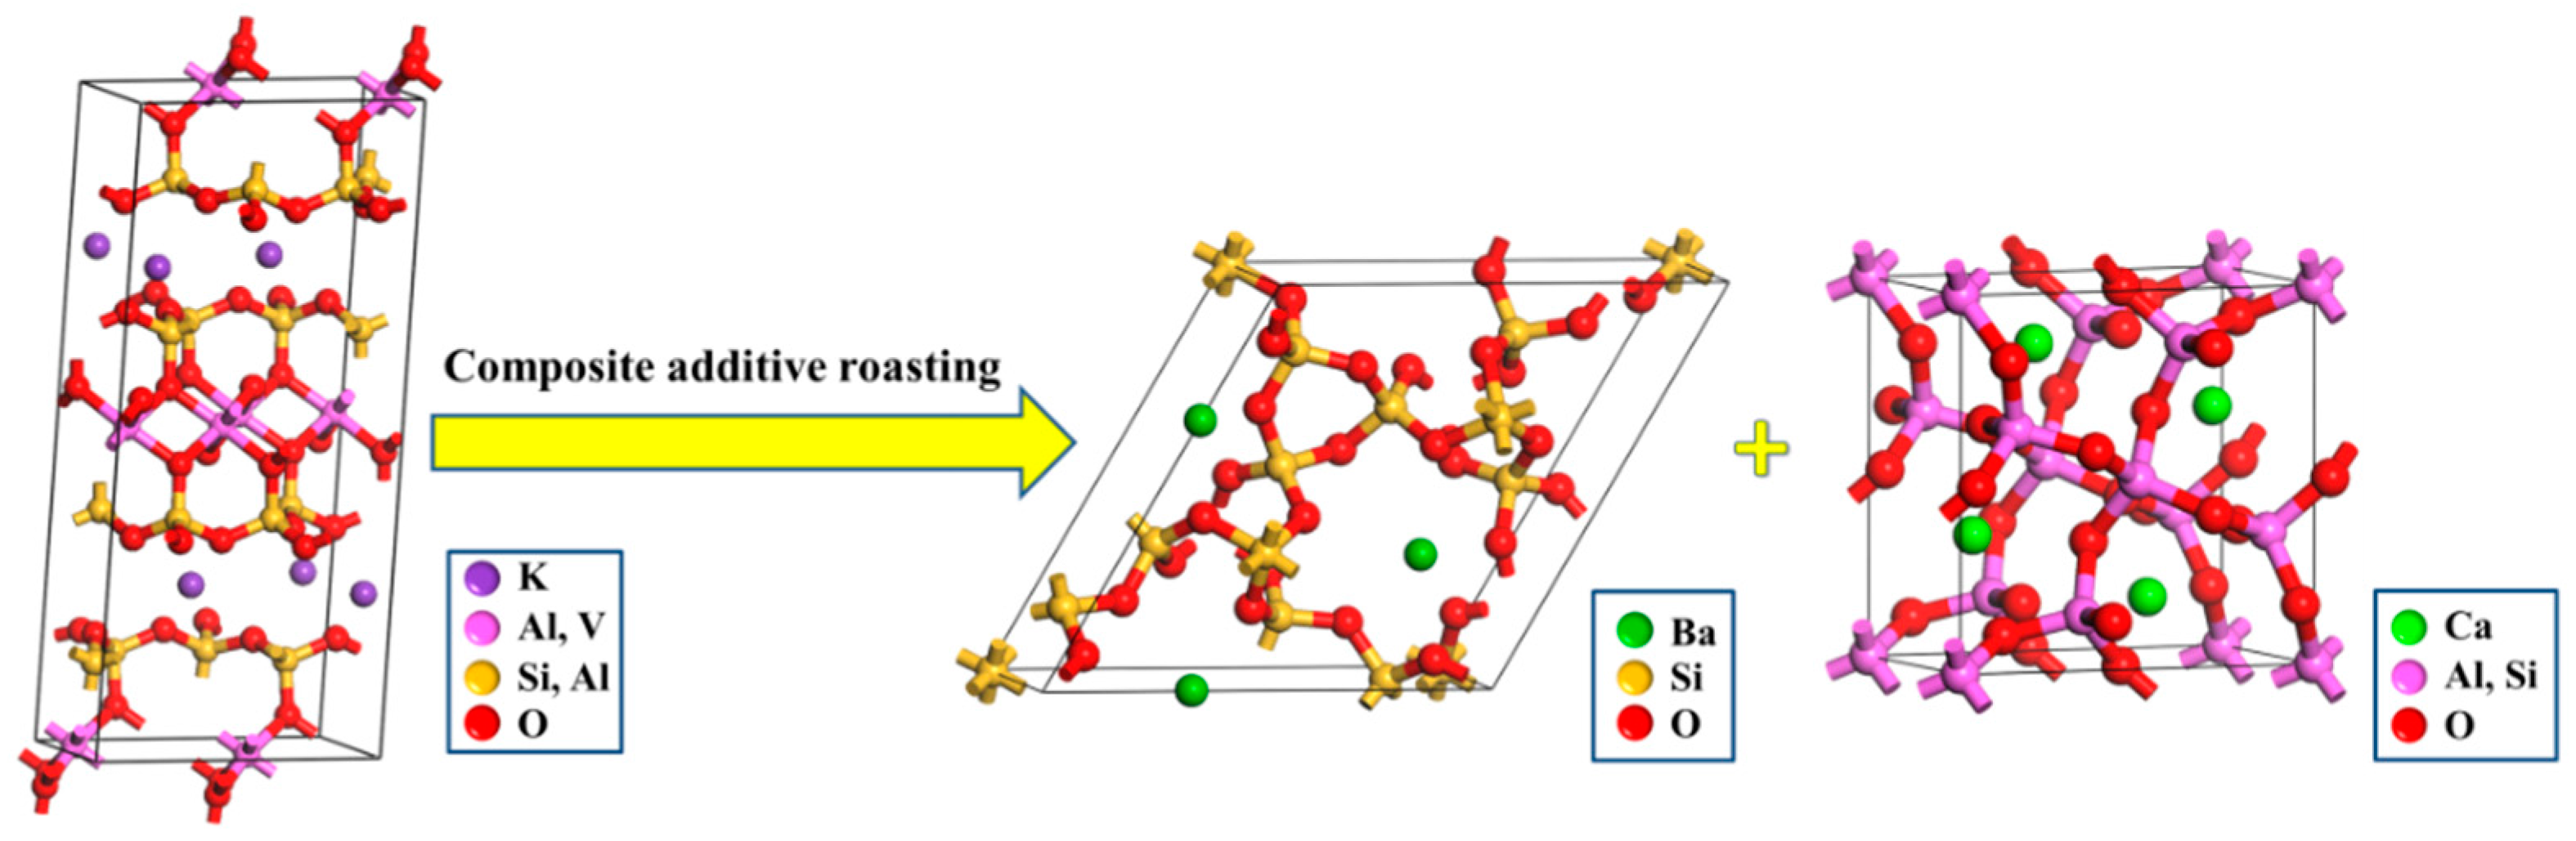
3.1.4. Phase Transformation of Stone Coal during the Roasting Process

To study the behavior of the stone coal during the roasting process with the BaCO3/CaO total weight at 5 wt %, the mass ratio of BaCO3 to CaO at 1:9, and the roasting time of 2 h, the phase transformation of the roasting samples, with the roasting temperature from 650 to 950 °C, were analyzed by XRD. The XRD patterns are shown in Figure 6. The results indicated that the muscovite and phlogopite crystalline phase were weakened, and the new crystalline phase of BaSi4O9 and Gehlenite were presented in the roasting sample with the roasting temperatures of 650 and 750 °C. When the roasting temperature reached 850 °C, the muscovite and phlogopite crystalline phases disappeared, indicating that the structure of muscovite or phlogopite was destroyed. Moreover, the V(III), which was an isomorphism replacement with Al(III) or Mg(III) in alumina octahedral structure of mica in stone coal, could be released from the crystal lattice and oxidized into V(IV) or V(V) for the preparation of the following leaching process. When the roasting temperature reached 950 °C, the new crystalline phase of diopside started to present in the roasting sample.
The crystal transformation relationship of muscovite (K(Al,V)2[Si3AlO10](OH)2), BaSi4O9, and Gehlenite (Ca2Al2SiO7) is shown in Figure 7. The crystalline structure of muscovite (K(Al,V)2[Si3AlO10](OH)2) is a monoclinic crystal system, and the unit cell parameters are: a = 0.5193 nm, b = 0.9045 nm, c = 2.0044 nm, α = γ = 90°, and β = 95.8°. During the BaCO3/CaO composite additive roasting process, Si–O and Al–O bonds were broken. Meanwhile, the hexagonal structure of BaSi4O9 and the tetragonal structure of Gehlenite (Ca2Al2SiO7) were formed. The crystalline structure of BaSi4O9 is with the P3 space group and the unit cell parameters are a = b = 1.1247 nm, c = 0.4485 nm, α = β = 90°, and γ = 120°. The Si–O oxides form a close circle type array and surround Ba2+ ion with hexagonal coordination. The crystalline structure of Gehlenite (Ca2Al2SiO7) is with the P-421m space group and the unit cell parameters are a = b = 0.7693 nm, c = 0.5072 nm, α = β = γ = 90°. The Al3+ ion and the Si4+ ion are located at the same position in the unit cell with different occupancy. The Al–Si–O oxides form a double close-packed type array with the inclusion of Ca2+ through tetragonal coordination.

3.2. Leaching Process

3.2.1. Effect of Sulfuric Acid Concentration on Vanadium Leaching Efficiency

Effect of sulfuric acid concentration from 5% (v/v) to 25% (v/v) on the vanadium leaching efficiency is shown in Figure 8, with fixing the BaCO3/CaO total weight at 5 wt %, the mass ratio of BaCO3 to CaO at 1:9, the roasting temperature at 850 °C, the roasting time at 2 h, the leaching temperature at 80 °C, and the liquid-to-solid ratio at 5 mL/g. When the sulfuric acid concentration increased from 5% (v/v) to 25% (v/v) for 4 h, significant improvement of the vanadium leaching efficiency could be achieved. The possible reasons were that the H+ concentration increased with the increase of the sulfuric acid concentration, which could intensify the reaction with the target minerals and the vanadium dissolution completely. Considering that the disadvantageous resulted from the excessive acid consumption, 15% (v/v) of the sulfuric acid concentration was selected. With the increase of the leaching time from 0.5 to 3 h, the vanadium leaching efficiency sharply increased with the sulfuric acid concentration at 15% (v/v), but no significant increasement on the vanadium leaching efficiency could be obtained with the leaching time at 4 h. Therefore, the optimum leaching time should be 3 h.

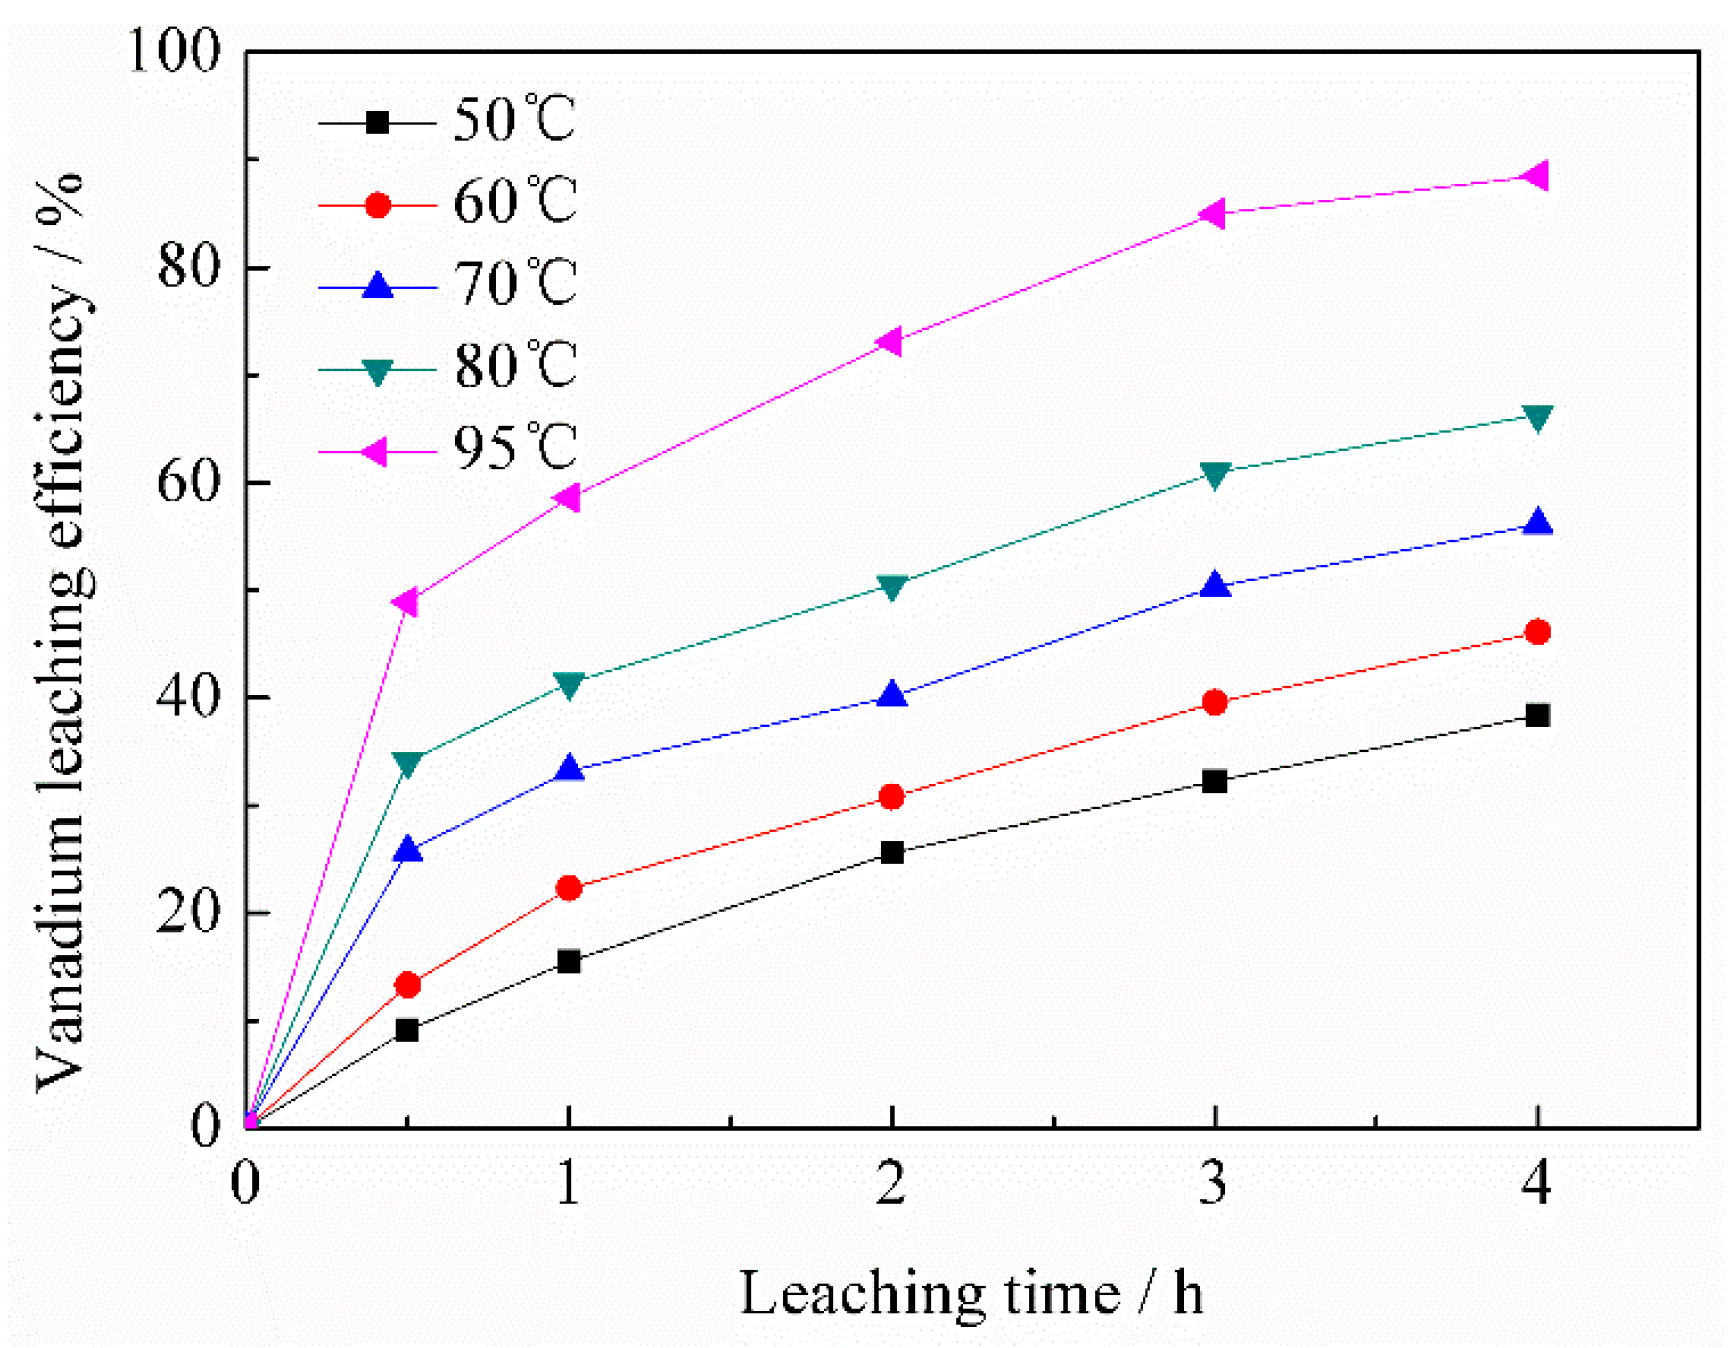
3.2.2. Effect of Leaching Temperature on Vanadium Leaching Efficiency

The effect of leaching temperature from 50 to 95 °C on the vanadium leaching efficiency is shown in Figure 9, with the sulfuric acid concentration at 15% (v/v) and the liquid-to-solid ratio at 5 mL/g. When the leaching temperature increased from 50 to 95 °C for 4 h, the vanadium leaching efficiency improved continuously. The possible reasons could be that the viscosity of the reaction system decreased with the increase of the leaching temperature. Therefore, the H+ diffusion rate increased, which promoted the accessibility and the reaction with the target minerals, and finally improved the vanadium leaching efficiency. 88.50% of the vanadium leaching efficiency could be obtained at 95 °C for 4 h. When the leaching time increased from 0.5 to 3 h at 95 °C, the maximum vanadium leaching of 84.98% could be achieved. Thus, the optimum leaching temperature should be 95 °C, and the leaching time should be 3 h.

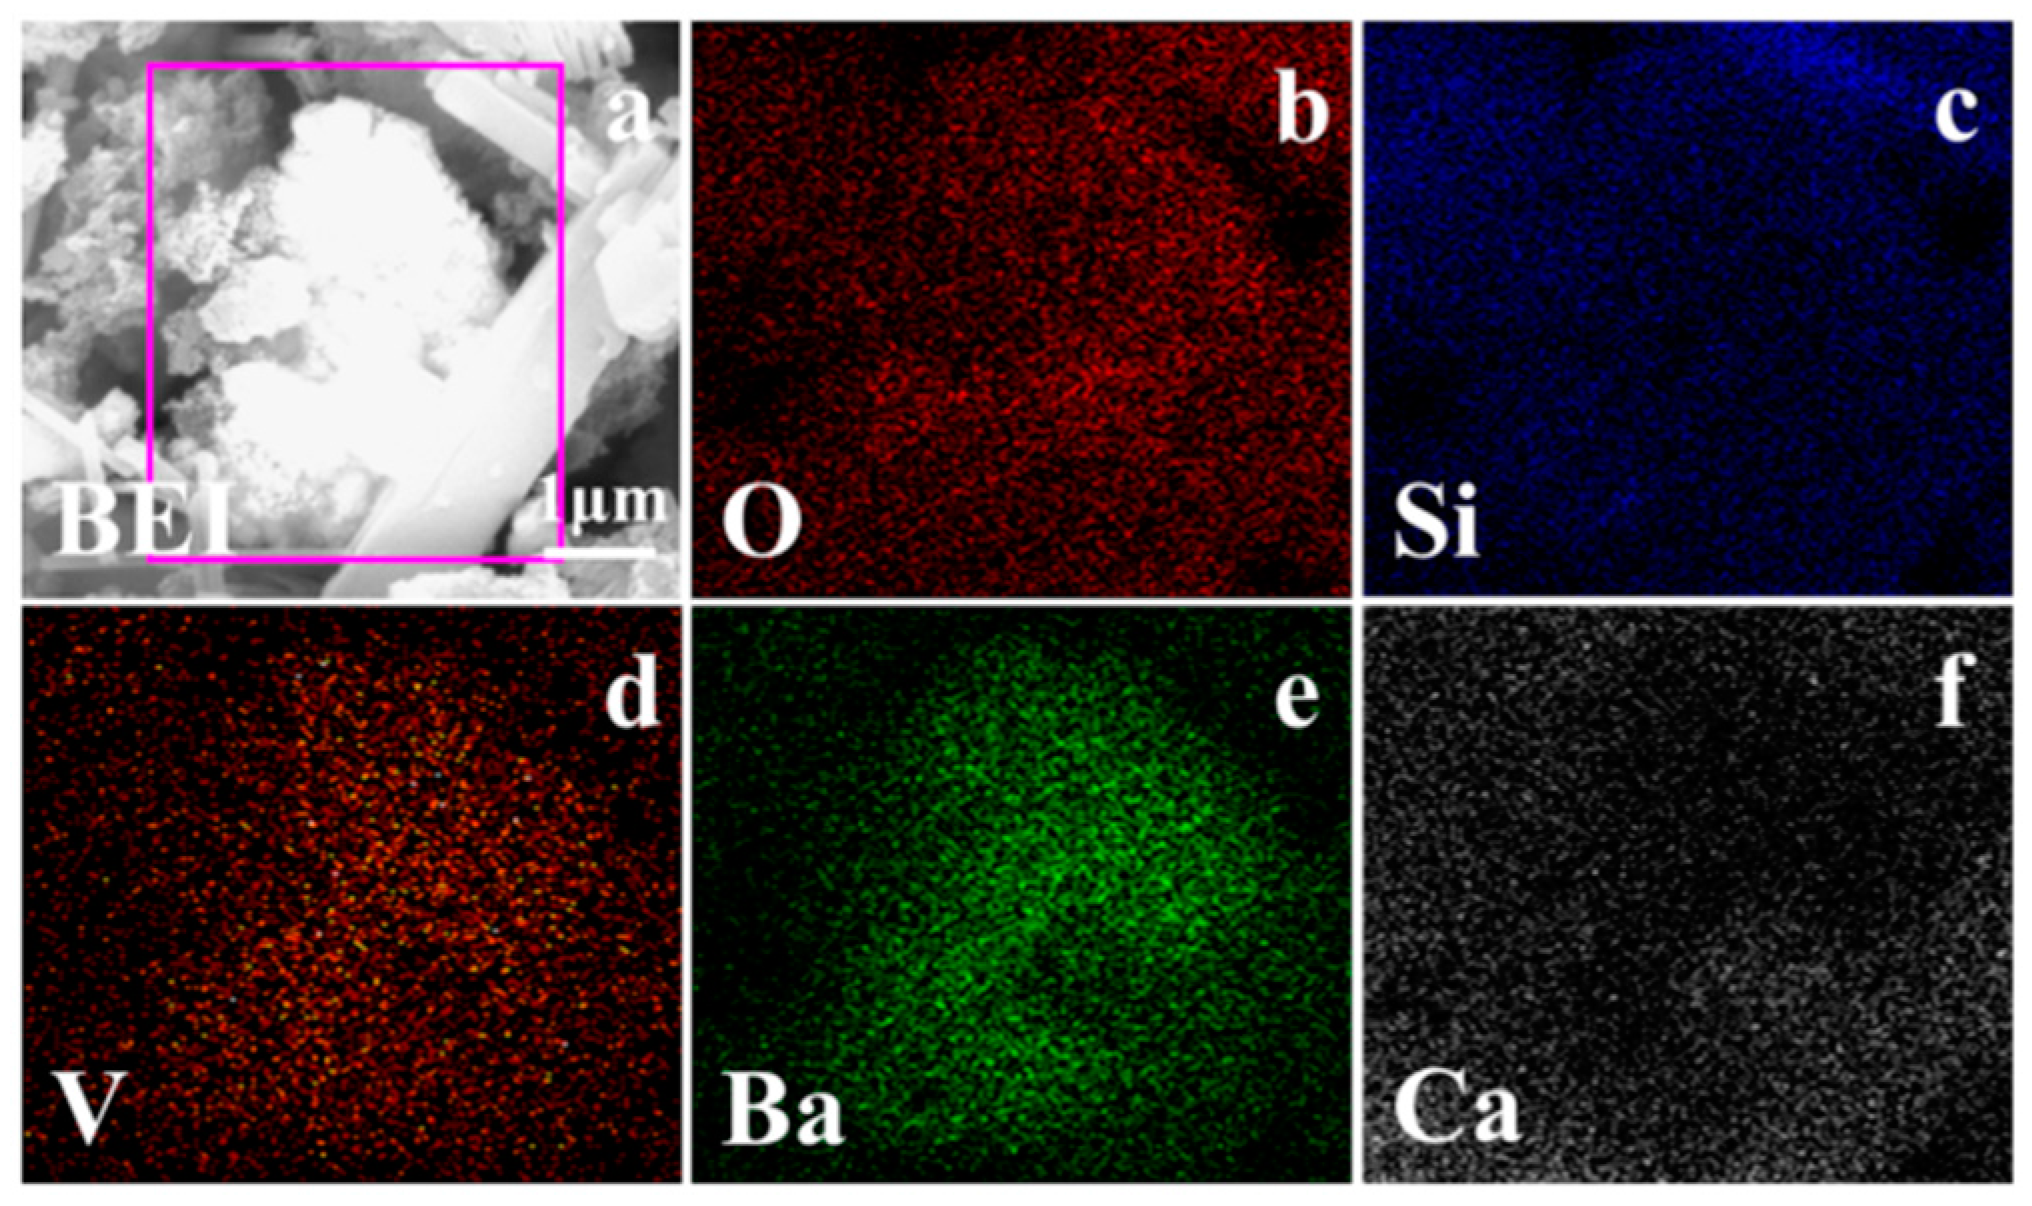
3.2.3. Phase Transformation of Roasting Samples during the Leaching Process

The phase transformation of roasting samples during the leaching process was investigated according to the XRD analysis of the leaching residuals from 60 to 95 °C, while fixing the sulfuric acid concentration at 15% (v/v) and the leaching time at 3 h. The XRD patterns are shown in Figure 10. The results indicated that the calcite and hematite crystalline phases in the roasting samples disappeared, while the diffraction peaks of the crystalline phases of quartz, BaSi4O9, and Gehlenite, which were left in the leaching residue, were intensified with the increase of the leaching temperature from 60 to 95 °C. The reasons were probably that the calcite and hematite reacted with sulfuric acid and dissolved into the solution during the leaching process, whereas the quartz, BaSi4O9, and Gehlenite were inactive.
The BEI and EDS elemental distribution of leaching residual is shown in Figure 11. The results indicated that the element distribution of O, Si, Ba, and Ca had obvious relevance. Combined with the XRD analysis of the leaching residual, the BaSi4O9 and Gehlenite indeed existed after the BaCO3/CaO composite additive roasting and leaching process. Meanwhile, the relevance of V, O, Ba, and Ca in the leaching residue indicated that the vanadium in the leaching residue was probably in the form of vanadate or pyrovanadate of barium and calcium, which were hardly extracted during the sulfuric acid leaching process.

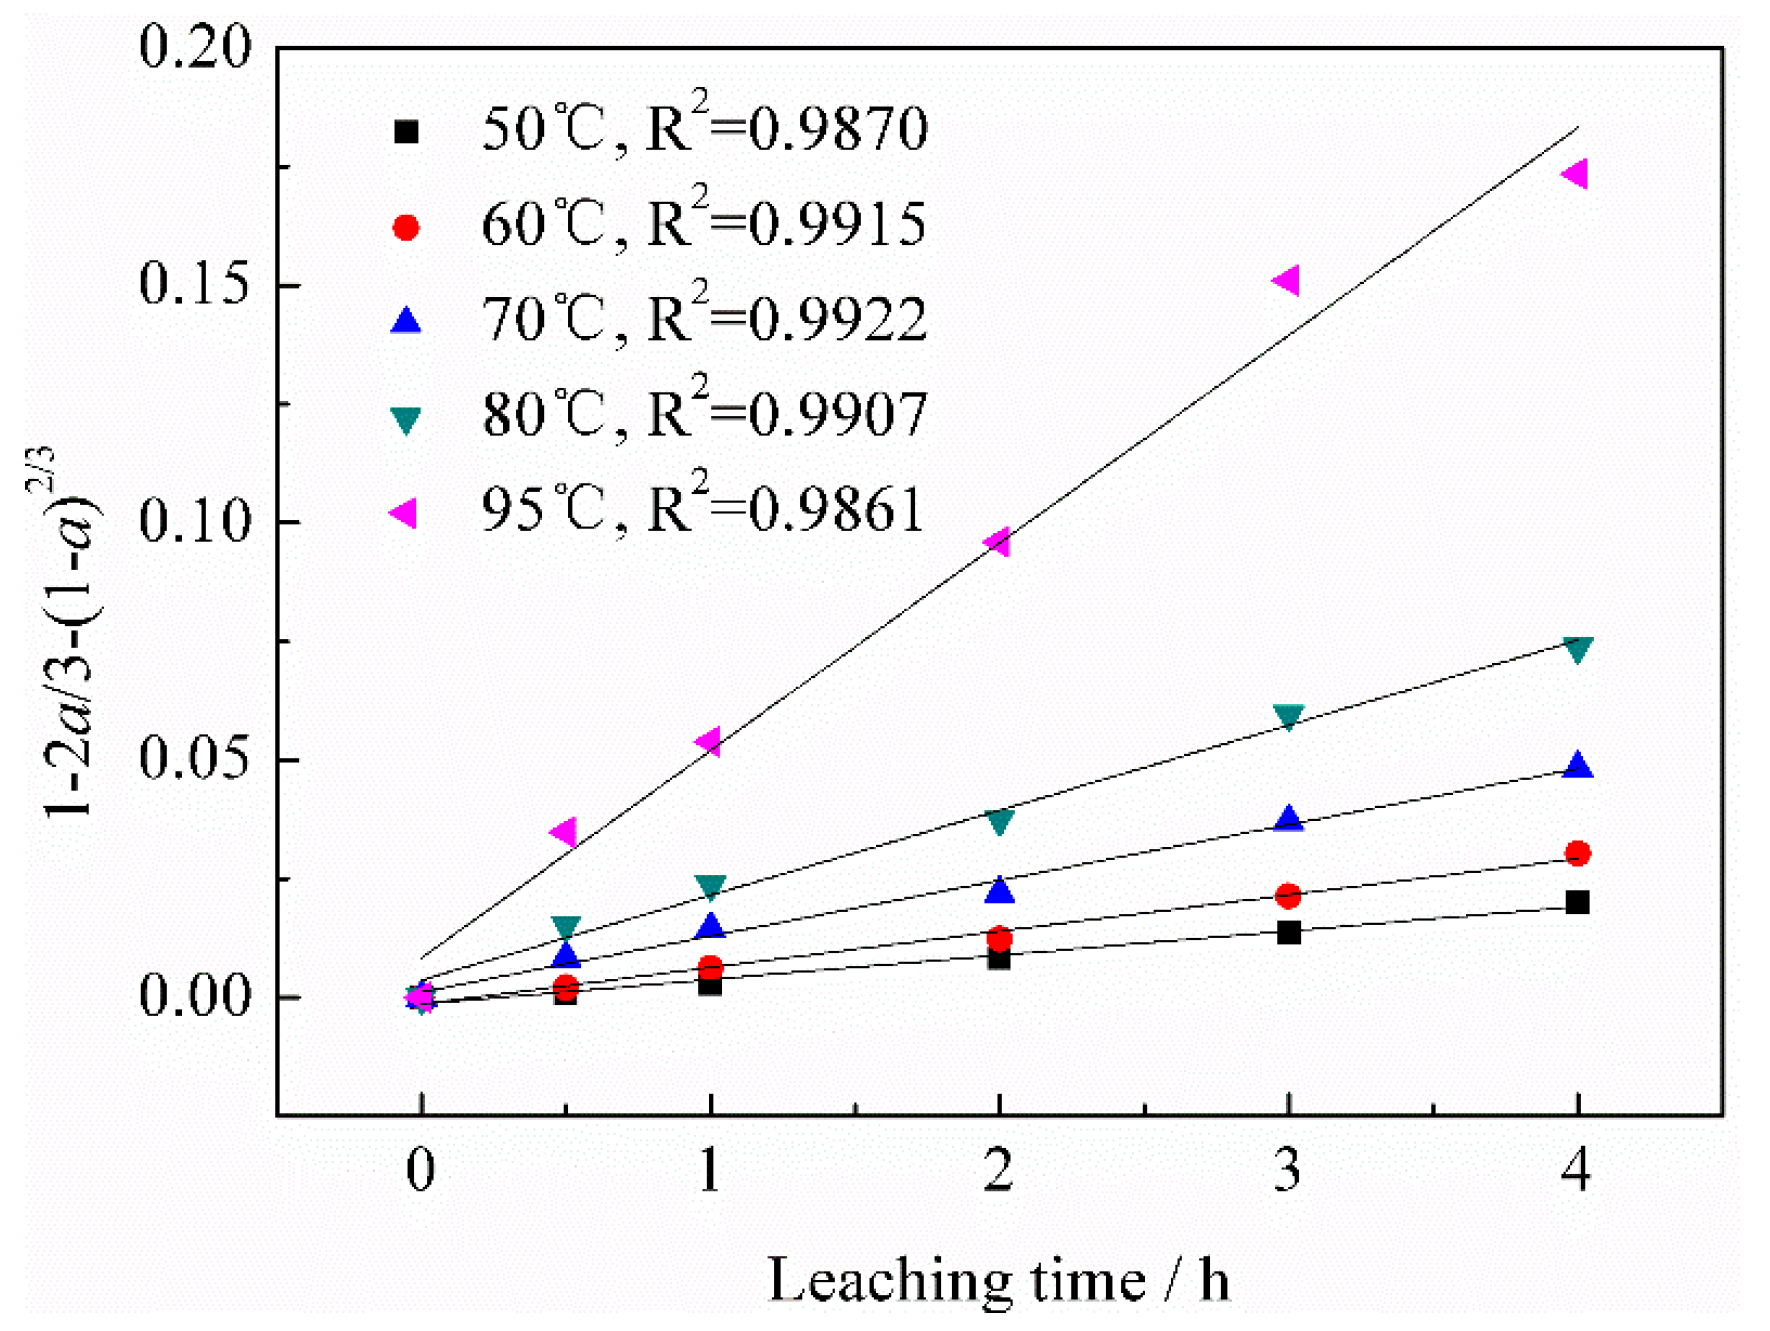
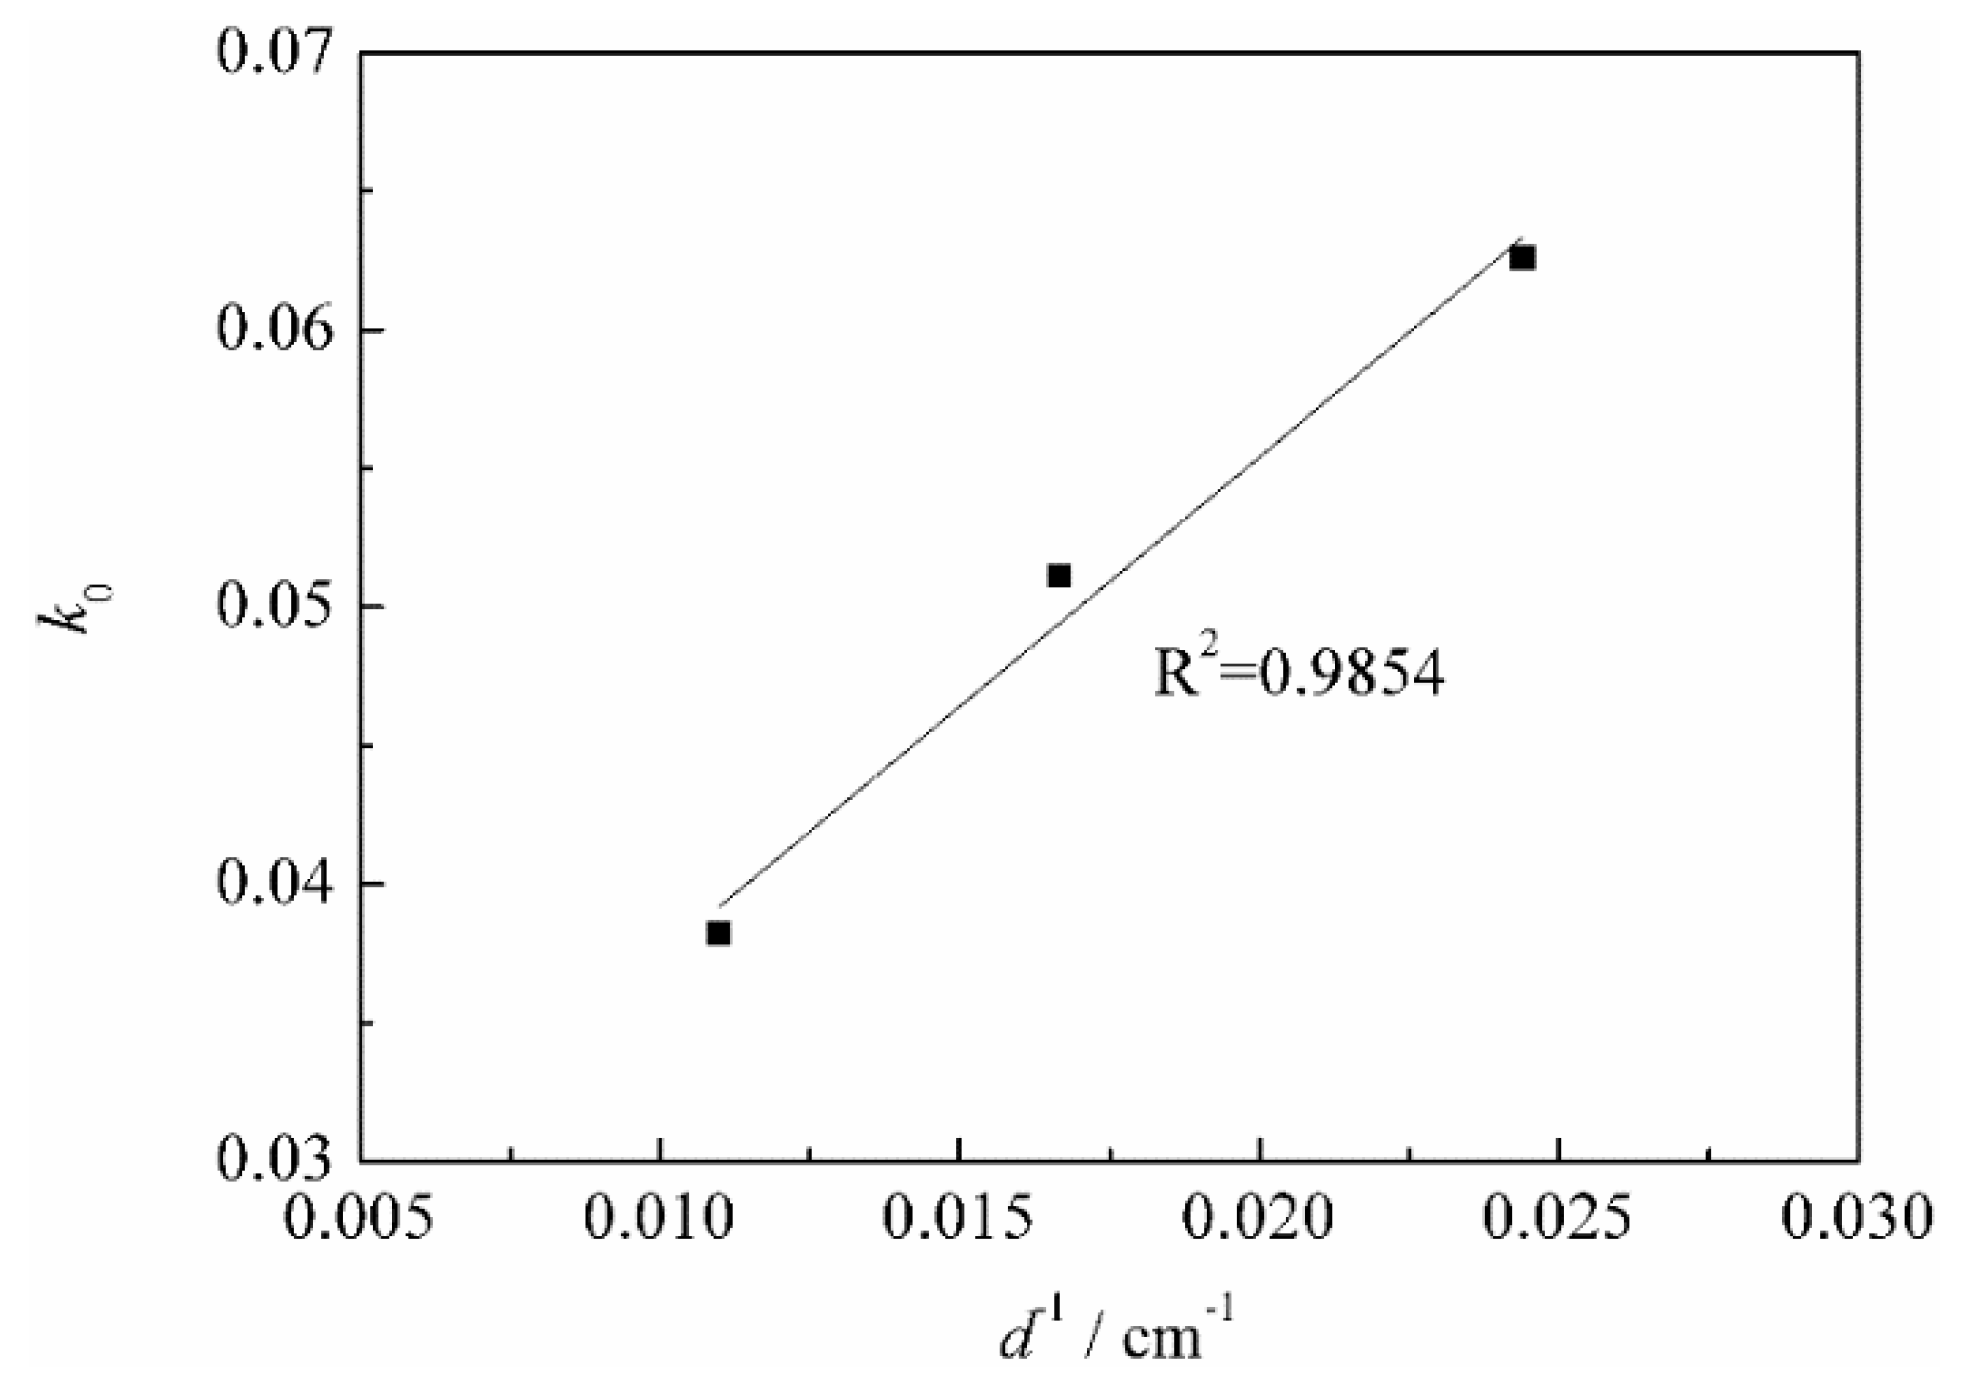
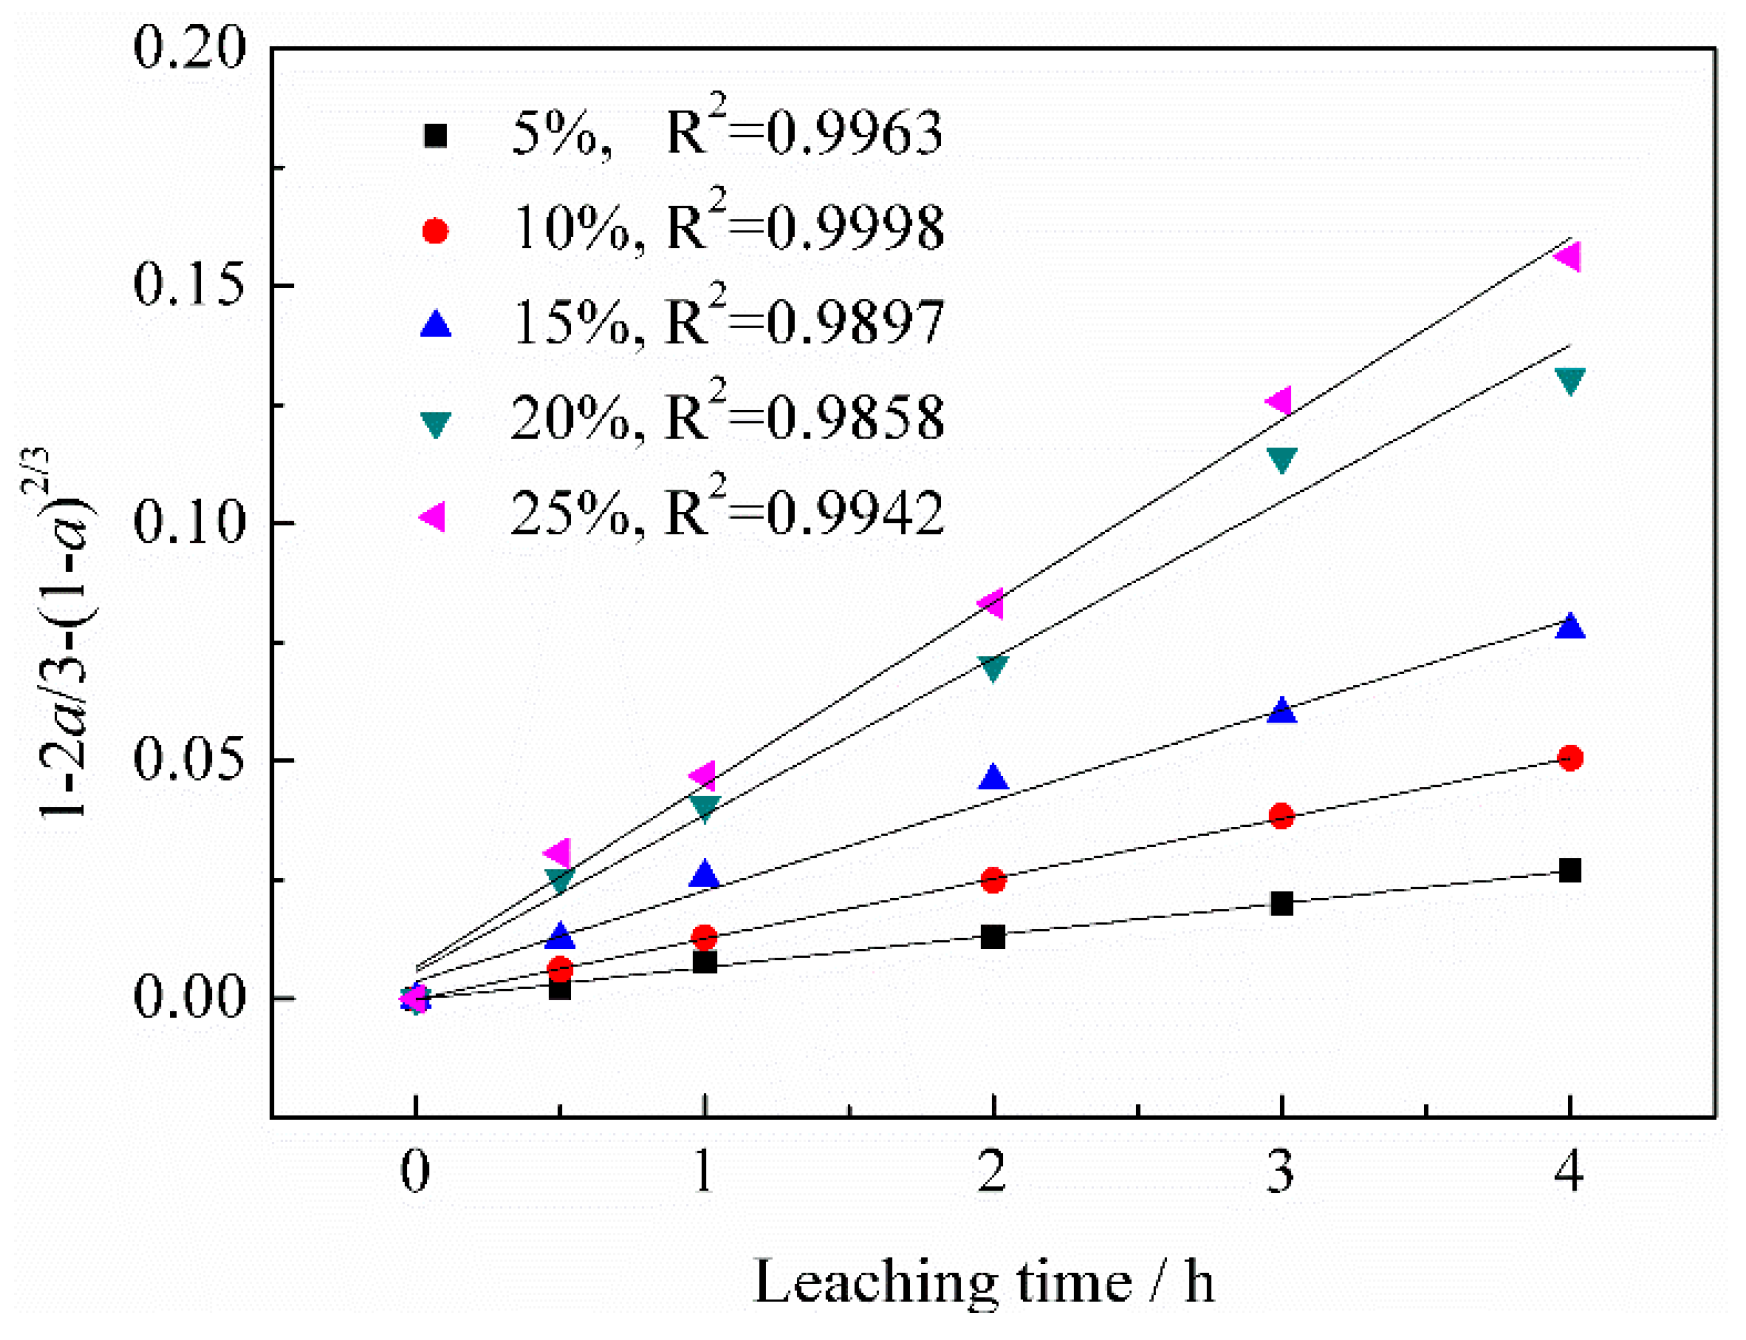
3.3. Kinetic Analysis

Assuming that the particles are spherical, the reaction is irreversible and the loose ash layers could form after the reaction. The experimental data could be analyzed using the shrinking core model (SCM) [17]. The shrinking core model considers that the rate-controlling step of the leaching process is either the diffusion of the reactant through the solution boundary, or through a solid product layer, or the surface chemical reaction [18].
As the shrinking core model (SCM) is valid only for mono-sized particles, the practical way of doing the kinetic analysis is by limiting the particle size to a narrow size. Therefore, we divided the roasting sample into three particle size fractions: 0.038–0.044, 0.044–0.075, and 0.075–0.106 mm. The effect of particle size on the vanadium leaching efficiency is shown in Figure 12. It could be seen that the vanadium leaching efficiency increased with the decrease of the particle size. A shrinking core model (SCM) was utilized to analyze the experimental data (Figure 13). The linear relation between the reaction rate k0 and the inverse initial particle diameter d−1 confirmed that the reaction rate controlling step was probably the diffusion through a solid product layer (Figure 14).
In order to determine if the mass transfer was the possible rate-controlling step, the effect of stirring speed at 600, 800, and 1000 rpm on the vanadium leaching efficiency was studied. It was found that the stirring speed had a slight effect on the vanadium leaching efficiency. Therefore, the following kinetic investigations focused on the diffusion through a solid product and the surface chemical reaction.
As for the vanadium leaching process, if the process is controlled by the chemical reaction, the following expression of shrinking core model could be used to describe the vanadium dissolution kinetics of the process [18,19]:
1 ( 1 α ) 1 / 3 = k 1 t
Similarly, when the diffusion of the reagent (sulfuric acid) through a product layer is the controlling step, the following expression of the shrinking core model could be used [18,19]:
1 2 3 α ( 1 α ) 2 / 3 = k 2 t
where α is the vanadium leaching efficiency (wt %); k1 and k2 are the rate constants of the chemical reaction and the diffusion through a product layer, respectively; and t is the leaching time (h).
Based on the experimental results provided in Figure 9, a fitting plot of 1 − (1 − α)1/3 vs. t is given in Figure 15. It can be seen that the linear correlation was relatively low, indicating that the vanadium leaching reaction was probably not controlled by the chemical reaction.
A fitting plot of 1 − 2α/3 − (1 − α)2/3 vs. t is shown in Figure 16. It can be observed that the linear correlation was great during the whole leaching time, indicating that the leaching process was controlled by the diffusion through a product layer.

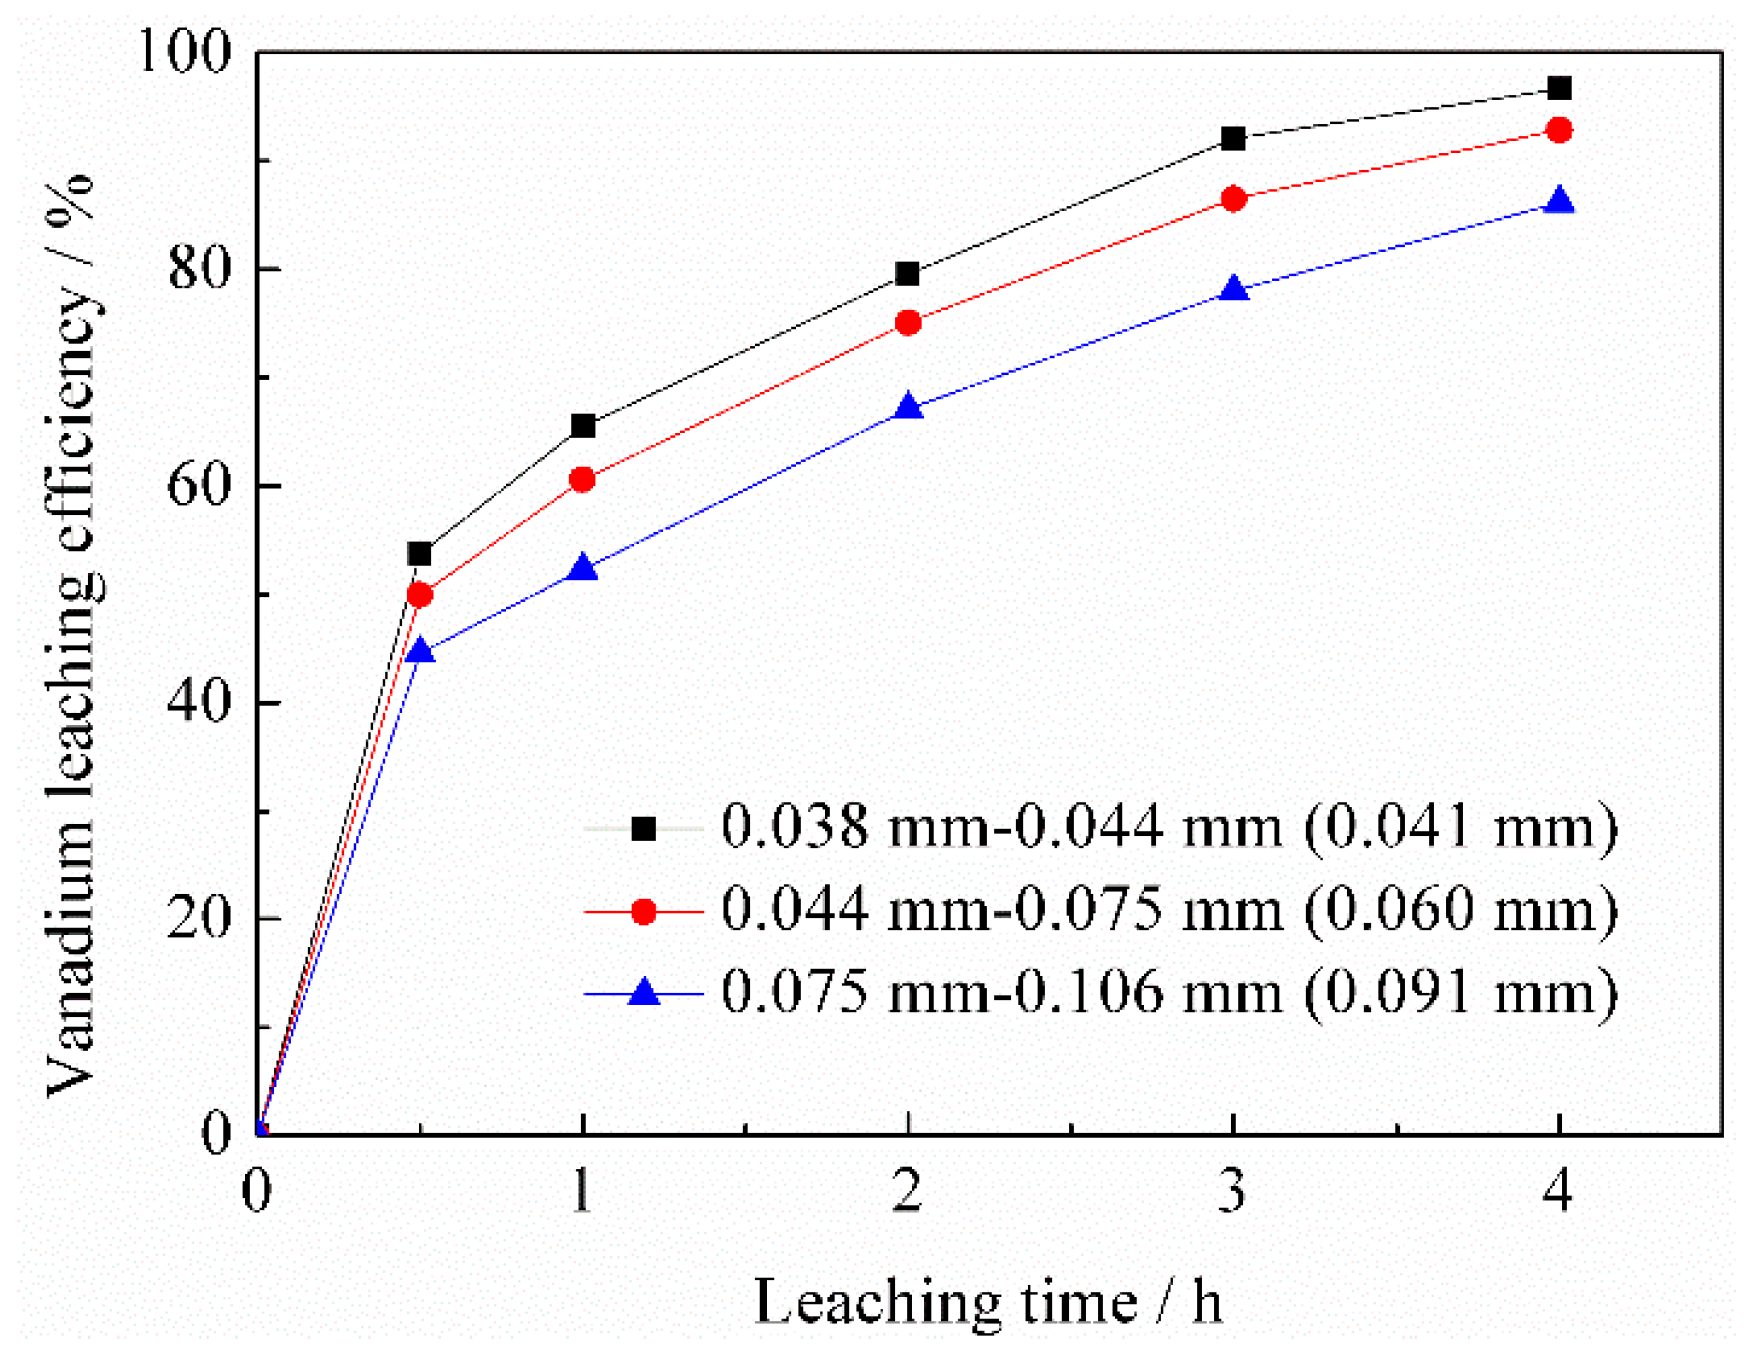
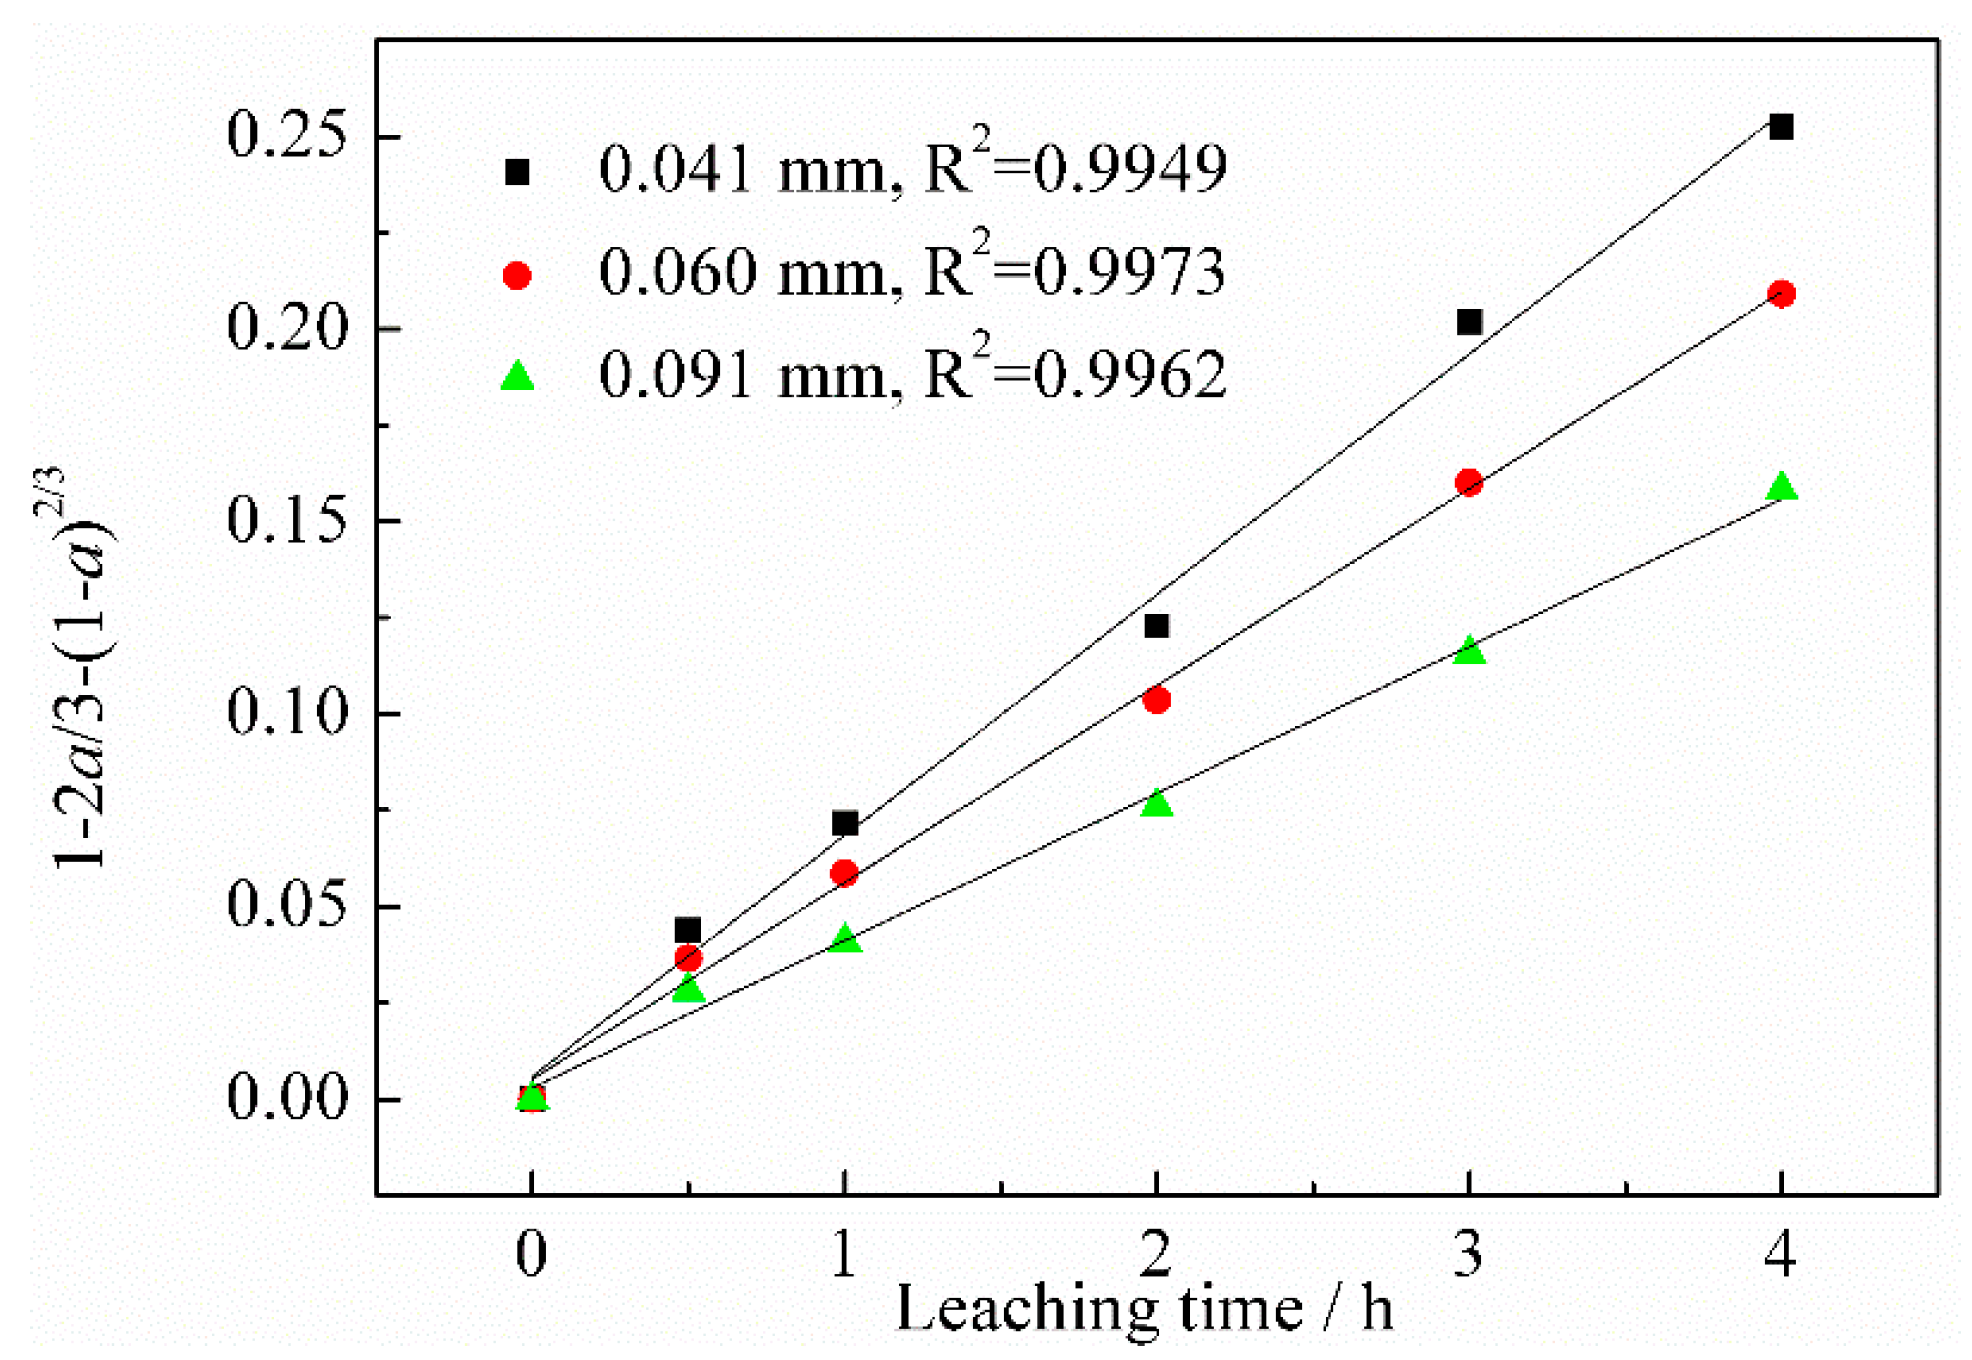
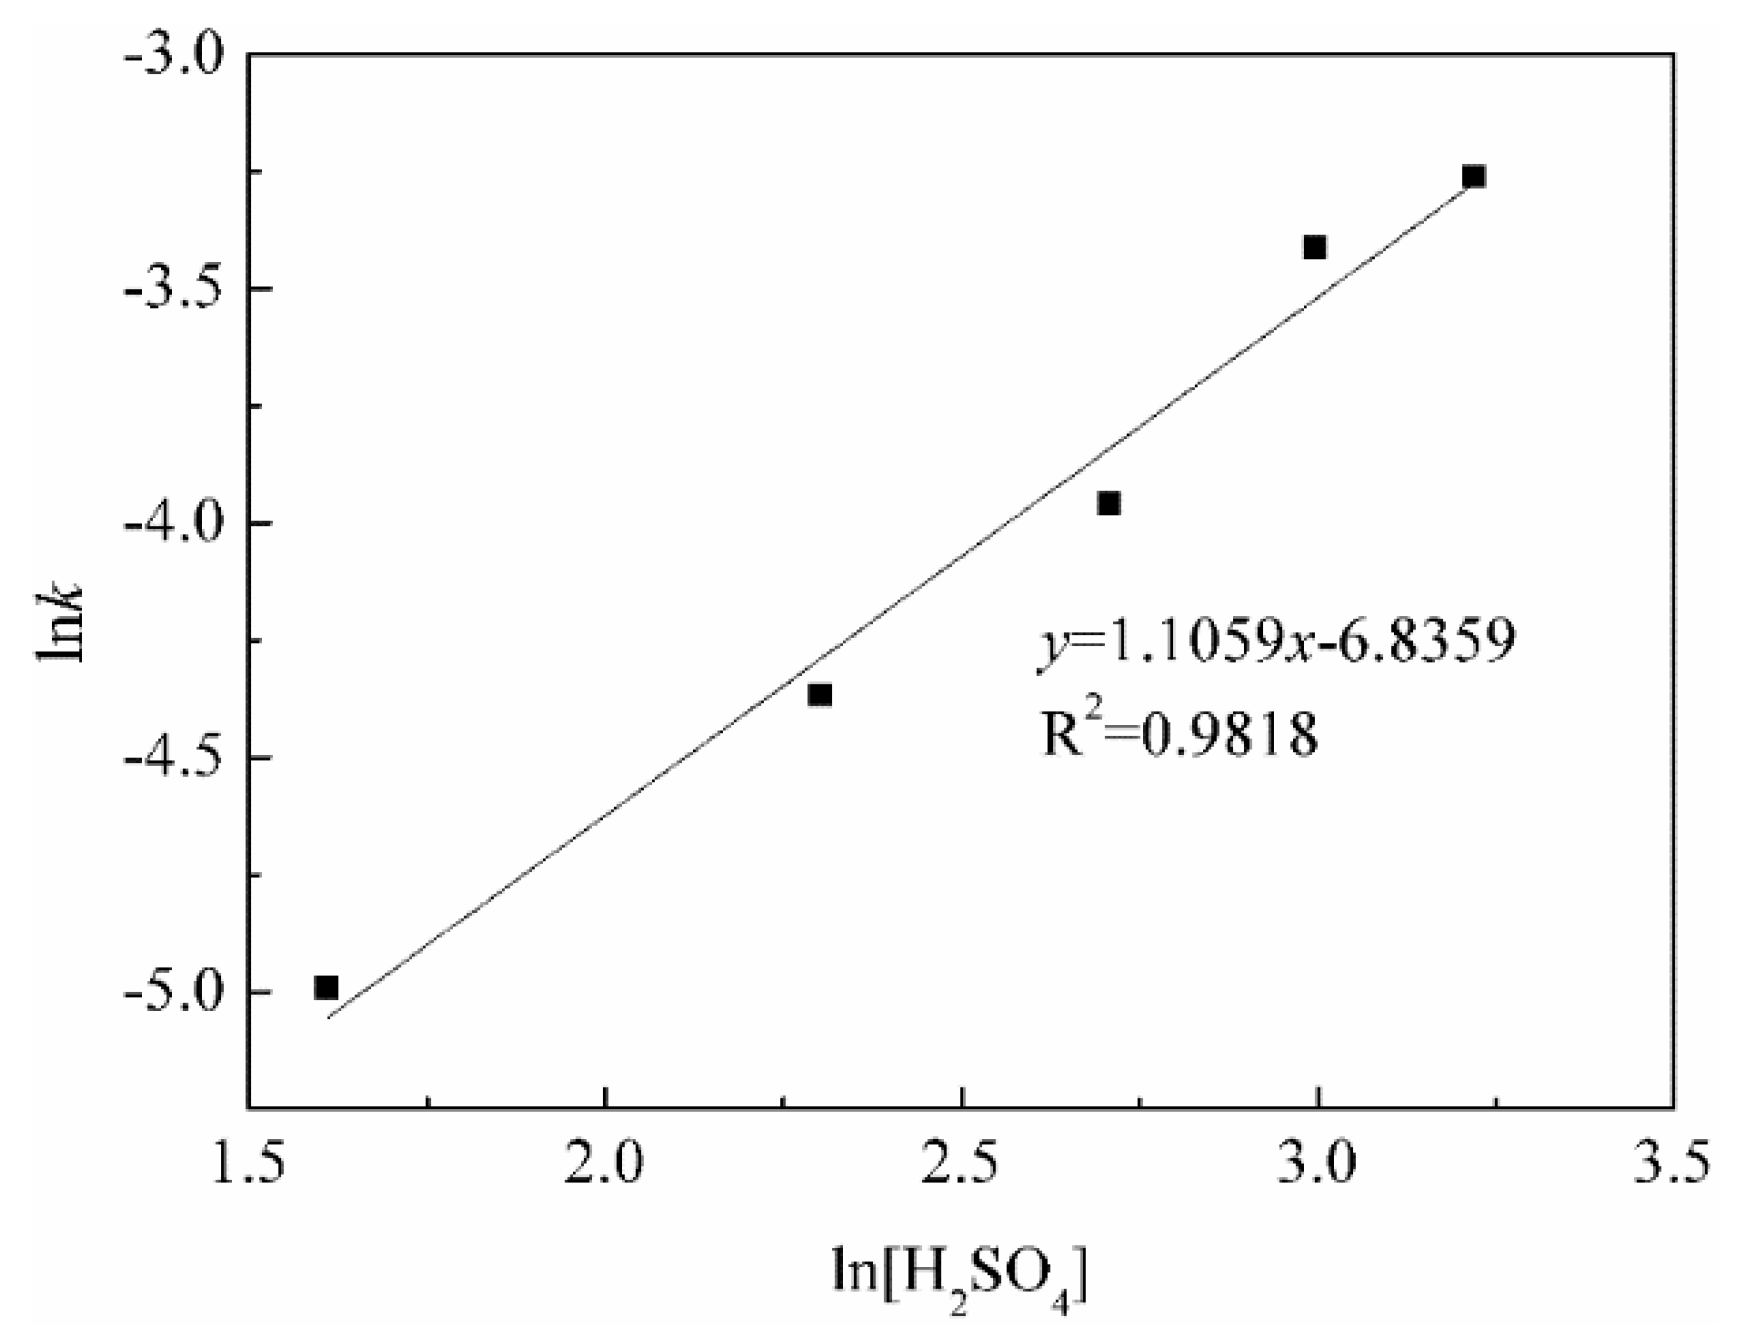
3.3.1. Calculation of Reaction Orders

A fitting plot of 1 − 2α/3 − (1 − α)2/3 with respect to the leaching time (t) was obtained under the different sulfuric acid concentrations. From the slopes of the fitting lines in Figure 17, the apparent rate constant (k) values were determined. A fitting plot of lnk vs. ln[H2SO4] is shown in Figure 18 to achieve the order of dependency with respect to the sulfuric acid concentration. The result from the slope of the fitting line indicated that the empirical reaction order with respect to the sulfuric concentration is 1.1059.

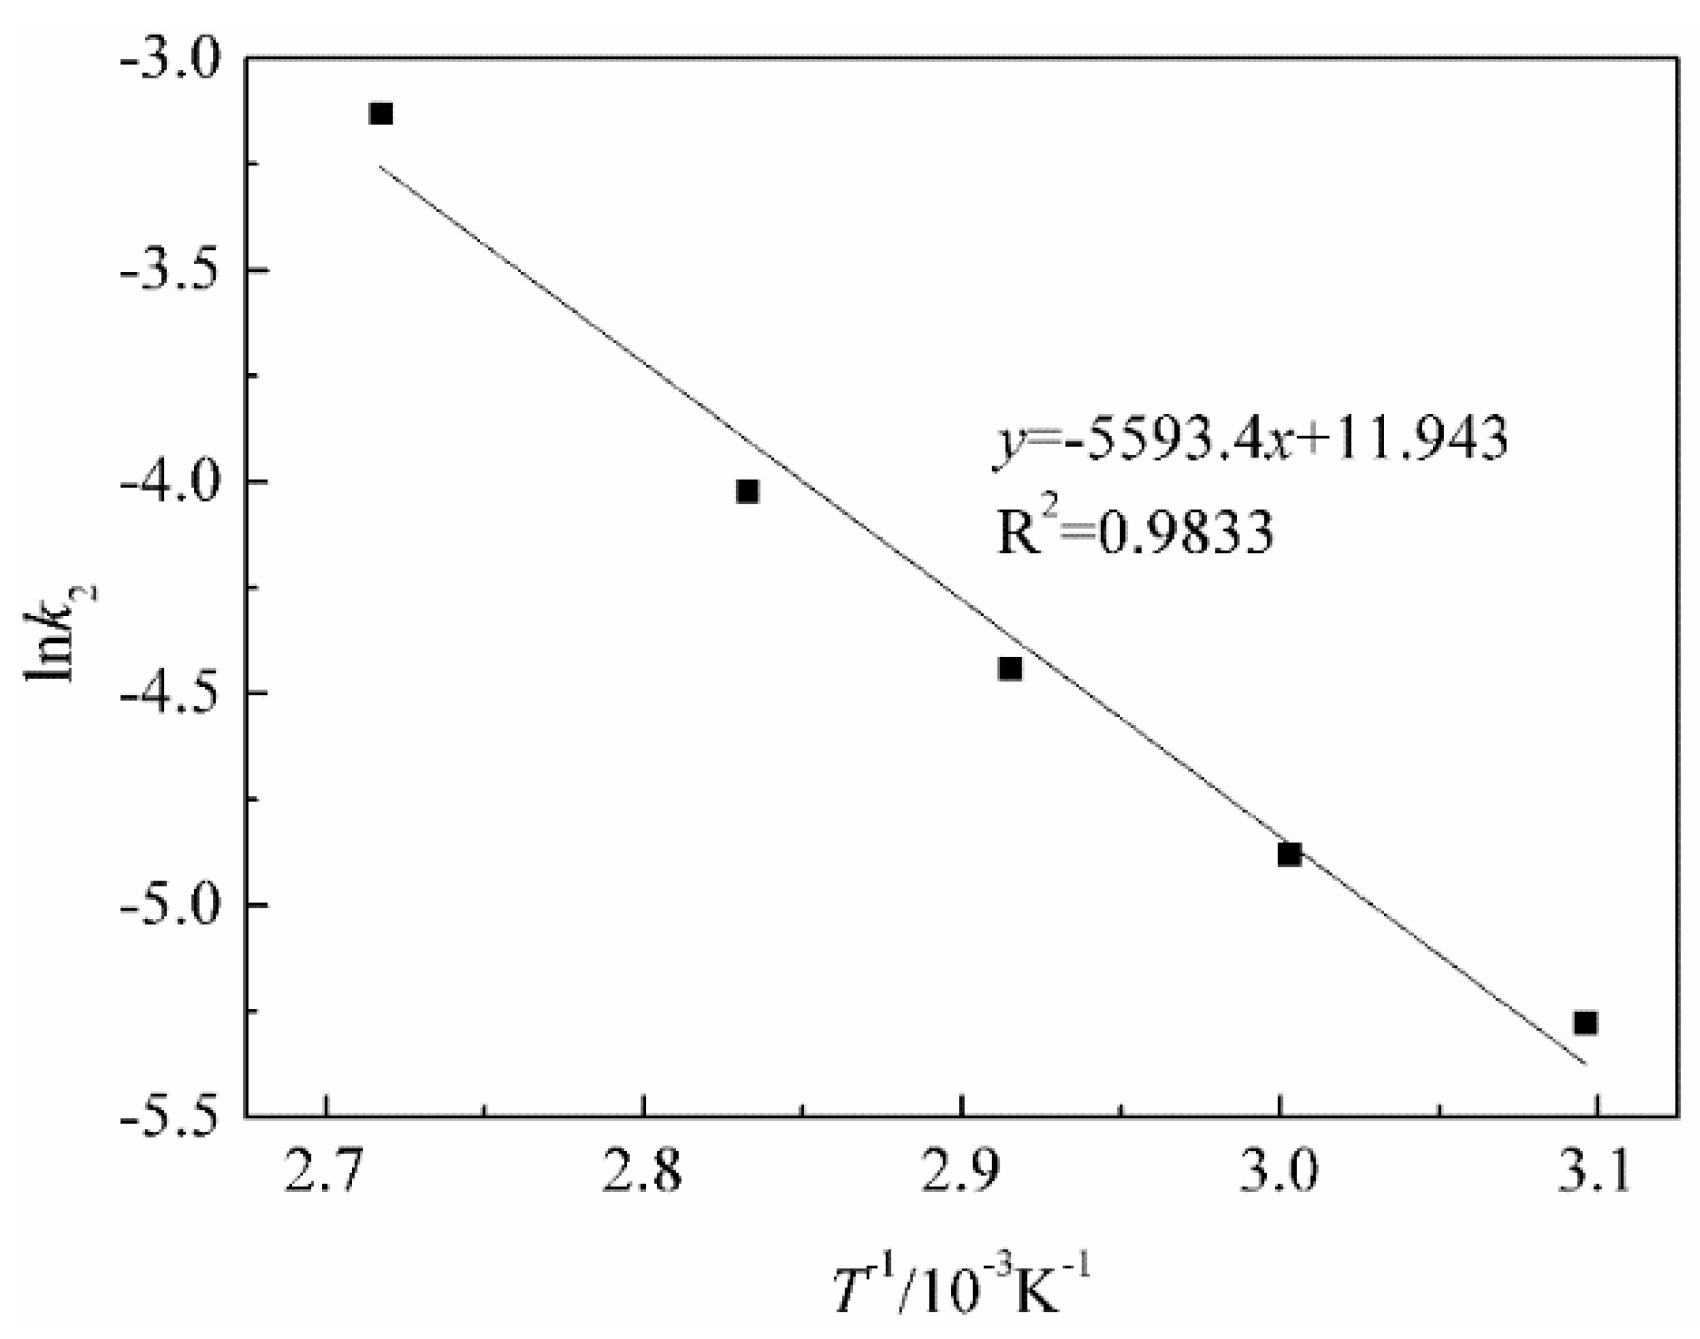
3.3.2. Calculation of Apparent Activation Energy

According to the slopes of the fitting lines in Figure 16, the apparent rate constant (k2) values were obtained and a fitting plot of lnk2 vs. 1/(1000T) is shown in Figure 19. With the slope of the fitting line above, the apparent activation energy (E) could be calculated as 46.51 kJ/mol by the Arrhenius equation as follows:
ln k = E / ( R T ) + ln A
Meanwhile, the reaction constant (A) could also calculated as 1.5374 × 10⁵ with the intercept of the fitting line. Therefore, the vanadium leaching kinetic model controlled by the diffusion through a product layer could be expressed as follows:
1 2 3 α ( 1 α ) 2 / 3 = ( 1.5374 × 10 5 ) [ H 2 S O 4 ] 1.1059 exp [ 46510 / ( R T ) ] t
The leaching system for the vanadium recovery from the refractory stone coal was very complicated, because vanadium existed in the mica (a kind of aluminosilicate) of this stone coal.
The typical kinetic theory [20] indicated that the activation energy for a chemical reaction was >40 kJ/mol, and the activation energy for a diffusion was <40 kJ/mol. In this study, the activation energy was calculated as 46.51 kJ/mol. Our research team [21] concluded that there is a reaction between the aluminosilicate in stone coal and sulfuric acid as follows:
2 KAl ( SiO 3 ) 2 + 4 H 2 SO 4 4 H 2 SiO 3 + K 2 SO 4 + Al 2 ( SO 4 ) 3
The production of H2SiO3 is insoluble and very compact, which will cover the surface of the reaction particle and significantly increase the resistance of diffusion. This is why, although the activation energy was very high, the leaching process was still controlled by the diffusion through the product layer. The reaction mechanisms in this study were similar to the “Shrinking Core–Shrinking Particle” model used by Safari et al. [22], and it was also illustrated and proved by Ju et al. [19].

4. Conclusions

  • The novel BaCO3/CaO composite additive roasting and acid leaching technology was proved to be feasible for the vanadium recovery from refractory stone coal.
  • According to the phase transformation analysis, the monoclinic crystalline structure of muscovite (K(Al,V)2[Si3AlO10](OH)2) was converted into the hexagonal crystalline structure of BaSi4O9 and the tetragonal crystalline structure of Gehlenite (Ca2Al2SiO7) during the composite additive BaCO3/CaO roasting process, which could, therefore, facilitate the release and extraction of vanadium. Vanadium in leaching residue was probably in the form of vanadate or pyrovanadate of barium and calcium, which were hardly extracted during the sulfuric acid leaching process.
  • According to the vanadium leaching kinetic analysis, the process was controlled by the diffusion through a product layer. The apparent activation energy could be achieved as 46.51 kJ/mol. The reaction order with respect to the sulfuric acid concentration was 1.1059. The kinetic model of vanadium recovery from stone coal using novel composite additive BaCO3/CaO could be finally established.

Acknowledgements

This work was financially supported by the National Natural Science Foundation of China (Nos. 51474162 and 51404174), and the Science and Technology Research Program of Ministry of Education of China (No. 213025A).

Author Contributions

Zhenlei Cai and Yimin Zhang conceived and designed the experiments; Zhenlei Cai performed the experiments; Zhenlei Cai analyzed the data; Yimin Zhang, Tao Liu, and Jing Huang contributed reagents/materials/analysis tools; Zhenlei Cai wrote the paper.

Conflicts of Interest

The authors declare no conflict of interest.

References

  1. Li, W.; Zhang, Y.; Liu, T.; Huang, J.; Wang, Y. Comparison of ion exchange and solvent extraction in recovering vanadium from sulfuric acid leach solutions of stone coal. Hydrometallurgy 2013, 131–132, 1–7. [Google Scholar] [CrossRef]
  2. Gouda, G.M.; Nagendra, C.L. Preparation and characterization of thin film thermistors of metal oxides of manganese and vanadium (Mn-VO). Sens. Actuators Phys. 2013, 190, 181–190. [Google Scholar] [CrossRef]
  3. Chen, Y.T.; Chen, W.; Tang, Q.H.; Guo, Z.; Yang, Y.H.; Su, F.B. Aerobic oxidation of benzyl alcohol over activated carbon supported manganese and vanadium catalysts: Effect of surface oxygen-containing groups. Catal. Lett. 2011, 141, 149–157. [Google Scholar] [CrossRef]
  4. Li, X.B.; Wei, C.; Deng, Z.G.; Li, M.T.; Li, C.X.; Fan, G. Selective solvent extraction of vanadium over iron from a stone coal/black shale acid leach solution by D2EHPA/TBP. Hydrometallurgy 2011, 105, 359–363. [Google Scholar] [CrossRef]
  5. Li, H.-Y.; Fang, H.-X.; Wang, K.; Zhou, W.; Yang, Z.; Yan, X.-M.; Ge, W.-S.; Li, Q.-W.; Xie, B. Asynchronous extraction of vanadium and chromium from vanadium slag by stepwise sodium roasting–water leaching. Hydrometallurgy 2015, 156, 124–135. [Google Scholar] [CrossRef]
  6. Queneau, P.B.; Hogsett, R.F.; Beckstead, L.W.; Barchers, D.E. Processing of petroleum coke for recovery of vanadium and nickel. Hydrometallurgy 1989, 22, 3–24. [Google Scholar] [CrossRef]
  7. Qiu, H.; Zhang, H.; Zhao, B.; Zhu, J.; Liu, D. Dynamics study on vanadium extraction technology from chloride leaching steel slag. Rare Met. Mater. Eng. 2013, 42, 696–699. [Google Scholar] [CrossRef]
  8. Zhao, Z.; Guo, M.; Zhang, M. Extraction of molybdenum and vanadium from the spent diesel exhaust catalyst by ammonia leaching method. J. Hazard. Mater. 2015, 286, 402–409. [Google Scholar] [CrossRef] [PubMed]
  9. Li, M.-T.; Wei, C.; Fan, G.; Li, C.-X.; Deng, Z.-G.; Li, X.-B. Pressure acid leaching of black shale for extraction of vanadium. Trans. Nonferrous Met. Soc. China 2010, 20, S112–S117. [Google Scholar] [CrossRef]
  10. Li, C.-X.; Wei, C.; Deng, Z.-G.; Li, M.-T.; Li, X.-B.; Fan, G. Recovery of vanadium from black shale. Trans. Nonferrous Met. Soc. China 2010, 20, S127–S131. [Google Scholar] [CrossRef]
  11. Wang, F.; Zhang, Y.; Liu, T.; Huang, J.; Zhao, J.; Zhang, G.; Liu, J. A mechanism of calcium fluoride-enhanced vanadium leaching from stone coal. Int. J. Miner. Process. 2015, 145, 87–93. [Google Scholar] [CrossRef]
  12. Zhang, X.; Yang, K.; Tian, X.; Qin, W. Vanadium leaching from carbonaceous shale using fluosilicic acid. Int. J. Miner. Process. 2011, 100, 184–187. [Google Scholar] [CrossRef]
  13. Wang, M.; Xiang, X.; Zhang, L.; Xiao, L. Effect of vanadium occurrence state on the choice of extracting vanadium technology from stone coal. Rare Met. 2008, 27, 112–115. [Google Scholar] [CrossRef]
  14. Zeng, X.; Wang, F.; Zhang, H.; Cui, L.; Yu, J.; Xu, G. Extraction of vanadium from stone coal by roasting in a fluidized bed reactor. Fuel 2015, 142, 180–188. [Google Scholar] [CrossRef]
  15. Aarabi-Karasgani, M.; Rashchi, F.; Mostoufi, N.; Vahidi, E. Leaching of vanadium from LD converter slag using sulfuric acid. Hydrometallurgy 2010, 102, 14–21. [Google Scholar] [CrossRef]
  16. Cai, Z.L.; Zhang, Y.M.; Liu, T.; Huang, J. Vanadium extraction from refractory stone coal using novel composite additive. JOM 2015, 67, 2629–2634. [Google Scholar] [CrossRef]
  17. Zhu, X.; Zhang, Y.; Huang, J.; Liu, T.; Wang, Y. A kinetics study of multi-stage counter-current circulation acid leaching of vanadium from stone coal. Int. J. Miner. Process. 2012, 114–117, 1–6. [Google Scholar] [CrossRef]
  18. Li, M.; Wei, C.; Qiu, S.; Zhou, X.; Li, C.; Deng, Z. Kinetics of vanadium dissolution from black shale in pressure acid leaching. Hydrometallurgy 2010, 104, 193–200. [Google Scholar] [CrossRef]
  19. Ju, Z.-J.; Wang, C.-Y.; Yin, F. Dissolution kinetics of vanadium from black shale by activated sulfuric acid leaching in atmosphere pressure. Int. J. Miner. Process. 2015, 138, 1–5. [Google Scholar] [CrossRef]
  20. Shirin, E.; Fereshteh, R.; Sadrnezhaad, S.K. Hydrometallurgical treatment of tailings with high zinc content. Hydrometallurgy 2006, 82, 54–62. [Google Scholar]
  21. Zhang, Y.M.; Bao, S.X.; Liu, T.; Chen, T.J.; Huang, J. The technology of extracting vanadium from stone coal in China: History, current status and future prospects. Hydrometallurgy 2011, 109, 116–124. [Google Scholar] [CrossRef]
  22. Vida, S.; Gilnaz, A.; Fereshteh, R.; Navid, M. A shrinking particle–shrinking core model for leaching of a zinc ore containing silica. Int. J. Miner. Process. 2009, 93, 79–83. [Google Scholar]
Figure 1. XRD image of stone coal [16].
Minerals 06 00026 g001
Figure 2. (a) BEI of raw stone coal; EDS elemental distribution: (b) O; (c) Al; (d) Si; (e) K; (f) V; (i) EDS spectra marked from BEI by circle.
Minerals 06 00026 g002
Figure 3. Effect of BaCO3/CaO total weight on vanadium leaching efficiency.
Minerals 06 00026 g003
Figure 4. Effect of mass ratio of BaCO3 to CaO on vanadium leaching efficiency.
Minerals 06 00026 g004
Figure 5. Effect of roasting temperature on vanadium leaching efficiency.
Minerals 06 00026 g005
Figure 6. XRD patterns of roasting samples at different roasting temperature. (A) Roasting at 650 °C; (B) Roasting at 750 °C; (C) Roasting at 850 °C; (D) Roasting at 950 °C.
Minerals 06 00026 g006
Figure 7. Crystal transformation relationship of muscovite (K(Al,V)2[Si3AlO10](OH)2), BaSi4O9, and Gehlenite (Ca2Al2SiO7) in the roasting process.
Minerals 06 00026 g007
Figure 8. Effect of sulfuric acid concentration on vanadium leaching efficiency.
Minerals 06 00026 g008
Figure 9. Effect of leaching temperature on vanadium leaching efficiency.
Minerals 06 00026 g009
Figure 10. XRD patterns of leaching samples at different leaching temperature. (A) Leaching at 60 °C; (B) Leaching at 70 °C; (C) Leaching at 80 °C; (D) Leaching at 95 °C.
Minerals 06 00026 g010
Figure 11. (a) BEI of leaching residual, EDS elemental distribution: (b) O; (c) Si; (d) V; (e) Ba; (f) Ca.
Minerals 06 00026 g011
Figure 12. Effect of particle size on vanadium leaching efficiency.
Minerals 06 00026 g012
Figure 13. Fitting plots of 1 − 2α/3 − (1 − α)2/3 versus leaching time t at different particle sizes.
Minerals 06 00026 g013
Figure 14. Fitting plot of k0 as a function of d1.
Minerals 06 00026 g014
Figure 15. Fitting plots of 1 − (1 − α)1/3 versus leaching time t at different leaching temperatures.
Minerals 06 00026 g015
Figure 16. Fitting plots of 1 − 2α/3 − (1 − α)2/3 versus leaching time t at different leaching temperatures.
Minerals 06 00026 g016
Figure 17. Fitting plots of 1 − 2α/3 − (1 − α)2/3 versus leaching time t at different sulfuric acid concentrations.
Minerals 06 00026 g017
Figure 18. Fitting plot of lnk as a function of ln[H2SO4].
Minerals 06 00026 g018
Figure 19. Arrhenius fitting plot of lnk2 as a function of 1/(1000T).
Minerals 06 00026 g019
Table 1. Chemical multi-elemental analysis of stone coal wt % [16].
ElementV2O5SiO2Al2O3CaOFe2O3K2OMgONa2OSO3P2O5
Content0.7751.159.088.332.441.971.820.453.551.29

