A Process Mineralogy Approach to Gravity Concentration of Tantalum Bearing Minerals


Camborne School of Mines, College of Engineering, Mathematics & Physical Sciences (CEMPS), University of Exeter, Penryn Campus, Exeter, Cornwall TR10 9FE, UK
*
Author to whom correspondence should be addressed.
Minerals 2017, 7(10), 194; https://doi.org/10.3390/min7100194
Submission received: 3 August 2017
/
Revised: 21 September 2017
/
Accepted: 12 October 2017
/
Published: 13 October 2017
(This article belongs to the Special Issue Process Mineralogy of Critical Metals)
Abstract
:The historic Penouta mine in northwest Spain is the focus of efforts to extract tantalum from tin mining waste. This paper describes the characterisation of the tantalum mineralogy of waste material from the deposit. Characterisation was realised using quantitative mineralogy and geochemistry. This paper further identifies other phases of interest and investigates the potential for extraction using gravity separation techniques. The gravity concentrate obtained through these tests was analysed using quantitative mineralogy and electron probe microanalysis. Following characterisation of the sample material to identify the key Ta-bearing mineral phases and assess liberation, a series of gravity separation trials were conducted using Heavy Liquid Separation (HLS), Mozley table, Knelson concentrator separation and shaking table. The laboratory shaking table used to conduct a rougher test and a rougher/cleaner test to simulate a spiral-table circuit using the Penouta material. Mass balance calculations were carried out to calculate the contained metal content of the feed material and concentrate products in order to assess recovery rates for Ta, Sn and Nb across a range of grains sizes. Ta was found to be present predominantly in the solid-solution columbite-group mineral, along with minor Ta present as microlite and as impurities within cassiterite. It was found that over 70% of the Ta is contained within the −125 μm fraction, with the Ta-bearing minerals tantalite and microlite being closely associated with quartz. Mozley table separation resulted in recoveries of 89% Ta and 85% Nb for the −125 μm fraction. The Knelson Concentrator trial was carried out on the −625 μm size fraction, thereby eliminating low grade material found in the coarsest fractions. Size analysis of the recovery rate for each product, shows that the Knelson concentrator is most efficient for recovery of −125 μm particles.
1. Introduction
Tantalum has an average crustal abundance of 1.7 ppm [1] making it the 52nd most abundant element in the crust [2]. Its unique chemical and physical properties including superconductivity, corrosion-resistance, a very high melting temperature (2996 °C), shape memory properties, a high coefficient of capacitance and bio-compatibility [3,4] make it an important metal in modern society. Specific industrial and medical applications range from metal alloys, carbides, chemicals, electronic components such as capacitors and equipment used for surgery. New technologies, leading to the miniaturisation of electronic devices have resulted in increased use of tantalum. These applications make tantalum an increasingly important metal which is considered of high importance for the European Union [5,6].
Tantalum is not currently produced in the European Union; the EU is entirely dependent on imports and due to concerns over reliability of future access to tantalum ore [1], up until 2014, the European Commission had tantalum listed as a critical raw material [2]. The latest update to the critical raw materials list has removed tantalum from the list due to changes in primary tantalum production; however, despite the downgrade in its status, it is still considered a “strategic mineral” due to its widespread use and reliance on imports. Deposits are scarce, thus new methods have to been developed to exploit low grade deposits and also tailings from Sn deposits. Russia is currently the only country in Europe where tantalum is mined [5,6,7], although several potential projects can be also considered, such as alkaline intrusives of the central part of the Kola Peninsula, in Russia, Li–Sn–Ta–bearing pegmatites in Finland and the Beauvoir granite in the French Central Massif [8,9,10]. This is also the case of the Penouta Sn–Ta–Nb granite, in Spain, which contains 95.5 Mt of Measured and Indicated Mineral Resources with average grades of 77 ppm Ta and 443 ppm Sn [11].
The Penouta ore deposit is located in the Penouta village, municipality of Viana do Bolo, Ourense, Galicia, northeast of Spain. It is a Sn–Ta greisen-type ore deposit where mineralization occurs in quartz veins related to the greisen as in the surrounding leucogranites [12]. Historically, mining in the Penouta area has been carried out since Roman times, with small underground tunnels which followed cassiterite mineralized quartz veins hosted by a peraluminous albite leucogranite. Mining in the Penouta deposit is documented since 1906, but it was not extensively exploited until the 1970s, mainly to obtain cassiterite from a granitic cupola and a swarm of related hydrothermal quartz veins, while Ta was obtained as by-product. Processing during this time was by gravity separation and restricted to the −2 mm fraction. The +2 mm fraction was combined with gravity processing tailings and stored in dams. Thus, a great amount of cassiterite and columbite-group minerals (CGM) was not liberated from the hosting rock and was progressively accumulated in the tailings ponds. As a consequence, sands from tailings reached similar grades as those of the original granite [13,14,15].
Studies undertaken between 1961 and 1985 indicated 13 Mt of reserves with average grades of 750 ppm Sn and 90 ppm Ta [14,15]. However, the drop of metal prices led to the definitive closure of the mine in 1985, has meant that there has been scarce scientific research into the deposit since this time. However, the lack of detailed mineralogical information hindered separation of metals from sands. The revival of mining in recent years has encouraged the mining company Strategic Minerals Spain to carry out new exploration on the resources of the Penouta deposit [11].
This study describes a process mineralogy approach to gravity concentration of Tantalum bearing minerals. The implementation of chemical and mineralogical data is investigated to characterise material from tailings from Penouta and to link this to potential gravity separation methods to determine the extractability of tantalum from historical tailings material.
2. Materials and Methods
2.1. Ore Sample
Samples were collected during January 2015 from the Penouta Mine site by representatives from OptimOre at the Universitat Politècnica de Catalunya (UPC). Sixty-four kilograms of material from the Balsa Grande tailing was shipped to the Camborne School of Mines (CSM), University of Exeter laboratories in Penryn, where it was split into representative 1 kg samples.
2.2. Chemical and Mineralogical Analysis
All analysis mentioned below was conducted at the Camborne School of Mines, University of Exeter, Penryn Campus, Exeter, UK. A JEOL JSM-5400LV scanning electron microscope (SEM) was used in low vacuum mode alongside optical microscopy to qualitatively assess the mineralogy of the sample. A small number of particles were selected for analysis by Energy Dispersive Spectrometer (EDS) to aid in mineral identification. The element composition of each particle was used to assist in mineral identification.
Quantitative mineralogical analysis was conducted on the samples using a QEMSCAN® 4300 (at Camborne School of Mines, University of Exeter, Penryn Campus, Exeter, UK) which is based on a Zeiss EVO 50 series SEM and consists of four light elements Bruker SDD (Silicon Drift Droplet) Energy Dispersive X-ray Spectrometers (EDS) and an electron backscatter detector [16]. Both the Fieldscan and PMA measurement modes were used on the samples depending on the sample particle sizes. iMeasure v. 4.2 was used for data acquisition, and iDiscover v. 4.2 and 4.3 were used for the data processing.
Bulk geochemical analysis was carried out using a Bruker S4 Pioneer WDS X-ray Fluorescence (XRF) instrument. The results from QEMSCAN® were validated by comparison with XRF data. Portable X-ray Fluorescence analysis (PXRF) was carried out using an Olympus DP-6000C PXRF to provide more in depth analysis on sized fractions of gravity test products. PXRF results were calibrated using results from the WDS XRF analyser.
Detailed spatially resolved chemical analysis of minerals was carried out by Electron Probe Microanalysis (EPMA) using a JEOL JXA-8200 Electron Microprobe.
2.3. Sample Preparation and Experimental Approach for Gravity Concentration
2.3.1. HLS and Mozley Table
A 1 kg representative sample of the Penouta tailings was split into two sub-samples using a riffle Splitter box. One sample was screened on a √2 system, splitting the sample into nine size fractions (Table 1).
The size fraction +2800 μm was not subjected to testing due to insufficient amounts of material. The size fractions (−180/+125) μm and −125 μm were not subjected to HLS due to practical difficulties in recovery from solution. Instead, these size fractions underwent separation by Mozley table. HLS of the coarse size fractions (−2800/+180 μm) was undertaken using sodium polytungstate (SPT) with a specific gravity of 2.86 as the medium. The fine fractions (−180/+125) μm and −125 μm were analysed by Mozley Table with a sand deck. Five products were collected for each size fraction: High Grade 1, High Grade 2, High Grade 3, Middlings and Tailings.
2.3.2. Knelson Concentrator
Approximately 20 kg of bulk material from Penouta was screened at 625 μm to obtain 10 kg of sample at −625 μm for centrifugal separation. A 10 kg sample was used because [17] states that for feed masses <10 kg an overestimation of gravity recoverable content can occur. A bulk separation trial was undertaken using a Knelson 3″ laboratory concentrator. The test was run under the conditions of: feed rate of 0.49 kg/h, water pressure of 6 PSI (40 kpa) and a g force of 60 (chosen as this is the industry standard g force used in working plants). The test conditions were chosen based on the test conditions used by [17] during separation trials for gold. Six products were produced from the trial: a concentrate and five tailings products. The tailings products were collected over set time periods (Table 2). A feed rate of 0.49 kg/min indicates a run time of two minutes per 1 kg of feed material.
Following the trial, each product was split into three samples using a riffle splitter box. One half of the products were screened into eight size fractions using a √2 sieve system and analysed for Ta, Sn and Nb using PXRF. The other half of the products was split repeatedly until approximately 50–60 g were obtained; this split was sent for analysis by Semi-Quantitative XRF (SQ-XRF).
2.3.3. Shaking Table
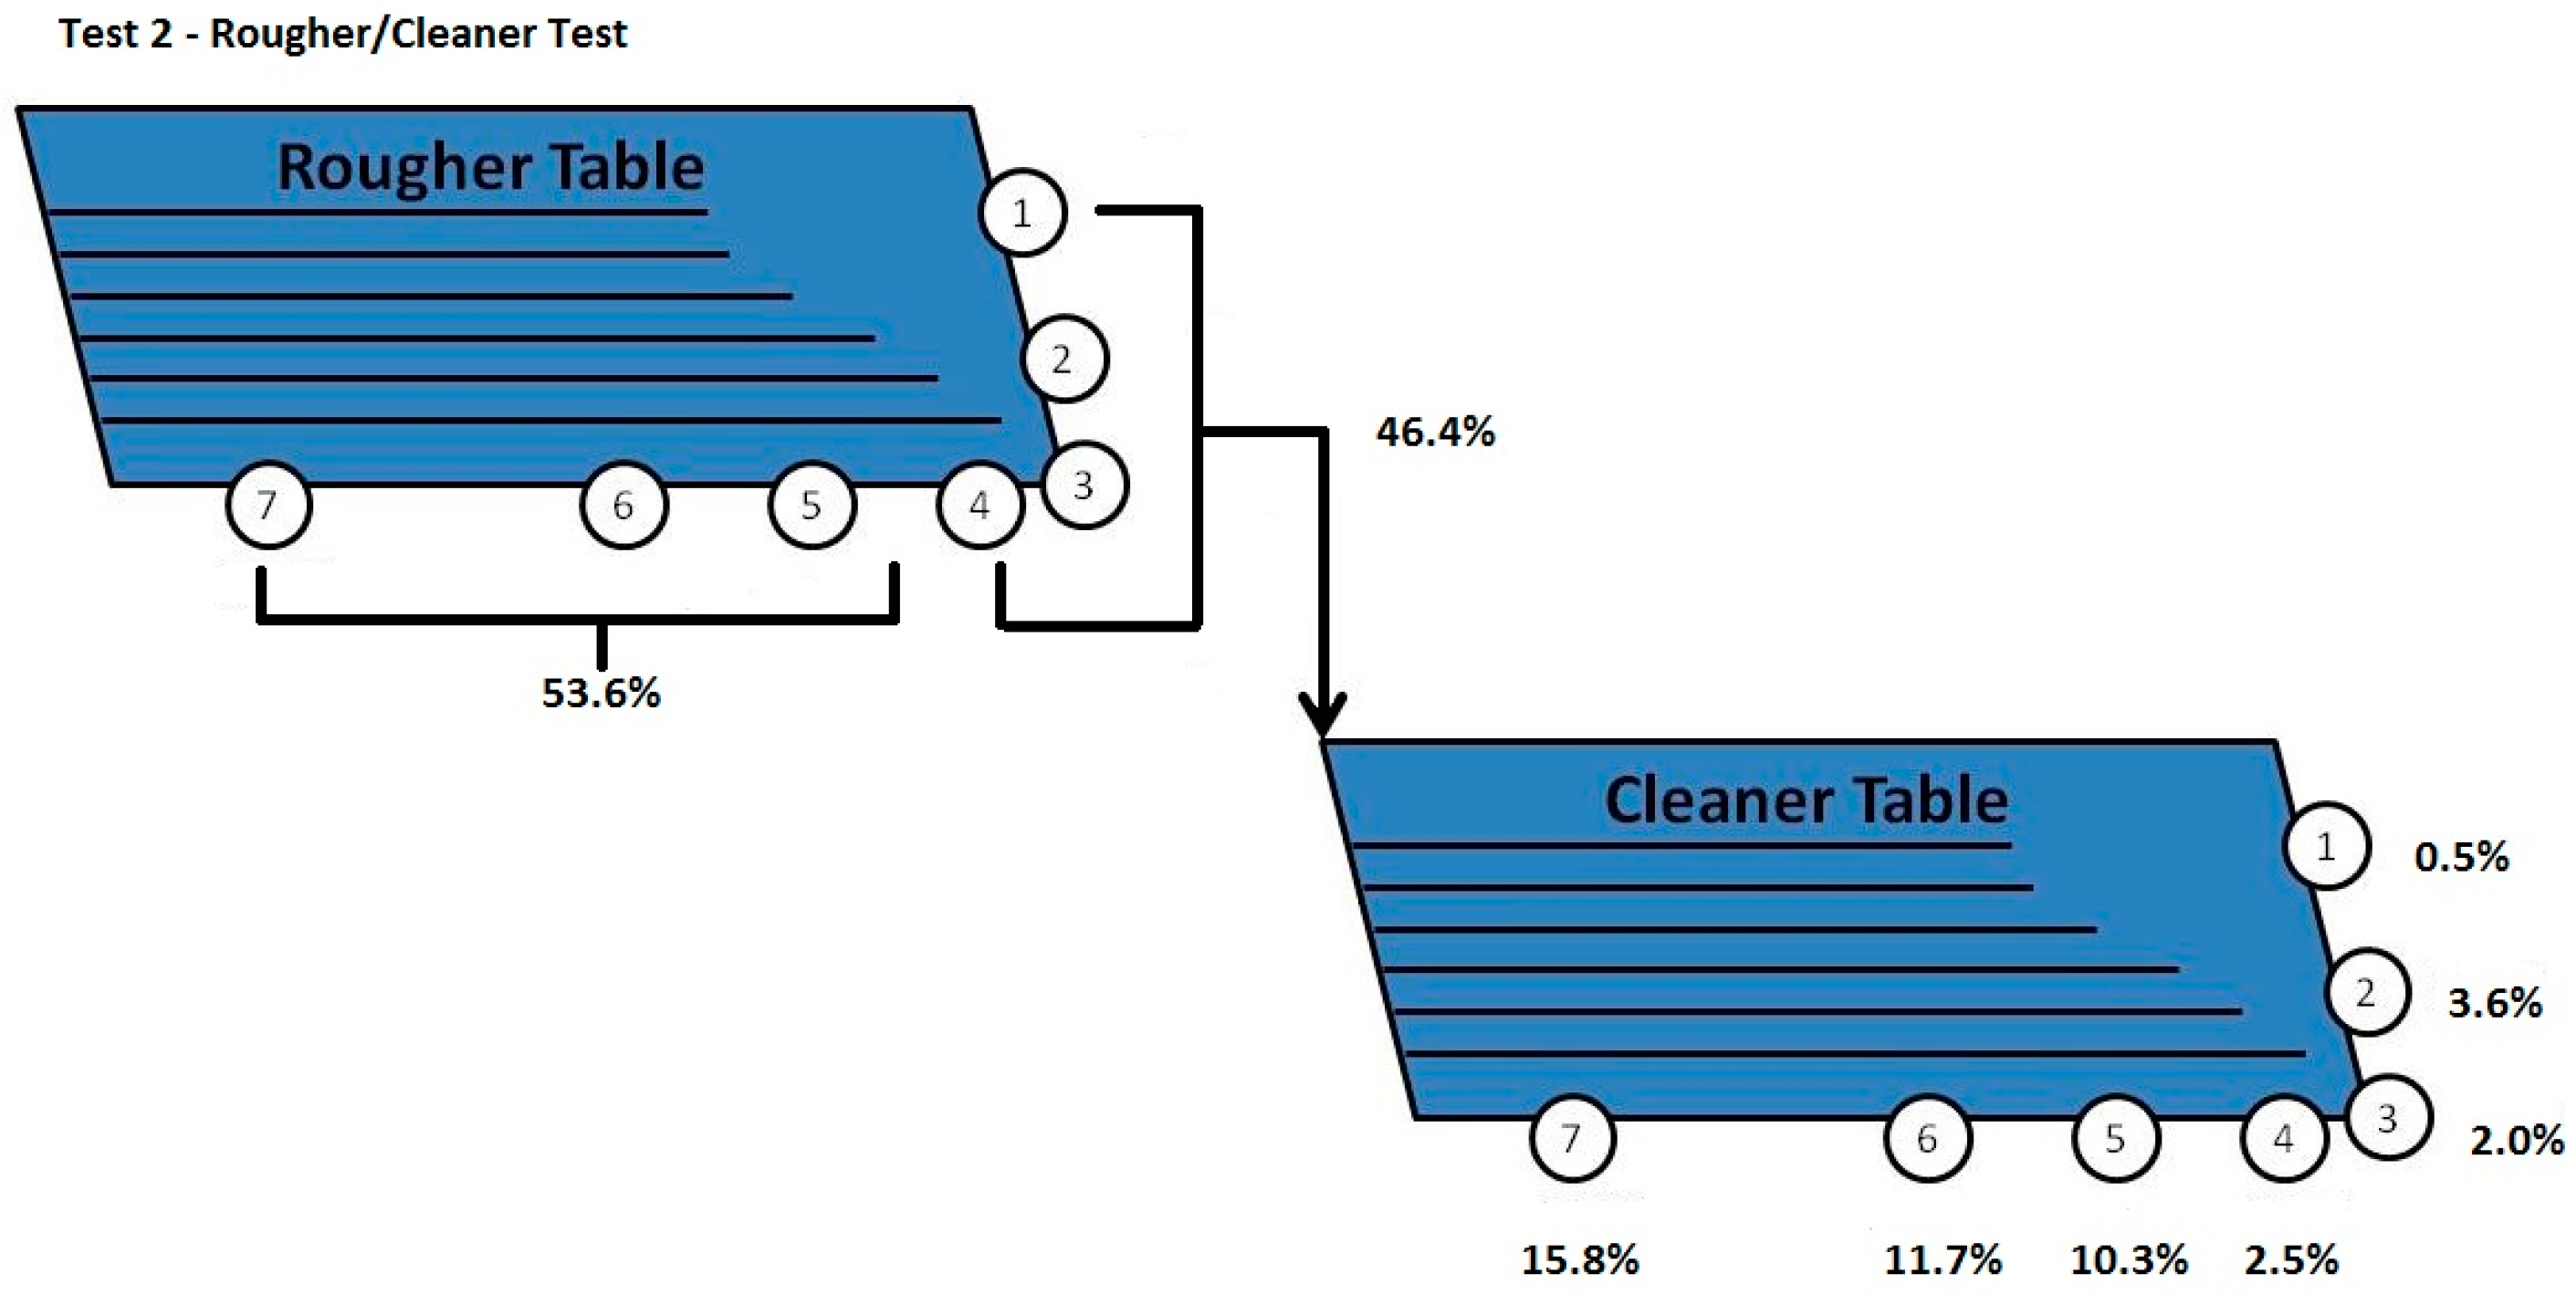
The laboratory shaking table used in the study was a laboratory Wilfley table model 800. A rougher test and a rougher/cleaner test (used to simulate a spiral-table circuit) were run using the Penouta material. To generate sufficient feed material for the rougher/cleaner test approximately 27 kg of Penouta material was screened at 625 μm. A total of 10.77 kg of −625 feed material was produced. The feed for the cleaner table was taken from the first three product streams (concentrate/middlings = 3.62 kg) with an additional 1.38 kg of material from product stream 4 added to make the initial feed weight up to 5.00 kg. A schematic of the tests with the mass flows is shown in Figure 1.
3. Results and Discussions
3.1. Gravity Concentration Using HLS
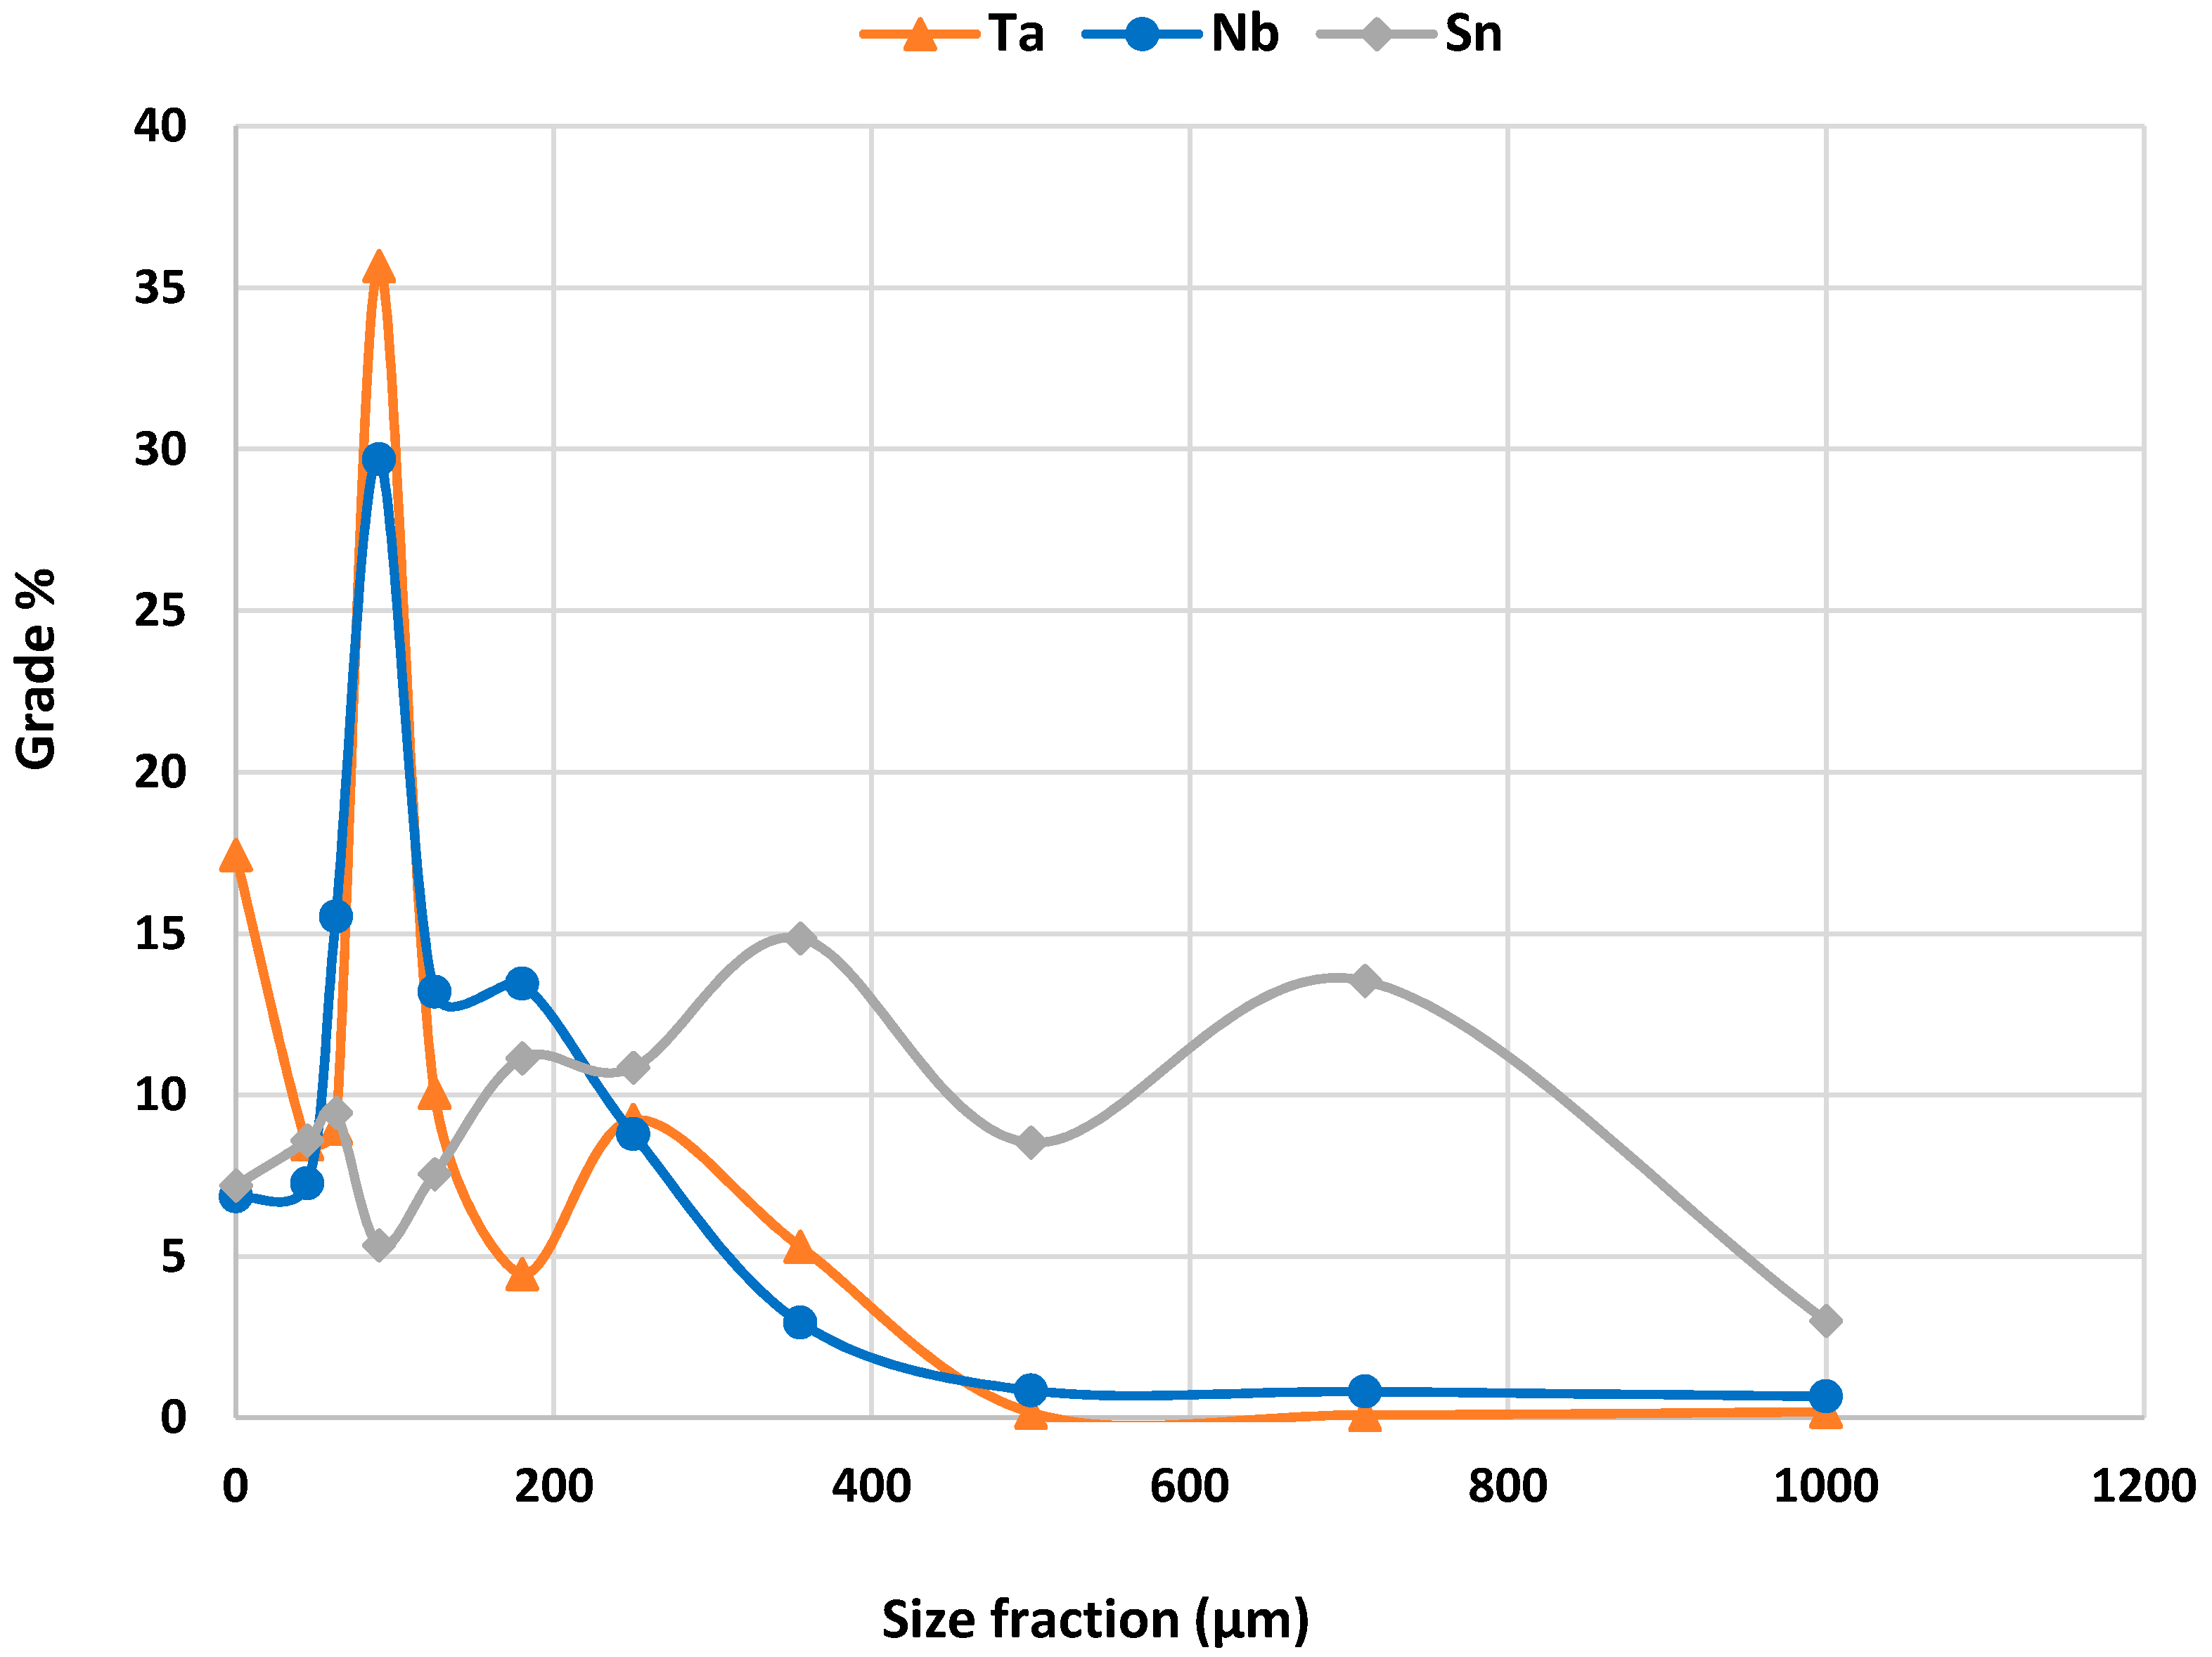
Sink mass fractions increased at smaller particle sizes, particularly in the size fractions (−500/+355) μm and (−355/+250) μm. Mass balance calculations showed that Ta, Sn and Nb are concentrated in the finer fractions. Table 3 shows the distribution of sink and float for each particle size fraction. Comparison of this study to the work done by Montero-Ríos [18] show both studies have found that the majority of contained metal is located in the finest size fractions. Montero-Ríos [18] found that 83% of Ta and Sn are located in the −630 μm fraction, compared to 90% Ta and 62% Sn in the −500 μm calculated from the mass balance (Figure 2).
Figure 3 shows the sink (on the left) and float (on the right) products produced by HLS for each size fraction. It can be clearly observed in the photos from the coarser size fractions that the float product is primarily composed of quartz, with feldspar and mica. In comparison the sink products are composed predominantly of micas and metal-oxides (Fe and Mn), with minor quartz and cassiterite. The majority of observed grains are rounded in shape across all size fractions. The exceptions to this are the biotite and muscovite grains, which show the distinctive platy shape of mica.
Twenty-six minerals grains were selected from the (−355/+250) μm Sink fraction for analysis by SEM to aid in mineral identification. The majority of grains sampled were identified to be biotite. Two grains of alkali feldspar were identified; one was iron-stained whilst the other showed the presence of Al indicating alteration to kaolin was underway. A 200 μm × 100 μm columbite grain was identified on the edge of a quartz grain. The Ta and Nb peaks showed equal intensities indicating the mineral was columbite rather than the Ta-rich tantalite. One grain was identified as Fe-oxide; the brightness of the grains and presence of trace Al suggests hematite rather than magnetite or goethite. Several unusual grains were identified. One contained Ba, Fe, Al, Si, P and trace K and Ca. The remaining grains contained Mn, Si, Al, Fe, K and trace Ti and Zn. However, the presence of Ti and Zn suggests that they could also be pieces of metal contamination from previous processing.
To have adequate sample mass, QEMSCAN® analysis was carried out on two combined sized sink samples with size fraction of (−2800/+500) μm and (−500/+180) μm from the HLS trial as described in Table 1. The (−2800/+500) μm sink fraction is composed primarily of biotite (23.88%), Mn-oxides (22.52%), muscovite (20.85%), Fe-oxides (11.39%), quartz (5.41%), chlorite (3.68%), cassiterite (3.56%), tourmaline (3.34%) and K-feldspar (2.84%). The Ta–Nb minerals make up a minor fraction of the product with columbite (0.09%), tantalite (0.02%) and microlite (<0.01%) all present. The (−500/+180) μm sink fraction is composed primarily of muscovite (60.59%), biotite (19.77%), Mn-oxides (5.04%), Fe-oxides (3.58%), tourmaline (2.97%), quartz (2.29%), chlorite (1.70%) and K-feldspar (1.41%). The Ta–Nb minerals make up a minor fraction of the product with columbite (0.19%), tantalite (0.07%) and microlite (<0.01%) all present. There is a marked increase in the amount of muscovite present in comparison to the coarser fraction sample. As presented in Figure 4, this may be due to the increased grain size of the muscovite (120 μm compared to 70 μm in the (−2800/+500) μm fraction) increasing particle density enough to cause more particles to sink during the separation process.
Cassiterite has a large average grain size of 123 μm, which combined with the mineral mass percentage, indicates that it is fairly well liberated. The products of HLS show a mineral association of cassiterite with quartz (12%–22%), muscovite (7%–12%) and K-feldspar (5%–7%). There is also a strong association with kaolinite (7%–12%), present as an alteration product of K-feldspar, however this is not considered to be of importance as kaolinite makes up <1% of the product mineralogy.
Figure 5 shows that only 11% of the Ta–Nb minerals are well liberated in the (−2800/+500) μm HLS sink product. Almost 70% of the Ta–Nb phases are poorly liberated, most likely due to small grain size (over 85% of the Ta–Nb mineral grains are −30 μm). It is unlikely to be possible to recover this material without resorting to ultrafine grinding. In comparison, 27% of the Ta–Nb mineral grains in the (−500/+180) μm sink product are well liberated, with a further 44% partially liberated. These results suggest that it would be preferable to process material sub 500 μm.
Table 4 shows that approximately 40% of the cassiterite is well liberated in the two HLS sink products. In the (−2800/+500) μm sink product, a further 40% is partially liberated in the coarse fraction, indicating the coarser material may be amenable to further grinding. In the (−500/+180) μm sink product, only a further 9% is partially liberated.
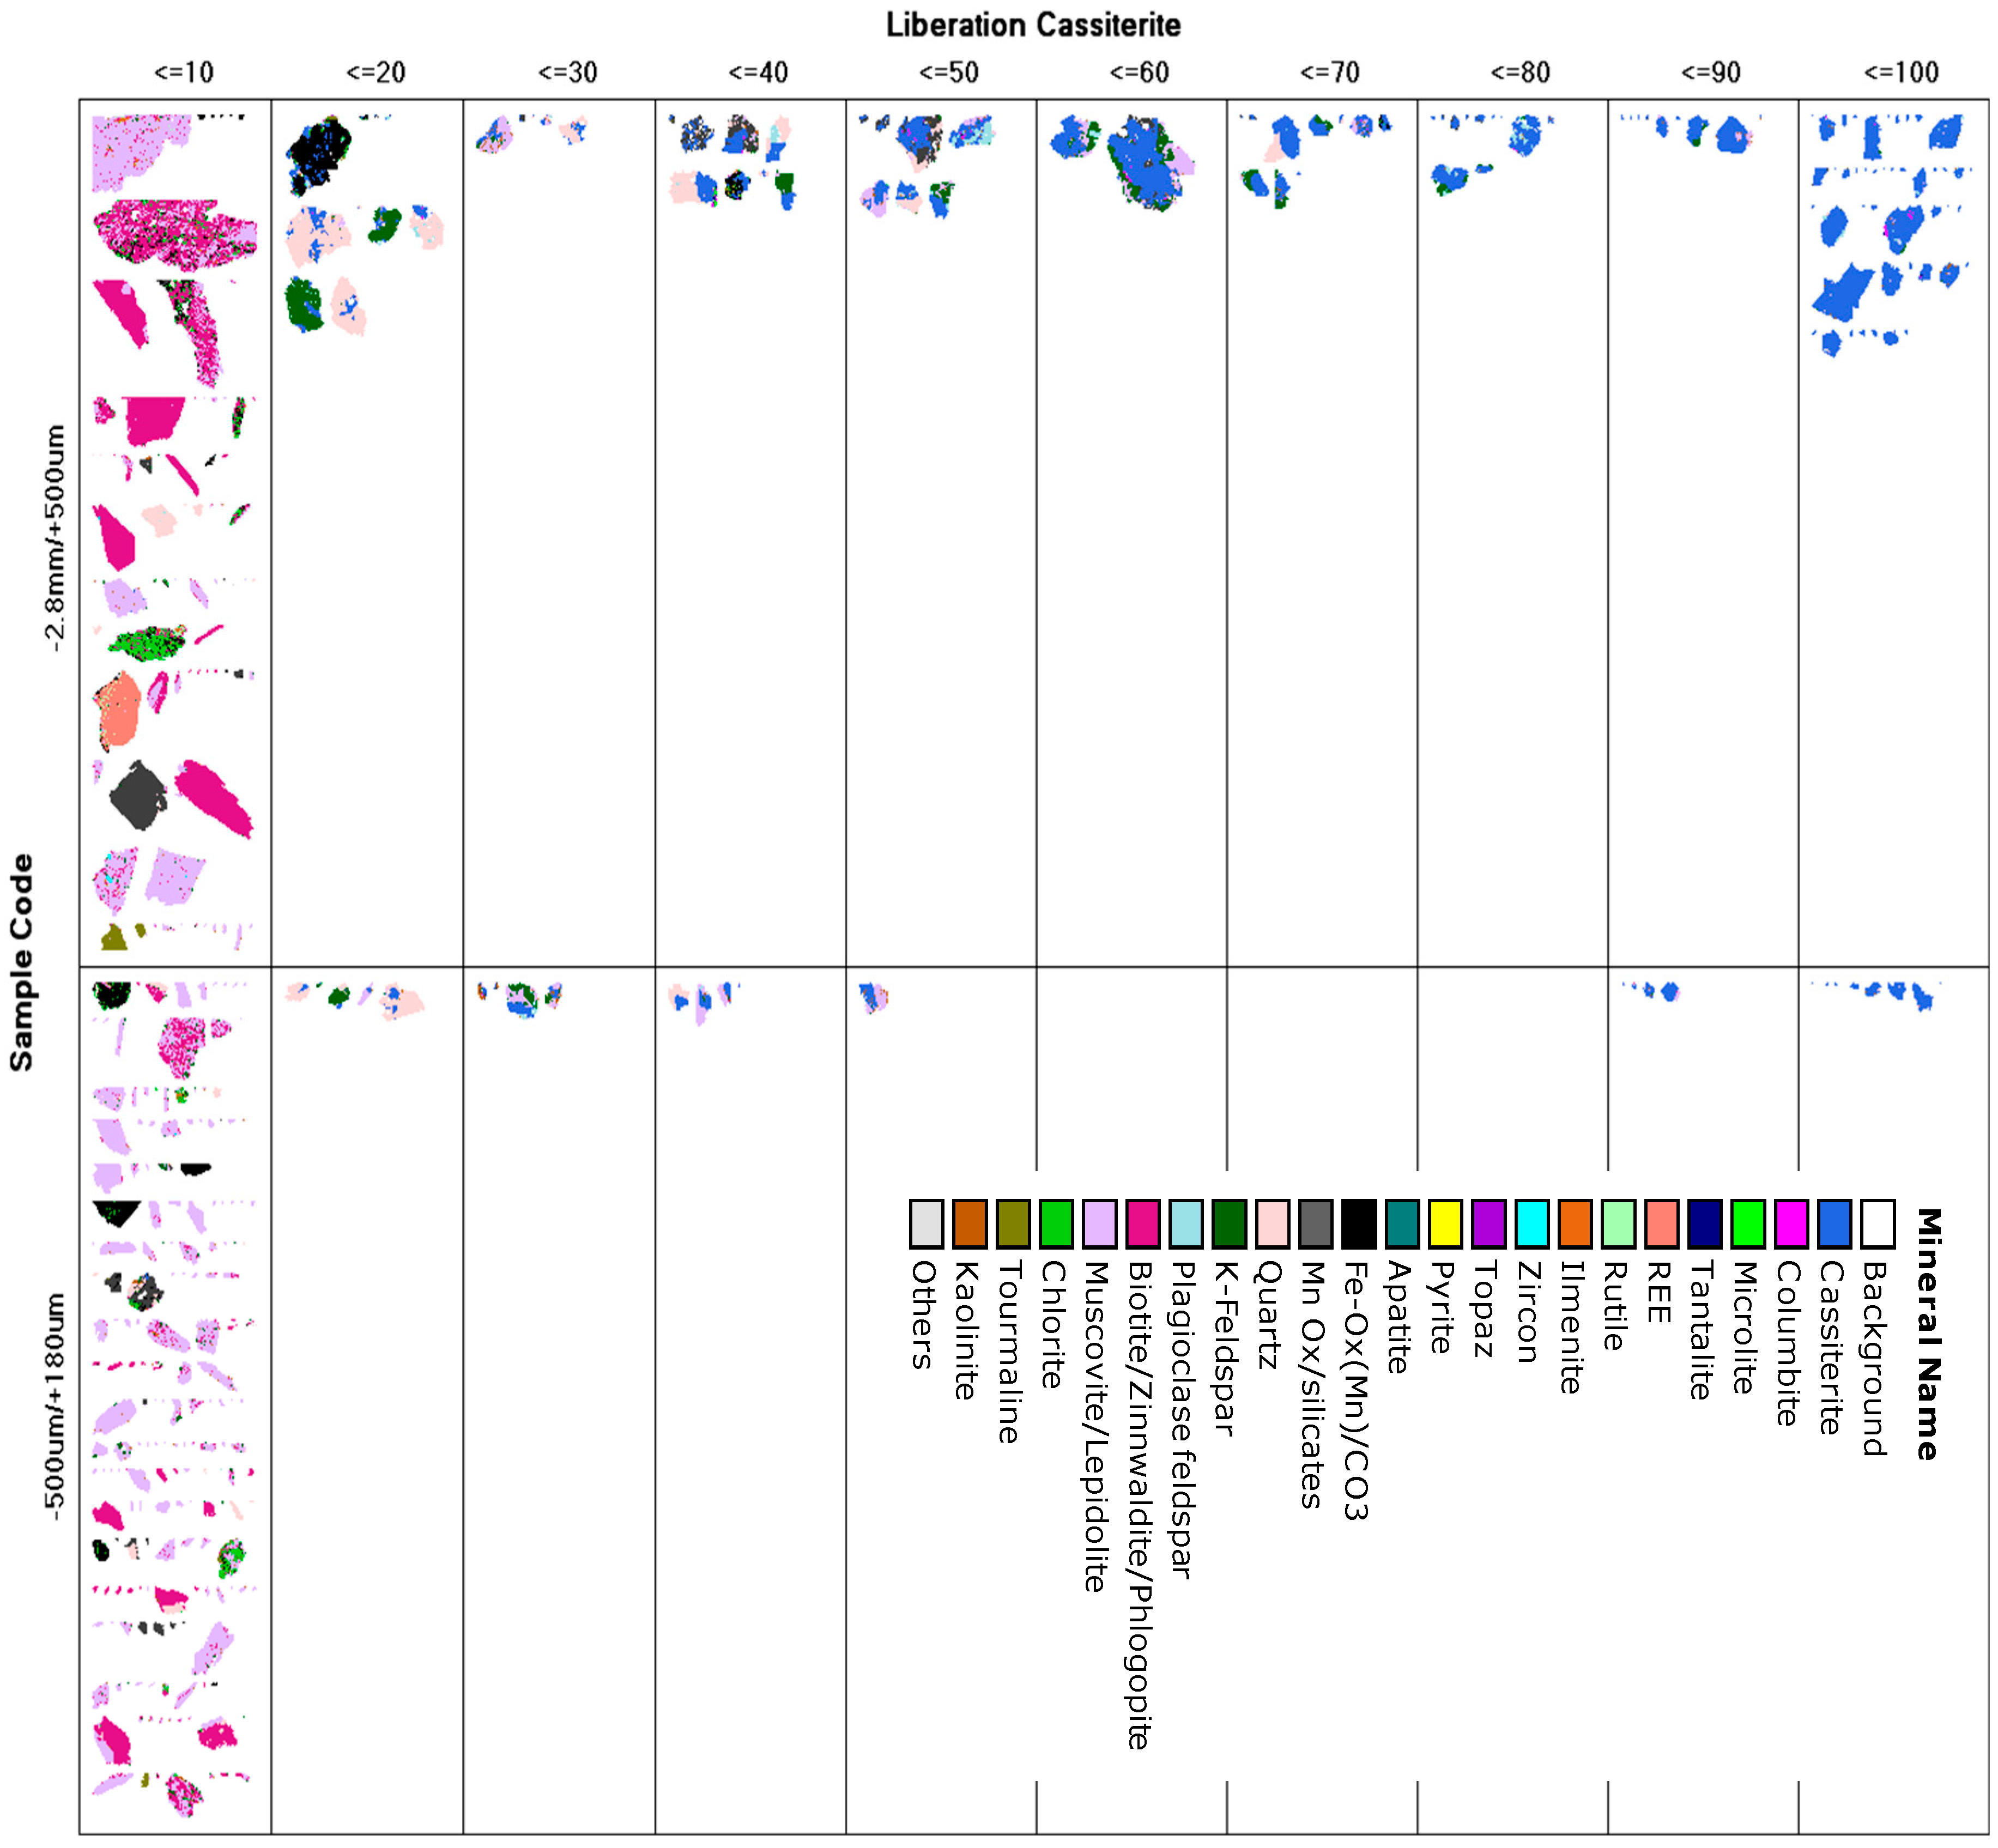
Figure 6 shows the spread of liberated columbite for the HLS sink products. Grain size within the well liberated particles is highly variable. As with the cassiterite, the poorly liberated material in both products is very fine grained and therefore unlikely to be recoverable. Figure 7 shows the spread of liberated cassiterite for the HLS sink products. The partially liberated grains tend towards the coarser size fractions indicating that with further grinding this material would be easily liberated, thereby increasing potential recovery. The poorly liberated material in both products is very fine grained and locked up within muscovite, biotite and quartz grains. Ultrafine grinding would be required to liberate this material, and therefore it is unlikely to be recoverable.
3.2. Gravity Concentration Using Mozley Table
The fine fractions (−180/+125) μm and −125 μm were separated using a Mozley concentrating table with a sand deck. Each sample was placed at the top of the table and water was added at flow rate of 700 mL/min. The table was operated with a stroke movement of 2.75 inches on the 3rd gear speed, at the flattest inclination. A concentrate and tailings fraction were generated, with the concentrate being repassed to generate a cleaner concentrate. This two stage approach resulted in the generation of three products for each sized fraction: a rougher tails (RT); a cleaner tails (CT); and a cleaner concentrate (CC). XRF analyses of these products showed that separation had been successful for the elements of interest. Both cleaner concentrates showed upgraded Ta2O5, Nb2O5 and SnO2 abundances; in particular the −125 μm fraction, where the concentrate contains 161 times more Ta2O5, 112 times more Nb2O5 and 93 times more SnO2 than the tailings. The −125 μm fraction concentrate also shows good concentration of rare earth elements Y2O3 (681 ppm), CeO2 (1344 ppm) and ThO2 (288 ppm). There is no tungsten present at detectable levels in any of the samples. Both concentrates also showed a marked increase in TiO2, Cr2O3, MnO, Fe2O3, ZnO and As2O3.
QEMSCAN® analysis was carried out on the three products of the −125 μm Mozley table trial. For the Mozley table products, >90% of both the tails products are <50 μm in size. In comparison, only 84% of the fine concentrate are <50 μm, indicating that the process has been more successful at concentrating the coarser particle sizes. This may be due to poor liberation of the finer grains. The two tailings products of Mozley Table samples are composed primarily of quartz (50%–52%), K-feldspar (17%–23%), muscovite (11%–14%), plagioclase (7%–14%), kaolinite (1%–2%), and biotite (1%–2%). Columbite (0.01%–0.02%) and tantalite (≤0.01%) make up a minor fraction of the products. There is no microlite detected in the tailings products indicating that there was either a clean separation for this mineral or the grains were too small to be detected (this seems unlikely given the average grain size of microlite in the concentrate is 42 μm). In comparison, the fine concentrate product is primarily composed of quartz (47.99%), plagioclase (18.62%), K-feldspar (12.32%), muscovite (10.17%), Mn-oxides (2.11%), cassiterite (1.74%), kaolinite (1.4%), Fe-oxides (1.25%) and tourmaline (1.05%). The Ta–Nb minerals make up a minor fraction of the concentrate product, however are present in greater quantities than in the tailings, with columbite (0.58%), tantalite (0.15%) and microlite (0.04%) all present. The average grain size of cassiterite in the rough tailings is 95 μm, which decreases to 46–56 μm in the finer fractions. Average grain size for the columbite is 24–35 μm, whilst tantalite is finer (<15 μm).
As shown in Table 5, 50% of the cassiterite is poorly liberated in the finer fraction. Over 80% of the cassiterite grains in the Mozley table fine concentrate are well liberated. Cassiterite within the rough tailings is 20% well liberated. Over 75% of the material is only partially liberated, but, depending on grain size, may be amenable to further grinding. In the fine concentrate product from the Mozley table, 86% of the Ta–Nb mineral grains are well liberated. In both Mozley table tailings products, <50% is well liberated, with the remaining Ta–Nb grains very poorly liberated (<30%). This is due to the very fine grain size of the Ta–Nb minerals in these products: over 75% of grains in each product are <20 μm in size. In addition, 33% of the columbite and 80% of the tantalite grains within the rough tailings are associated with quartz.
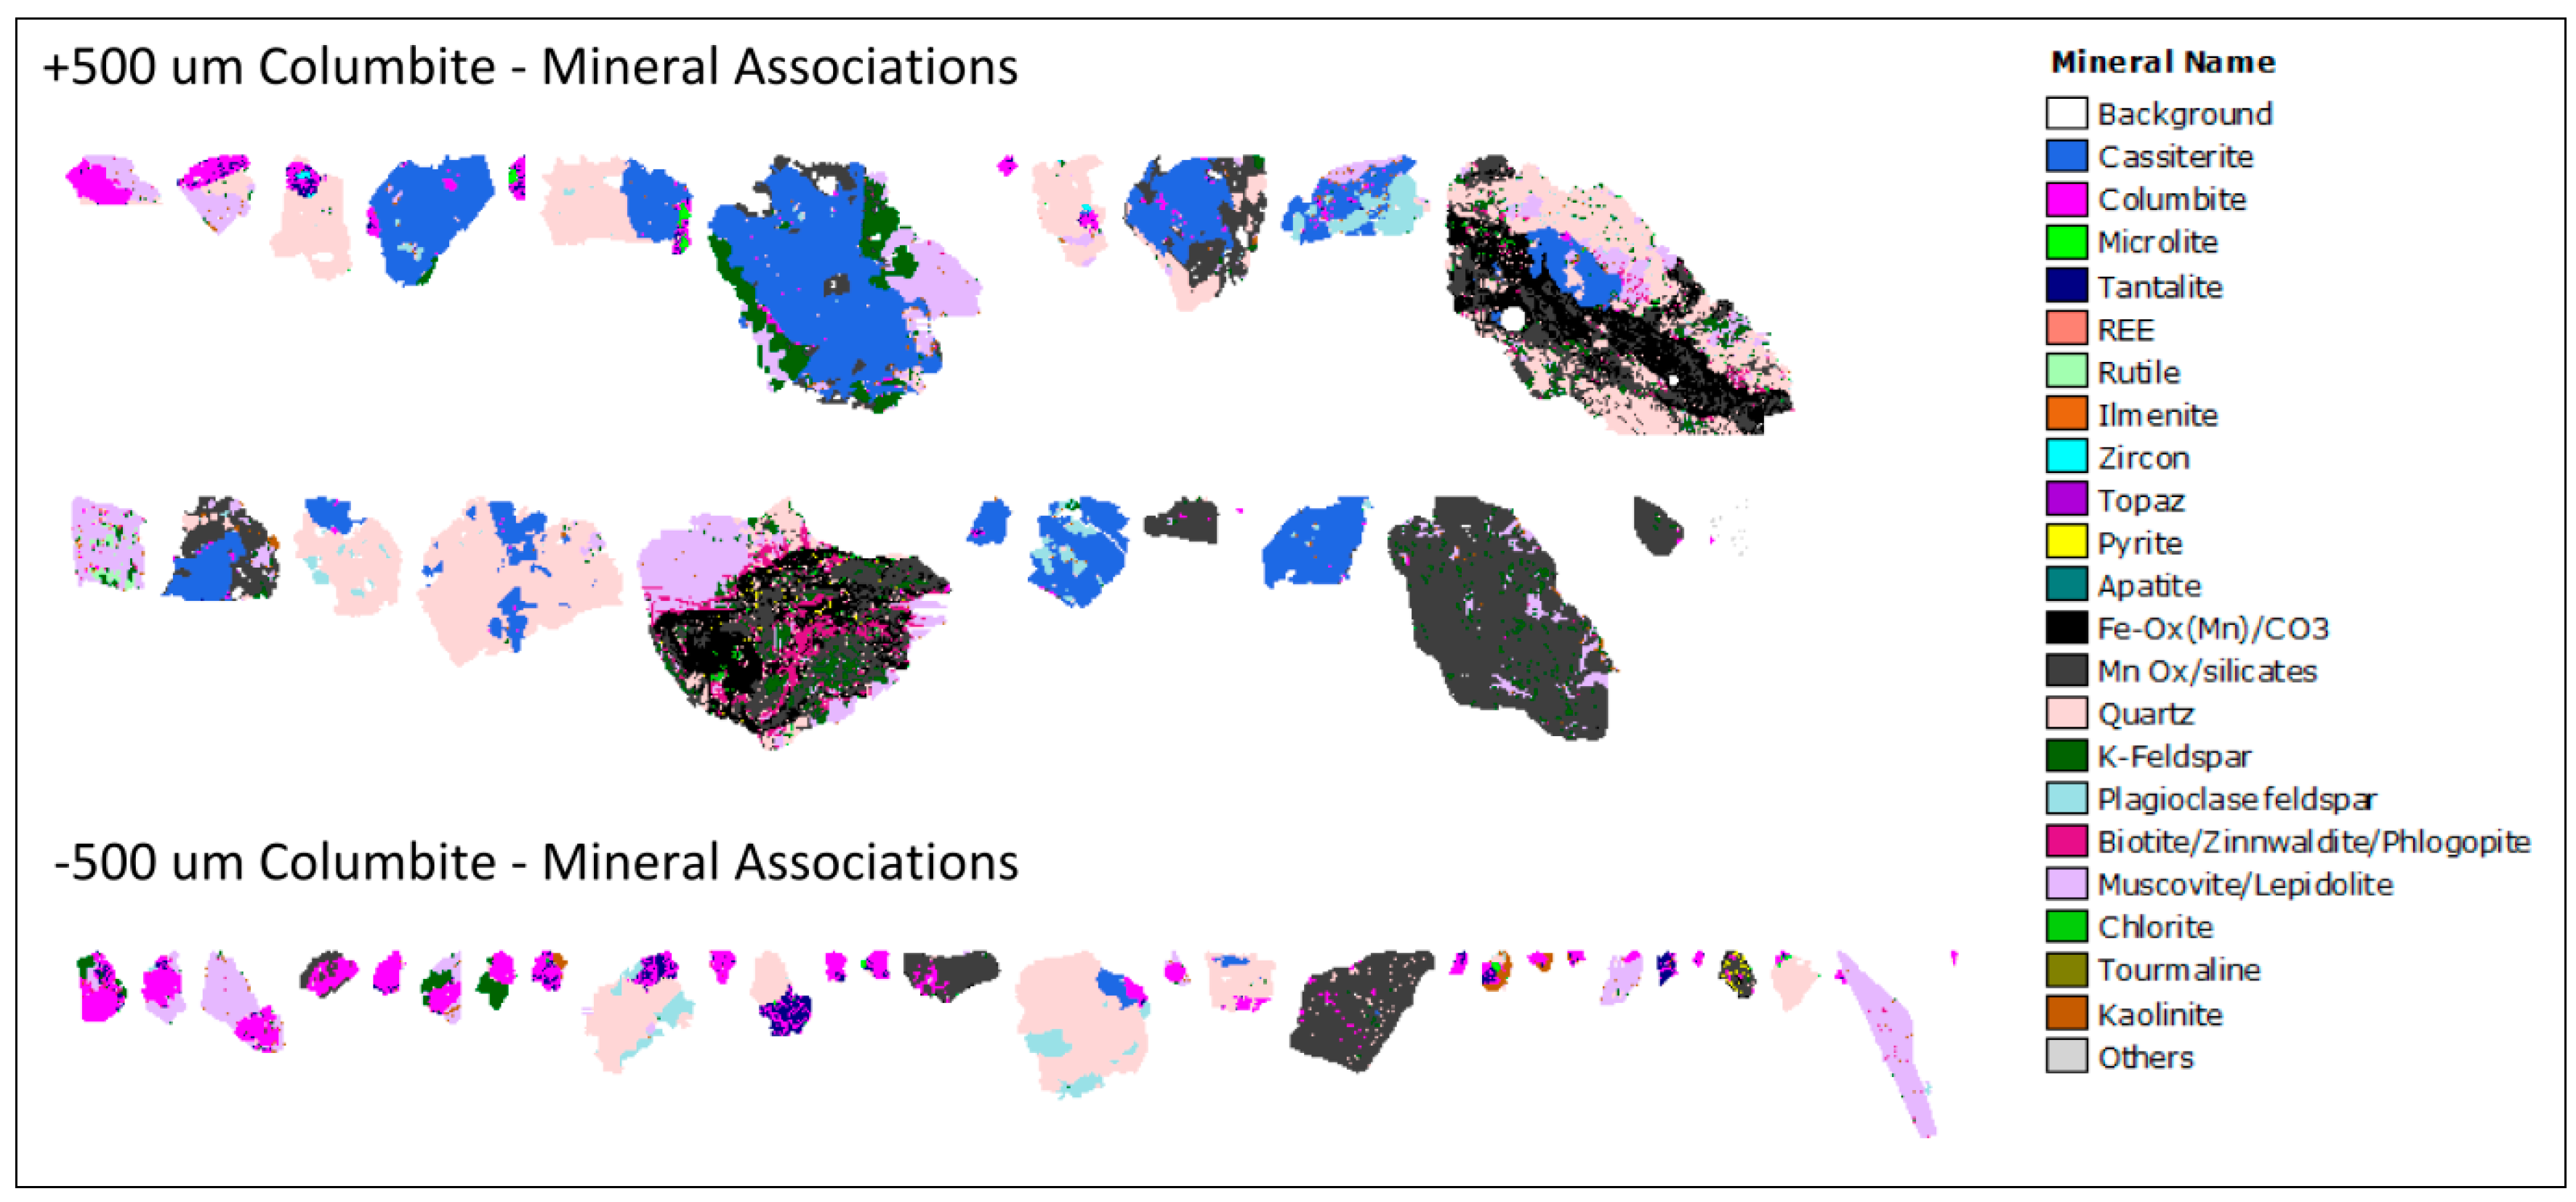
For all samples, columbite and tantalite are closely associated, which is to be expected given they are end members of the same mineral series and occur as solid solution of (Fe,Mn)(Nb,Ta)2O6 within the same particles. Both minerals also show close association with quartz, particularly in the rough tailings from the Mozley table test (33% for columbite and 80% for tantalite), indicating that there is an amount of the minerals that remains unliberated and thus unrecoverable. In the (−2800/+500) μm fraction of the HLS, there is close association of both columbite and tantalite with cassiterite. Figure 8 shows that the columbite is closely associated with quartz, muscovite, cassiterite and Mn-oxide. Columbite in the −500 μm fraction is better liberated.
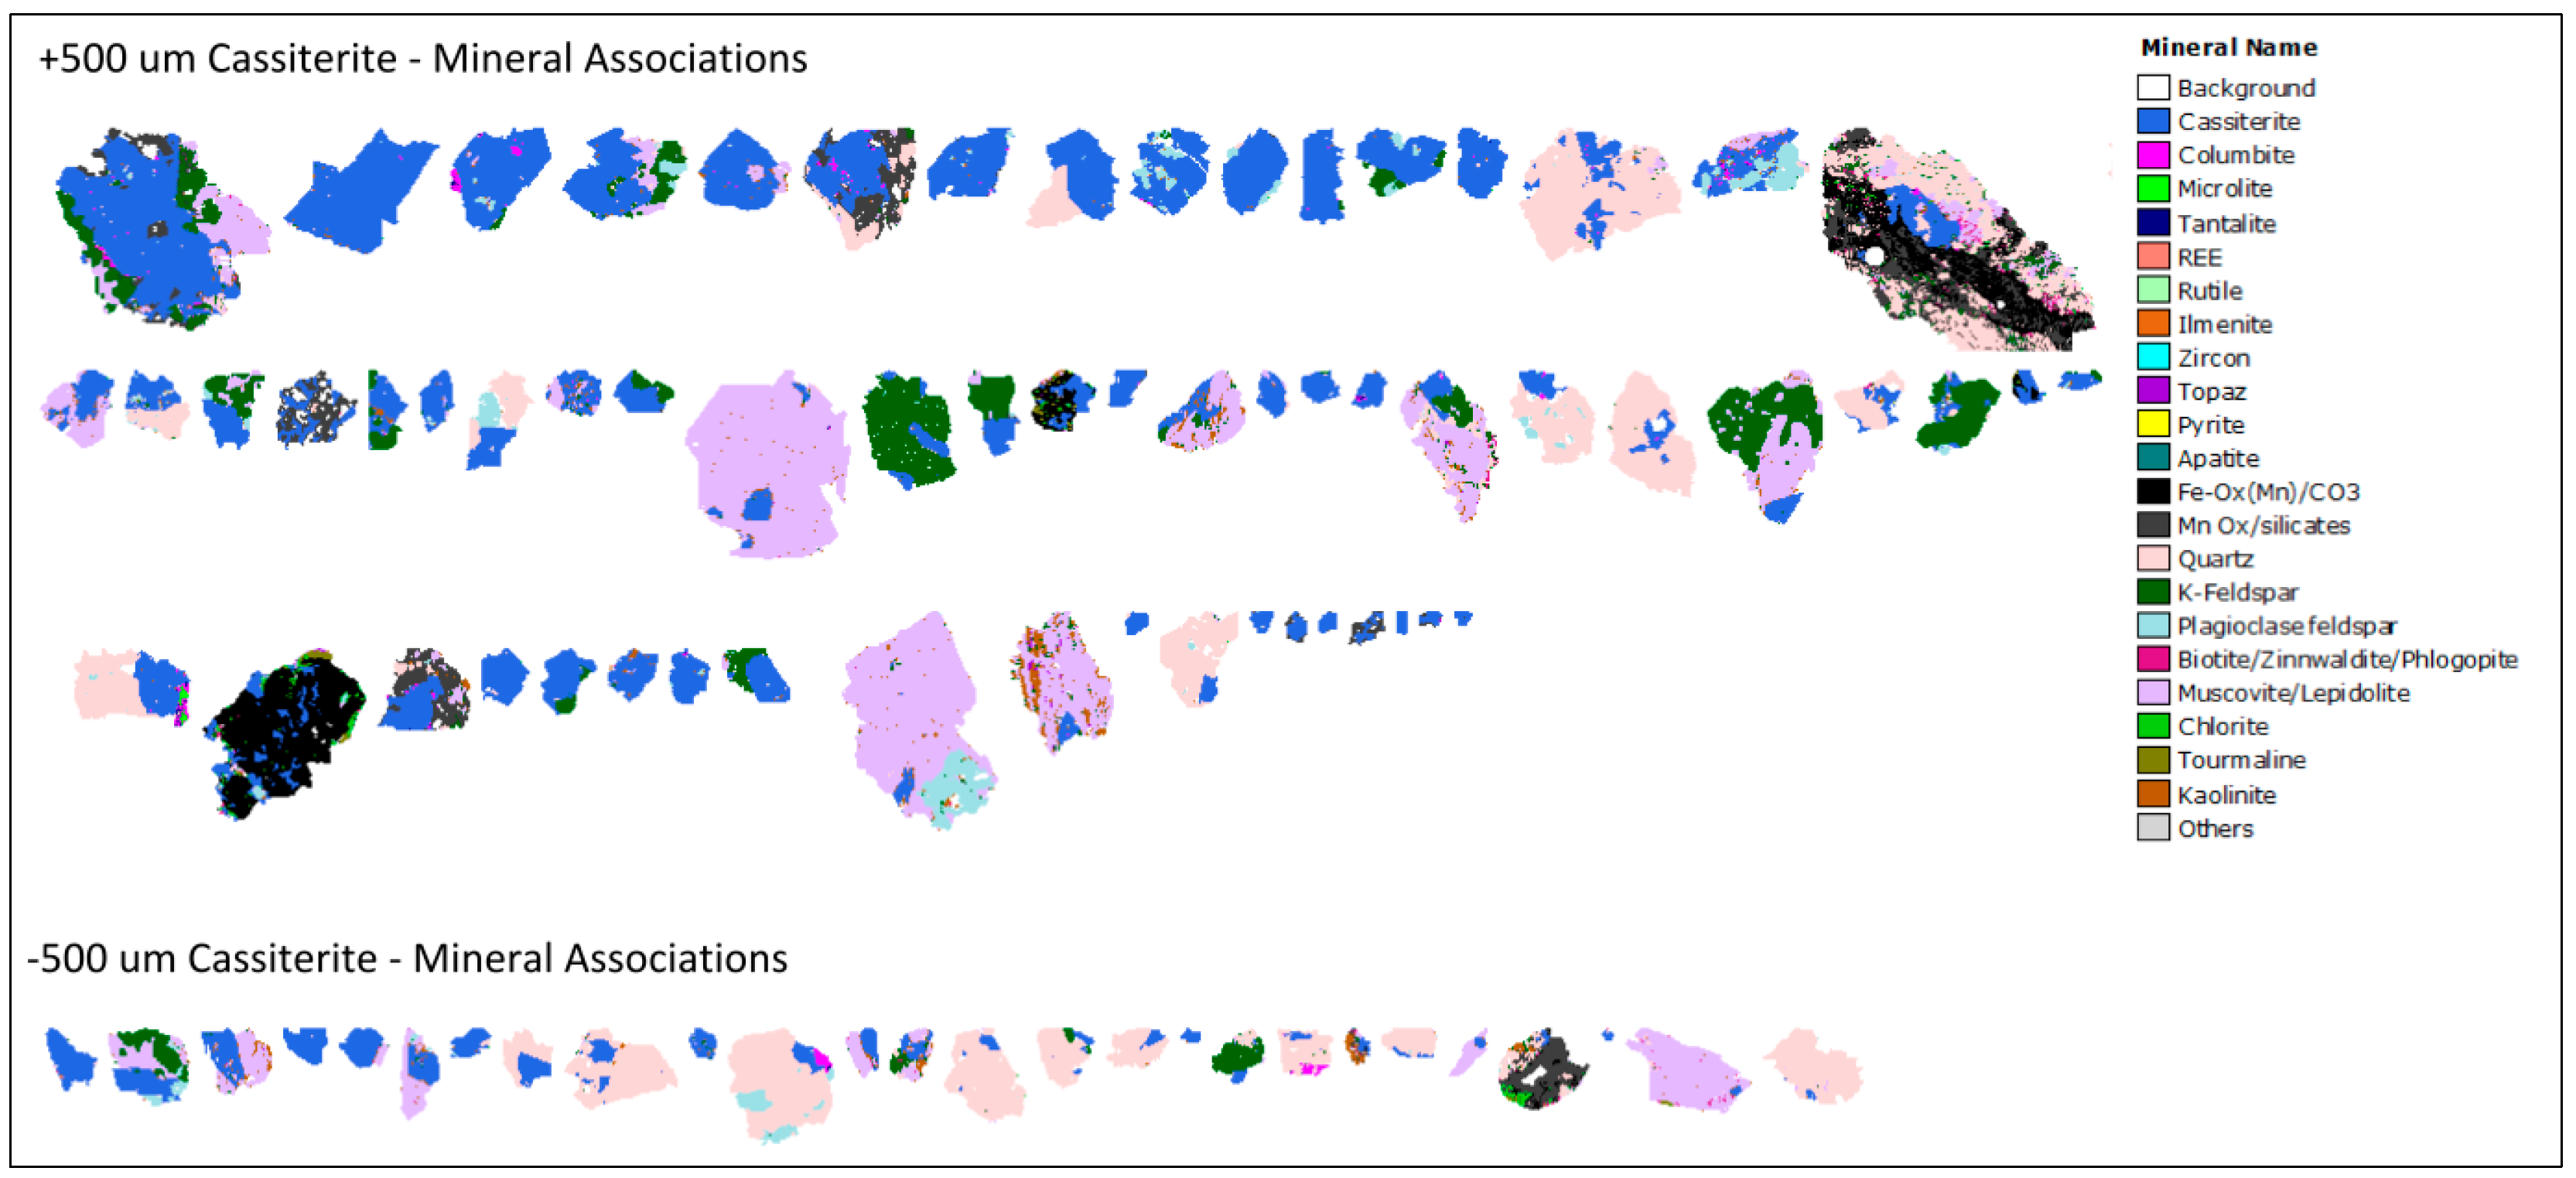
The concentrate product from the Mozley table test shows the same mineral associations as the HLS products, however almost twice as much cassiterite is liberated in the Mozley table products than in the HLS. In the tailings products, cassiterite is predominantly associated with K-feldspar (and kaolinite) and quartz. Figure 9 shows that cassiterite mineralisation is closely associated with quartz, muscovite and K-feldspar. There is also 6%–10% association with other metal oxides in the +500 μm fraction.
Quantification of the Chemistry of Tantalum Bearing Minerals
EPMA of the columbite-tantalite grains provided accurate quantification of the chemistry of the columbite-tantalite series. However, EPMA results are variable regarding both accuracy and reproducibility. In total, 141 points were analysed by spot analysis across 67 grains from one carbon coated polished block of the cleaner concentrate (CC) produced by Mozley table separation. Of those, 60 spot analyses fall within ±1.5% of the expected 100% element total and are summarised in Table 6. The grains are divided into the mineral types as defined in the QEMSCAN® mineral list. For the remaining 81 points, there is no clear reason for the low totals and, as a result, these points have been excluded from further analysis. Standard deviations show the variation on chemistry for each mineral. Low standard deviations for microlite indicate chemistry is consistent across microlite grains. Cassiterite also has consistent chemistry except for SnO2 and Ta2O5, where standard deviations indicate variable chemistry. This is most likely due to substitution of Ta for Sn within the cassiterite mineral structure. Columbite-tantalite show highly variable chemistry (particularly regarding Ta2O5 and Nb2O5 content), which is expected as these minerals are part of a solid solution series.
Columbite-Tantalite Grains
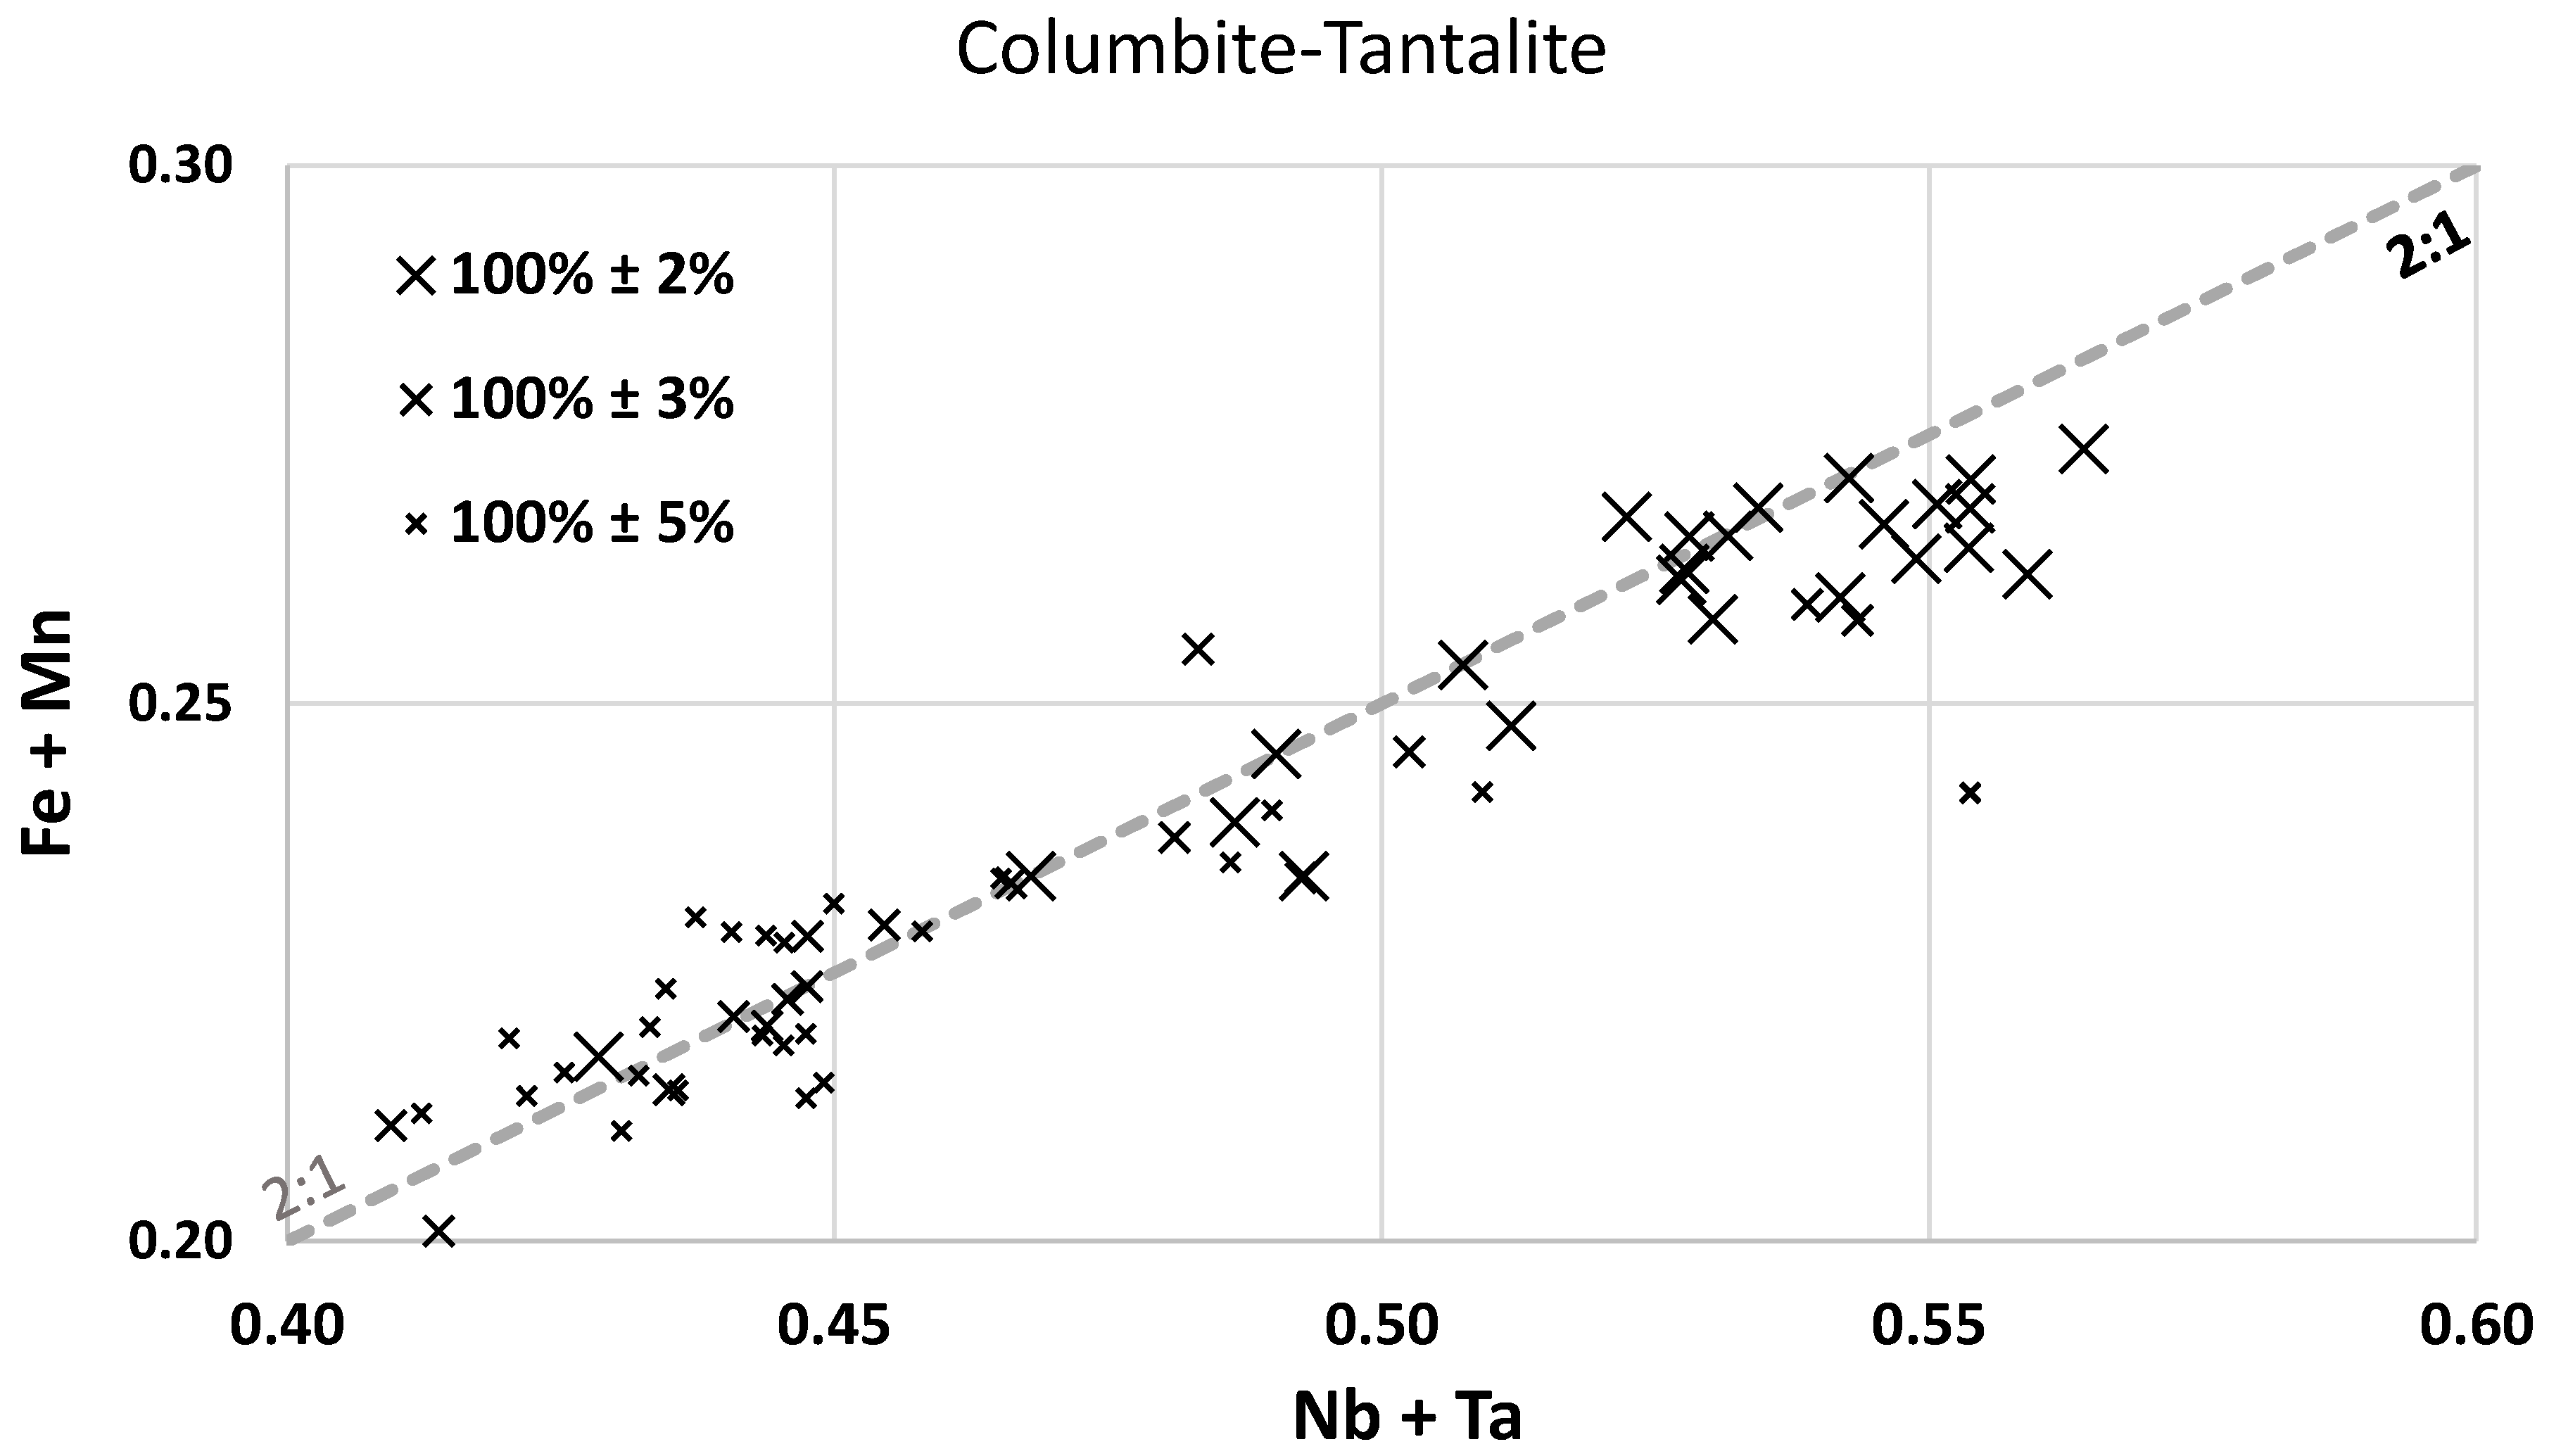
The Ta:Nb and Fe:Mn oxide ratios were calculated for 73 points identified as columbite or tantalite. Each point and plotted on a quadrilateral plot of mineral composition (Figure 10). The quadrilateral plot shows a bimodal distribution, that spans the full Mn-end of the columbite mineral series. Each analysed point was assigned a mineral name according to its Ta:Nb and Fe:Mn ratios. A Ta:Nb ratio >0.5 is classed as tantalite. An Fe:Mn ratio >0.5 is classed as Mn-rich, and assigned the prefix mangano- (as opposed to the Fe-rich end members, which are assigned the prefix ferro-). Of the 73 points analysed across 32 columbite-tantalite grains, 25 fell within ±2% of 100% range. Of these, 24 points were identified as mangano-columbite and 1 as mangano-tantalite. A further 14 points lay within ±3% and 70 of the 73 points lay within ±5% of 100%. The data show that the grains are manganese rich and cover a range from Nv-rich mangano-columbite and Ta-rich mangano-tantalite. Although the totals are relatively low for most of the points, they fit well with the expected stochiometric relationship for the columbite-tantalite series ((Fe,Mn)(Nb, Ta)2O6). A plot of the molar ratio of Fe + Mn to Nb + Ta shows that the points lie along the 2:1 line (Figure 11).
As Figure 9 shows, the columbite-tantalite grains are highly zoned, commonly with Nb-rich cores moving to Ta-rich rims. It must be noted that the point analysis was carried out across these zoned minerals with several analyses per grain. Thus, any bimodal distribution previously commented on is within the grains rather than between the grains. As shown in Figure 12, crystals often are zoned with the core rich in Nb and the rim rich in Ta. Columbite group grains also exhibit a convoluted zoning.
Microlite
Three points, analysed across one grain were identified as microlite. Microlite is a sub-group of minerals within the pyrochlore supergroup. The presence of F within the mineral grain suggests this is the fluorcalciomicrolite species of the microlite group.
Cassiterite Grains
Cassiterite was also found to contain some tantalum. Tantalum in cassiterite is due to inclusions of microcrystals of columbite group minerals and microlite and, probably, to substitutions of Sn by Nb and Ta. Thirty-nine point analyses across 27 grains were identified as cassiterite. SnO2 content within the cassiterite grains was variable from 91% to 100%. For grains that reported low SnO2 content the totals were still within the acceptable ±1.5% of 100% limit. Analysis of the data revealed that SnO2 was being substituted for by Ta2O5 (Figure 13). Ta2O5 within cassiterite was observed in two forms: as inclusions of Ta-bearing minerals (Figure 14) and as substitution within the cassiterite crystal structure.
3.3. Gravity Concentration Using Knelson
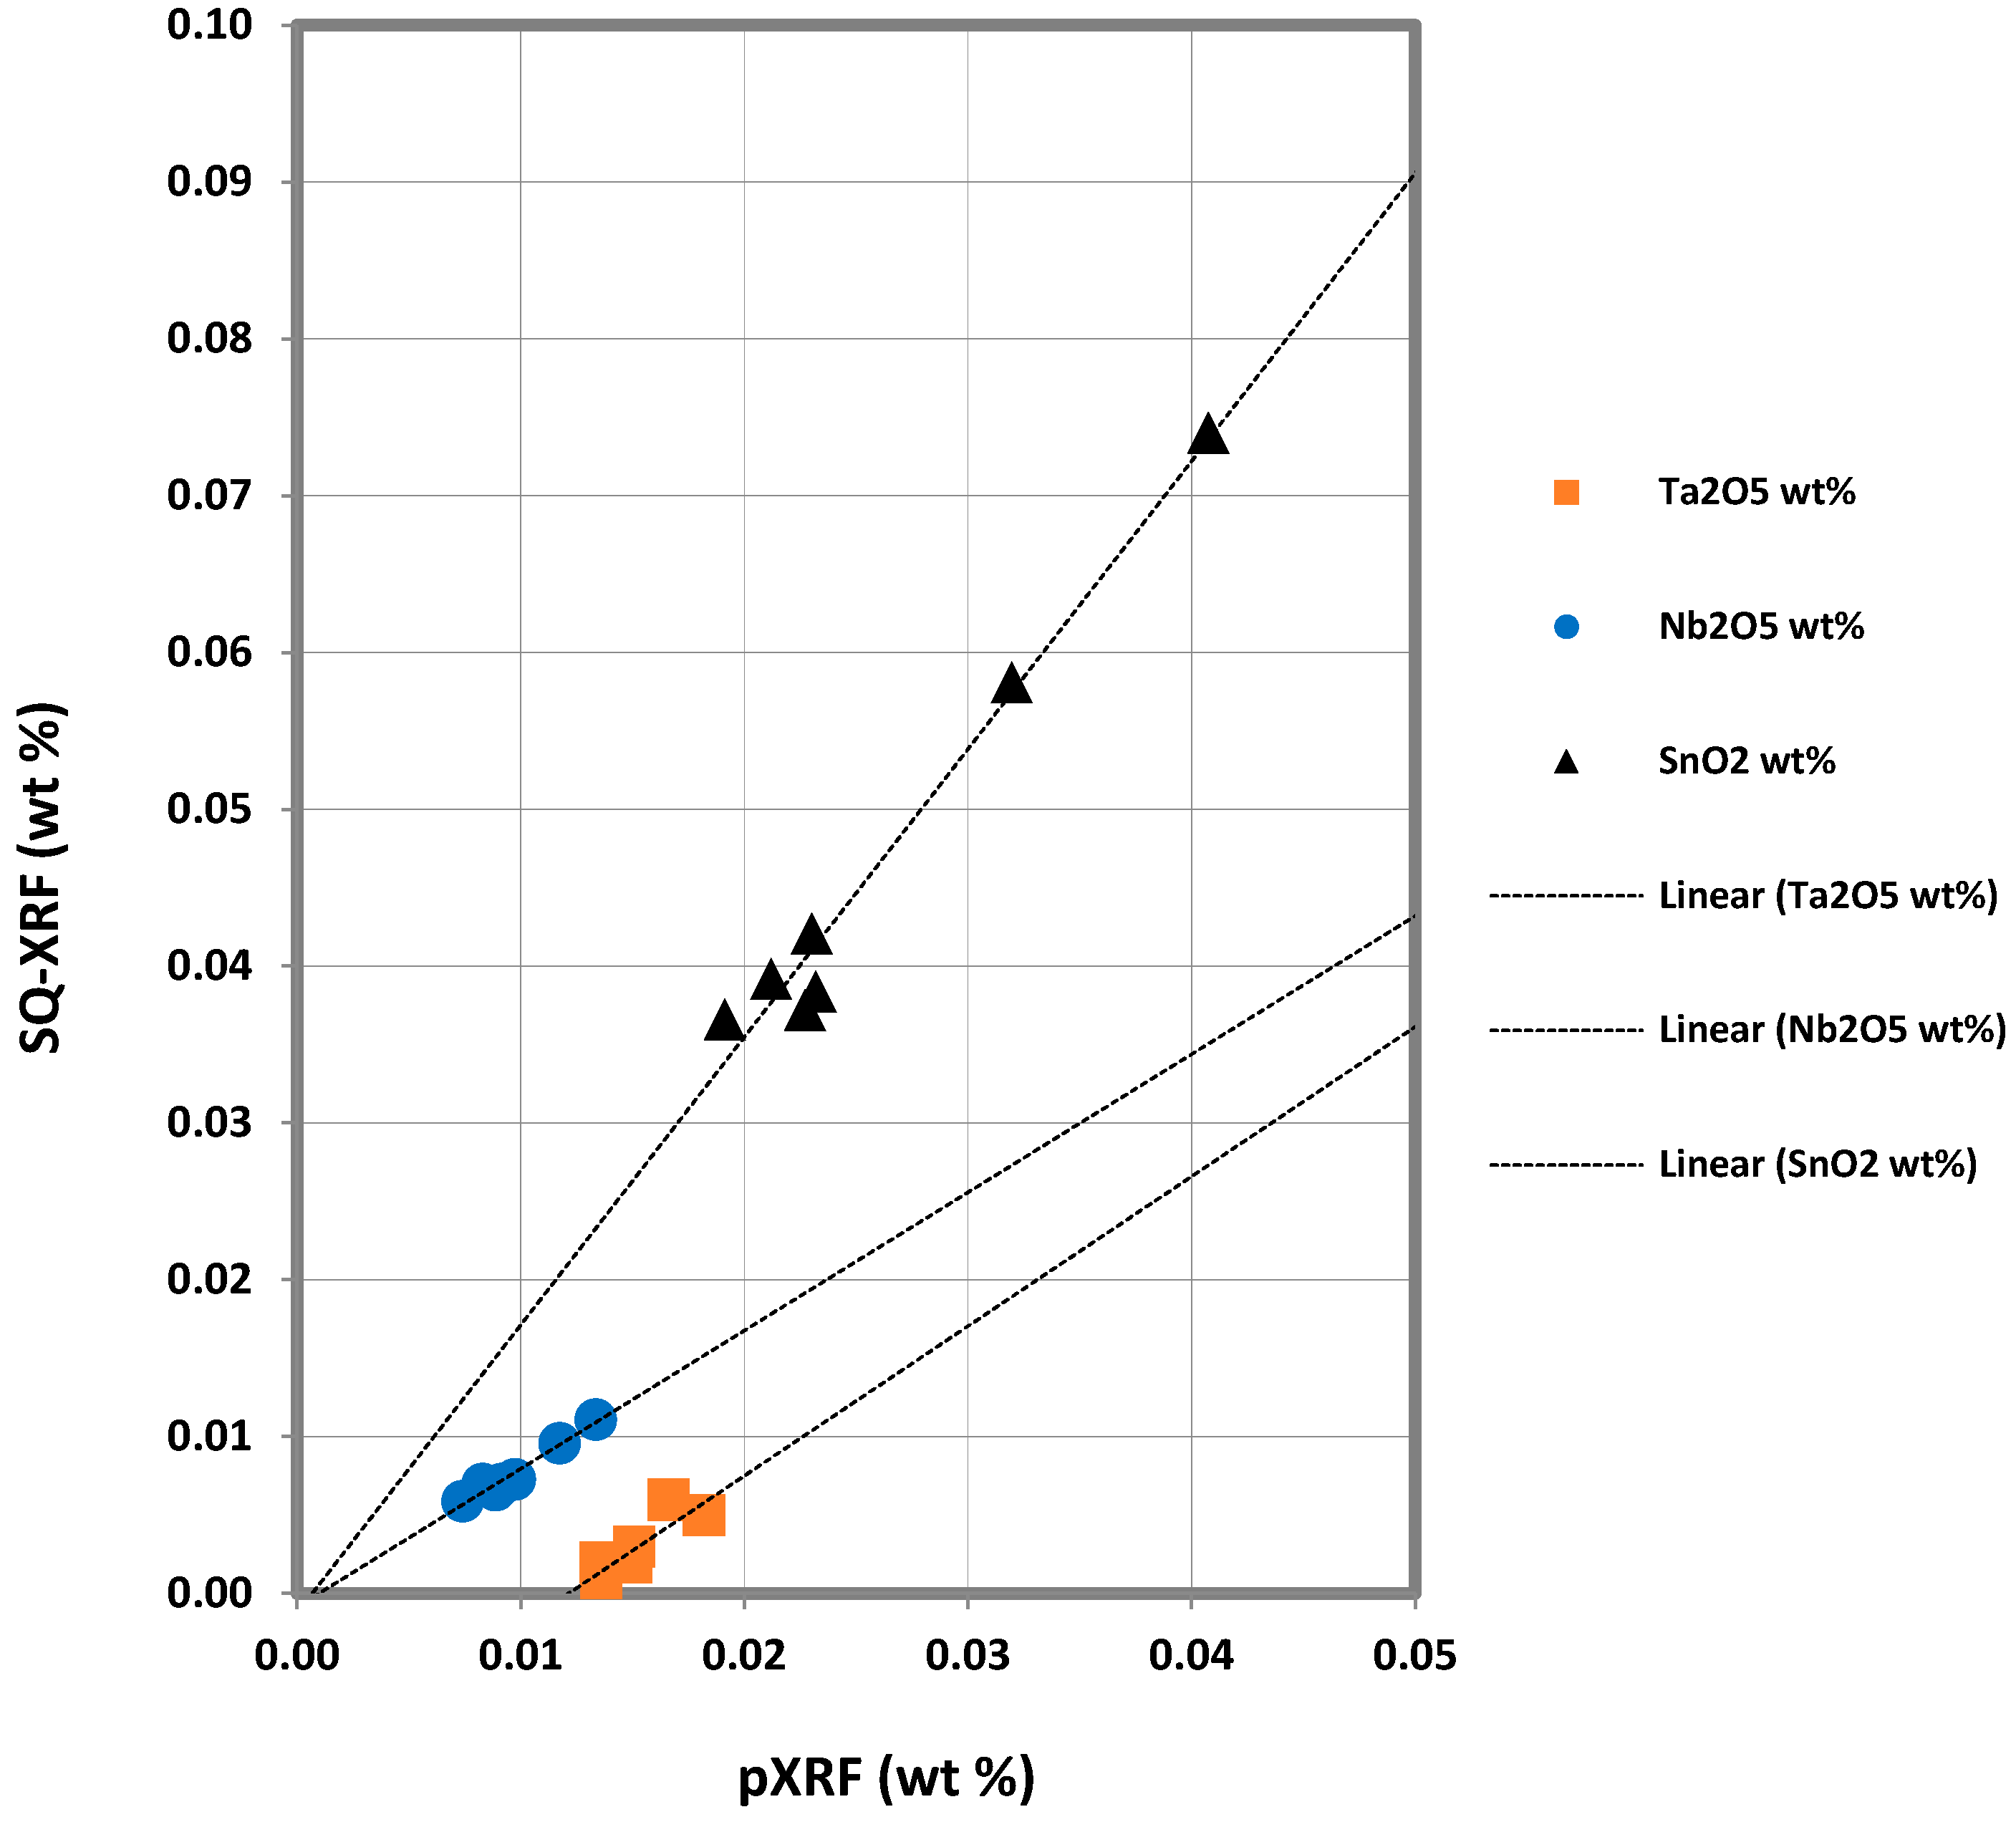
The Knelson Concentrator trial was carried out on the −625 μm size fraction, thereby eliminating the low grade coarser fraction. The products from the Knelson concentrator trial were split into two; half of the products were sent for WDS-XRF analysis of the whole product, the other half was screened into different size fractions and analysed by PXRF. To determine the accuracy of the PXRF, the pellets analysed by WDS-XRF for the whole samples, were analysed and the results compared. The PXRF results follow the same patterns of recovery as the WDS-XRF, however, for Ta, the recoveries are much lower, indicating that the PXRF is not measuring Ta content accurately. Previous comparisons of PXRF and SQ-XRF data indicates that the PXRF is overestimating the Ta content, which is believed to be the reason for the low recoveries. Figure 15 shows that there is positive correlation between the PXRF and SQ-XRF for Ta2O5, Nb2O5 and SnO2. However, the ratio between the PXRF results and the semi-quantitative results is different for each element. This remains true for the majority of elements. The PXRF consistently measured high for both Ta2O5 and Nb2O5 in comparison to the SQ-XRF. In particular, the Ta2O5 content was measured at over 100 ppm greater for all but the concentrate which measured low.
The semi-quantitative results for the whole samples show little variation in major element chemistry between the different tailings products and the feed. However the tailings are depleted in Ta2O5, Nb2O5 and SnO2 when compared to the feed material. These elements have been upgraded in the concentrate; Ta2O5 has upgraded from 55 ppm to 4320 ppm (a factor of 79), Nb2O5 has upgraded from 104 ppm to 4545 ppm (a factor of 44) and SnO2 has increased from 661 ppm to 2.9% (also a factor of 44). TiO2, Cr2O3, MnO, Fe2O3, ZnO, As2O3, Y2O3 and ThO2 have also upgraded in the concentrate.
The calculated recoveries for each stage based on the WDS XRF results are shown in Figure 16, with feed mass for each stage. For all target metals, recovery was best in the first minute of the trial, likely due to the build-up of the particle bed within the concentrator cone. For Ta, whilst recovery dropped by almost 20% it then stayed constant during the next six minutes. Recovery dropped off again after entering the final stage. Overall, 63.5% of Ta was recovered from the feed material. For Sn, recovery dropped by 10% over the first five minutes of the trial, before then increasing almost back to original recovery levels. Overall, Sn recovery was 40%. As with the other metals, Nb recovery dropped by 10% after the first minute. It then remained relatively constant (±3%) for the rest of the trial to give an overall recovery of 36.9%. Overall, for Ta and Nb, recovery decreased by 20% after the first minute, whilst, for Sn, recovery decreased by 10%. No mineralogical work was done on the products of this trial, however the chemistry of the products is dominated by SiO2, Al2O3 and K2O, indicating that there is still a large proportion of silicate minerals within the concentrate. The drop in recovery is believed to be due to the replacement of lower density quartz particles (containing unliberated columbite-tantalite and cassiterite) with higher density mica grains in the concentrate bed.
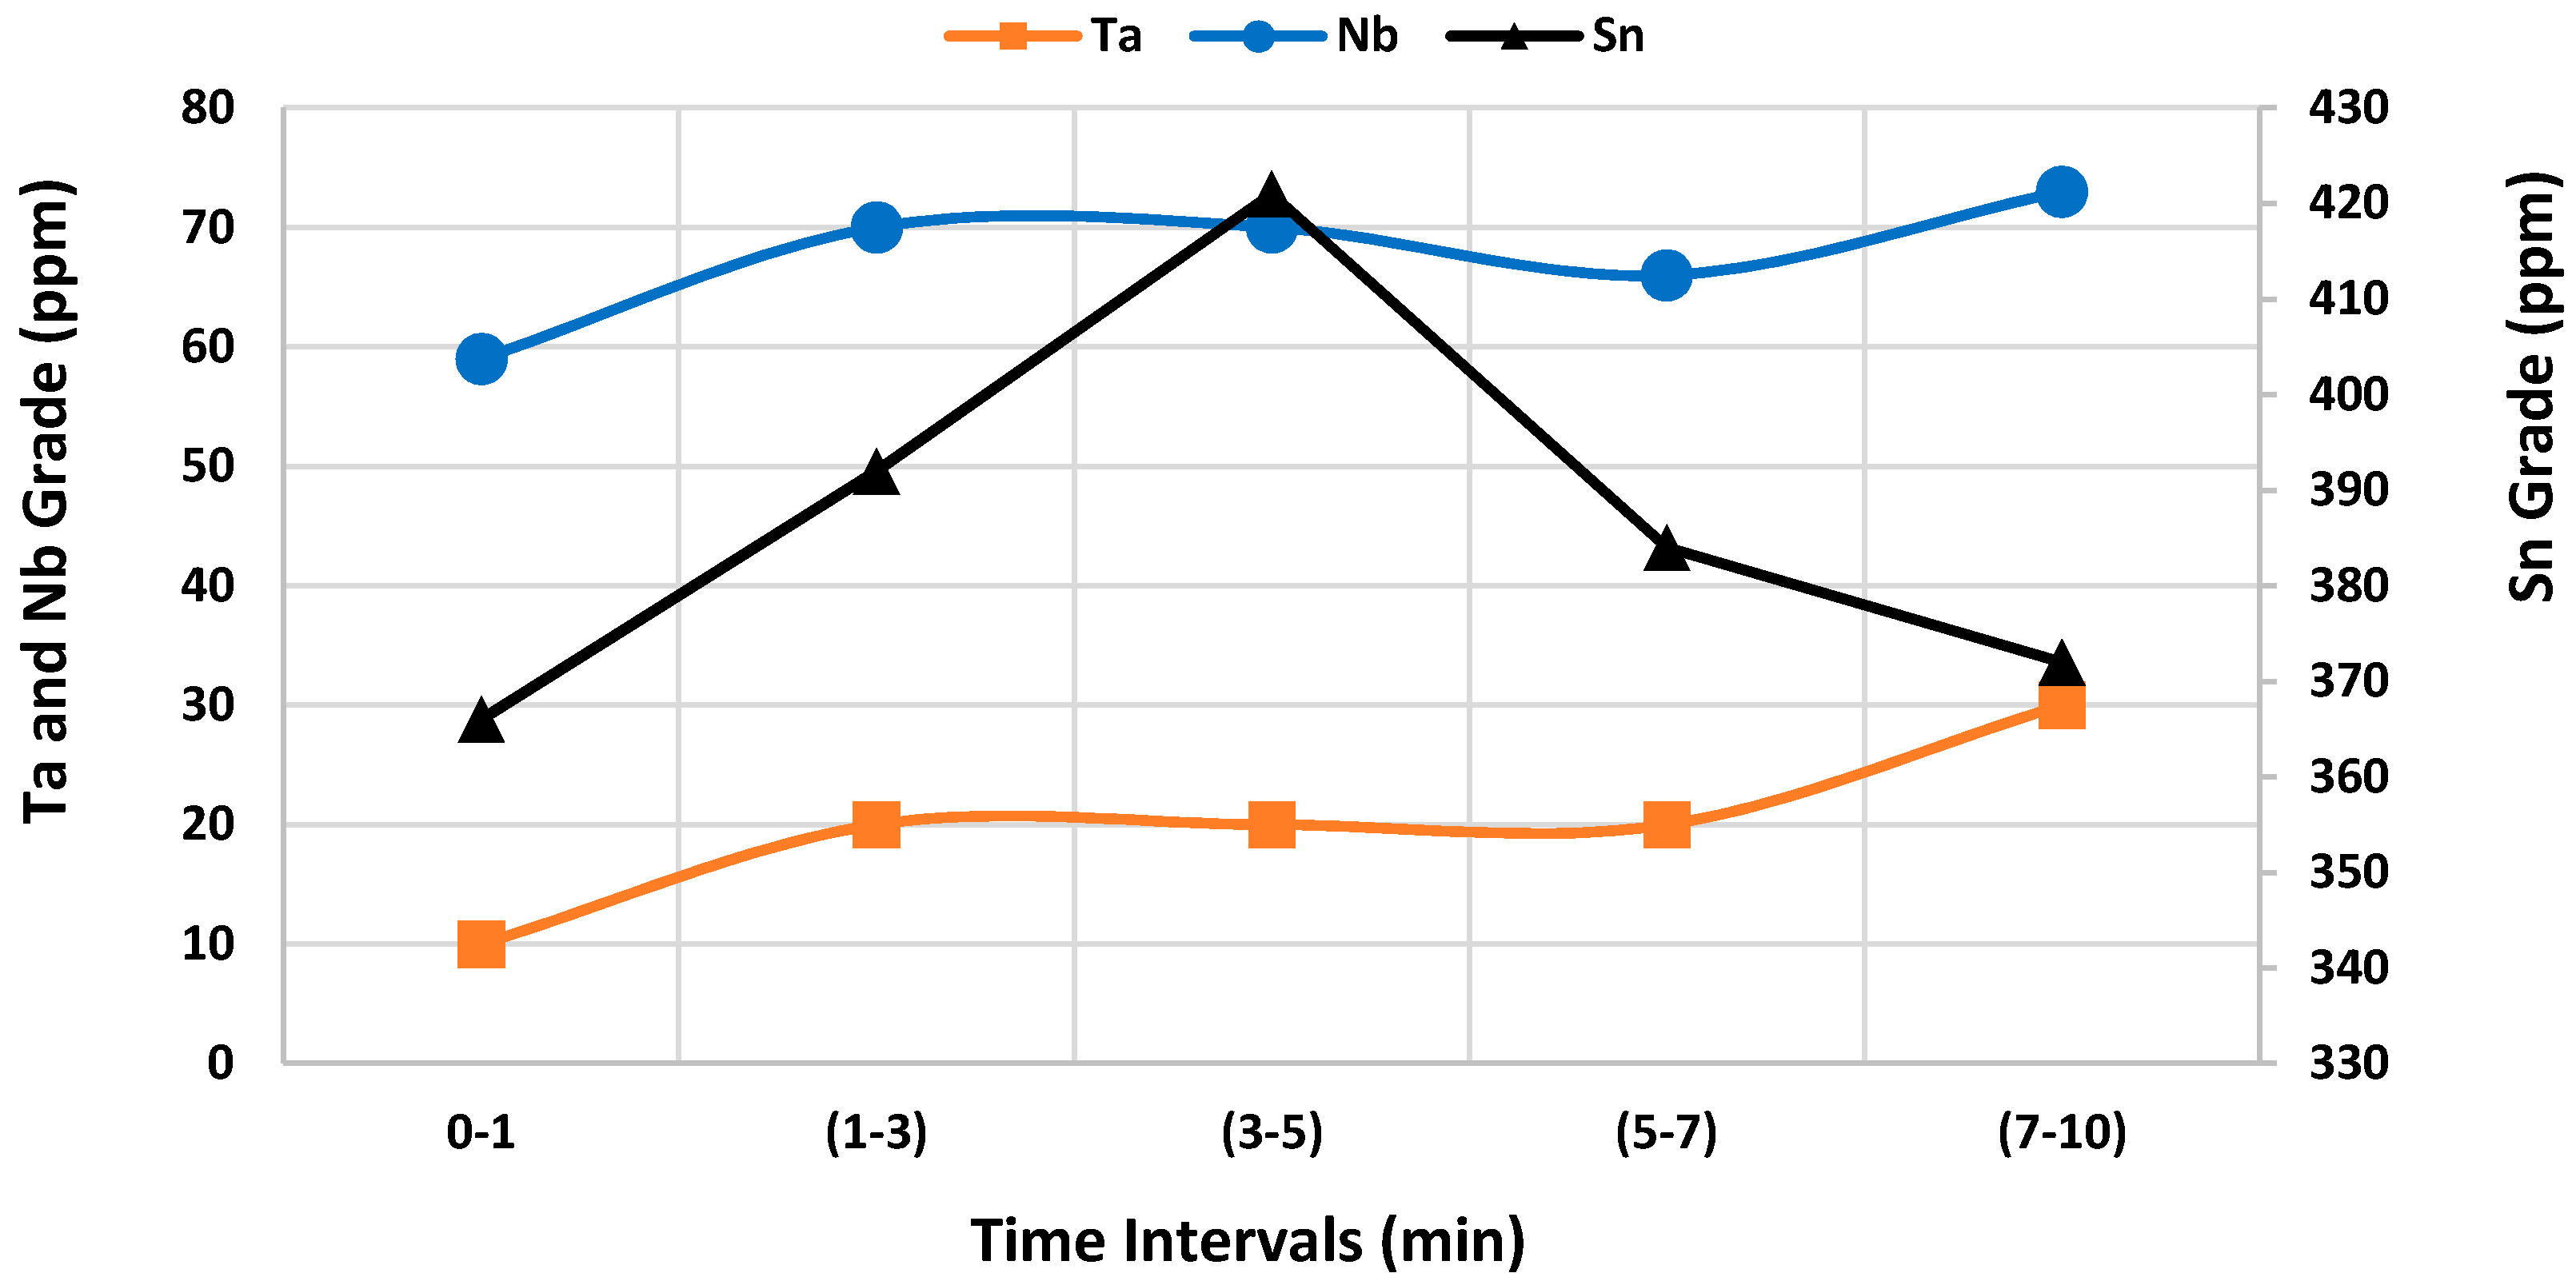
Figure 17 shows how the metal grade of the tailings changed over the course of the trial. Ta and Nb both increased as would be expected, given the drop in recovery. Ta grade increased from 10 ppm to 30 ppm, whilst Nb increased from 59 ppm to 73 ppm. Sn grade in the tailings products through time also matches the recovery pattern, with Sn grade increasing in the tails from 366 ppm to 421 ppm during the first half of the trial, before dropping back down to 372 ppm.
Figure 18 shows the average recovery of each particle size. For Ta, recovery significantly improved below −125 μm from <2% recovery in the +125 μm fraction to over 20% recovery in the (−90/+63) μm fraction. For Sn recovery significantly improved below −180 μm from <10% in the +180 μm fractions to over 40% in the (−90/+63) μm fraction. Of the +180 μm fractions the greatest recovery for Sn took place in the +500 μm material, averaging 8.8%. Nb recovery also significantly improved below −180 μm from <5% in the +180 μm fractions to over 40% in the (−90/+63) μm fraction. Size analysis of the recovery rate for each product shows that the Knelson concentrator is most efficient for recovery of −180 μm particles. This is likely a reflection of the physics of the machine and the change in liberation with particle size. For all three elements, greatest recovery was enjoyed by the (−90/+63) μm fraction size.
Comparison of recovery rates from this study to previous work by Montero-Ríos [18] reveals very similar recovery rates (Table 7).
The work carried out by [18] only tested material −100 μm in size. For the recovery to show no significant change, despite the change in particle size (material −625 μm was used in this study), is encouraging and indicates that centrifuge separation could potentially be used to treat a wider variety of grain sizes than just the fines, with no significant loss to recovery.
3.4. Gravity Concentration Using Shaking Table
Figure 19 and Figure 20 summarise the recovery of elements of interest across the rougher and cleaner table separations.
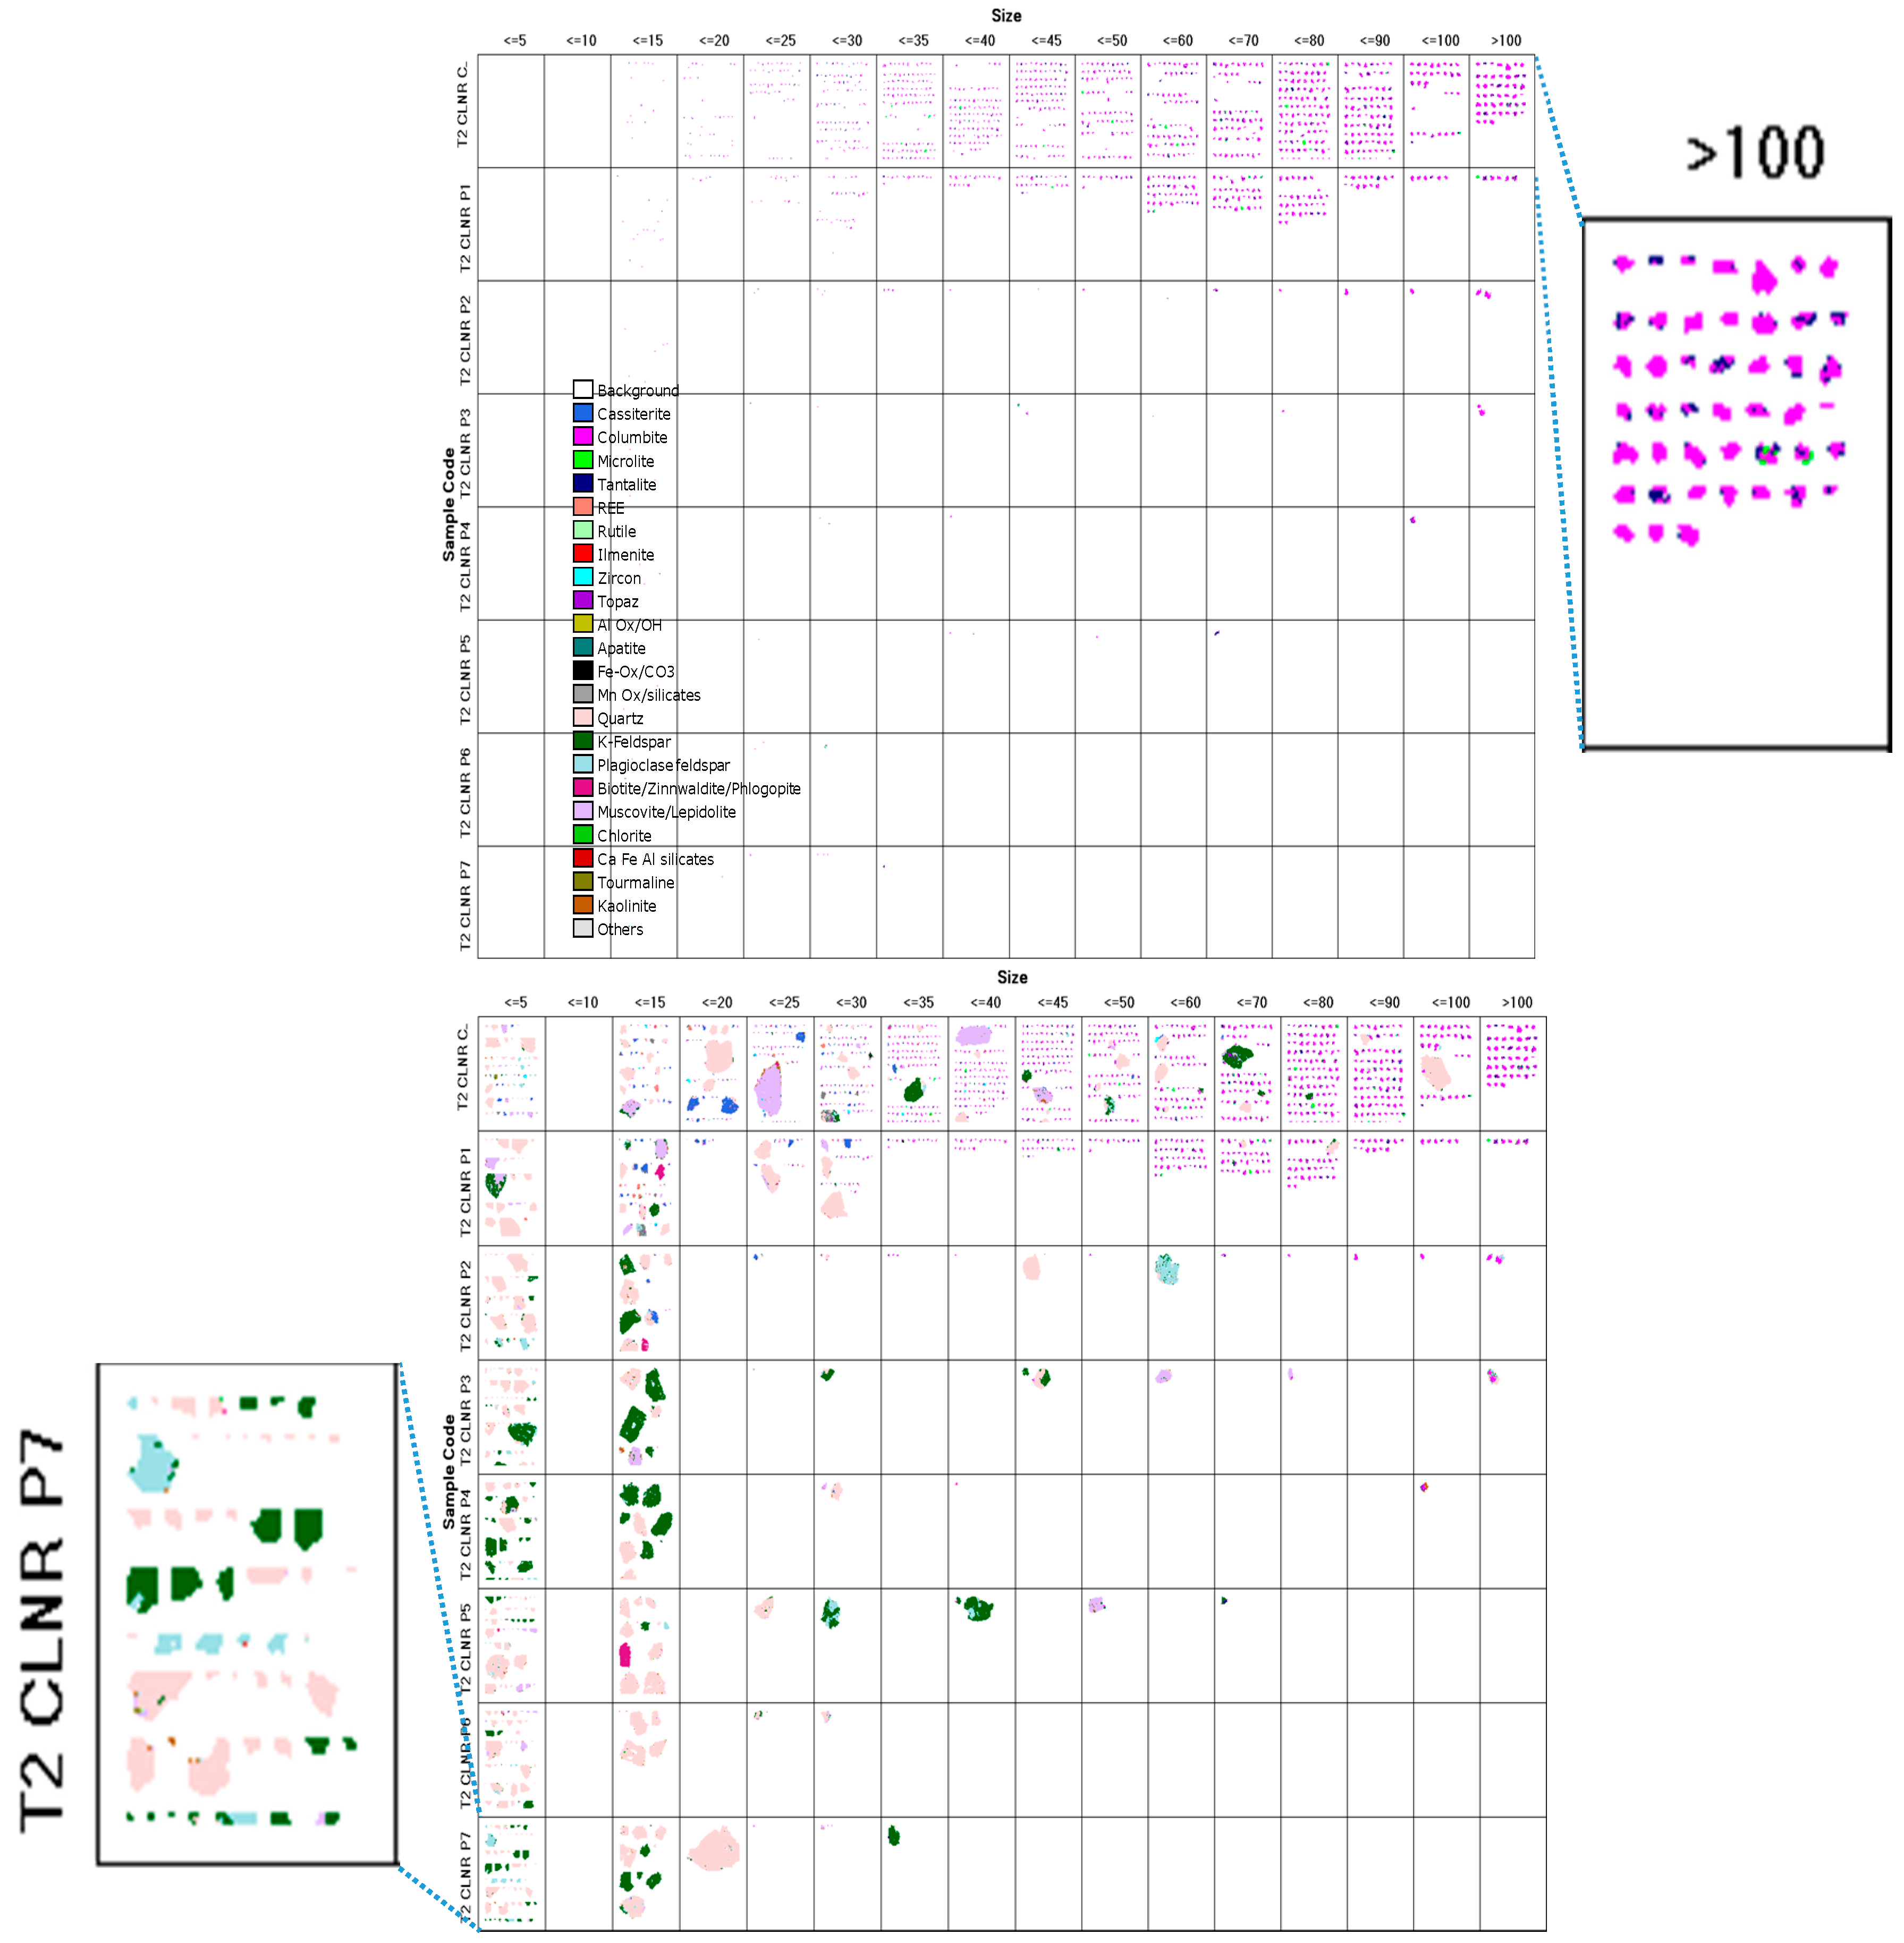
In both rougher and cleaner table concentration, there is a similar trend for Nb and Sn which are recovered preferentially to Ta. This is perhaps unexpected as the density of tantalite is greater than columbite and there is close association of the two minerals. The most likely explanation is that the result is due to a combination of particle size and liberation. The particle size of the columbite and cassiterite (30 to 80 µm) is larger than the Microlite and Tantalite (20 to 40 µm), so this will affect how it behaves on the gravity table. Figure 21 shows the theoretical grade recovery curves for columbite and tantalite recovered to the first two products which give an indication of liberation. The curves are generated by combining the mass and grade of individual particles in descending order of grade. The figures show that the grade of Ta is consistently lower than columbite for a given recovery. This suggests greater locking which is further illustrated in image grids of the QEMSCAN particles, as shown in Figure 22.
4. Conclusions
Mangano-tantalite and mangano-columbite were the main tantalum hosting phases in the feed material. These minerals occur in solid solution together. Minor tantalum was present in the pyrochlore group mineral microlite. The tailings material contains 200–500 ppm Sn in cassiterite. The cassiterite averages 50–150 μm in size and is well liberated in the +500 μm size fraction.
Mineralogy is dominated by silicate phases, particularly quartz and muscovite, which average 20–225 μm in size across the samples analysed. All ore minerals are most abundant in the −125 μm size fraction (73% Ta, 44% Sn and 38% Nb), which accounts for 9% of the feed material. Less than 30% of the ore mineralogy is well liberated, although liberation increases as grain size decreases. Ore minerals are closely associated with quartz and muscovite.
The mineralogical characterization of tantalum ore is necessary to determine the grade that could be obtained during the ore processing. Nb and Ta occur as a solid solutions in different oxide minerals. In some cases, as in the Penouta leucogranite, the Nb-rich and the Ta-rich zones of the mineral particle could be separated with a conventional degree of milling, obtaining a high degree of T2O5 content in the concentrate. In other cases, these metals are completely mixed or distributed in very narrow zones, preventing separation by physical methods. The high radioactive content (elements) in the ore from the alluvial Bolivian deposits require treatment to reduce them before being placed on the market.
Separation trials indicate that gravity processing is an effective means of upgrading the Penouta tin mining tailings. Recoveries were greatest at fine sizes, which is expected due to the greater concentration and liberation of the minerals of interest in these fractions. It can be expected that courser liberated material has been artificially depleted as the material is tailings from historic tin processing. There were encouraging results using conventional gravity separation techniques and centrifugal concentration over a wide size range.
Acknowledgments
This work is part of the OptimOre project. This project has received funding from the European Union’s Horizon 2020 research and innovation programme under grant agreement No. 642201. Authors are thankful from the Strategic Minerals enterprise for their help in sampling, visit and information provided.
Author Contributions
Yousef Ghorbani (preparing paper, analyzing data, help in the experimental design and performance), Rob Fitzpatrick (help in preparing the paper, analyzing & obtaining data, help in the experimental design and performance), Melanie Kinchington (this paper was based on her master’s thesis), Gavyn Rollinson (mineral characterization, analyzing results and checking drafts of the paper) and Patrick Hegarty (help in experimental design and performance).
Conflicts of Interest
Authors declare no conflicts of interest.
References
- Crockett, R.N.; Sutphin, D.M. International Strategic Minerals Inventory Summary Report—Niobium (Columbium) and Tantalum; USGS Survey Circular 930M; U. S. Geological Survey: Reston, VA, USA, 1993.
- European Union (EU). Report on Critical Raw Materials for the EU, 2014. Available online: http://www.catalysiscluster.eu/wp/wp-content/uploads/2015/05/2014_Critical-raw-materials-for-the-EU-2014.pdf (accessed on 30 August 2016).
- Mackay, D.A.; Simandl, G.J. Geology, market and supply chain of niobium and tantalum—A review. Miner. Deposita 2014, 49, 1025–1047. [Google Scholar] [CrossRef]
- Shaw, R.A.; Goodenough, K.M. Mineral Profile: Niobium-Tantalum, 2011. Available online: http://www.bgs.ac.uk/mineralsUK/statistics/mineralProfiles.html (accessed on 19 May 2015).
- The United States Geological Survey (USGS). Mineral Commodity Summary: Tantalum, 2017. Available online: https://minerals.usgs.gov/minerals/pubs/commodity/niobium/mcs-2017-tanta.pdf (accessed on 1 April 2017).
- Linnen, R.; Trueman, D.L.; Burt, R. Tantalum and Niobium. In Critical Metals Handbook; Gunn, G., Ed.; John Wiley and Sons: Chichester, UK, 2014. [Google Scholar]
- Pekov, I.V. Lovozero Massif: History, Pegmatites, Minerals; Ocean Pictures Ltd.: Moscow, Russia, 2000; p. 480. ISBN 978-5900395272. [Google Scholar]
- Boyd, R. The EU potential critical minerals resource. In Proceedings of the Critical Minerals for the Clean Energy and High Technology Industries 2012 and Beyond—The EU Perspective, Copenhagen, Denmark, 21 May 2012. [Google Scholar]
- Canosa, F.; Martín-Izard, A.; Fuertes-Fuente, M. Evolved granitic system as a source of rare-element deposits: The Ponte Segade case (Galicia, NW Spain). Lithos 2012, 153, 165–176. [Google Scholar] [CrossRef]
- Llorens, T.; Moro, M.C. Microlite and tantalite in the LCT granitic pegmatites of La Canalita, Navasfrías Sn-W District, Salamanca, Spain. Can. Miner. 2010, 48, 549–564. [Google Scholar] [CrossRef]
- Llorens González, T.; García Polonio, F.G.; López Moro, F.J.; Fernández, A.F.; Sanz Contreras, J.L.; Moro Benito, M.C. Tin-tantalum-niobium mineralization in the Penouta deposit (NW Spain): Textural features and mineral chemistry to unravel the genesis and evolution of cassiterite and columbite group minerals in a peraluminous system. Ore Geol. Rev. 2017, 81, 79–95. [Google Scholar] [CrossRef]
- Llorens, T.; Moro, M.C. Oxide minerals in the granitic cupola of the Jálama Batholith, Salamanca, Spain. Part II: Sn, W and Ti minerals in intra-granitic quartz veins. J. Geosci. 2012, 57, 155–171. [Google Scholar] [CrossRef]
- Adaro. Estudio de Viabilidad Tecnico-Economica del Centro Minero Penouta; Report of the Empresa Nacional Adaro de Investigaciones Mineras S.A.; Empresa Nacional Adaro de Investigaciones Mineras S.A.: Madrid, Spain, 1979; p. 45. [Google Scholar]
- Adaro. Proyecto de Investigación de la Mina de Penouta. Cálculo de reservas para leyes de corte de 800 y 600 g/t. Inf. Interno Madr. 1982, 69. unpublished. (In Spain) [Google Scholar]
- Adaro. Investigación Minera del Yacimiento de Penouta. Inf. Interno Madr. 1985, 9. unpublished. (In Spain) [Google Scholar]
- Rollinson, G.K.; Stickland, R.J.; Andersen, J.C.; Fairhurst, R.; Boni, M. Characterisation of Supergene Non-Sulphide Zinc Deposits using QEMSCAN®. Miner. Eng. 2011, 24, 778–787. [Google Scholar] [CrossRef]
- Laplante, A.R. A Standardized Test to Determine Gravity Recoverable Gold, 2000. Available online: http://knelsongravity.xplorex.com/page449.htm (accessed on 2 September 2015).
- Montero-Ríos, B.M. Proyecto de Viabilidad de una Planta de Tratamiento Para Mineral de Estaño y Tántalo, 2012. Final Year Project for Master Program, School of Mining Engineers, Polytechnic University of Madrid, Madrid, Spain. Available online: http://oa.upm.es/15454/1/PFC_Borja_Maortua_Montero_Rios.pdf (accessed on 16 February 2015).
Figure 1.
Experimental procedure and mass flow rates for audit testing using Penouta material.

Figure 2.
Size vs. grade for HLS concentration.

Figure 3.
Photographs of sink and float products side by side for comparison, across all size fractions. All photos were taken under 6× magnification.
Figure 3.
Photographs of sink and float products side by side for comparison, across all size fractions. All photos were taken under 6× magnification.
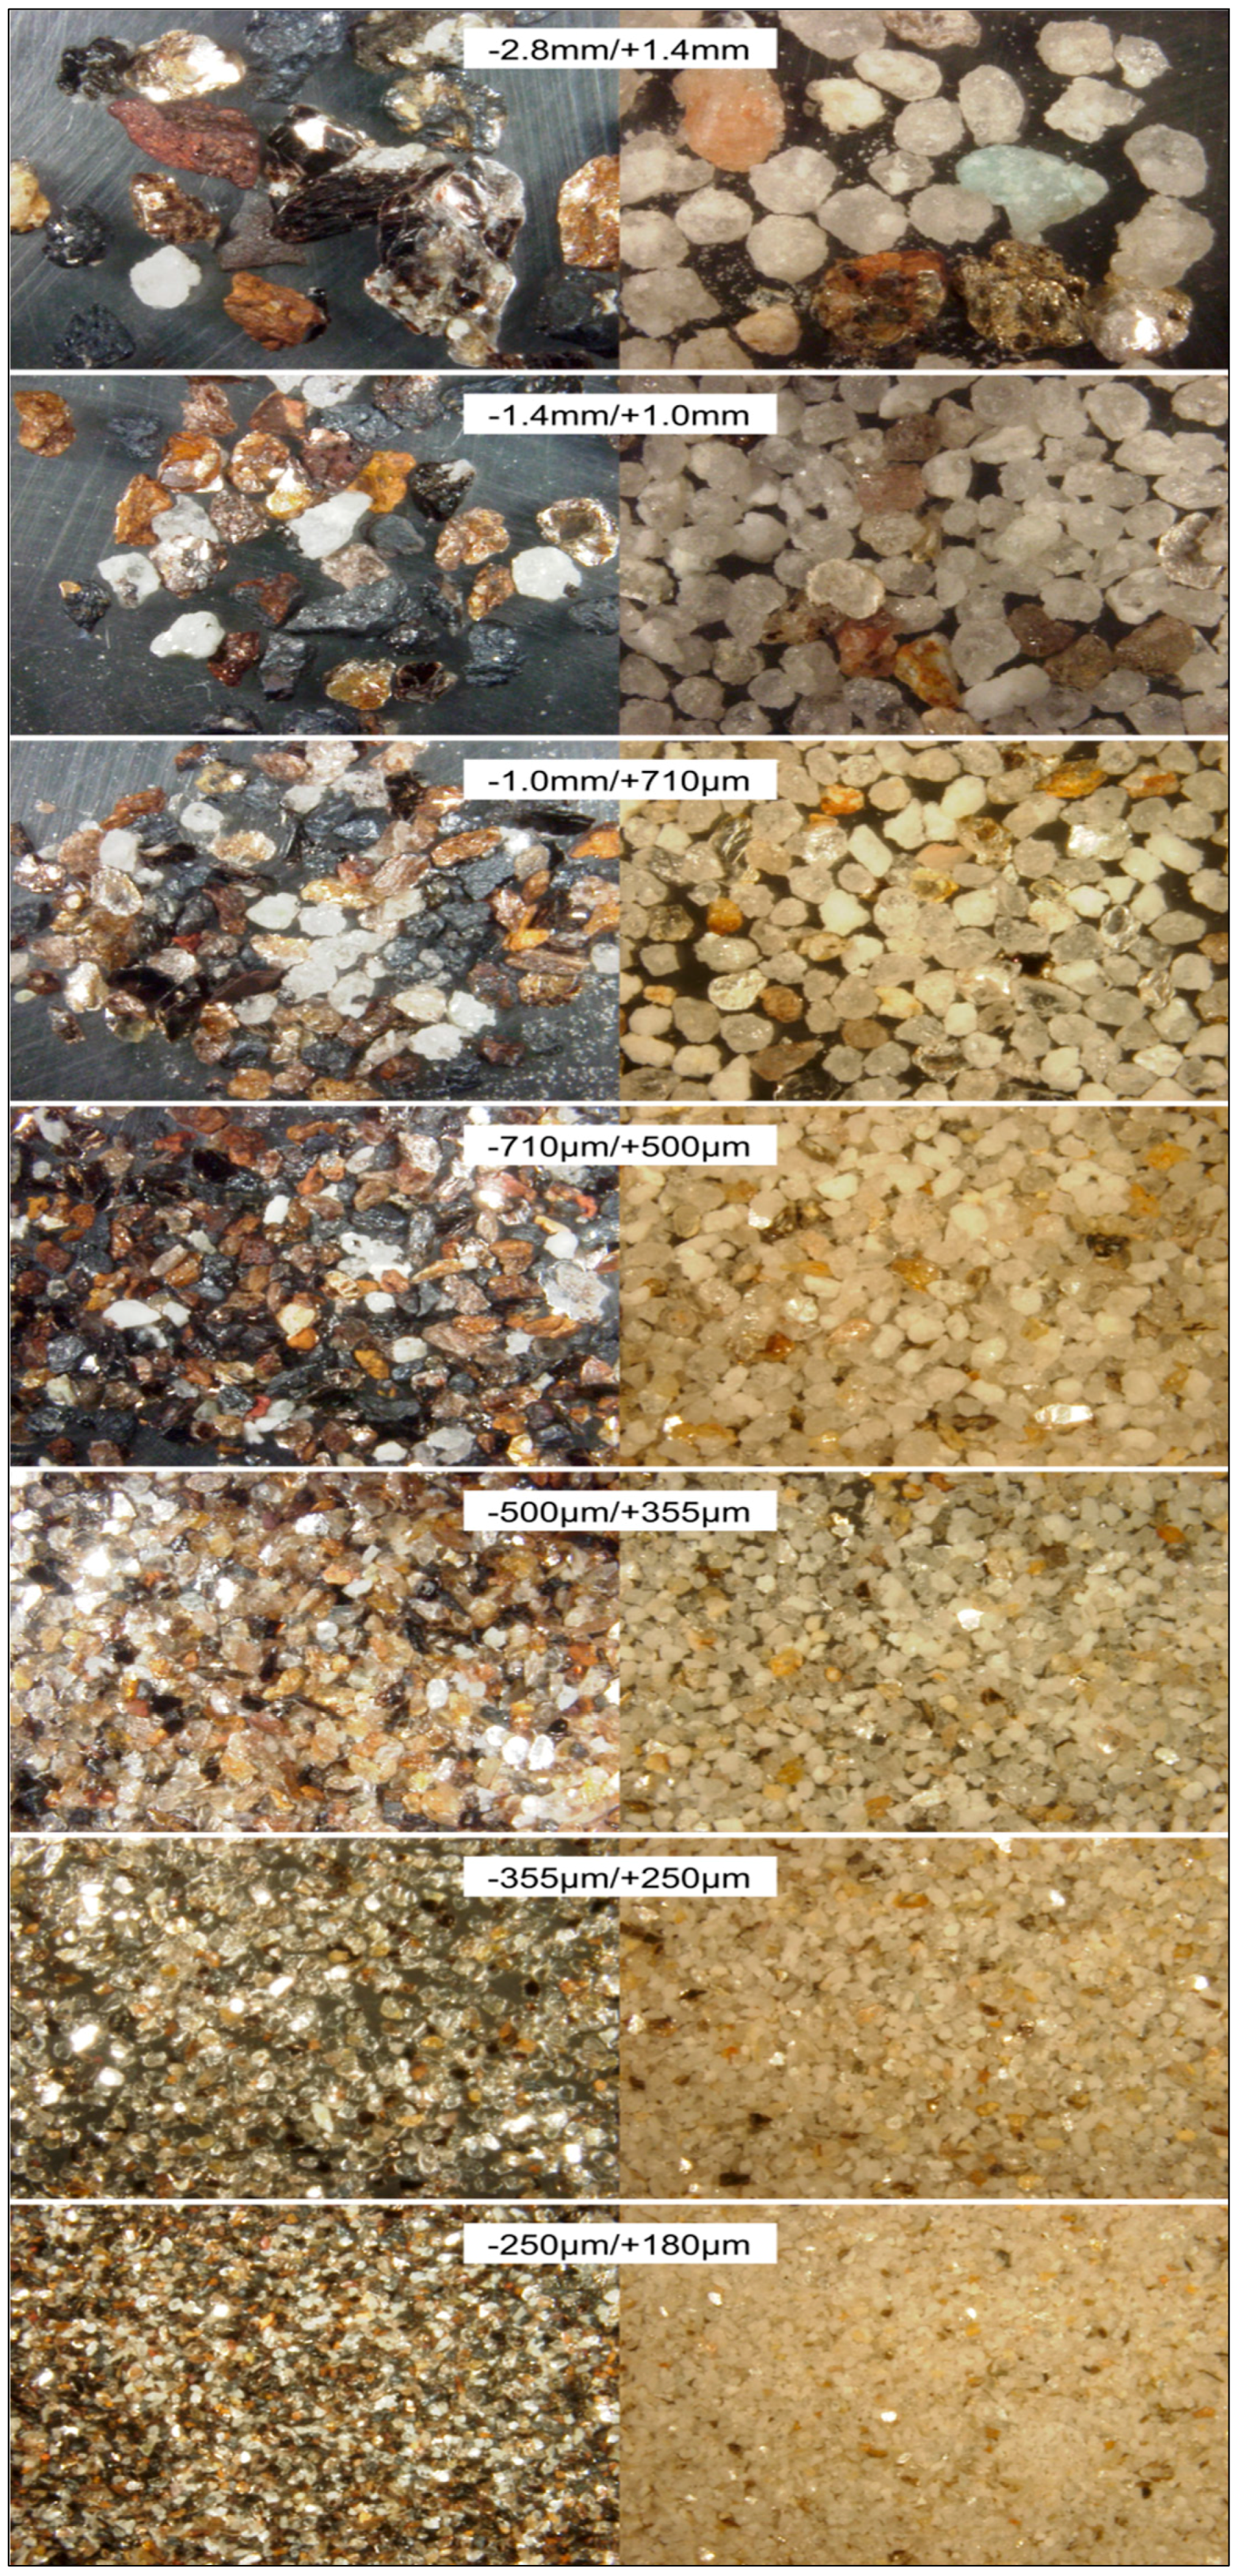
Figure 4.
Muscovite liberation in different size fraction.
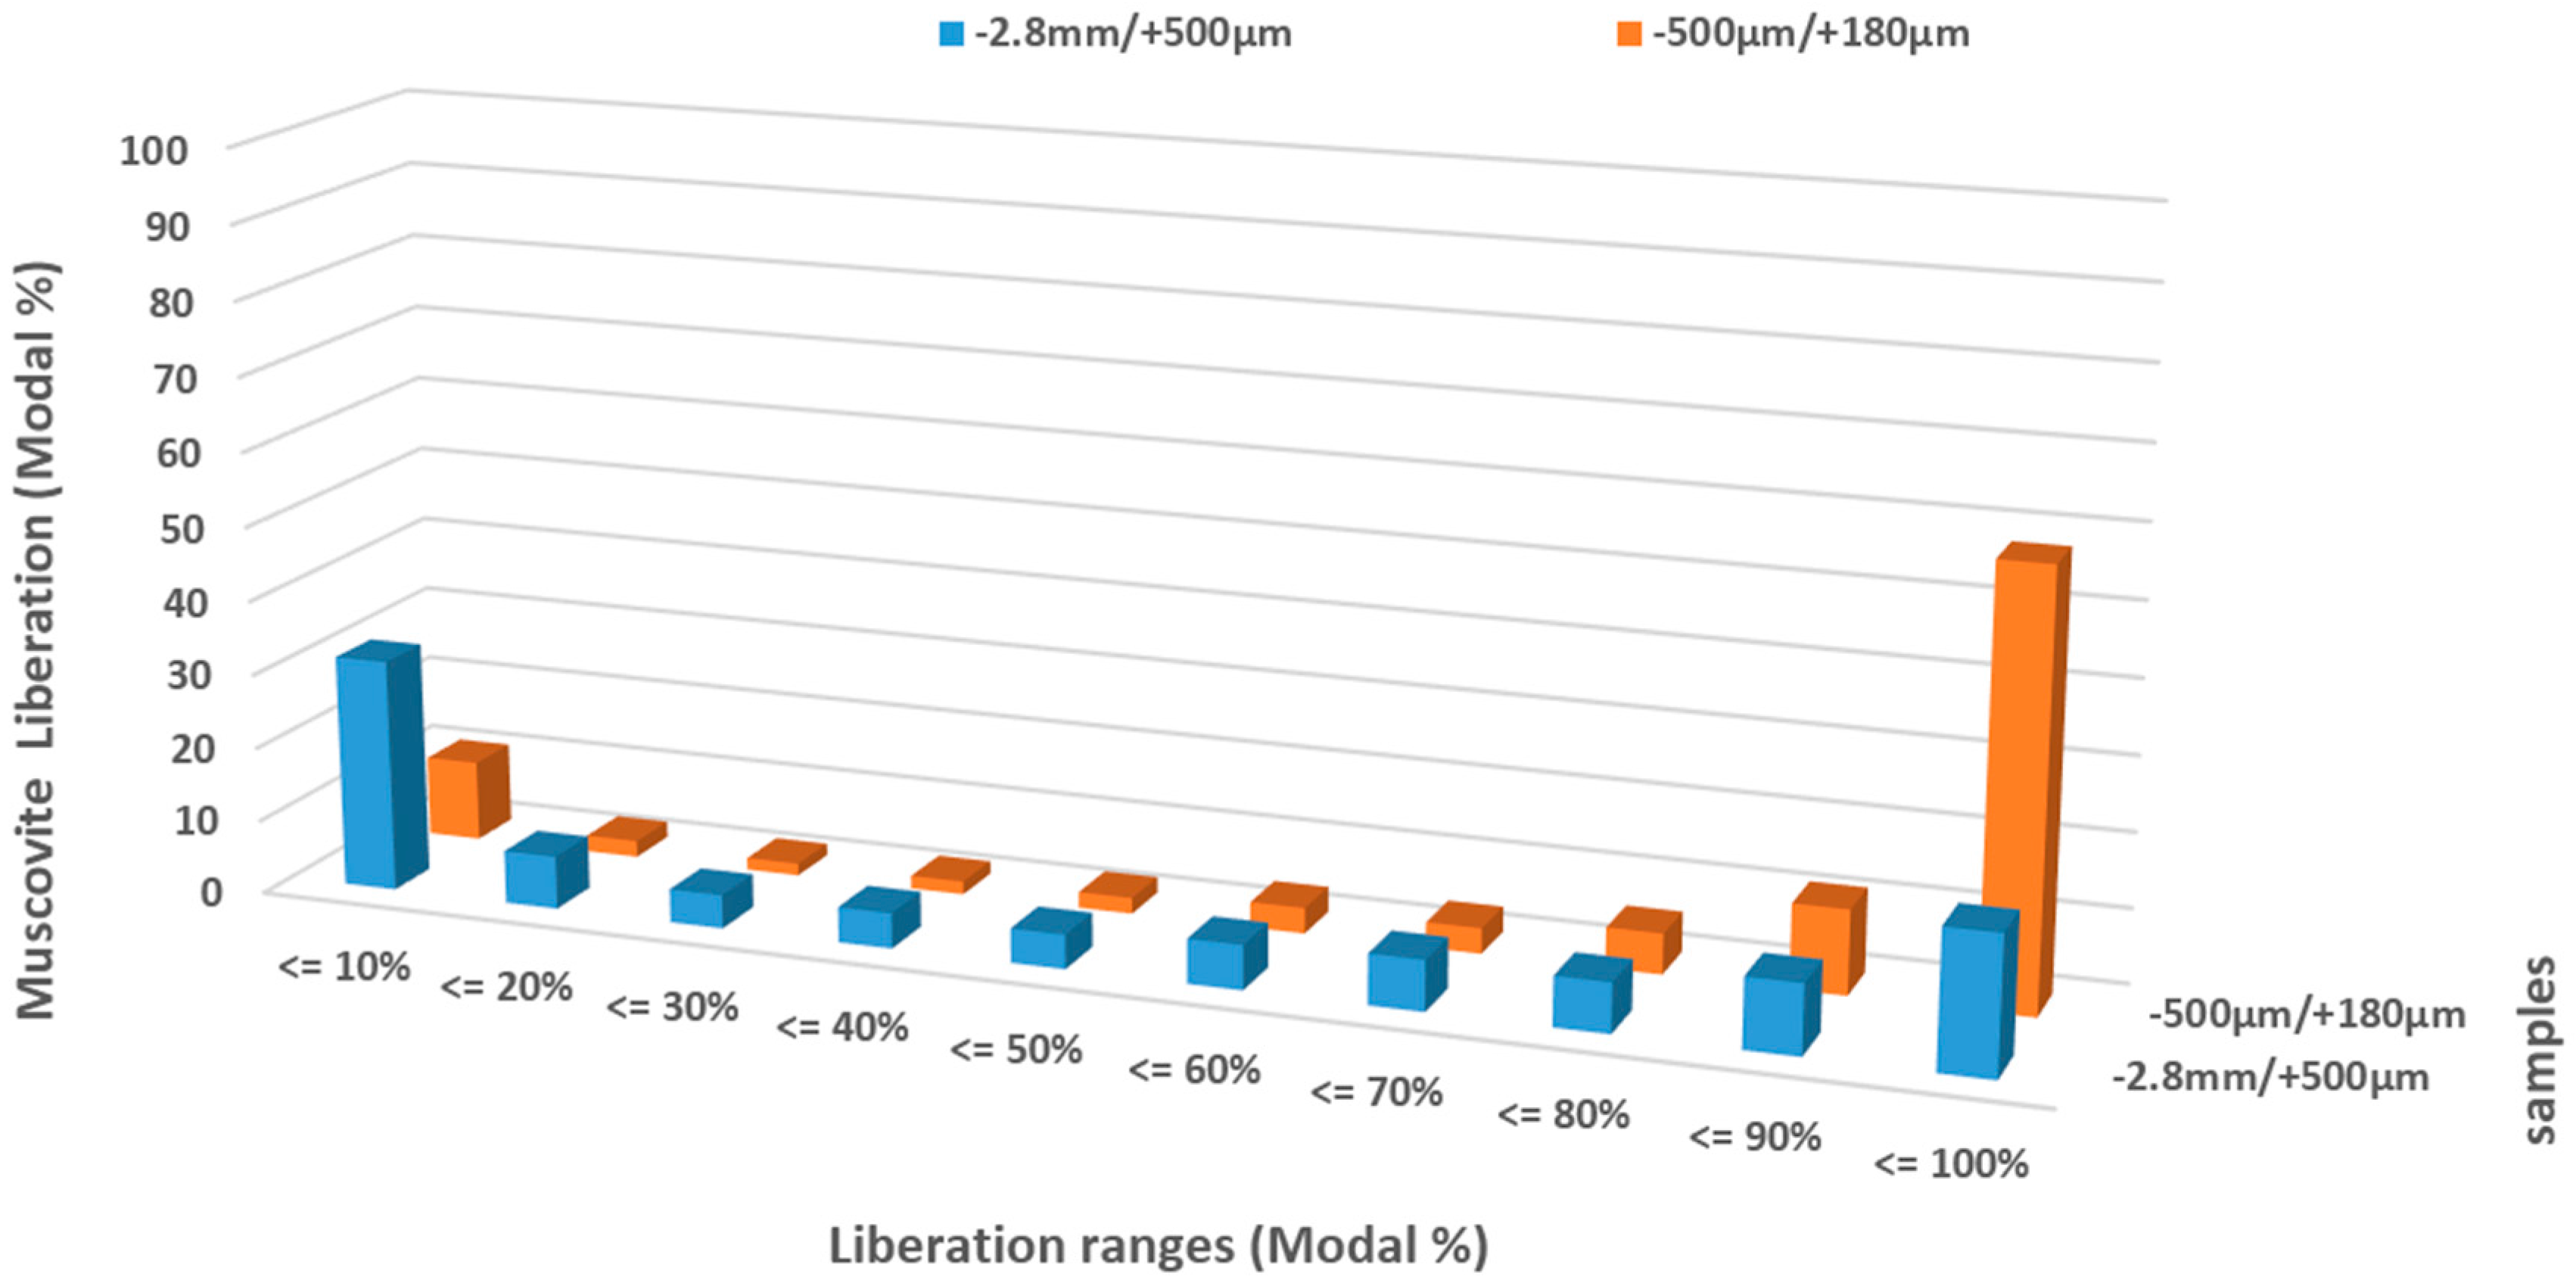
Figure 5.
Ta–Nb liberation. Columbite, tantalite and microlite have been combined to give an overall liberation rate. 80% liberation is required for mineral processing.
Figure 5.
Ta–Nb liberation. Columbite, tantalite and microlite have been combined to give an overall liberation rate. 80% liberation is required for mineral processing.
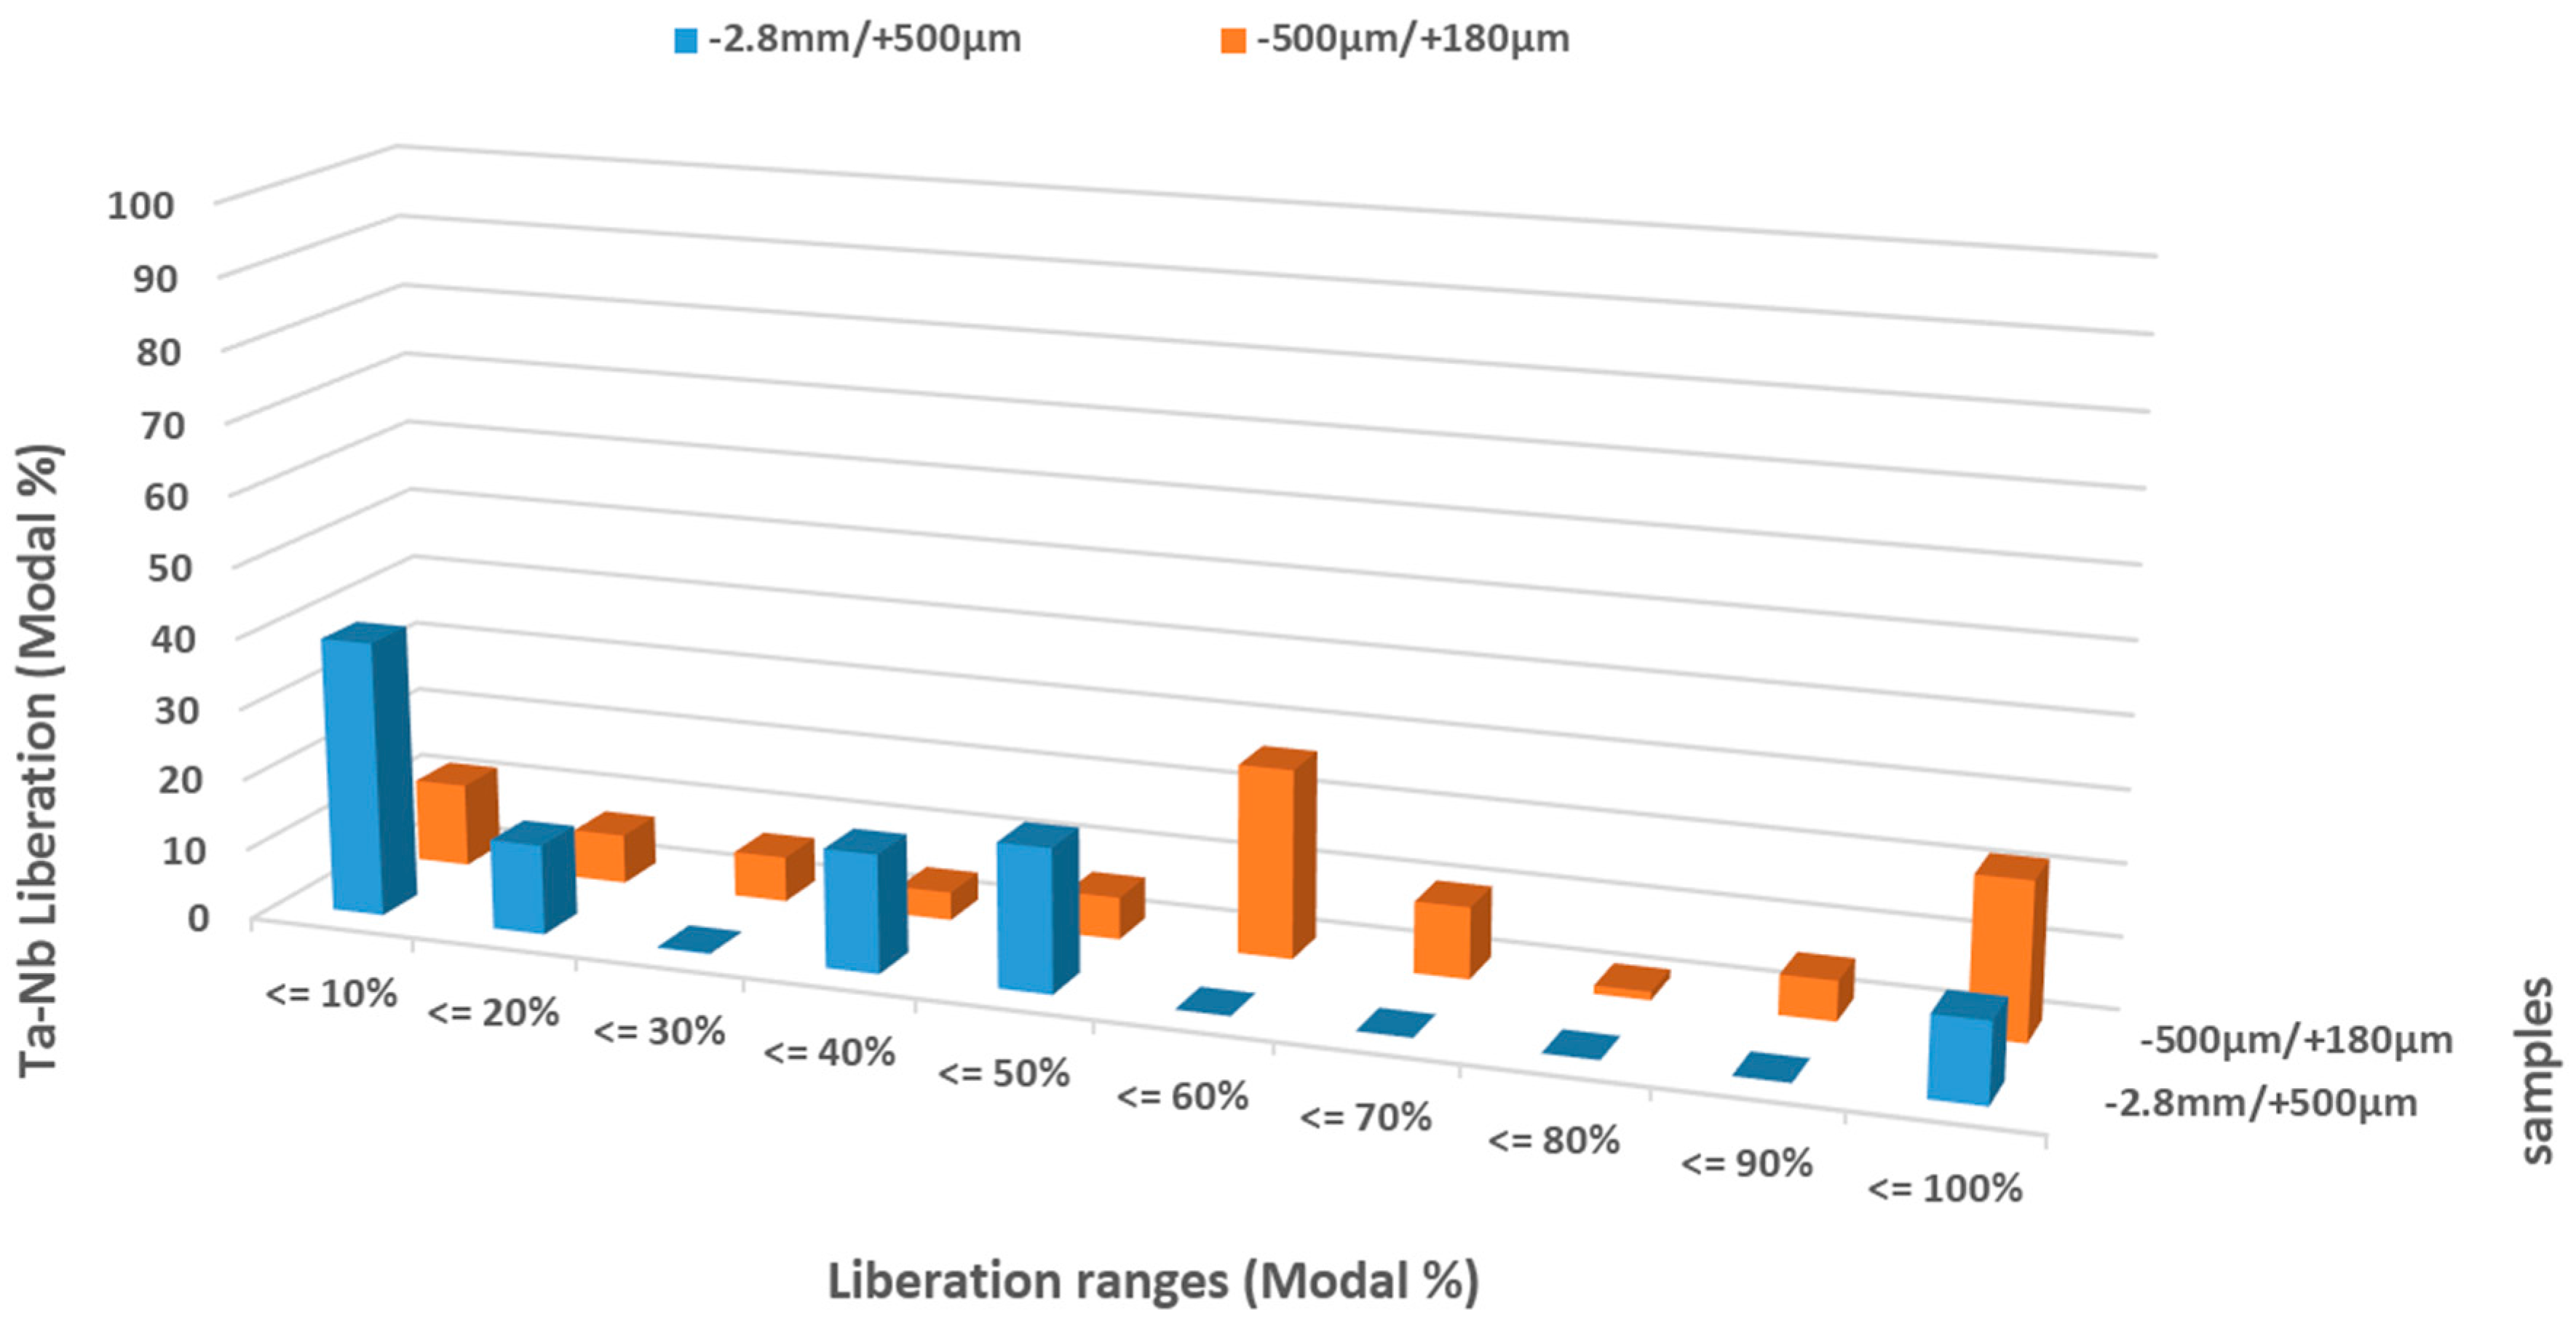
Figure 6.
Image Grids of columbite liberation in the two HLS products.
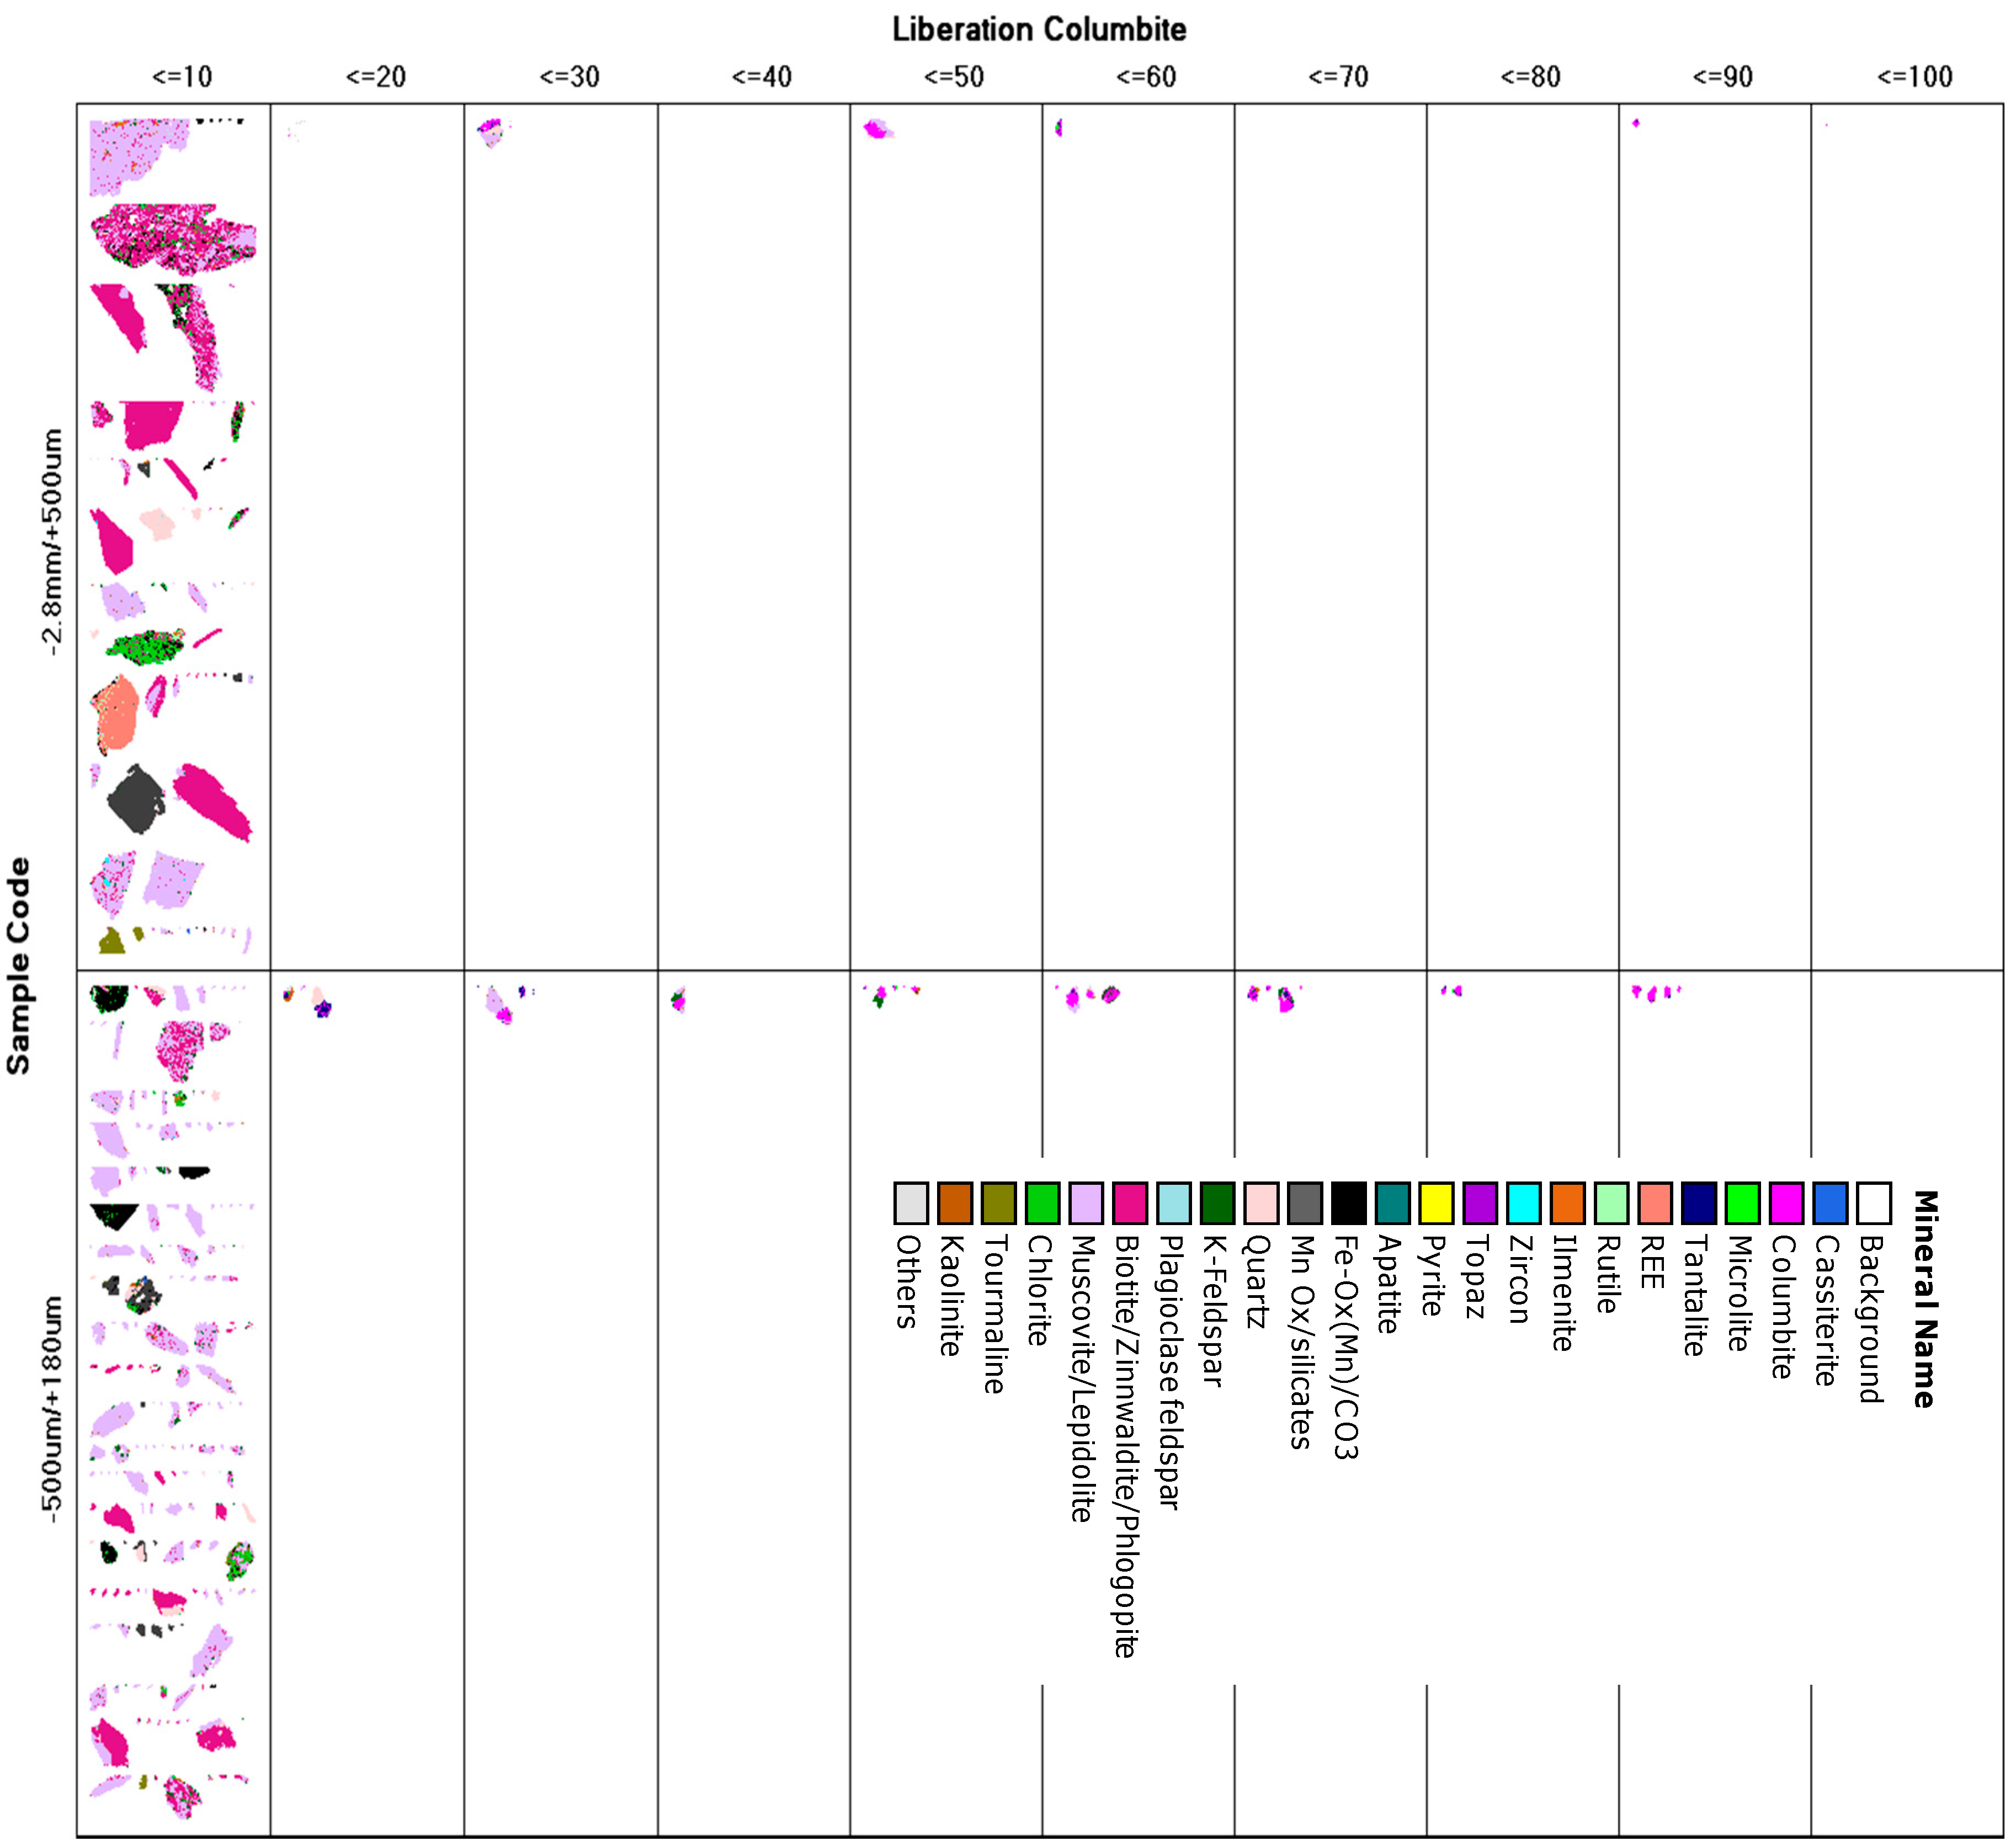
Figure 7.
Image Grids of cassiterite liberation in the two HLS products.

Figure 8.
QEMSCAN false colour image of Columbite-group and associated minerals.

Figure 9.
QEMSCAN false colour image of Cassiterite minerals associations (Legend is the same as Figure 8).
Figure 9.
QEMSCAN false colour image of Cassiterite minerals associations (Legend is the same as Figure 8).

Figure 10.
Quadrilateral plot of columbite-tantalite elemental composition. Plotted based on normalised moles of cations.
Figure 10.
Quadrilateral plot of columbite-tantalite elemental composition. Plotted based on normalised moles of cations.
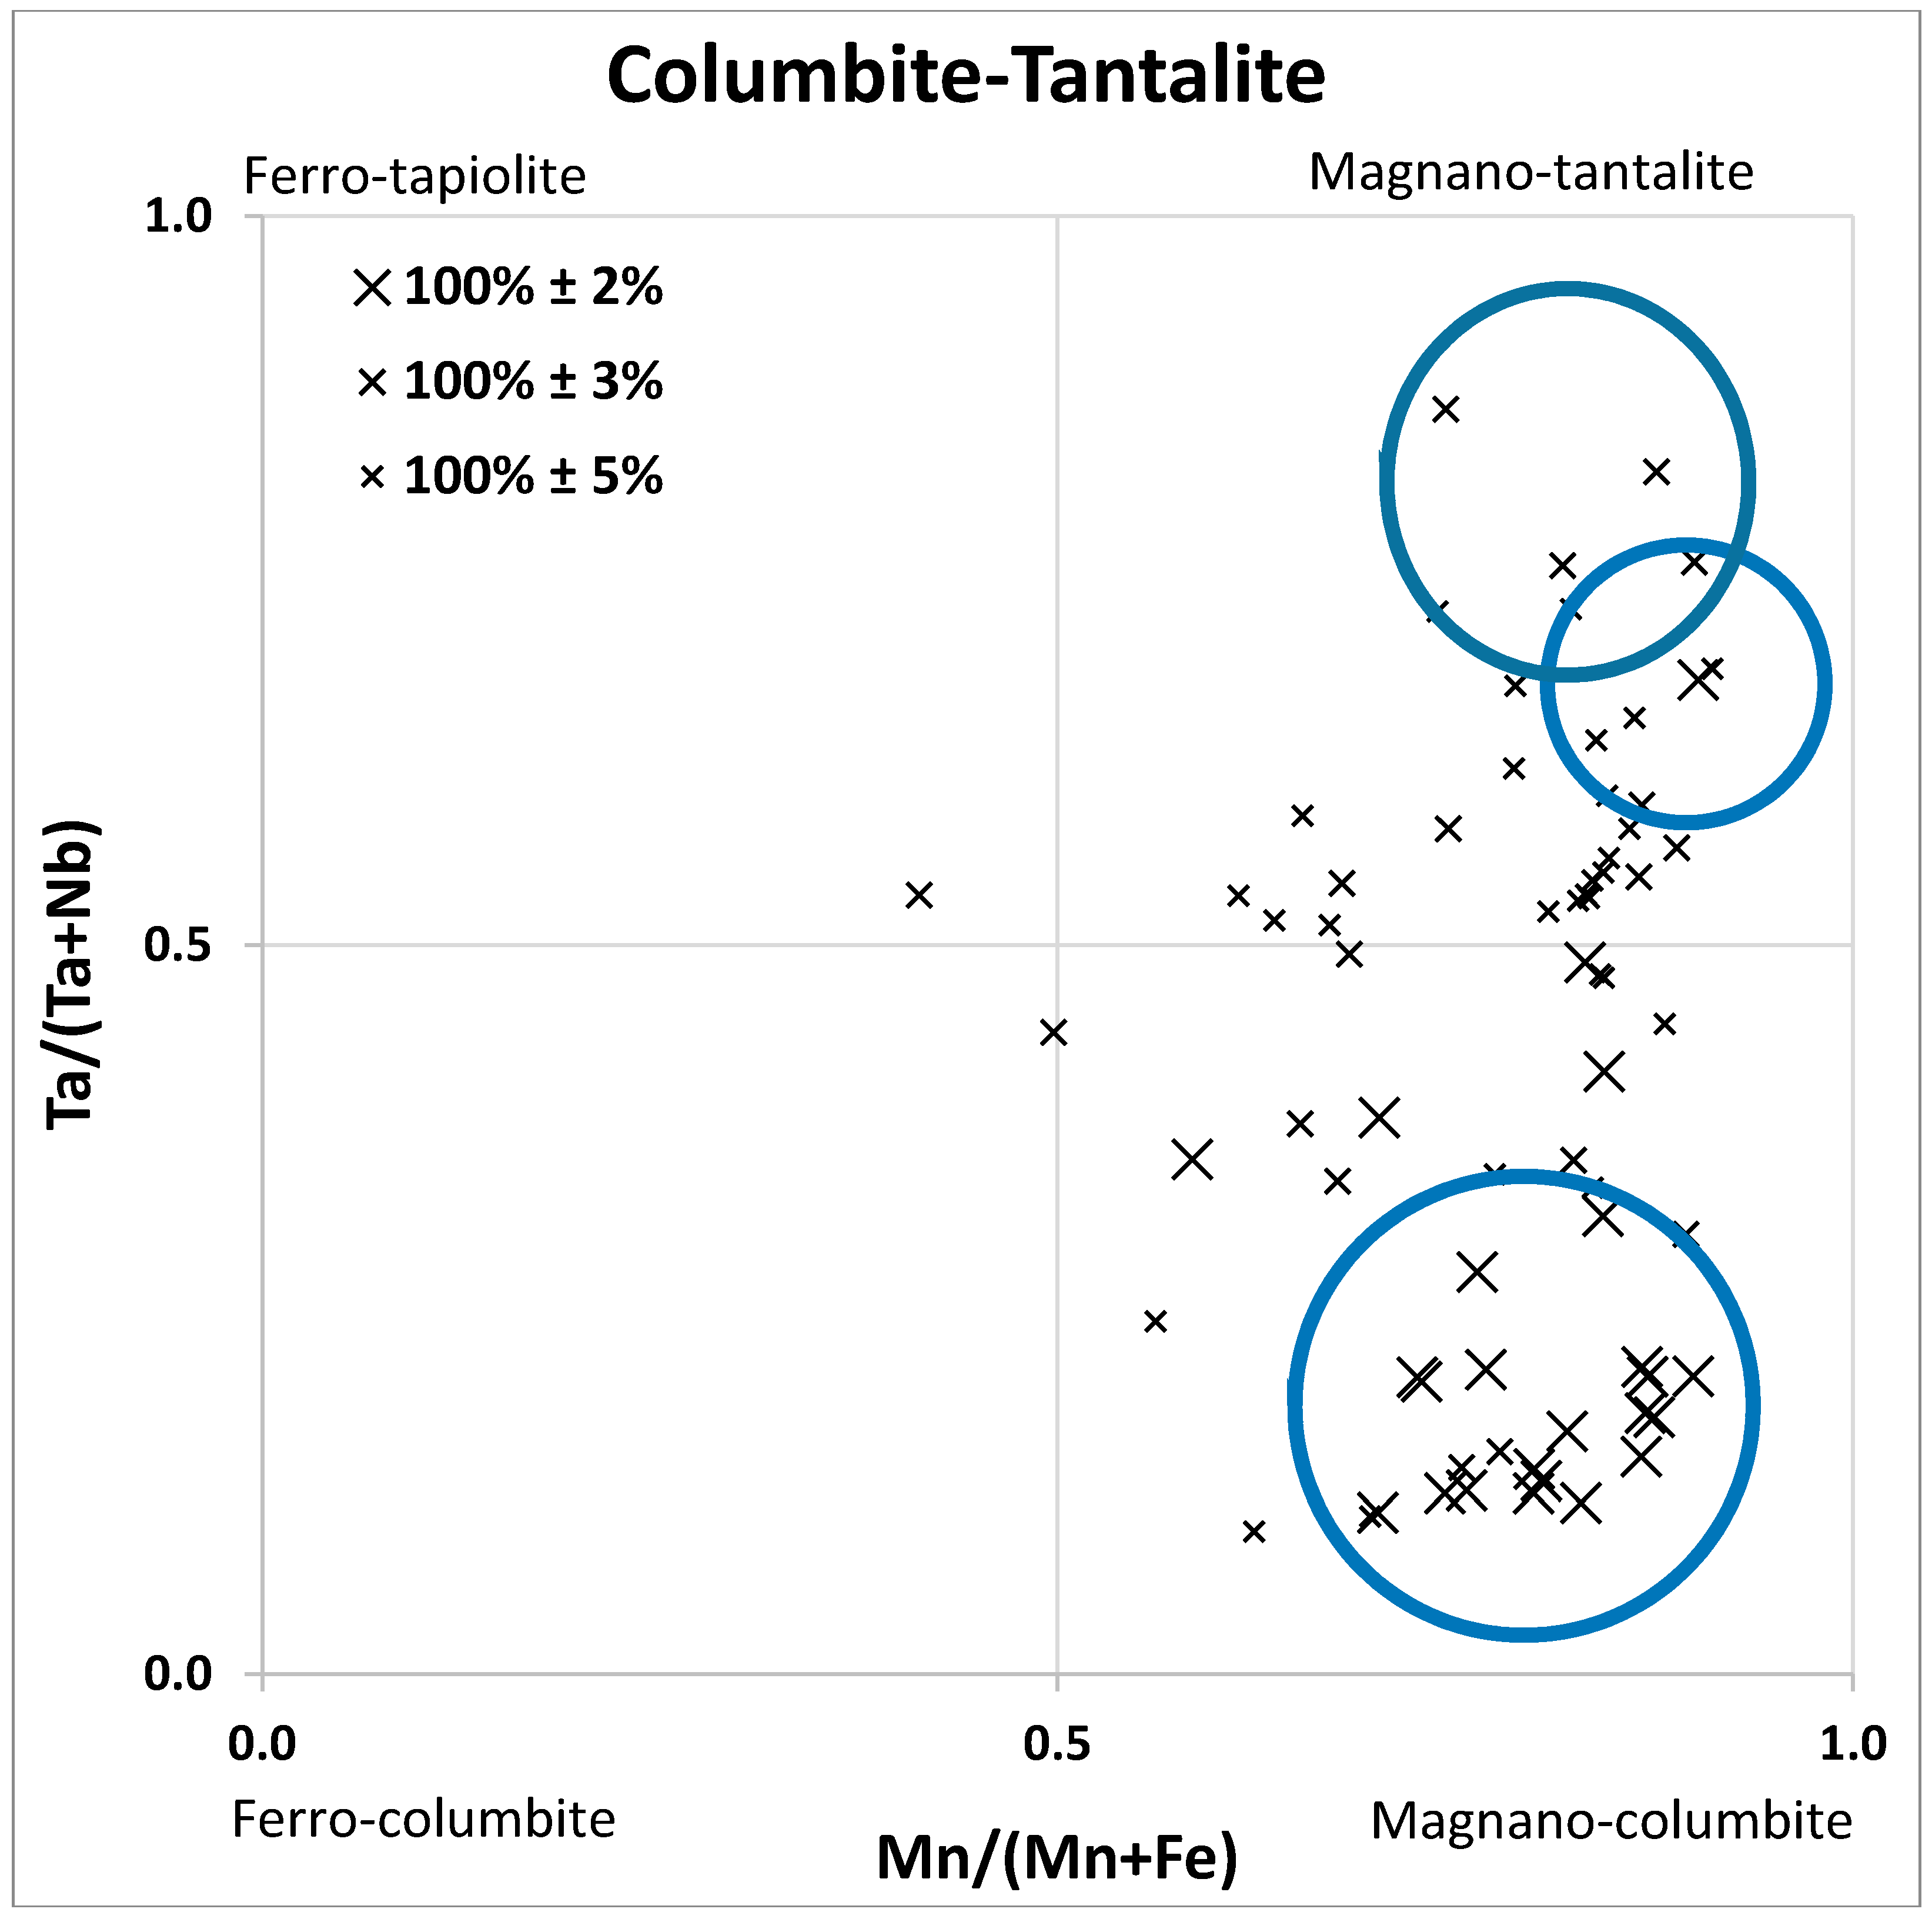
Figure 11.
Plot of molar ratio of cations Fe + Mn and Nb + Ta. The 2:1 ratio expected based on the stochiometry of columbite-tantalite (Fe,Mn)(Nb,Ta)2O6 is included.
Figure 11.
Plot of molar ratio of cations Fe + Mn and Nb + Ta. The 2:1 ratio expected based on the stochiometry of columbite-tantalite (Fe,Mn)(Nb,Ta)2O6 is included.

Figure 12.
Columbite-tantalite grains analysed by EM PA with clear mineral zoning; (a,b,d) Nb-rich cores and Ta-rich rims; (c,e,f), convoluted zoning.
Figure 12.
Columbite-tantalite grains analysed by EM PA with clear mineral zoning; (a,b,d) Nb-rich cores and Ta-rich rims; (c,e,f), convoluted zoning.
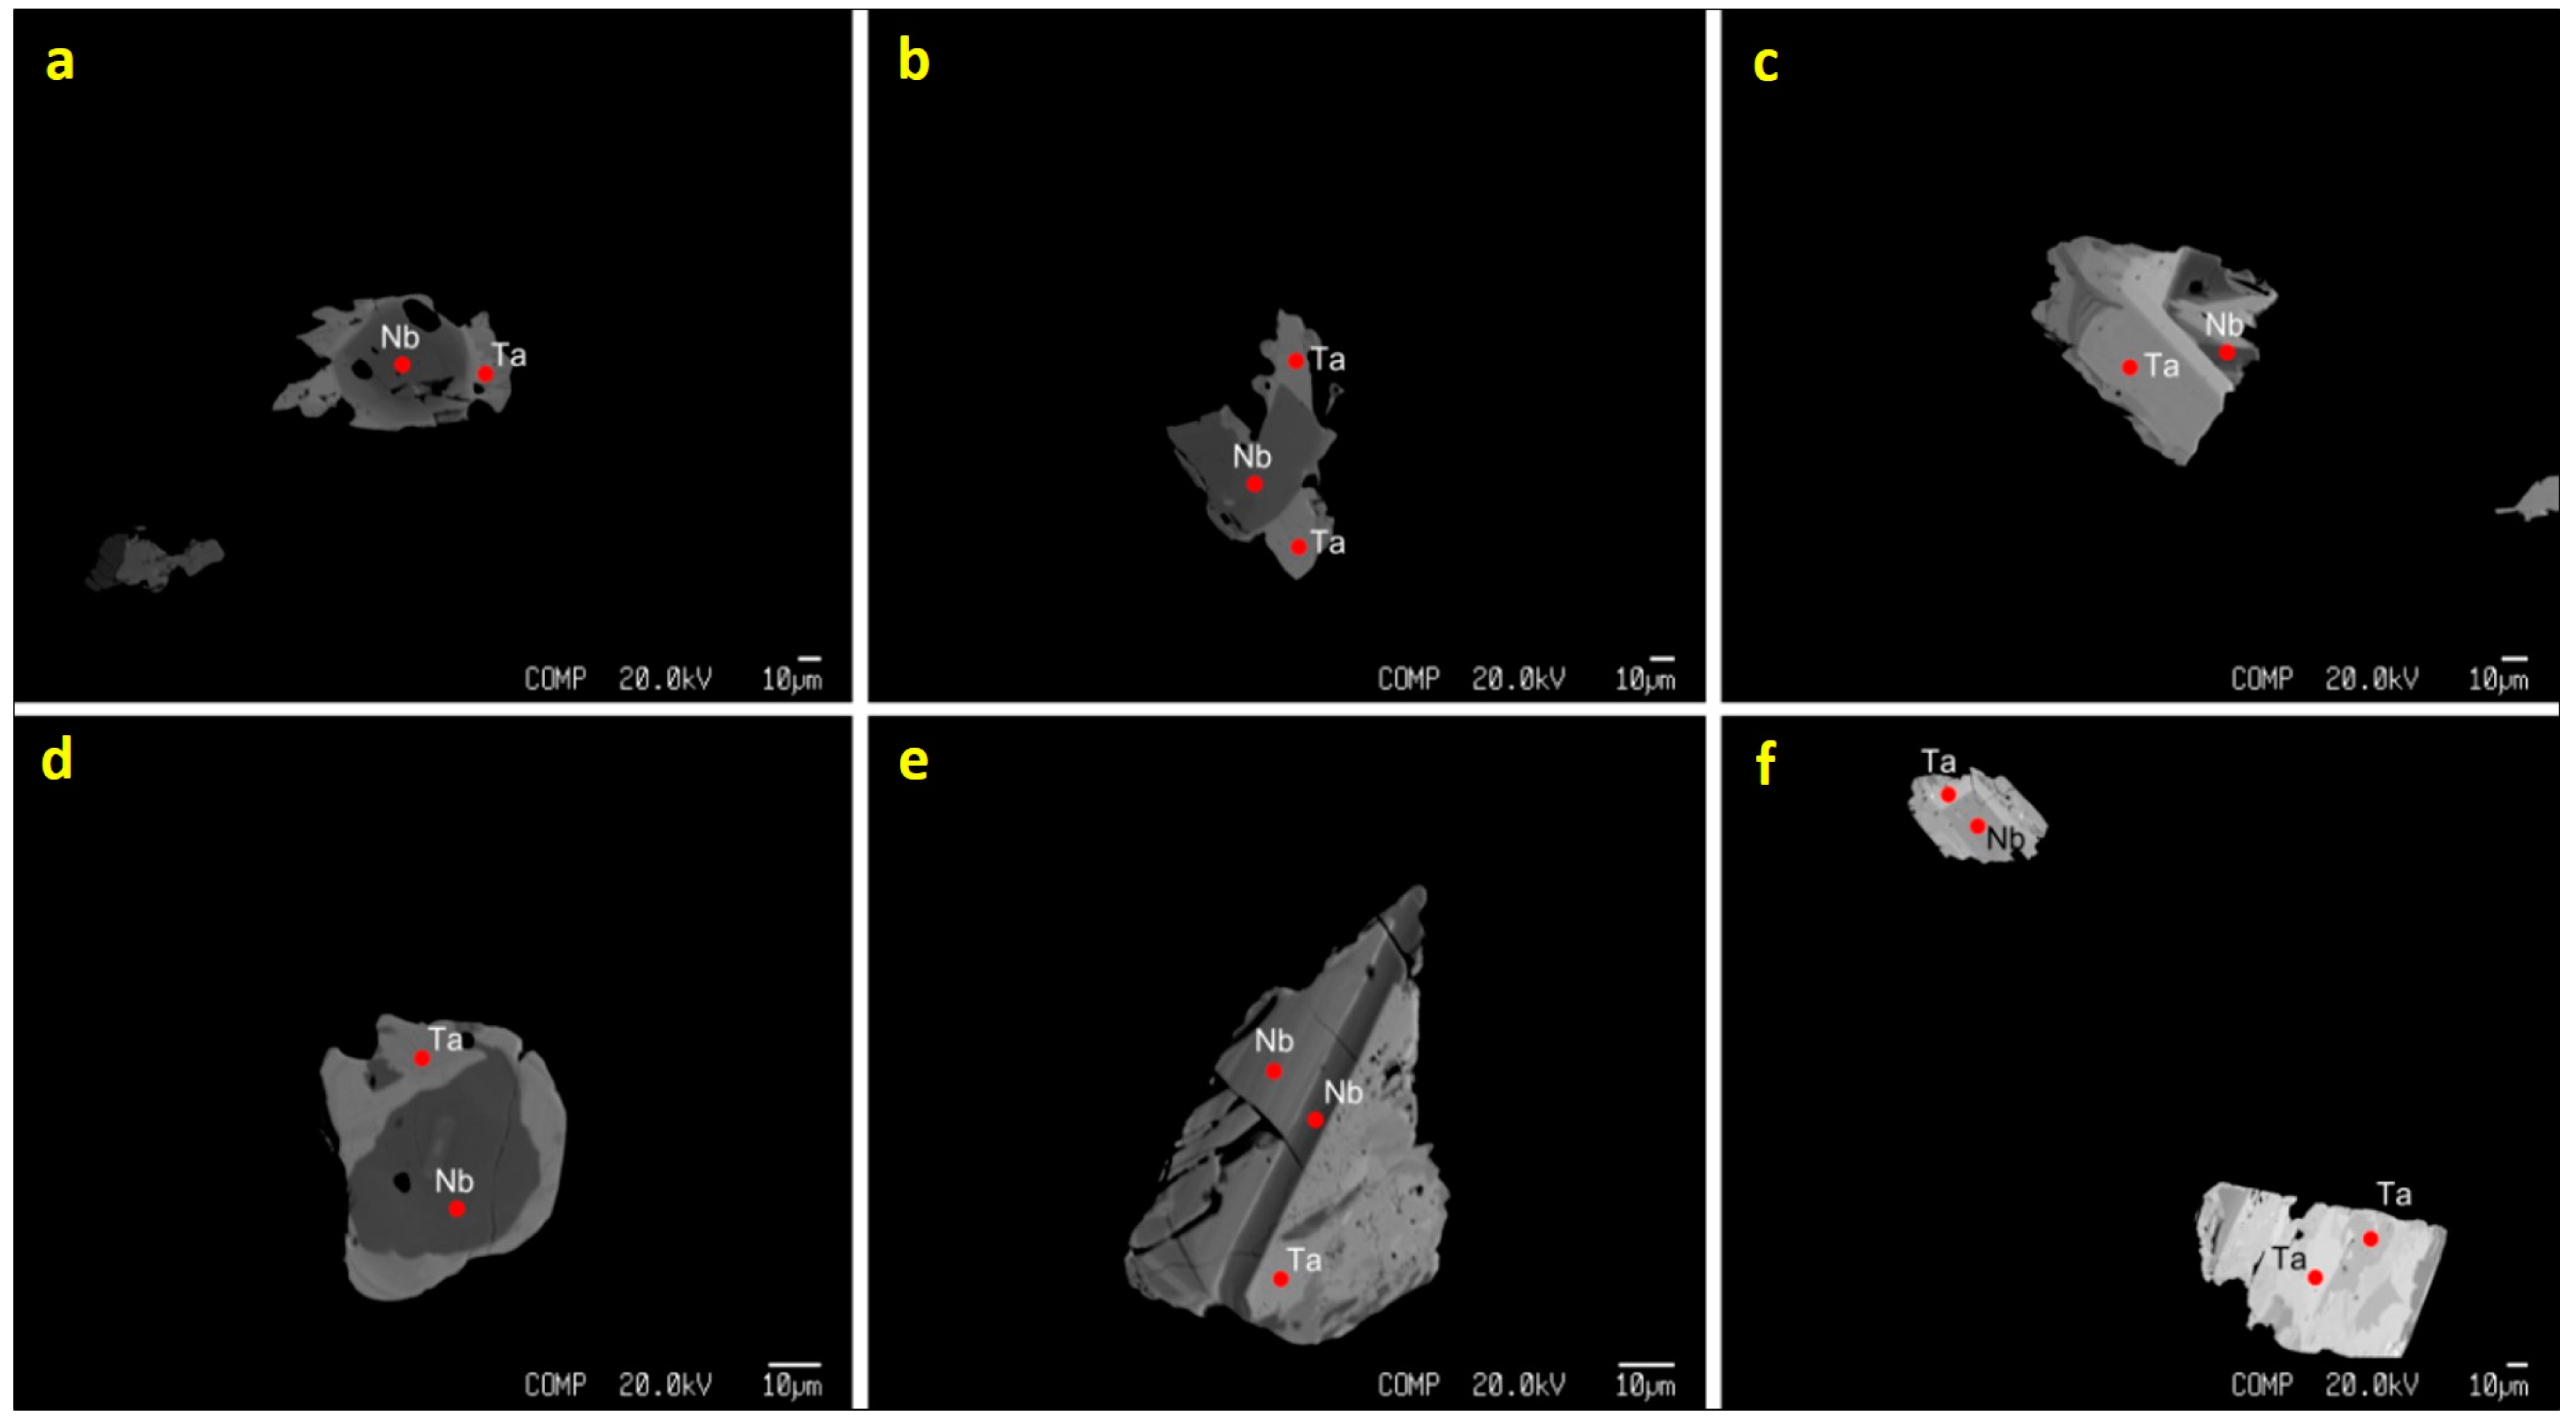
Figure 13.
Elemental association within cassiterite.
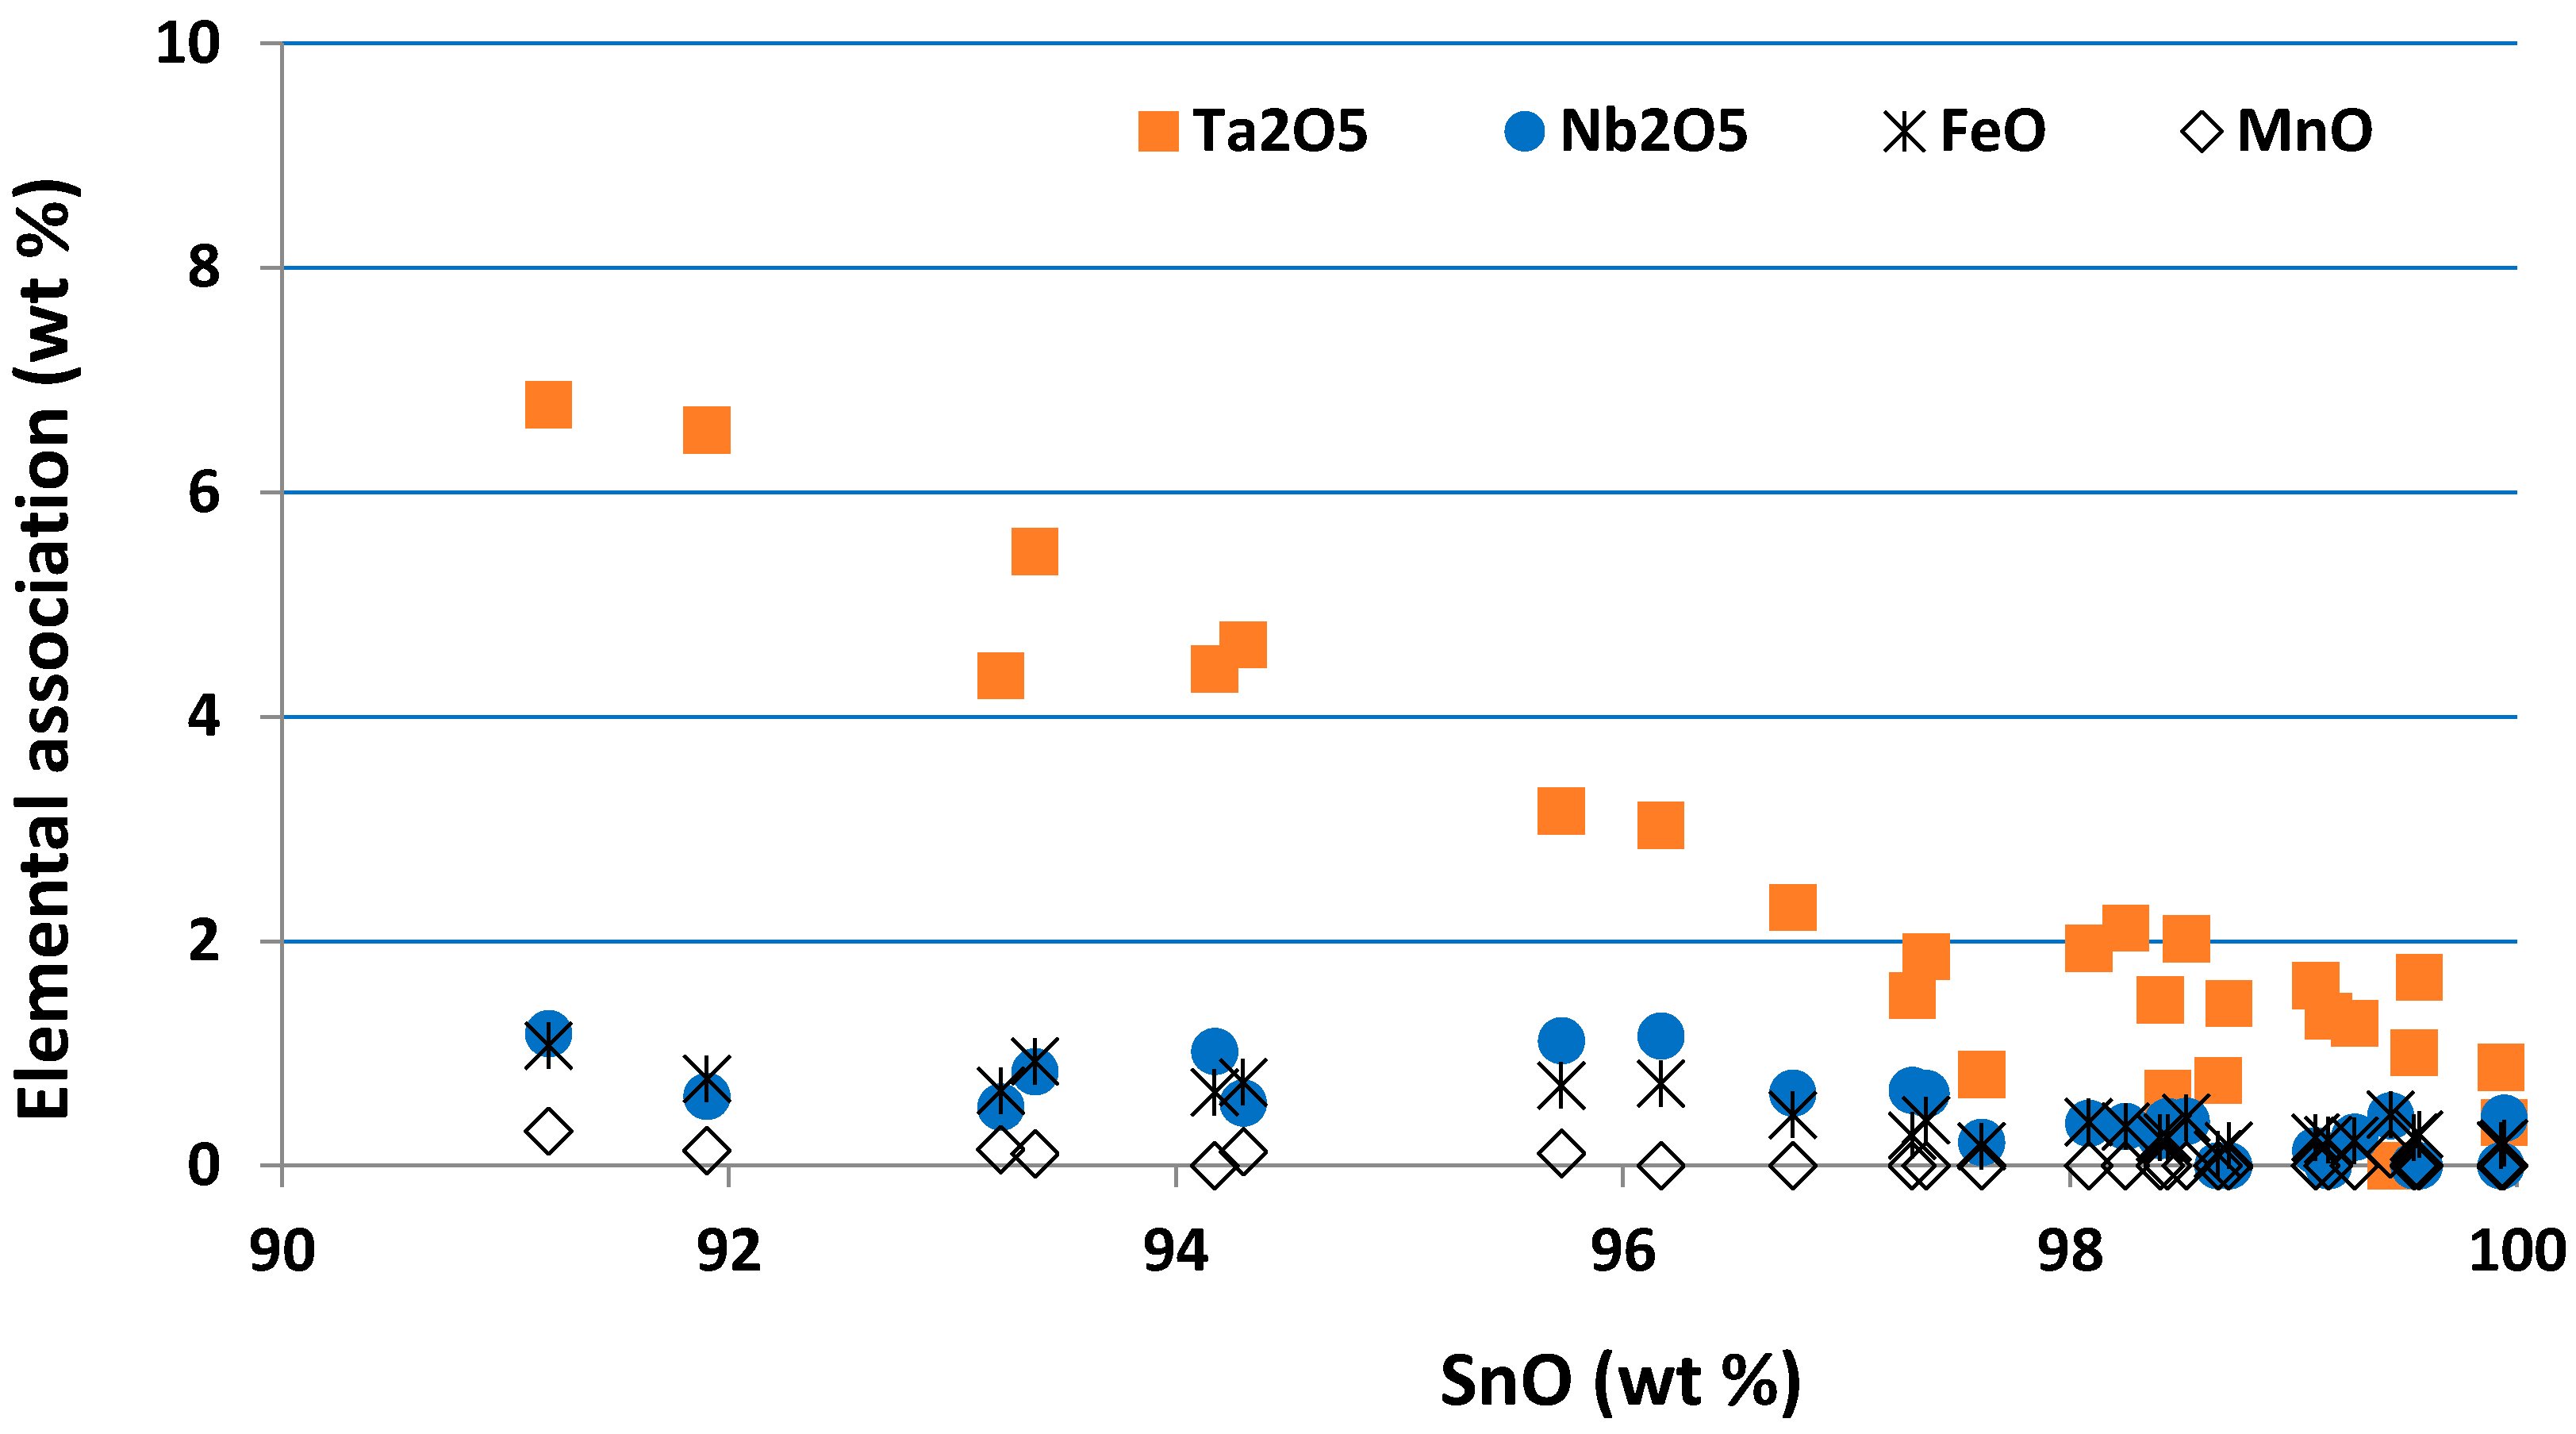
Figure 14.
Cassiterite grains analysed by EPMA, that show Ta-rich compositions.

Figure 15.
Scatter plot showing correlation of results from PXRF and SQ-XRF analysis of Knelson Concentrator products for for Ta, Nb and Sn.
Figure 15.
Scatter plot showing correlation of results from PXRF and SQ-XRF analysis of Knelson Concentrator products for for Ta, Nb and Sn.

Figure 16.
Plot of Ta, Sn and Nb recovery rates through time versus volume of feed measured using PXRF.
Figure 16.
Plot of Ta, Sn and Nb recovery rates through time versus volume of feed measured using PXRF.
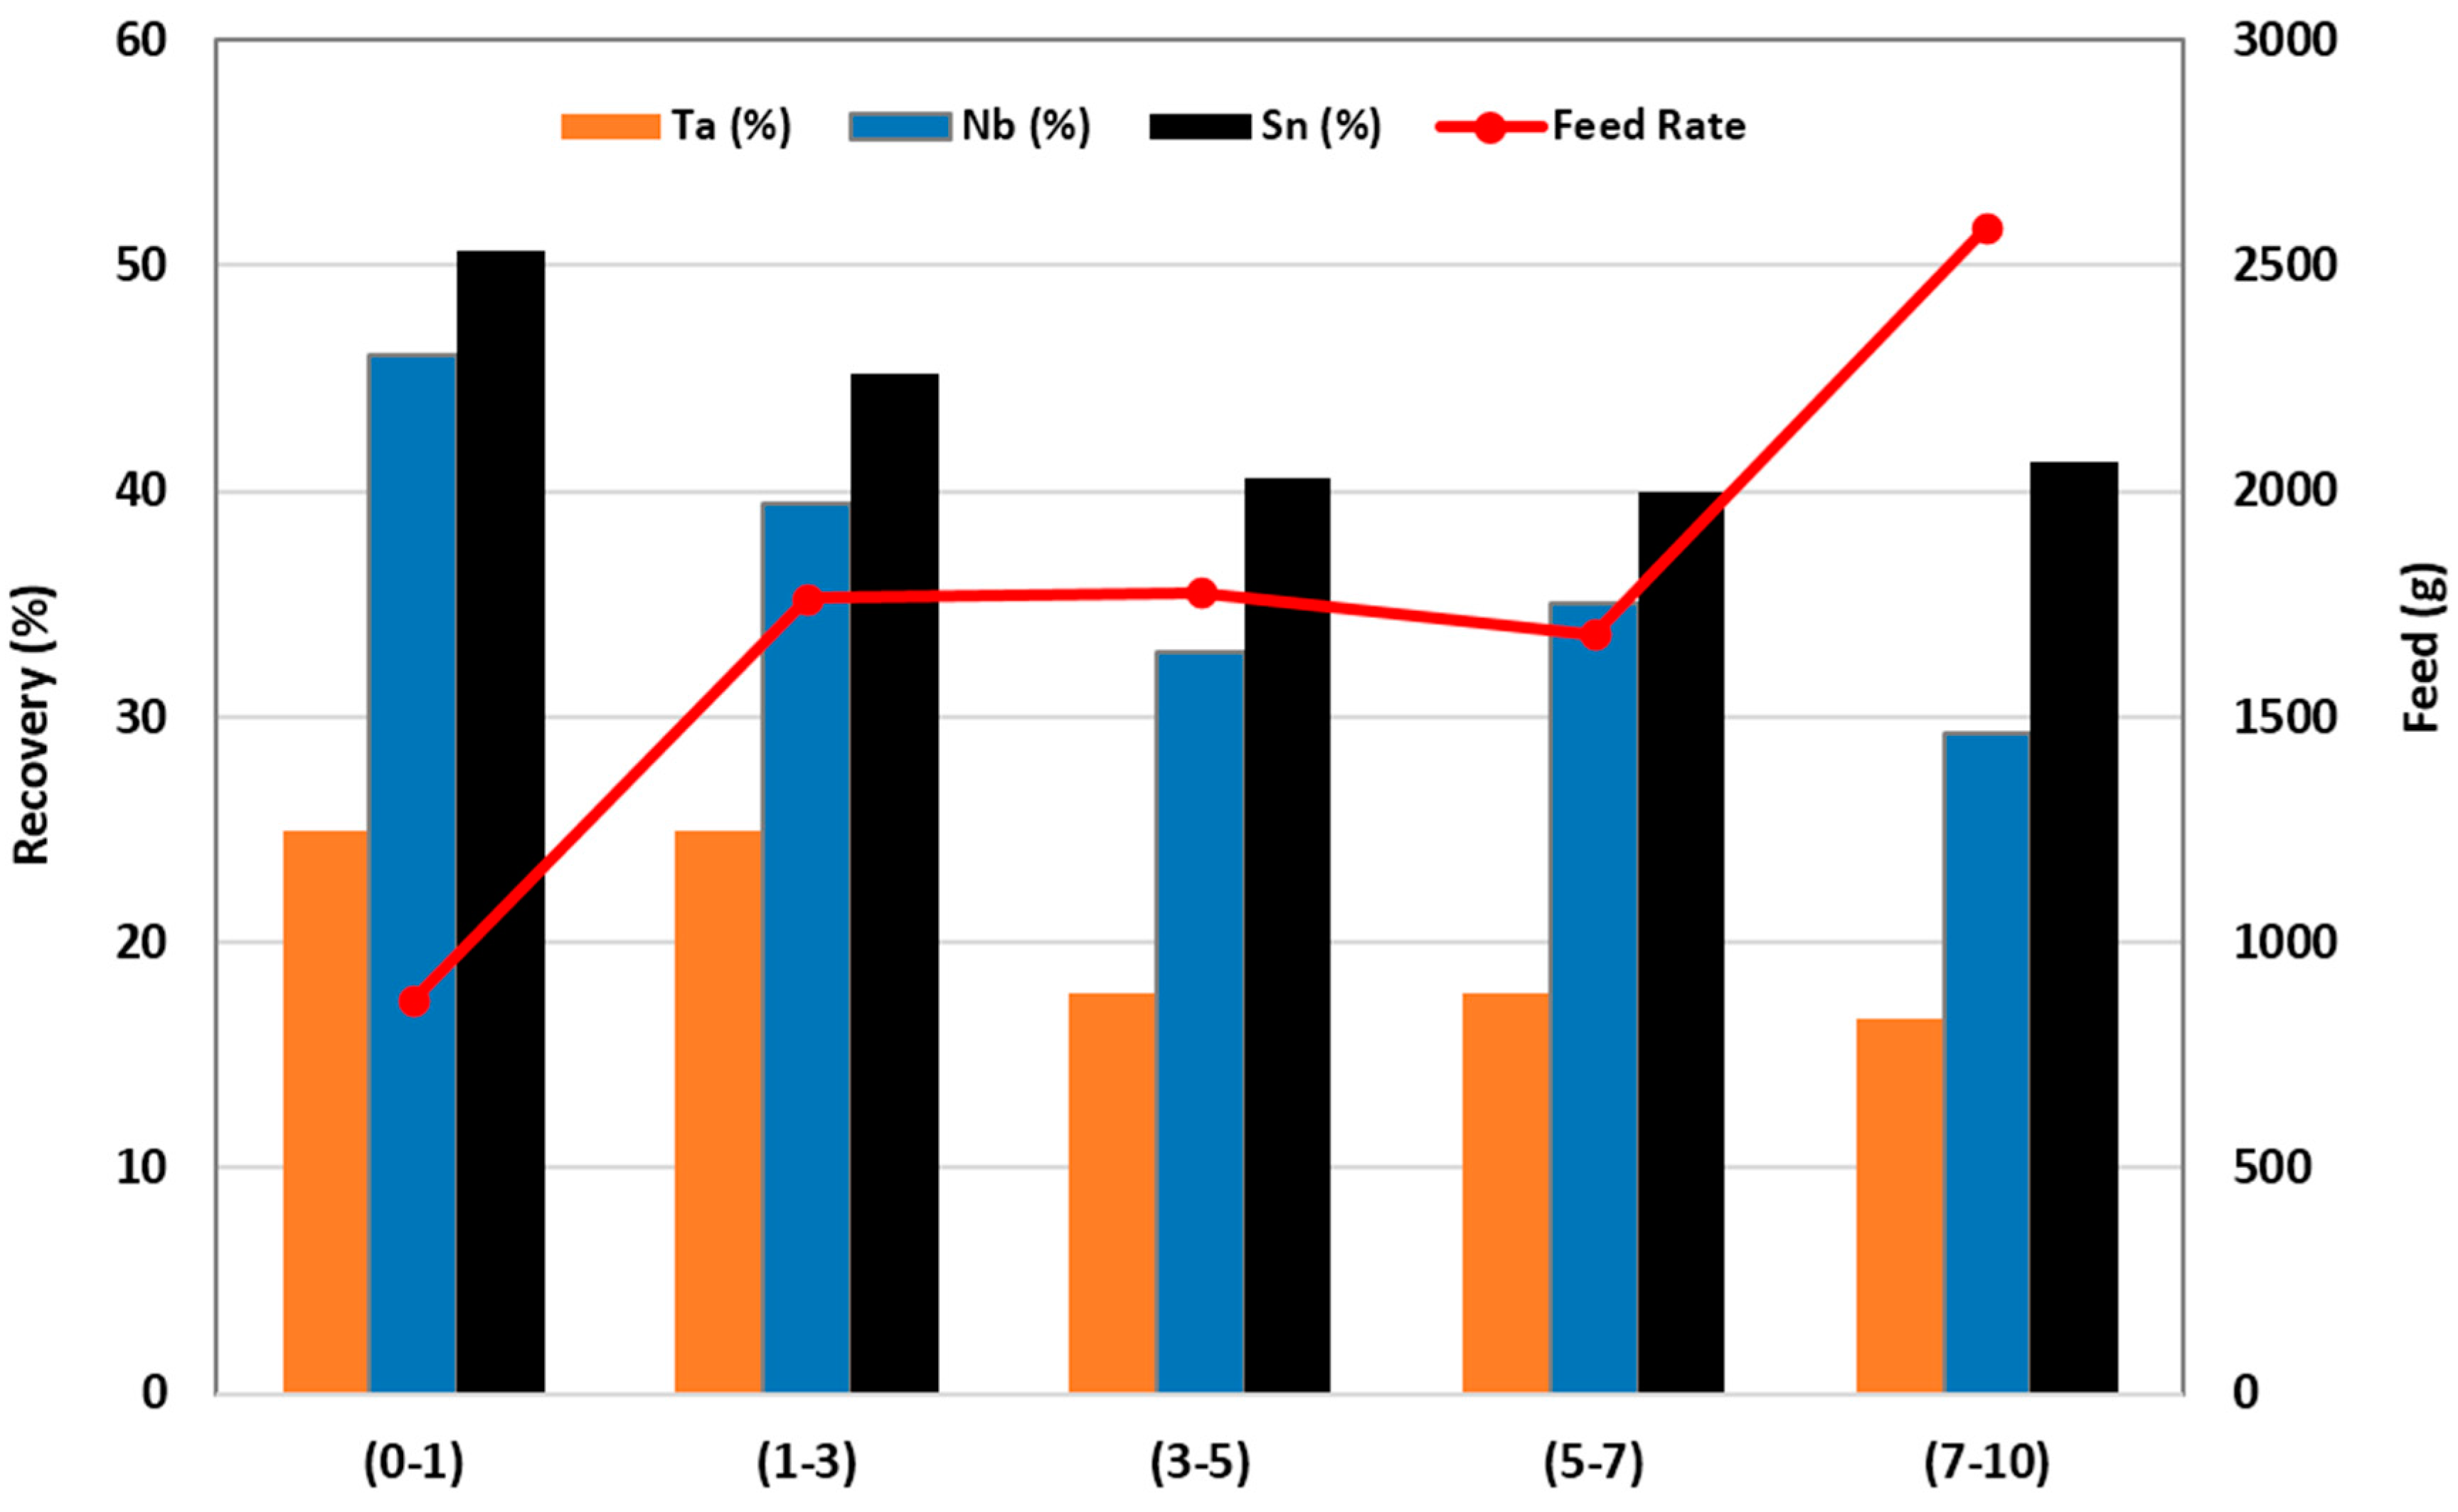
Figure 17.
Grade of Ta, Nb and Sn in tailings through time.

Figure 18.
Average recovery by particle size during separation by a Knelson concentrator. Recoveries calculated from PXRF results.
Figure 18.
Average recovery by particle size during separation by a Knelson concentrator. Recoveries calculated from PXRF results.
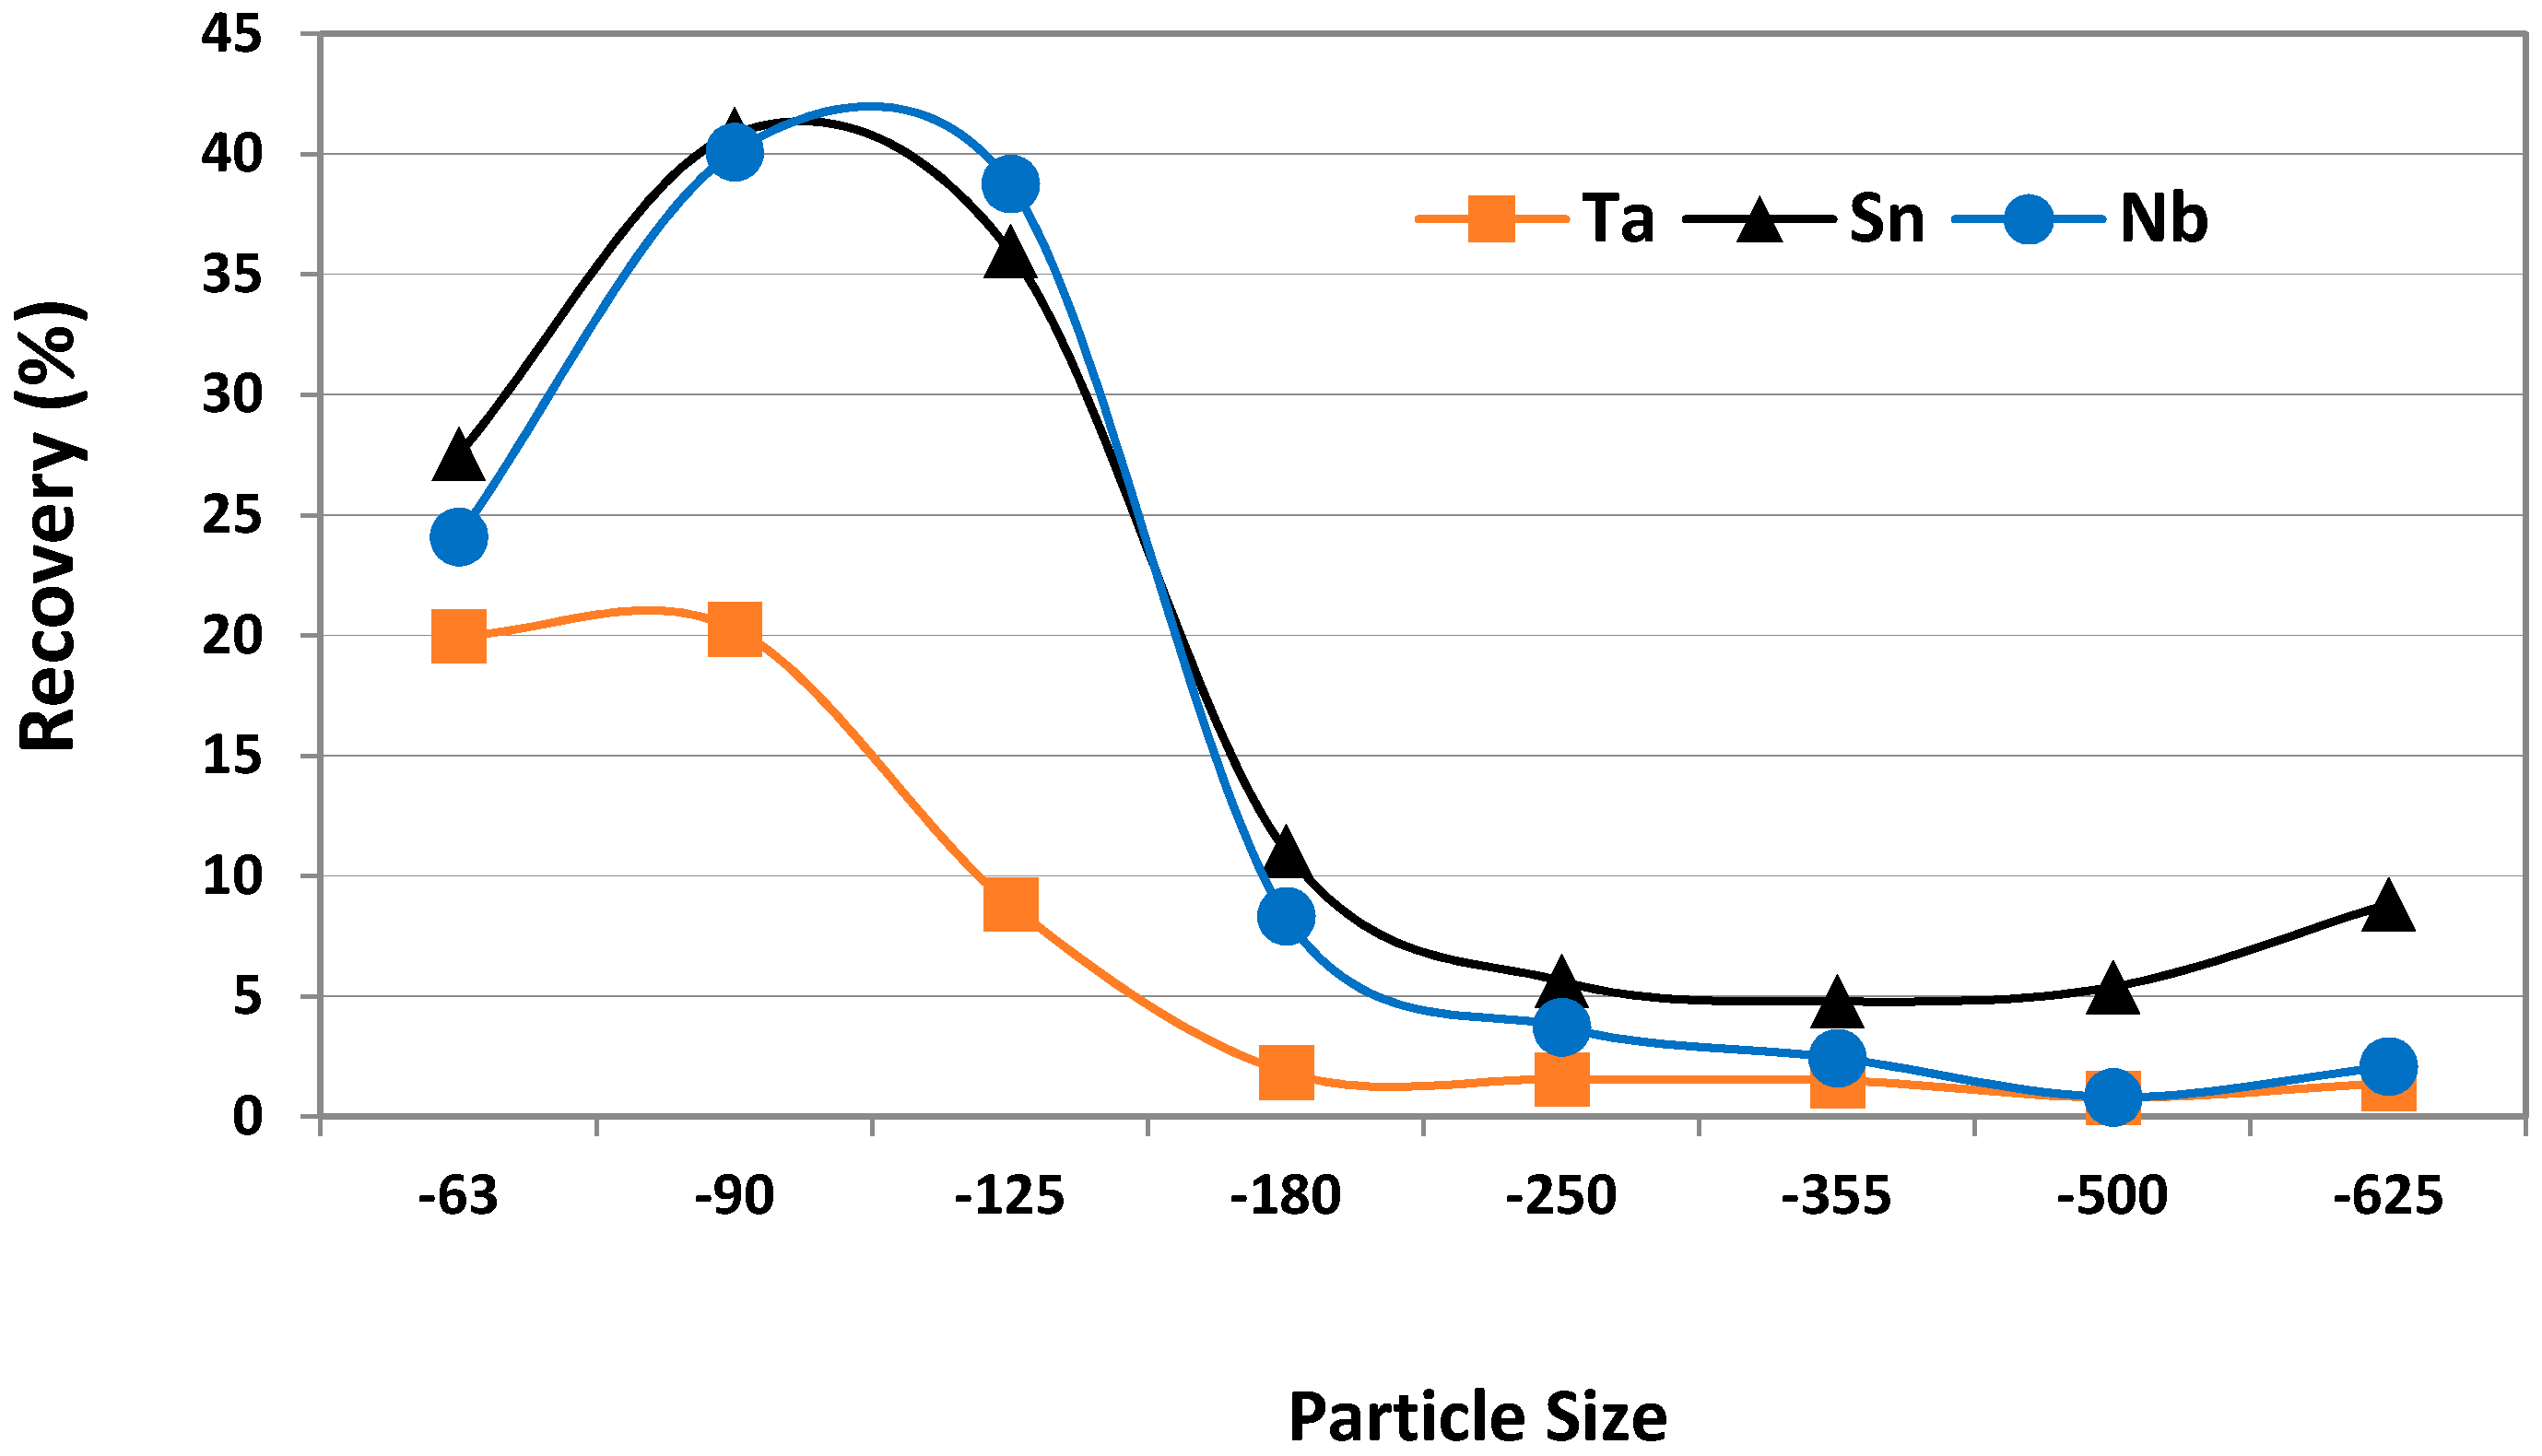
Figure 19.
Mass pull (%) and recovery (%) for Wilfley shaking table rougher test on Penouta sample, measured using PXRF.
Figure 19.
Mass pull (%) and recovery (%) for Wilfley shaking table rougher test on Penouta sample, measured using PXRF.
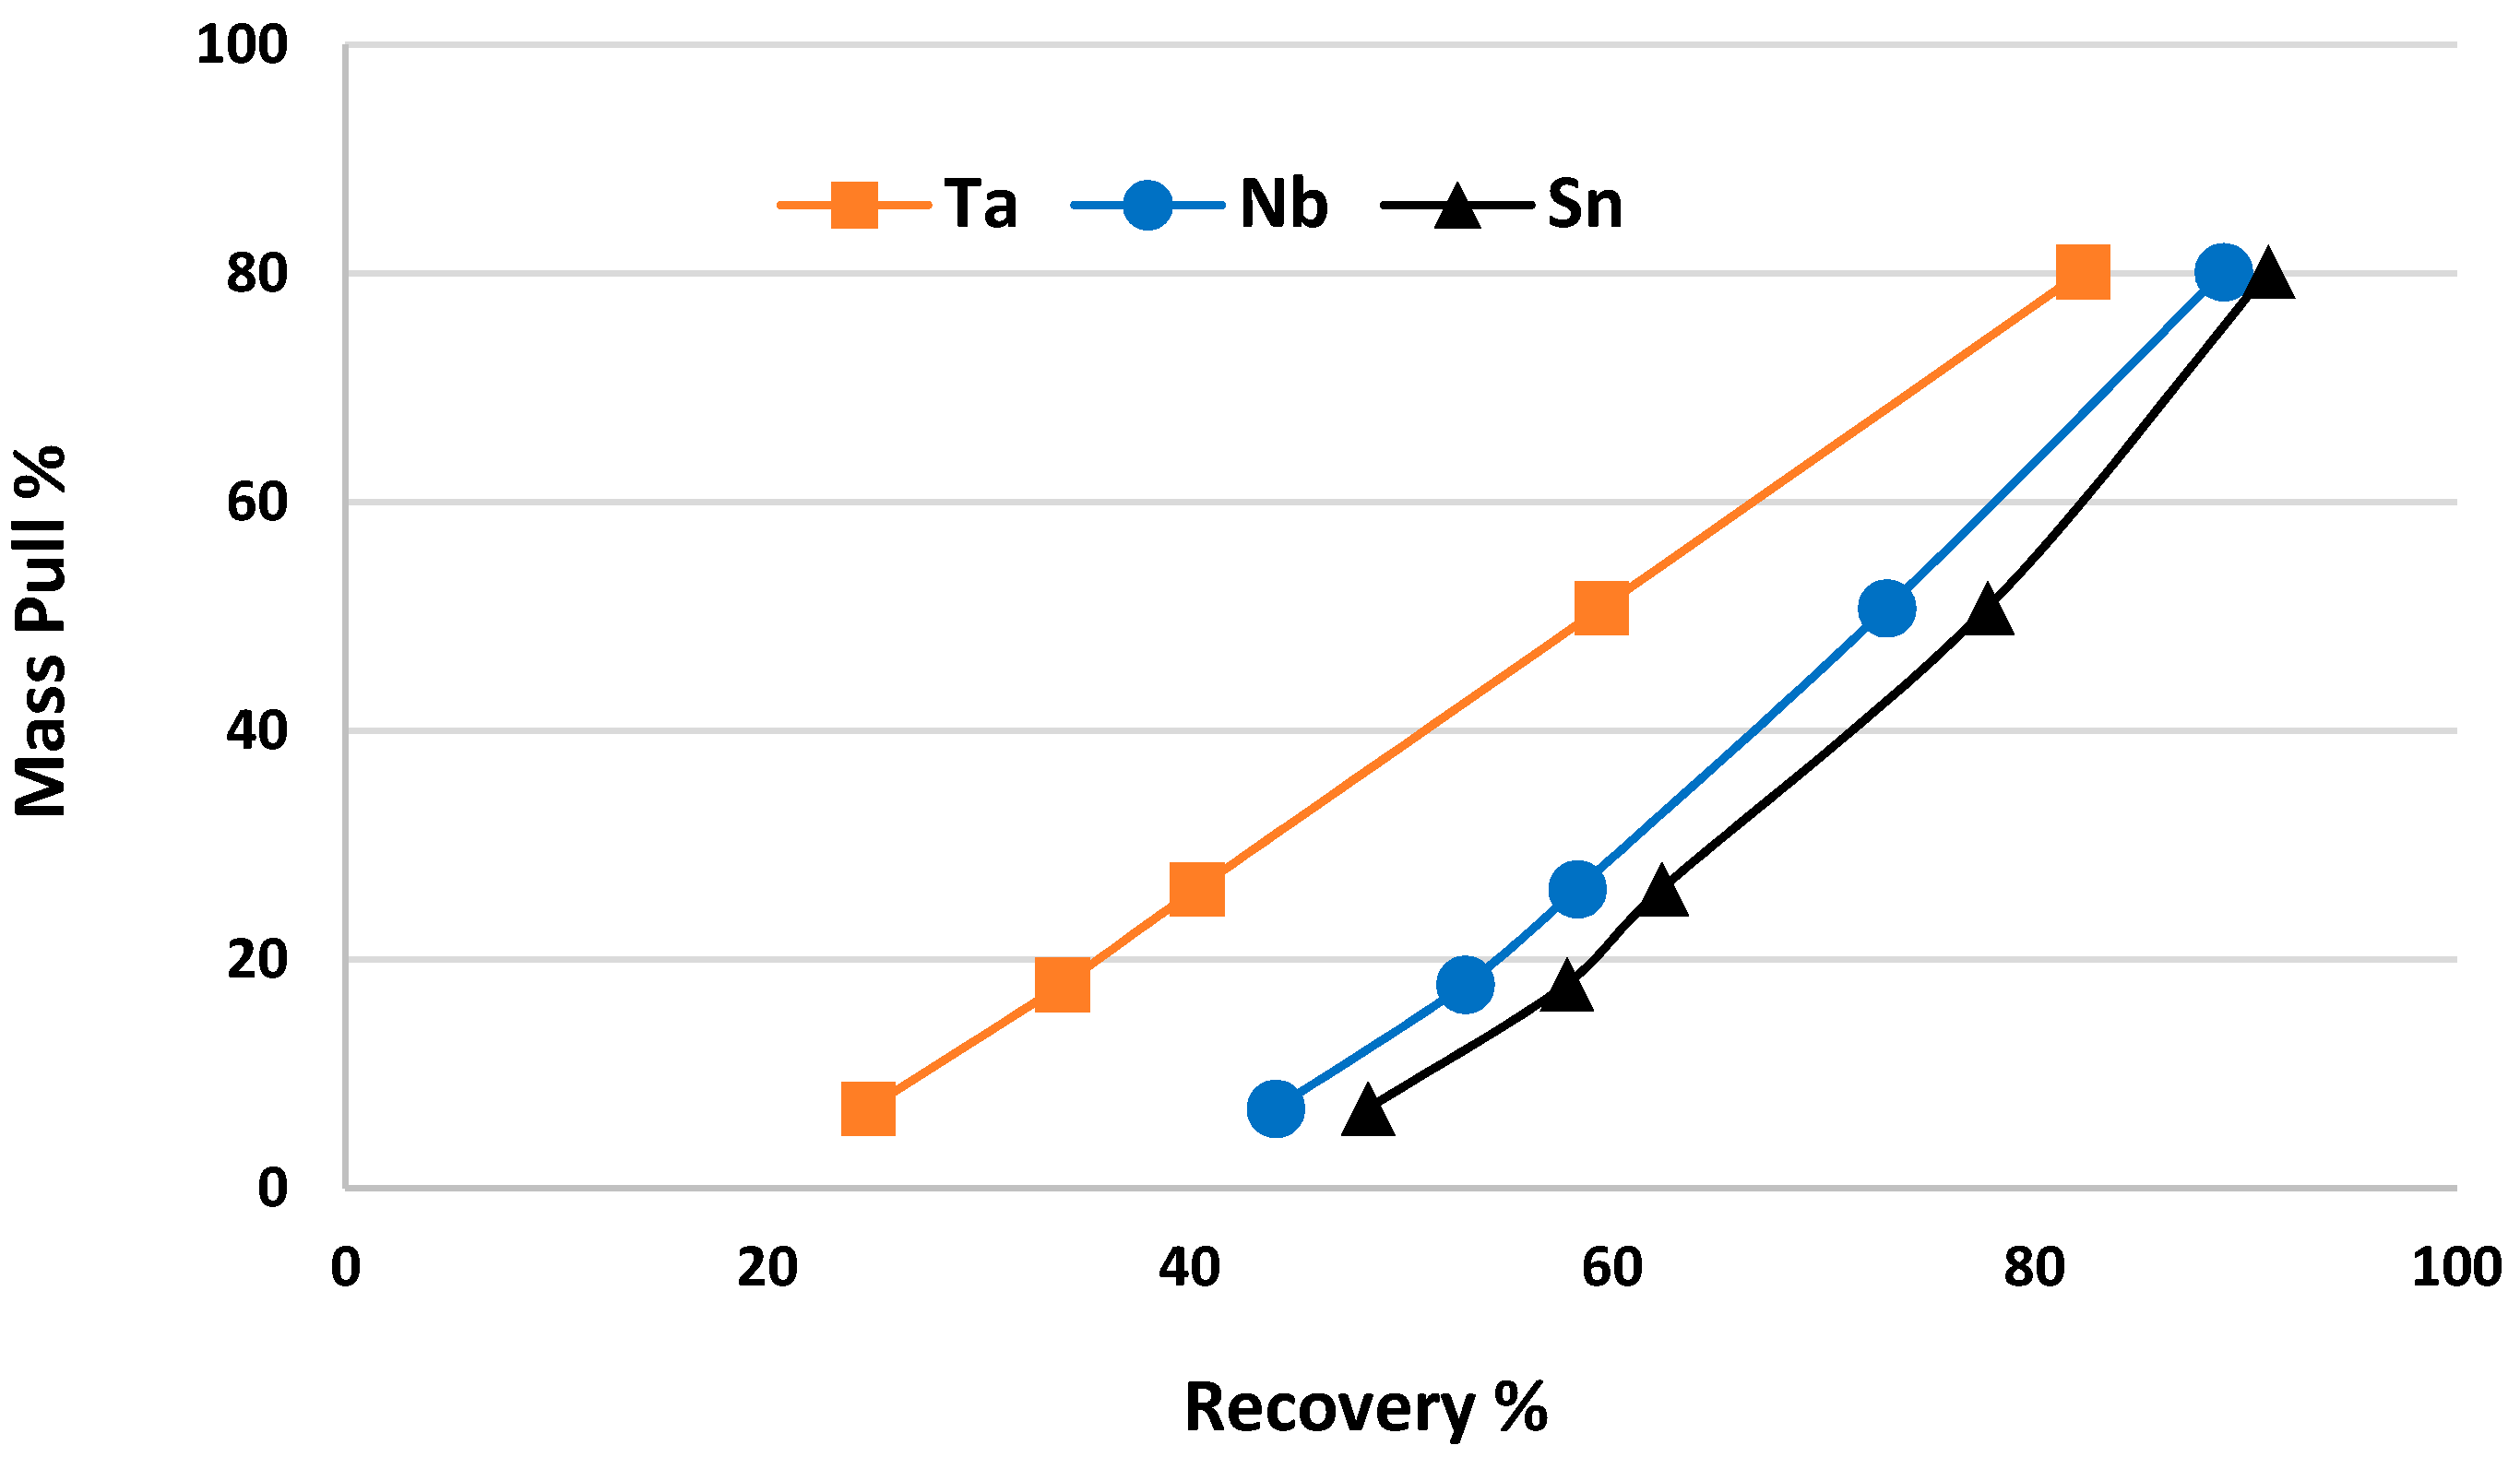
Figure 20.
Mass pull (%) and recovery (%) for Wilfley shaking table cleaner test on Penouta sample, measured using PXRF.
Figure 20.
Mass pull (%) and recovery (%) for Wilfley shaking table cleaner test on Penouta sample, measured using PXRF.
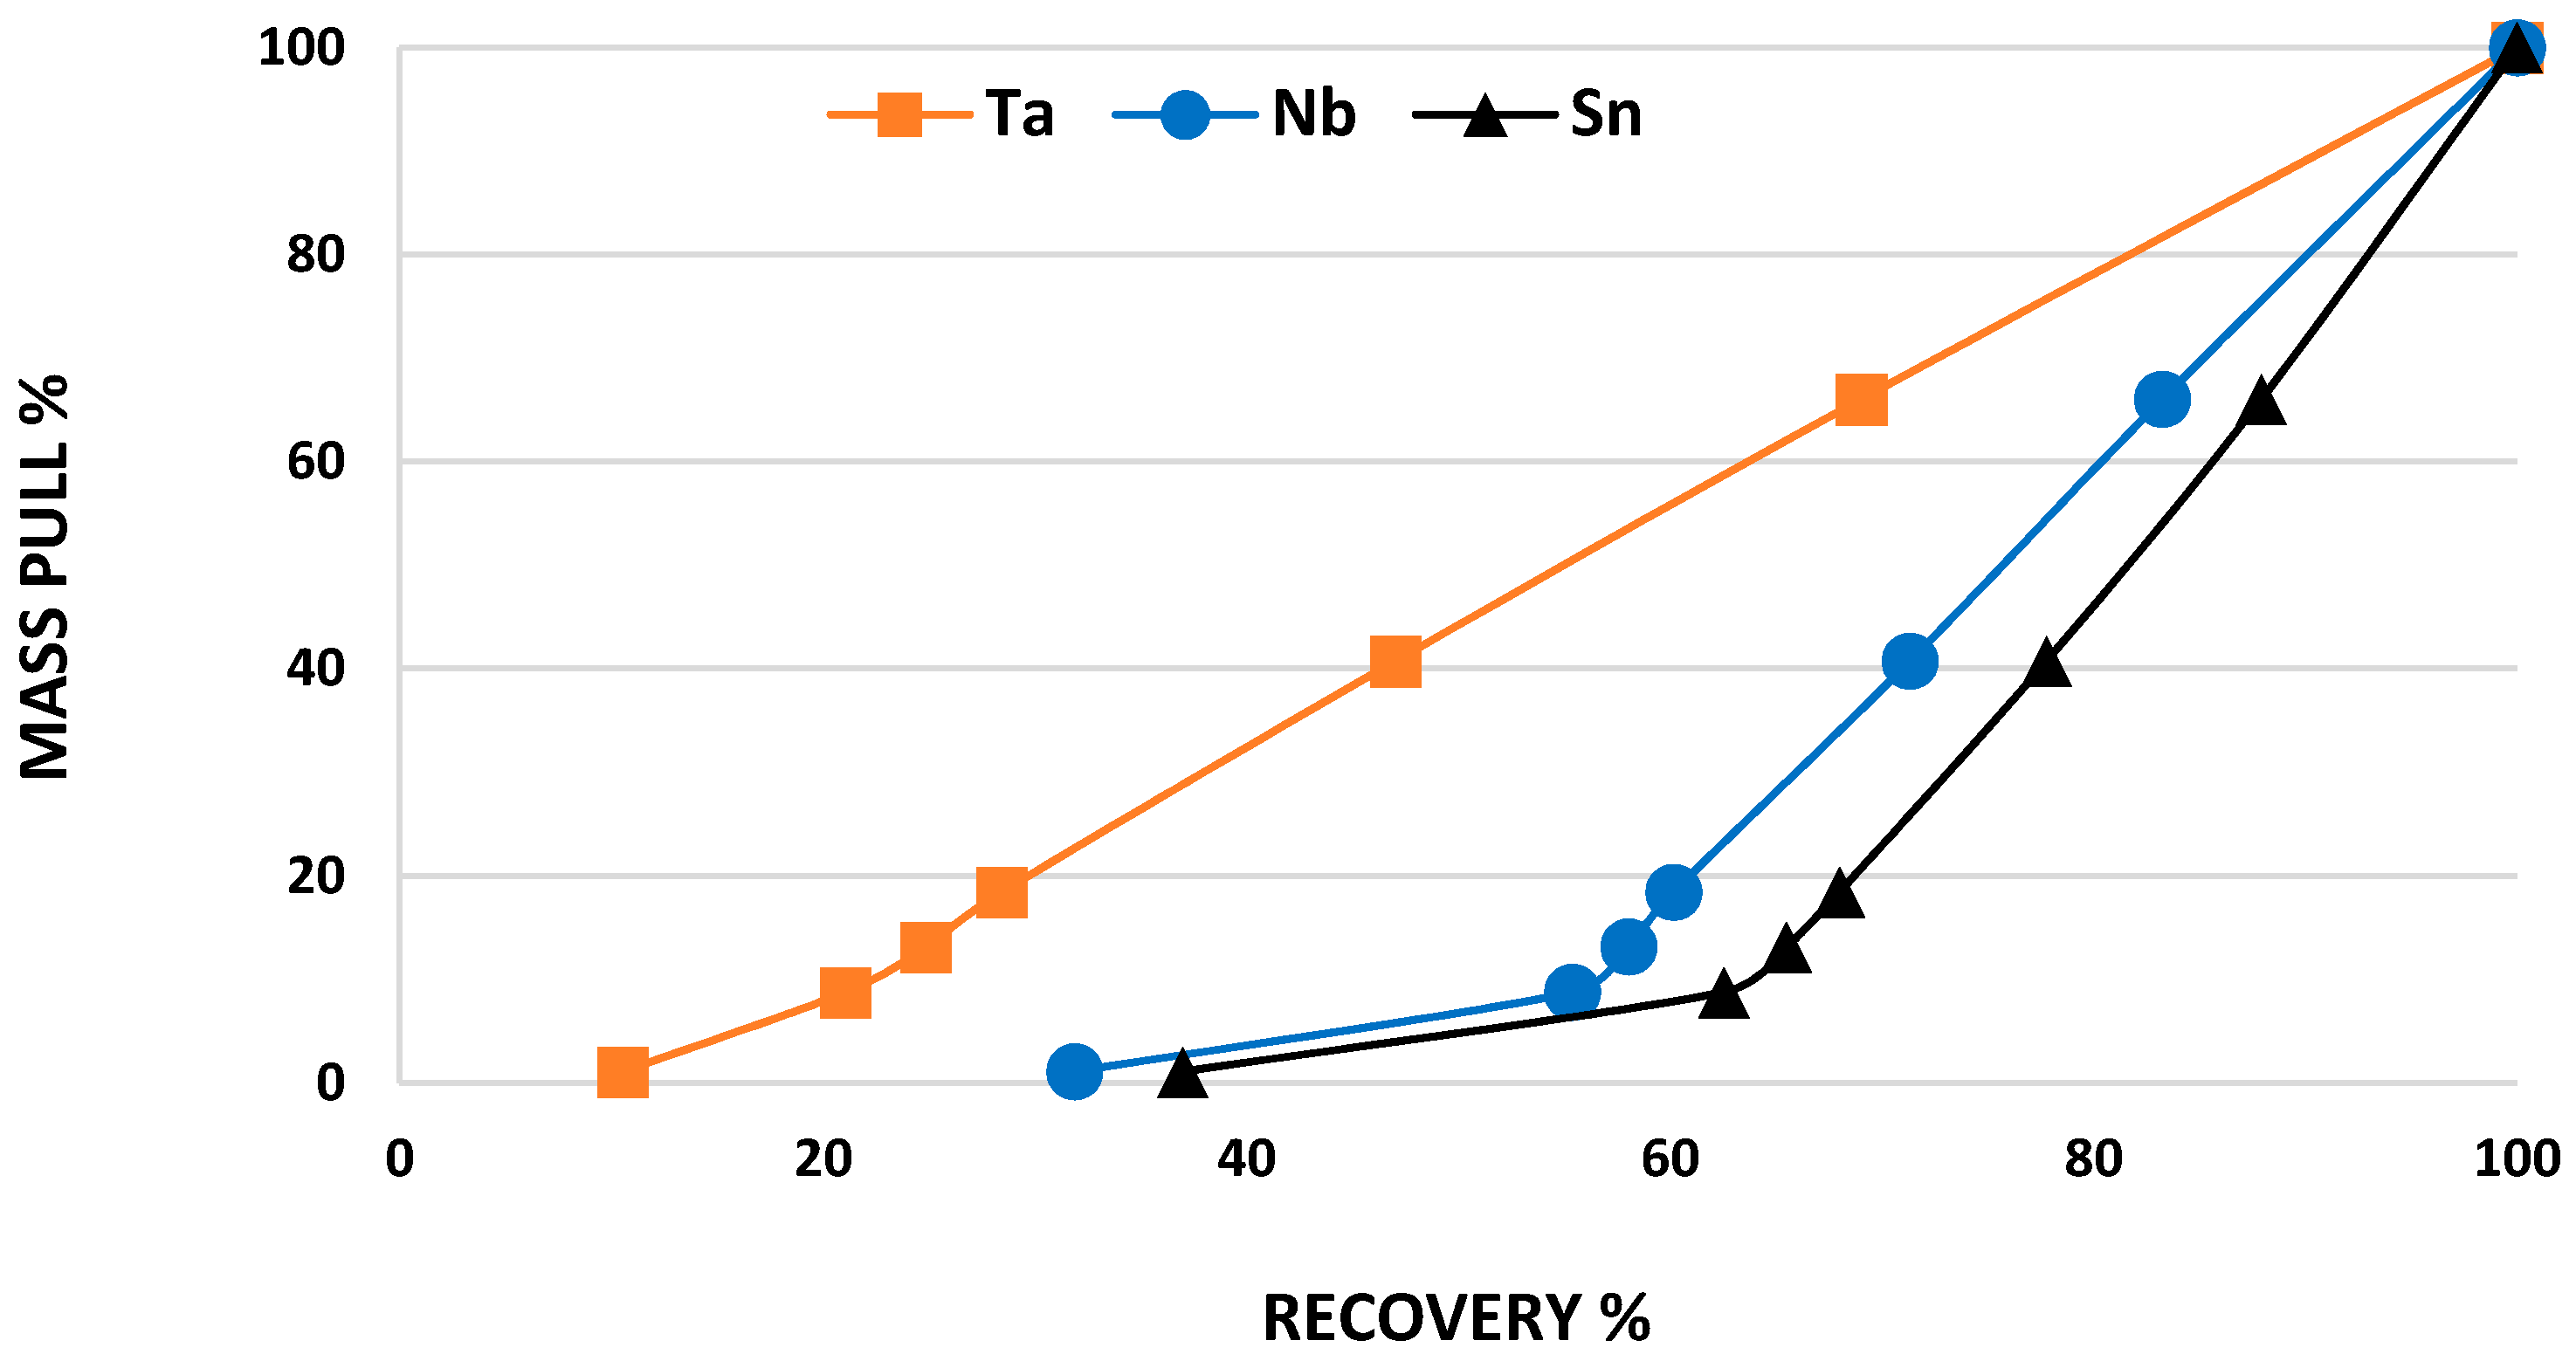
Figure 21.
Columbite and tantalite theoretical grade recovery curves for the first two concentrate products of Wilfley separation.
Figure 21.
Columbite and tantalite theoretical grade recovery curves for the first two concentrate products of Wilfley separation.
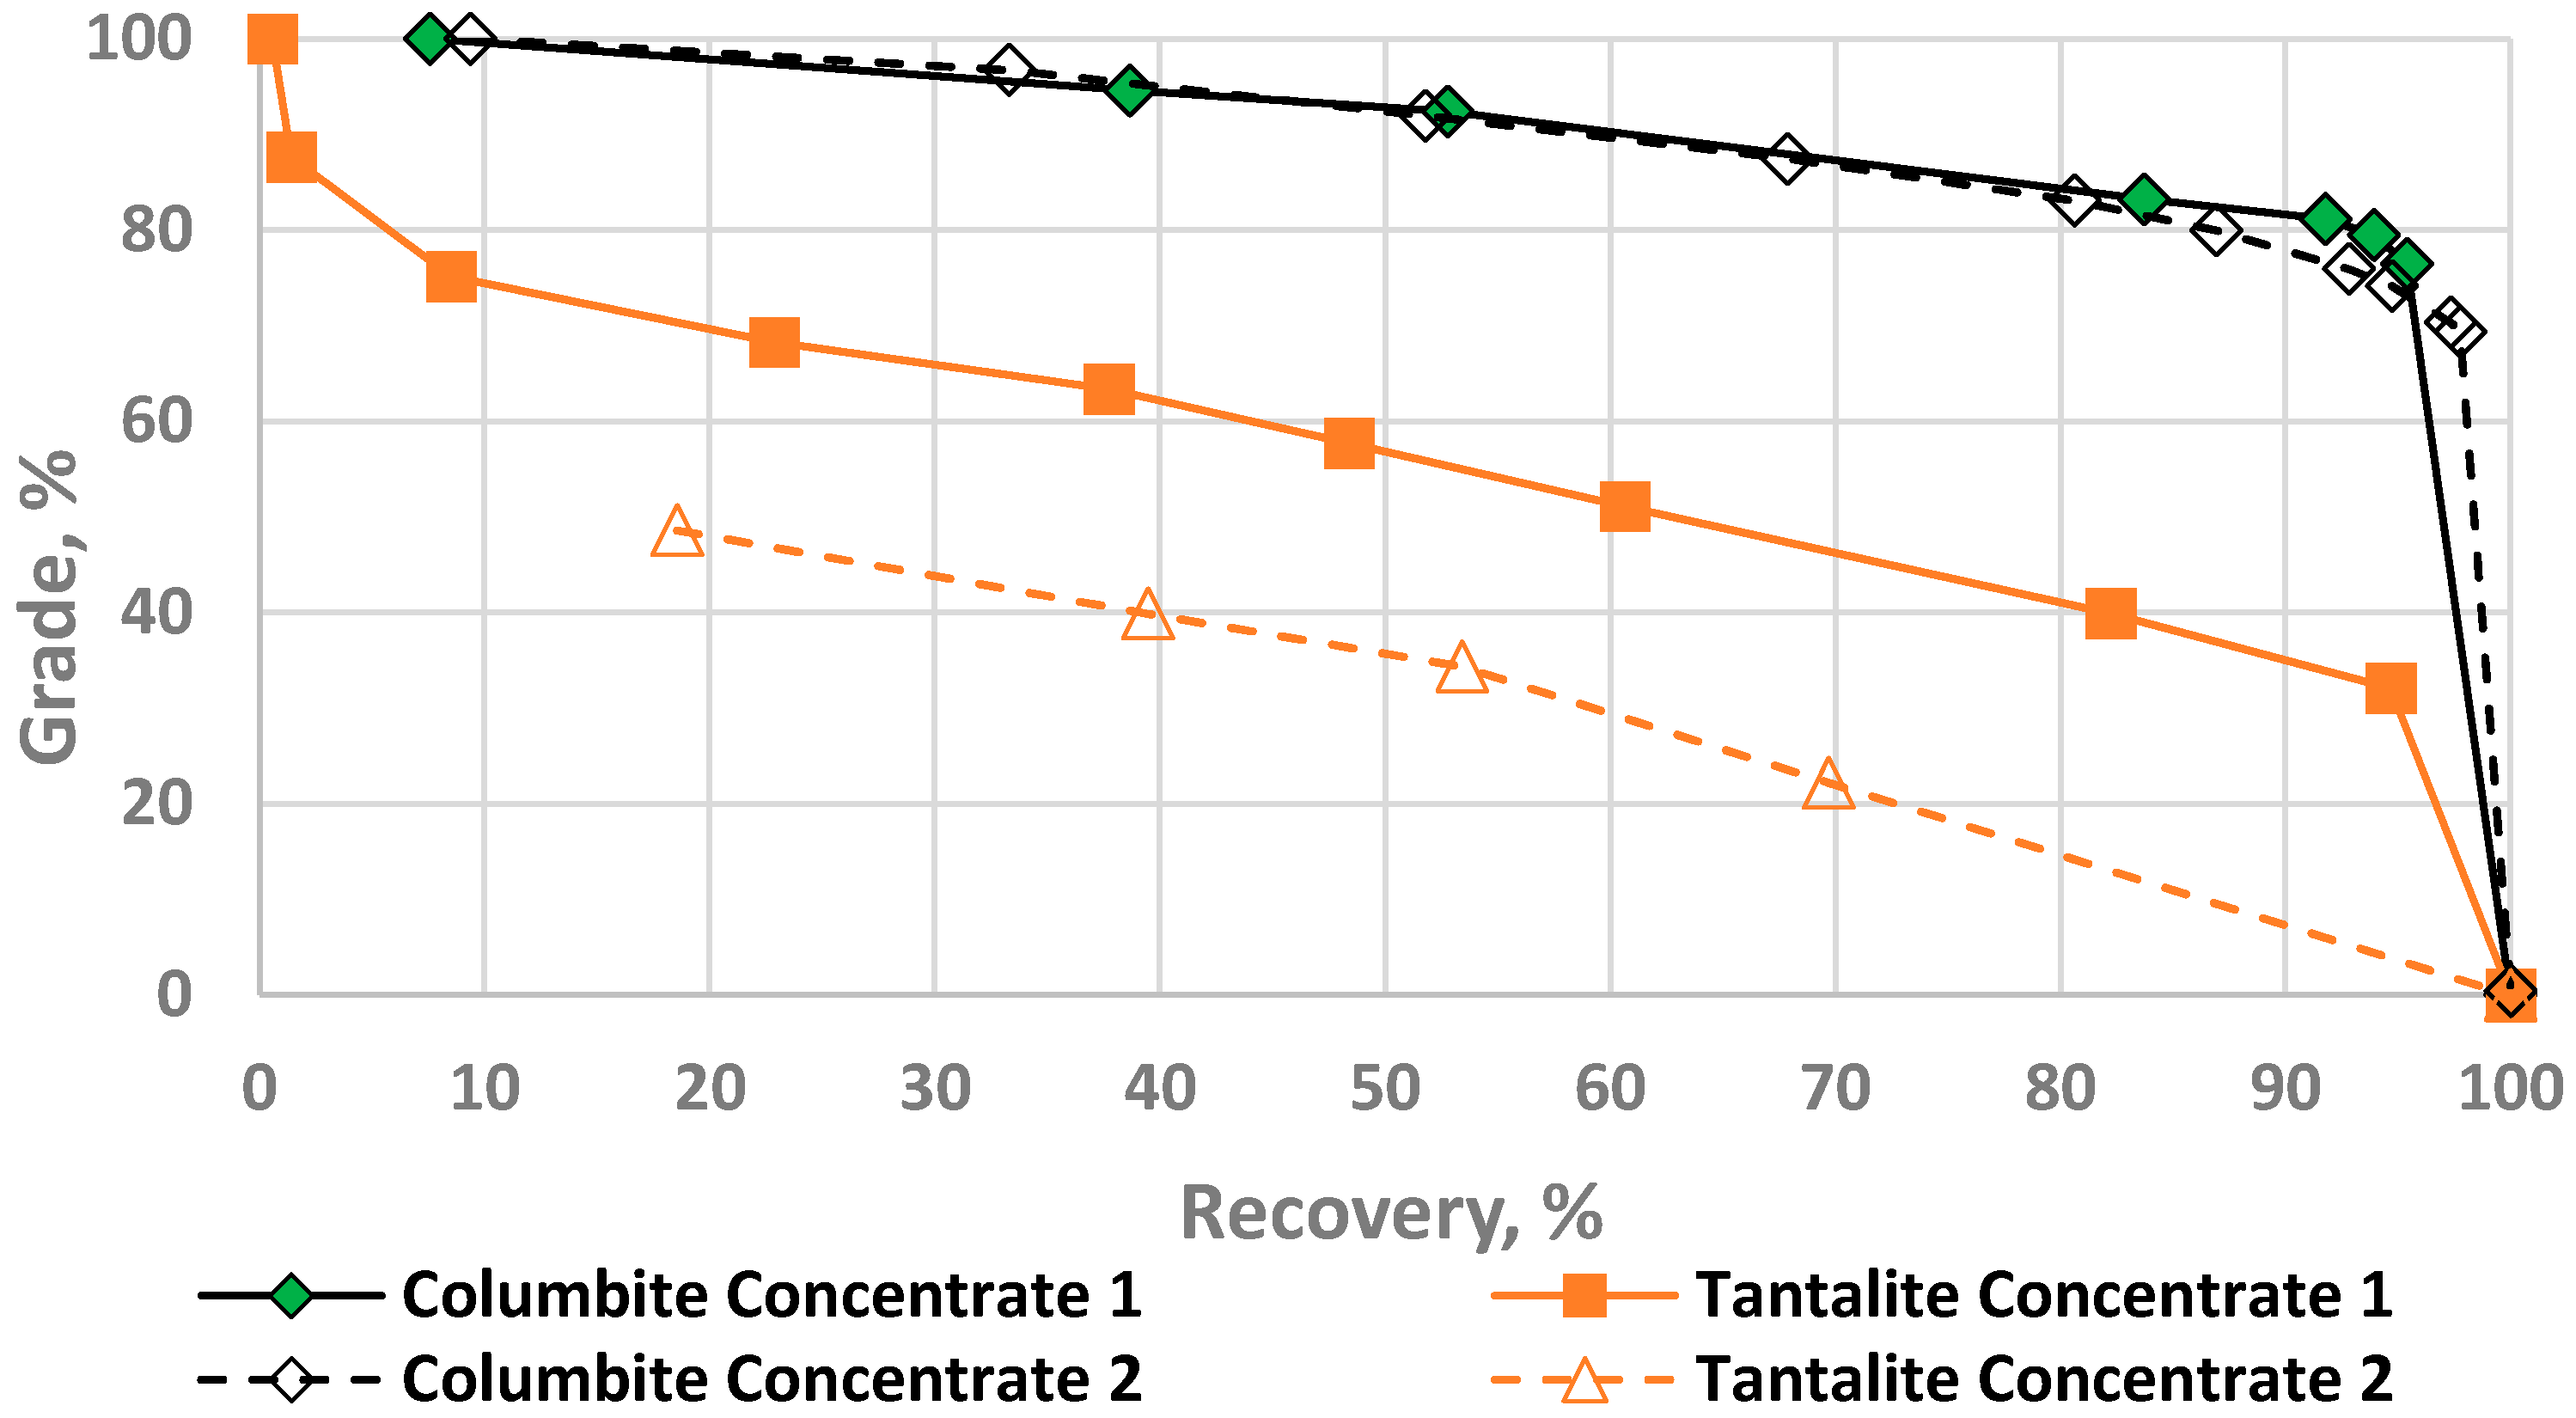
Figure 22.
Ta–Nb vs. Size, Ta–Nb combined and all other minerals invisible for ease of viewing (top); and Ta–Nb combined and all other minerals included (bottom).
Figure 22.
Ta–Nb vs. Size, Ta–Nb combined and all other minerals invisible for ease of viewing (top); and Ta–Nb combined and all other minerals included (bottom).

Table 1.
Size fractions acquired through sieving of a representative sample from Penouta.
| Sieve Size Fraction | Mass (g) | Mass (%) | Separation Method |
|---|---|---|---|
| +2800 μm | 4.0 | 0.76 | N/A |
| (−2800/+1400) μm | 66.1 | 12.51 | HLS |
| (−1400/+1000) μm | 75.8 | 14.35 | |
| (−1000/+710) μm | 61.8 | 11.70 | |
| (−710/+500) μm | 65.3 | 12.36 | |
| (−500/+355) μm | 62.6 | 11.85 | |
| (−355/+250) μm | 57.6 | 10.90 | |
| (−250/+180) μm | 46.0 | 8.71 | |
| (−180/+125) μm | 39.4 | 7.46 | Mozley Table |
| −125 μm | 49.7 | 9.41 |
Table 2.
Tailings collection times for Knelson concentrator trial, based on movement of feed through the concentrator.
Table 2.
Tailings collection times for Knelson concentrator trial, based on movement of feed through the concentrator.
| Tailing Product | Time (min) | Feed (Kg) |
|---|---|---|
| 1 | 0–2 | 1 |
| 2 | 2–6 | 2 |
| 3 | 6–10 | 2 |
| 4 | 10–14 | 2 |
| 5 | 14–20 | 3 |
Table 3.
Products produced from heavy liquid separation using SPT with a specific gravity (SG) = 2.86. Sink and float products are reported as weight per cent of that size fraction and weight per cent of the whole sample.
Table 3.
Products produced from heavy liquid separation using SPT with a specific gravity (SG) = 2.86. Sink and float products are reported as weight per cent of that size fraction and weight per cent of the whole sample.
| Size Fraction (μm) | Original Sample Size (g) | Lost | Sink Product | Float Product | |||||||
|---|---|---|---|---|---|---|---|---|---|---|---|
| (g) | (wt %) | (g) | (wt % Fraction) | (wt % Total) | (g) | (wt % Fraction) | (wt % Total) | (g) | (wt % Fraction) | (wt % Total) | |
| +2800 | 4 | 0.76 | - | - | - | - | - | - | - | - | - |
| (−2800/+1400) | 66.1 | 12.51 | 0.75 | 1.13 | 0.14 | 0.25 | 0.38 | 0.05 | 65.10 | 98.49 | 12.32 |
| (−1400/+1000) | 75.8 | 14.35 | 0.80 | 1.06 | 0.15 | 0.20 | 0.26 | 0.04 | 74.80 | 98.68 | 14.16 |
| (−1000/+710) | 61.8 | 11.70 | 0.68 | 1.10 | 0.13 | 0.19 | 0.31 | 0.04 | 60.93 | 98.59 | 11.53 |
| (−710/+500) | 65.3 | 12.36 | 0.79 | 1.21 | 0.15 | 0.27 | 0.41 | 0.05 | 64.24 | 98.38 | 12.16 |
| (−500/+355) | 62.6 | 11.85 | 1.20 | 1.92 | 0.23 | 1.50 | 2.40 | 0.28 | 59.90 | 95.69 | 11.34 |
| (−355/+250) | 57.6 | 10.90 | 1.40 | 2.43 | 0.27 | 1.10 | 1.91 | 0.21 | 55.10 | 95.66 | 10.43 |
| (−250/+180) | 46 | 8.71 | 1.40 | 3.04 | 0.27 | 0.50 | 1.09 | 0.09 | 44.10 | 95.87 | 8.35 |
| (−180/+125) | 39.4 | 7.46 | Too fine for HLS—analysed with Mozley Table | ||||||||
| −125 | 49.7 | 9.41 | |||||||||
| Total | 528.3 | 100.00 | - | 1.33 | - | 0.76 | - | 80.29 | |||
Table 4.
Cassiterite liberation. 80% liberation is required for mineral processing.
| Cassiterite Liberation | ||||||||||
|---|---|---|---|---|---|---|---|---|---|---|
| Sample | ≤10% | ≤20% | ≤30% | ≤40% | ≤50% | ≤60% | ≤70% | ≤80% | ≤90% | ≤100% |
| (−2800/+500) μm | 5.77 | 6.29 | 1.43 | 7.26 | 8.98 | 16.43 | 8.11 | 6.70 | 5.92 | 33.11 |
| (−500/+180) μm | 12.69 | 8.69 | 13.83 | 14.77 | 9.23 | 0.00 | 0.00 | 0.00 | 13.20 | 27.58 |
Table 5.
Cassiterite liberation. 80% liberation is required for mineral processing.
| Cassiterite Liberation | ||||||||||
|---|---|---|---|---|---|---|---|---|---|---|
| Sample | ≤10% | ≤20% | ≤30% | ≤40% | ≤50% | ≤60% | ≤70% | ≤80% | ≤90% | ≤100% |
| FC1 (Fine Concentrations) | 0.86 | 0.00 | 0.00 | 0.20 | 7.17 | 3.67 | 1.28 | 3.00 | 5.66 | 78.16 |
| RT1 (Rough Tailings) | 1.57 | 0.00 | 0.00 | 0.00 | 77.49 | 0.00 | 0.00 | 0.00 | 0.00 | 20.94 |
| FT1 (Fine Tails) | 0.27 | 0.00 | 0.00 | 0.00 | 0.00 | 0.32 | 0.00 | 0.00 | 0.00 | 99.41 |
Table 6.
Summary table of EPMA results for point analysis (wt %).
| Mineral | Na2O | F | Ta2O5 | Nb2O5 | MgO | SnO2 | MnO | CaO | FeO | TiO2 | Totals | No. of Samples | |
|---|---|---|---|---|---|---|---|---|---|---|---|---|---|
| Mangano-columbite | Mean | b.d. * | b.d. | 20.3 | 59.9 | 0.1 | 0.1 | 15.0 | b.d. | 3.8 | 0.1 | 99.1 | 13 |
| Std. Dev | - | - | 5.6 | 5.3 | 0.0 | 0.0 | 1.0 | - | 1.1 | 0.0 | 0.5 | ||
| Mangano-tantalite | Mean | b.d. | b.d. | 50.2 | 32.1 | b.d. | 0.3 | 13.4 | b.d. | 3.0 | 0.1 | 99.0 | 4 |
| Std. Dev | - | - | 8.9 | 8.7 | - | 0.1 | 1.0 | - | 1.3 | 0.0 | 0.4 | ||
| Microlite | Mean | 6.0 | 4.0 | 72.6 | 4.4 | b.d. | 1.5 | 0.1 | 10.7 | b.d. | 0.2 | 99.2 | 3 |
| Std. Dev | 0.1 | 0.2 | 0.2 | 0.1 | - | 0.0 | 0.0 | 0.1 | - | 0.0 | 0.3 | ||
| Cassiterite | Mean | 0.1 | 0.2 | 2.2 | 0.6 | 0.1 | 98.3 | 0.1 | b.d. | 0.4 | 0.1 | 100.8 | 39 |
| Std. Dev | 0.0 | 0.0 | 1.8 | 0.3 | 0.0 | 2.7 | 0.1 | - | 0.3 | 0.1 | 0.6 | ||
* (b.d. = below detection limit).
Table 7.
Comparison of results of centrifugal separation measured using SQ-XRF.
| Product | Recovery | Recovery [18] |
|---|---|---|
| Ta | 63.6% | 61.9% |
| Sn | 40.0% | 46.4% |
© 2017 by the authors. Licensee MDPI, Basel, Switzerland. This article is an open access article distributed under the terms and conditions of the Creative Commons Attribution (CC BY) license (http://creativecommons.org/licenses/by/4.0/).
Share and Cite
MDPI and ACS Style
Ghorbani, Y.; Fitzpatrick, R.; Kinchington, M.; Rollinson, G.; Hegarty, P. A Process Mineralogy Approach to Gravity Concentration of Tantalum Bearing Minerals. Minerals 2017, 7, 194. https://doi.org/10.3390/min7100194
AMA Style
Ghorbani Y, Fitzpatrick R, Kinchington M, Rollinson G, Hegarty P. A Process Mineralogy Approach to Gravity Concentration of Tantalum Bearing Minerals. Minerals. 2017; 7(10):194. https://doi.org/10.3390/min7100194
Chicago/Turabian StyleGhorbani, Yousef, Rob Fitzpatrick, Melanie Kinchington, Gavyn Rollinson, and Patrick Hegarty. 2017. "A Process Mineralogy Approach to Gravity Concentration of Tantalum Bearing Minerals" Minerals 7, no. 10: 194. https://doi.org/10.3390/min7100194
Note that from the first issue of 2016, this journal uses article numbers instead of page numbers. See further details here.